

Abstract
Objective
NAD+ is a co-factor and substrate for enzymes maintaining energy homeostasis. Nicotinamide phosphoribosyltransferase (NAMPT) controls NAD+ synthesis, and in skeletal muscle, NAD+ is essential for muscle integrity. However, the underlying molecular mechanisms by which NAD+ synthesis affects muscle health remain poorly understood. Thus, the objective of the current study was to delineate the role of NAMPT-mediated NAD+ biosynthesis in skeletal muscle development and function.
Methods
To determine the role of Nampt in muscle development and function, we generated skeletal muscle-specific Nampt KO (SMNKO) mice. We performed a comprehensive phenotypic characterization of the SMNKO mice, including metabolic measurements, histological examinations, and RNA sequencing analyses of skeletal muscle from SMNKO mice and WT littermates.
Results
SMNKO mice were smaller, with phenotypic changes in skeletal muscle, including reduced fiber area and increased number of centralized nuclei. The majority of SMNKO mice died prematurely. Transcriptomic analysis identified that the gene encoding the mitochondrial permeability transition pore (mPTP) regulator Cyclophilin D (Ppif) was upregulated in skeletal muscle of SMNKO mice from 2 weeks of age, with associated increased sensitivity of mitochondria to the Ca2+-stimulated mPTP opening. Treatment of SMNKO mice with the Cyclophilin D inhibitor, Cyclosporine A, increased membrane integrity, decreased the number of centralized nuclei, and increased survival.
Conclusions
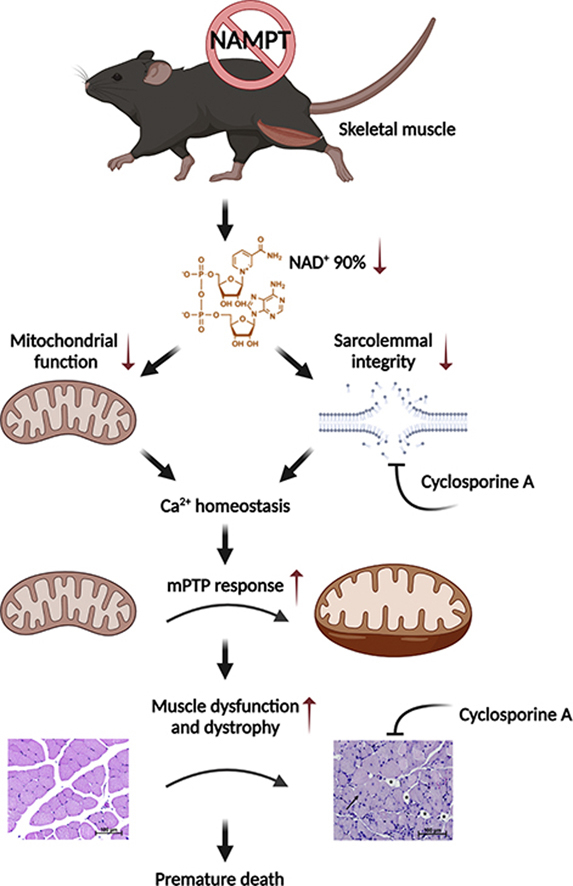
Our study demonstrates that NAMPT is crucial for maintaining cellular Ca2+ homeostasis and skeletal muscle development, which is vital for juvenile survival.
Keywords: Cyclophilin D, Mitochondrial permeability transition pore (mPTP), Myopathy, NAD+, Nicotinamide riboside, Sarcopenia
Highlights
-
•
NAD+ salvage capacity is important for skeletal muscle development and survival.
-
•
Skeletal muscle-specific Nampt knockout mice exhibit a dystrophy-like phenotype.
-
•
Nampt deletion alters Ca2+ homeostasis and impairs mitochondrial function.
-
•
Low NAD+ levels signals mitochondrial permeability transition pore opening.
-
•
Cyclosporin A treatment improves sarcolemma integrity and increases survival rate.
Graphical abstract
1. Introduction
Nicotinamide adenine dinucleotide (NAD+) is an essential cofactor found in all living cells. NAD+ is continuously reduced and oxidized in metabolic processes, such as glycolysis, oxidative phosphorylation, and redox signaling. However, it is also a crucial co-substrate for several NAD+ degrading enzymes, such as sirtuins [1], Poly (ADP-ribose) Polymerases (PARPs) [2,3], and CD38, with ADP-ribosyl cyclase/NAD+-ase activity [4]. Thus, NAD+ plays important roles in metabolism, cell survival, DNA repair [5], Ca2+-signaling [6], and maintaining circadian rhythms [7]. The majority of NAD+ is recycled from the NAD+ precursors nicotinamide (NAM) and nicotinamide riboside (NR) [8,9]. NAD+ regeneration from NAM is considered to be the main route for NAD+ salvage [10,11]. This process is mediated by the rate-limiting enzyme nicotinamide phosphoribosyltransferase (NAMPT) [12,13] and nicotinamide mononucleotide (NMN) adenylyltransferase (NMNAT) 1–3 [14]. In skeletal muscle, this pathway is essential for maintaining NAD+ levels [11,15,16].
Maintaining appropriate NAD+ levels is vital for skeletal muscle function in the context of specific myopathies. One of the most common forms of genetic muscular disorders is Duchenne muscular dystrophy (DMD) [17]. DMD patients have an increased expression of PARPs and a decreased gene expression of NAMPT and other NAD+ salvage enzymes [18]. Furthermore, levels of NAD+ and NAMPT are reduced in the mdx mouse model of DMD, and supplementation with the NAD+ precursor NR partly rescues the dystrophic phenotype in this model [18]. NR treatment also delays early- and late-stage disease progression of mice with mitochondrial myopathy [19]. In addition, ablating NAMPT-mediated NAD+ salvage reduces NAD+ levels by 85% and leads to progressive muscle degeneration in the adult mouse [15]. While NAD+ levels are coupled to muscle pathologies, the mechanism(s) by which NAD+ controls skeletal muscle function remains largely unknown.
A common denominator for several myopathies is prolonged opening of the mitochondrial permeability transition pore (mPTP) [20]. mPTP is a high-conductance voltage- and Ca2+-sensitive channel in the inner mitochondrial membrane. Full opening of the mPTP results in high ion conductance, rapid mitochondrial swelling, mitochondrial collapse, and necrotic cell death. Conversely, transient mPTP opening efficiently buffers Ca2+ and reactive oxygen species from the mitochondria [21]. Exogenous addition of NAD(H) inhibits mPTP opening in isolated mitochondria [22], and treatment with the NAD+ precursor NMN abolishes the increased Ca2+-induced mPTP opening reported in hearts with transverse aortic constriction [23]. Furthermore, knockout of the NAD+-dependent deacetylase, SIRT3, accelerates age-dependent increases in mPTP sensitivity in the heart [24]. Thus, NAMPT may play a role in maintaining cellular Ca2+ homeostasis by maintaining NAD+ levels.
To investigate the importance of NAD+ salvage capacity for muscle development and function, we generated skeletal muscle-specific Nampt knockout (SMNKO) mice. In the current study, we demonstrate that SMNKO mice have significant reductions (i.e., 90%) in NAD+ levels in skeletal muscle, with a profound degeneration and loss of muscle mass ultimately resulting in premature mortality. SMNKO mice have higher levels of the mPTP activator Cyclophilin D (CYPD) and increased Ca2+-induced mitochondrial swelling, both indicative of amplified mPTP sensitivity. Treatment of SMNKO mice with the CYPD inhibitor, Cyclosporine A, increases survival, suggesting that an increased mPTP opening is an essential driver for the dystrophy-like SMNKO phenotype. Our findings suggest that NAD+ salvage capacity plays an essential role in muscular health by maintaining Ca2+ homeostasis and mitochondrial integrity.
2. Methods
2.1. Resource availability
2.1.1. Corresponding author
For further information and requests for resources and reagents, please contact the corresponding author, Jonas T. Treebak (jttreebak@sund.ku.dk).
2.1.2. Materials availability
This study did not generate new unique reagents.
2.1.3. Data and code availability
The RNAseq dataset generated during this study is publicly available on the GEO database with the accession number: GSE147453.
2.2. Experimental model and subject details
2.2.1. Generation and housing of knockout mice
Animal experiments were conducted according to the European directive 2010/63/EU of the European Parliament and the Council of the protection of animals used for scientific purposes and approved by the Danish Animal Experiments Inspectorate (License: #2012-15-2934-307, #2015−15−0201−00796, and #2018-15-0202-00161). We generated mice carrying loxP sites surrounding exon 3 of the Nampt gene (NamptTM1Jtree) [16]. Skeletal muscle-specific deletion of Nampt was generated by crossing homozygotes floxed Nampt mice and mice carrying the cre-recombinase driven by the human α-skeletal actin (HSA) promoter at one allele [25]. Animals used for experimental work were bred by crossing a heterozygote Nampt male mice (HSA-Cre+/- and Namptfl/fl) with floxed Namptfl/fl female mice. All mice were bred on the C57BL/6JBomTac background (Taconic, Denmark) for 2–9 generations before usage in experiments. Mice were kept in a temperature-controlled (22 ± 1 °C) room with a 12-h light/dark cycle in an enriched environment. Mice were fed ad libitum with either a chow diet (#1310, Altromin, Germany) or an NR-enriched diet (Customized, Research diets, New Brunswick [Table S2]), as indicated. Littermates lacking the HSA-Cre served as wildtype (WT) controls. Animals were inspected every day, and survival calculations were based on animals found dead in the cage and animals euthanized for ethical reasons, fulfilling one or more of the following criteria for ethical euthanasia: 1) a reduction (>10%) in body weight observed over 48 h, 2) no or poor locomotion by handling, or 3) tachypnea. 210 mg/L Cyclosporine A (Sandimmun Neoral, Orifarm) was added to the drinking water from birth to 12 weeks of age, as indicated, and refreshed every second to third day. The sex of the mice is a mix of females and males unless otherwise stated in the figure legends. The age of the animals is indicated in the figure legend.
2.2.2. Ex vivo muscle contractions
This experiment was performed as previously described [26]. Extensor digitorum longus (EDL) and soleus muscles were dissected from 6-week-old WT and KO mice after they were anesthetized by Avertin (2,2,2-Tribromoehtanol [Sigma–Aldrich #T48402] and 2-methyl-2-butanol 99% [Sigma–Aldrich #152463]) intraperitoneal injection. Muscles were incubated in a Krebs–Ringer buffer (117 mM NaCl, 4.7 mM KCl, 2.5 mM CaCl2, 1.2 mM KH2PO4, 1.2 mM MgSO4, 24.6 mM NaHCO3) supplemented with 0.1% bovine serum albumin, 8 mM mannitol, and 5 mM glucose and oxygenated (95% O2 and 5% CO2), and warmed to 30 °C in a myograph system (820MS DMT, Denmark). The optimal muscle length was determined at the start of each experiment by identifying the length at which maximal isometric twitch response occurred (pulse voltage 12 V, pulse width 0.5 ms). Contractile function from single twitches (the average from three twitches separated by > 30 s, 12 V, 0.5 ms pulse width) was assessed by measuring peak isometric twitch force, time to peak twitch force, half-relaxation time, rate of force production, and rate of force decline. The area under the curve from tetanic contractions (pulse voltage 12 V, width 0.2 ms, interval 6.50 ms, frequency 150 Hz, 75 pulse counts in each train, 500 ms total train time, 5,000 ms pause between trains for a total of 55 trains for soleus and 23 for EDL) was determined by summating the products of peak force and contraction duration from each tetanic contraction. All absolute force measurements were normalized using a muscle cross-sectional area (CSA) to find specific force (muscle mass divided by the product of the muscle density coefficient (1.06 g/cm3), optimal muscle length, and the muscle-specific fiber length coefficient (0.44 for EDL and 0.71 for soleus) [15].
2.2.3. Cell culture
WT and Nampt knockdown C2C12 myoblasts were maintained under standard conditions [16].
2.3. Method details
2.3.1. Body composition measurement
Mice between 4 and 12 weeks of age were scanned by quantitative magnetic resonance (MR) using EchoMRI (Echo Medical Systems) every second week to determine body composition.
2.3.2. Indirect calorimetry
Male WT and SMNKO mice 8–14 weeks of age were allowed to acclimatize in individual metabolic cages with or without a running wheel for 24 h before the first measurement. Subsequently, oxygen consumption, carbon dioxide production, food intake, and wheel-running activity were measured with a LabMaster system (TSE Systems), and data were collected in the following 2–4 days.
2.3.3. NAD+, NADP+, NADH, and NADPH quantification
NAD+, NADP+, NADH, and NADPH levels in the skeletal muscle of WT and SMNKO mice were measured using an enzymatic cycling assay [27]. In short, 5–20 mg of tissue was homogenized in 400 μL of 0.6 M perchloric acid (for NAD(P)) or 0.1 M NaOH (for NAD(P)H). The NAD(P)H extract was incubated at 70 °C for 10 min, and both fractions were centrifuged for 5 min at 13.000 g. The supernatants were transferred to new tubes and diluted in 100 mM Na2HPO4 (pH 8, for NAD(P)) or 10 mM Tris–HCl (pH 6, for NAD(P)H). 100 μL of the diluted extracts were pipetted into a white 96-well plate, after which 100 μL reaction mix was added. For NAD/NADH, the reaction mix contained 100 mM Na2HPO4, 10 μM flavinmononucleotide, 2% ethanol, 90 U/mL alcohol dehydrogenase, 130 mU/mL diaphorase, 2.5 μg/mL resazurin, and 10 mM nicotinamide. For NADP+/NADPH, the reaction mix contained 100 mM Na2HPO4, 10 μM flavinmononucleotide, 1.25 mM MgCl2, 35 mM glucose-6 phosphate, 6 U/mL glucose-6-phosphate dehydrogenase, 130 mU/mL diaphorase, 2.5 μg/mL resazurin, and 10 mM nicotinamide. Fluorescence increase (Ex 540 nm/Em 580) was measured over 30 min, and the metabolite content was calculated from a standard curve and normalized to the weight of the frozen tissue. The NAD+ measurements were performed on the time-course cohort in Figure S1I and the NR rescue experiment in Figure 7A using an NAD+ assay kit (#E2ND-100, BioAssay Systems) following the manufacturer's instructions. The NAD+ levels were normalized to the weight of the frozen tissue.
Figure 7.

Partial rescue of the SMNKO mice with a nicotinamide riboside (NR) enriched diet.A) NAD+ levels in quadriceps muscle of WT and SMNKO mice fed a chow diet or a purified diet supplemented with NR (200 mg/kg body weight), (n = 2–6). Chow data are the same as in Figure S1I. Due to low and missing values for the SMNKO mice, data from WT mice are analyzed separately by a 2-way ANOVA. B) ATP levels in tibialis anterior muscle of WT and SMNKO mice fed a chow diet or an NR enriched diet (n = 2–6). Chow data are the same as in Figure 3A. Analyzed by a 3-way ANOVA. C) Average fiber area in quadriceps muscle of WT and SMNKO mice fed a chow diet or an NR enriched diet (n = 2–6). Chow data are the same as in Figure 2A. Due to unequal variance over time, data at 6 weeks of age are analyzed by 2-way ANOVA. D) Number of central nuclei in quadriceps muscle of WT and SMNKO mice fed a chow diet or NR enriched diet (n = 2–6). Chow data are the same as in Figure 2E. Due to low and missing values for the WT mice, data on SMNKO mice are analyzed by 2-way ANOVA. E) Survival curve of WT and SMNKO mice fed a chow diet or an NR enriched diet (n = 17–18). Error bars represent SEM. ∗ Difference to mice on chow diet at the same age and genotype. $ Main effect of diet within the age group. # Main effect of genotype. ¤ Difference to mice at 4 weeks of age with the same genotype and diet. & Difference to mice at 6 weeks of age with the same genotype and diet.
2.3.4. Western blot analyses
Protein was extracted from mouse skeletal muscle tissue by steel bead homogenization (Tissue Lyser II, Qiagen) in an ice-cold lysis buffer (pH 7.4, 10% glycerol, 1% IGEPAL, 50 mM Hepes, 150 mM NaCl, 10 mM NaF, 1 mM EDTA, 1 mM EGTA, 20 mM sodium pyrophosphate, 2 mM sodium orthovanadate, 5 mM nicotinamide, 4 μM Thiamet G, and protease inhibitors [SigmaFast]). The following procedure was performed at 4 °C: homogenates were run end-over-end for 45 min, followed by centrifugation at 16,000 g for 10 min. The supernatant was stored in aliquots at 80 °C until further analysis. Protein concentration was measured by BCA (#23223 and #23224, Thermo Scientific). Western blot analyses were performed as described [28]. Protein abundance was detected by immunoblotting using the following antibodies: NAMPT (#A300–372A, Bethyl), HK2 (#2867, Cell Signaling), p-AMPK (Thr172, #2531, Cell Signaling), Complex I (NDUFB8, #459210, Invitrogen), Complex IV (MTCO1, #459600, Invitrogen), p-ULK1 (Ser555, #5869, Cell Signaling), p62 (#ab56416, Abcam), Beclin 1 (#3738 Cell Signaling), LC3 (#3868, Cell Signaling), CYPD (#110324, Abcam), BAX (#2772, Cell Signaling), p-CREB (Ser133, #9198, Cell Signaling), SERCA1 (#12293, Cell Signaling), and Poly (ADP-ribose) (#ALX-804-220, ENZO Lifescience).
2.3.5. Hematoxylin and eosin staining
Quadriceps muscles from 2- to 8-week-old WT and SMNKO mice were dissected and placed in 10% neutral buffered formalin (#HT501128, Sigma) for 24–36 h at room temperature. The muscles were transferred to ethanol and further prepared by embedding in paraffin, divided into sections, and stained using hematoxylin and eosin, as previously described [26].
2.3.6. Immunohistochemistry
Paraffin-embedded sections were placed in an oven at 60 °C for 30 min, allowed to cool down, and then submerged for 2 × 10 min in histo-clear to remove paraffin. Sections were then rehydrated in 2 × 3 min 99% ethanol, 2 × 2 min in 96% ethanol, 1 min in 70% ethanol, and 2 min in dH2O. Antigen retrieval was performed by boiling for 2 × 7 min in citrate buffer (pH 6). After cooling, sections were incubated for 20 min in PBS+0.2% Triton-100X, followed by 3 × 5 min wash in PBS. Blocking was performed for 1h in PBS, 10% goat serum, and mouse IgG blocking (2 drops per 2.5 mL, M.O.M. kit, #BMK-2202, Vector laboratories), followed by a 2 × 2 min wash in PBS. Sections were then incubated for 5 min in PBS + block dilutant (600ul per 7.5 mL, M.O.M. kit, Vector laboratories), excess liquid was tipped off, and the sections were incubated overnight at 4 °C in primary antibodies in block dilutant. Primary antibodies were anti-PAX7 (1:10, Developmental Studies Hybridoma Bank [DHSB]), MyoD1 (1:200, clone 5.8A, DAKO), Laminin (1:100; #Z0097, Dako), eMyHC (1:100; Clone F1.652, DHSB), F4/80 (1:400, #ab6640, Abcam), and CCL3 (1:500, #ab64693, Abcam). The following day, the sections were washed in 3 × 5 min PBS, followed by incubation in appropriate secondary antibodies. For the detection of mouse antibodies, we performed 15 min incubation with biotinylated anti-mouse IgG (10 μL/2.5 mL, M.O.M. kit, Vector laboratories) in PBS +1% BSA at room temperature. For detection of rat antibodies, we performed 1 h incubation with biotinylated anti-rat IgG (1:500, #A24553, Invitrogen) or anti-rat IgG Alexa fluor 647 (#A21247, Invitrogen) in PBS + 1% BSA at room temperature. Following washing 3 times for 5 min in PBS, we performed a 1h incubation of streptavidin-Alexa fluor 488 (1:250, #32354, Invitrogen) to detect biotinylated antibodies and additional secondary antibodies, goat anti-rabbit Alexa fluor 568 (1:500, #A11079, Invitrogen) in PBS + 1% BSA at room temperature. When needed, Wheat Germ Agglutinin (WGA, #W11261, Invitrogen) was added to the secondary antibody incubation step. Following this step, the slides were washed for 5 min in PBS, incubated with DAPI for 5 min in PBS (1:50,000, #62248, Invitrogen), and finally, washed one more time for 5 min in PBS before mounting using Fluoro-mount and adding coverslips. To determine sarcolemma damage, we quantified myofibers positive for IgG. Re-hydrated cryo-sections were incubated for 1.5 h with goat anti-mouse IgG H + L Alexa fluor 647 (1:500; #A-21235, Invitrogen) and WGA (1:500, #W11261, Invitrogen) in PBS with 1% BSA. Afterward, slides were washed 3 times for 5 min in PBS and mounted in Fluoro-mount. Slides were stored at 4 °C in dark before analysis. Appropriate negative control staining was utilized to verify the specific binding of secondary antibodies. Sections were visualized and analyzed using a Leica DM2000 fluorescent microscope and a Leica Hi-resolution Color DFC camera (Leica), combined with image-analysis software (Leica Qwin ver. 3.2, Leica) or an EVOS M7000 automated imaging system (ThermoFisher). All images were obtained at 20x or 40x magnification, and the number of centrally located nuclei, PAX7+ cells, or MyoD+ cells was normalized to the fiber number or area. Macrophage content (F4/80+) and IgG positive fibers were normalized to the area. The fiber area was analyzed in an image analysis software (Leica Qwin ver. 3.2, Leica, or SMASH [29]) and expressed in μm2. Fibrosis was quantified using the WGA stain from three independent images from each biological replicate using the threshold function in ImageJ (NIH).
2.3.7. Immunostaining for muscle fiber type
Cryosections of soleus and EDL muscles (cut in transverse orientation) were stained with monoclonal anti-myosin heavy chain (MyHC) antibodies (DSHB, University of Iowa): BA-D5 (IgG2b, MyHC-I specific), SC-71 (IgG1, MyHC-2A specific), and BF–F3 (IgM, MyHC-2B specific), as described previously [30]. Type 2X fibers are not recognized by these antibodies and therefore appear black. Three different goat-anti-mouse Alexa fluorophore conjugated secondary antibodies (Life Technologies) were used to bind to each primary antibody selectively: IgG2b, Alexa 647; IgG1, Alexa 488; and IgM, Alexa 555. Muscle sections, 10 μm thick, were fixed in 2% PFA for 30 min and permeabilized with 0.1% Triton-X100 for 10 min. After washing in immunobuffer (IB = 0.25% BSA, 50 mM glycine, 0.033% saponin, and 0.05% sodium azide diluted in PBS), sections were blocked for 1 h in 2% BSA, then briefly washed twice with IB for 5 min. A solution with all the primary antibodies diluted in IB was then prepared, and sections were incubated for 2 h at 37 °C. After three washes with IB, sections were incubated for 1 h at 37 °C, with a solution containing the three different secondary antibodies diluted in IB. After three washes with IB and a brief rinse in PBS, sections were mounted with Fluoromount (Sigma–Aldrich). Images were collected using a dry × 20 0.8 NA Plan Apo objective on an LSM 710 confocal microscope (Zeiss) driven by Zen 2012. The used excitation laser lines were 488, 561, and 633 nm, respectively. Three tracks were sequentially used for acquisition, with 488 and 633 channels recorded with PMTs, while the 561 channel was recorded with a GaAsP detector array. The matching dichroic mirrors were used for all channels, and the pinhole was set at 1 AU for 580 nm. Images were exported to ImageJ, and the composition of different MHC fiber types was quantified by counting sections of each muscle bed (Type I, blue; Type IIa, green; Type IIb, red; Type IIx, black) using the Cell Counter plugin.
2.3.8. Measurements of lactate, ATP, creatine (Cr), Phospho-Cr (PCr), and glycogen
Muscles were frozen and later freeze-dried, dissected free of non-muscle tissue, powdered, weighed, and extracted with HClO4, as previously described [31]. Neutralized extracts were analyzed spectrophotometrically (#DU 650; Beckman Coulter) for Lactate, ATP, PCr, and Cr, as previously described [32]. Muscle glycogen was analyzed from a separate portion of the freeze-dried muscle [33]. Briefly, freeze-dried muscle tissue (1.5 mg) was boiled in 0.5 mL of 1 M HCl for 150 min before it was rapidly cooled, whirl-mixed, and centrifuged at 3,500 g for 10 min at 4 °C. Next, 40 μL of the boiled muscle sample and 1 mL of a reagent solution containing Tris-buffer (1 M), distilled water, ATP (100 mM), MgCl2 (1 M), NADP+ (100 mM), and glucose 6-phosphate dehydrogenase were mixed before the process was initiated by adding 10 μL of diluted hexokinase. Muscle metabolites are expressed as mmol kg−1 dry weight.
2.3.9. Mitochondrial respiration
Quadriceps muscle was removed and placed in an ice-cold BIOPS buffer on ice [34], and single muscle fibers were dissected. The muscle fibers were permeabilized for 30 min in a BIOPS buffer containing 50 μg/mL saponin and washed twice for 10 min in MIR05 [34]. Muscle fibers were weighed prior to respiratory measurements in 2 mL MIR05. Mitochondrial respiration was determined using high-resolution respirometry (Oxygraphs-O2k, Oroboros Instruments). The respiration of the isolated muscle fibers was tested in response to a combination of 2 mM malate, 10 mM glutamate, and 5 mM pyruvate. ADP was then titrated at 0.25 mM and 5 mM, and 10 μM cytochrome c, 10 mM succinate, and 2.5 μM antimycin A was subsequently added. Finally, a combination of 2 mM ascorbate and 0.5 mM N, N, N′, N′-tetramethyl-p-phenylenediamine dihydrochloride (TMPD) was added. The following substrate was added when steady-state respiration was obtained. A calibration step for ascorbate and TMPD was performed to subtract background O2 consumption. Measurement was performed at high oxygen levels (450-200 nmol/mL). Each sample was measured in duplicate, and chamber temperature was set to 37 °C. Respiration was normalized to muscle fiber wet weight (mg). The coupling ratio between complex II and complex I was calculated as (O2 flux after succinate - O2 flux at ATP 5.0 mM)/O2 flux at ATP 5.0 mM, and the coupling ratio between complex IV and complex I was calculated as O2 flux after TMPD/O2 flux at ATP 5.0 mM.
2.3.10. Citrate synthase activity assay
Protein lysates of quadriceps muscle were diluted 1:10 in 0.1 M Tris–HCl, pH 8.1. 10 μL diluted lysate was added in duplicates to a 96-well plate, together with 150 μl of a reaction mix containing 44 μg/mL 5,5′-dithiobis (2-nitrobenzoic acid), and 333.3 μg/mL acetyl-CoA in 0.1 M Tris–HCl. Absorbance at 412 nm was measured for 5 min in a Hidex Sense plate reader (Hidex, Finland) to assess background activity. 10 μL of 10 mM oxaloacetate was then added to each well, and the increase in absorbance at 412 nm was measured for 5 min. Citrate synthase activity was calculated in the linear range of absorbance and normalized to the protein content of the lysate.
2.3.11. Mitochondrial morphology by electron microscopy
Muscle segments were fixed in 2.5% glutaraldehyde in 0.1 M sodium cacodylate buffer (pH 7.3) and prepared for transmission electron microscopy. After the primary fixation, the muscle segments were rinsed four times in 0.1 M sodium cacodylate buffer and post-fixed with 1% osmium tetroxide (OsO4) in a 0.1 M sodium cacodylate buffer for 90 min at 4 °C. After post-fixation, the segments were rinsed twice in 0.1 M sodium cacodylate buffer at 4 °C, dehydrated through a graded series of alcohol at 4–20 °C, infiltrated with graded mixtures of propylene oxide and Epon at 20 °C, and embedded in 100% Epon at 30 °C. Ultra-thin (60 nm) sections were cut (using a Leica Ultracut UCT ultramicrotome) in two depths (separated by 150 μm) and contrasted with uranyl acetate and lead citrate. Sections were examined and photographed in a pre-calibrated Philips CM100 transmission electron microscope (Philips) and a Veleta camera (Olympus Soft imaging Solutions). Six longitudinally oriented fibers were photographed at x13,500 magnification in a randomized systematic order, including 12 images from the subsarcolemmal region and 12 images from the myofibrillar region per fiber. In cross-sectional-oriented sections, 30 images were obtained in a randomized, systematic order distributed throughout the available fibers (7–126) per muscle. In all the photographed longitudinal-oriented fibers, the volumetric content of intermyofibrillar, subsarcolemmal, and total mitochondria was estimated by point counting [35] using a grid size of 460 nm, which creates 256 points per image. The volumetric content of intermyofibrillar, subsarcolemmal, and total mitochondria is expressed per myofibrillar space (μm3 μm-3), per fiber surface area (μm3 μm-2), and fiber space (μm3 μm-3), respectively. The total volumetric content of mitochondria (IMF + SS) was calculated as IMF + SS/12.5 based on the assumption that the fibers were cylindrical with a diameter of 50 μm and that the volume beneath the surface area was equal to a triangular prism with the dimensions of 1 × 1 × 25 μm. The mitochondrial cristae surface area per mitochondrial volume (SV) was estimated by the equation SV = 2 IL, where IL indicates intersections per test line [35]. Grid sizes of 90 and 270 nm were used to estimate mitochondria volume and cristae surface area, respectively. The volumetric content of total mitochondrial content was also estimated on the images obtained from cross-sectional sections by point counting using a grid size of 1500 nm, which creates 132 points per image.
2.3.12. Transcriptomic analysis by RNA sequencing
Total RNA from gastrocnemius muscle was isolated using the RNeasy Mini Kit (74,106, Qiagen). Quantification of RNA was determined using a spectrophotometer (Nanodrop 8000, Thermo Scientific), and integrity was measured using a Bioanalyzer 2100 (Agilent). Total RNA sequencing libraries were prepared by the Single-Cell Omics platform at the Center for Basic Metabolic Research using the Illumina TruSeq Stranded total RNA Gold protocol (Illumina). The total RNA (380 ng) was depleted of rRNA by RiboZero beads, fragmented, and cDNA was synthesized using SuperScript III Reverse Transcriptase (Thermo Fisher Scientific). cDNA was adenylated to prime for adapter ligation, and after a clean-up using AMPure beads (Beckman coulter), DNA fragments were amplified using PCR, followed by a final clean-up. Libraries were quality controlled using a Bioanalyzer instrument (Agilent Technologies) and subjected to 38-bp paired-end sequencing on a NextSeq 500 system (Illumina).
2.3.13. Mitochondrial swelling assay
Mitochondria were isolated from the freshly dissected gastrocnemius muscles of 4- to 5-week-old WT and SMNKO mice, following the procedure described in [36]. The mitochondrial pellet was suspended in a swelling buffer (150 mM KCl, 5 mM HEPES, and 2 mM K2HPO4 [pH 7.2]), and protein concentration was measured with a Bradford assay (BioRad #5000205). 200 μL of the mitochondrial suspension (~20 μg protein) was added to each well, and mitochondrial swelling was measured as absorbance at 540 nm [37]. To stimulate mitochondrial swelling a submaximal (100 μM) or a maximal (400 μM) dose of CaCl2 was added to each well, and absorbance was measured every 30 s for the next 40 min. Basal absorbance was normalized to mitochondrial protein content, whereas calcium-induced swelling was normalized to absorbance before calcium addition.
2.3.14. Thiobarbituric acid reactive substances (TBARS) assay (fluorometric)
The TBARS assay (Cayman #10009055) was performed according to the manufacturer's instructions using gastrocnemius muscle. The data were normalized to protein input.
2.3.15. Fluorimetric determination of intracellular Ca2+ levels
The [Ca2+] measurements were performed as in [38]. Briefly, WT and Nampt knockdown C2C12 myoblasts [16] were incubated with 10 μM Fura2-acetoxymethyl ester (Fura2-AM) for 40 min at 37 °C in a complete medium and washed with Hanks’ balanced salt solution (HBSS) or Ca2+-free HBSS before thapsigargin (TG) addition. [Ca2+] measurements and calibration were performed with a microfluorimetric system (Cairn Research).
2.4. Ca2+ uptake and release rate in sarcoplasmic reticulum (SR) vesicles
The fluorescent dye technique was used to determine Ca2+ uptake and release rates in SR vesicles, as described in detail elsewhere [39]. Briefly, muscle homogenate was mixed with 2 mL assay buffer and the SR vesicle Ca2+ uptake initiated by adding ATP (5 mM), and the free [Ca2+] was determined fluorometrically (20 Hz, Ratiomaster RCM, Photon Technology International) using the fluorescent Ca2+ indicator indo-1 (1 μM). When [Ca2+] reached a plateau, SR vesicle Ca2+ release was initiated by adding 4-chloro-m-cresol (5 mM). The SR Ca2+ uptake rate was defined as the time it took for free [Ca2+] to decrease by 63% (tau) and, in addition, as rates at specific physiological free [Ca2+]. Values obtained for SR Ca2+ release rates are relative and expressed as arbitrary units: Ca2+ g protein−1 min−1. Assays of Ca2+ uptake and release were performed in triplicate. Protein content in the muscle homogenate was measured in triplicate using a standard kit (#23225, Pierce BCA protein).
2.5. Quantification and statistical analysis
2.5.1. Bioinformatics methods
The raw reads from the RNA-sequencing were aligned to the mouse genome using STAR v2.5.2b [40], and gene coverages were computed by featureCounts v1.5.2 [41] using GENCODE [42] annotation release M13. Lowly expressed genes with less than 2 counts per million (CPM) in at least 2 samples were removed. Differentially expressed genes (DEGs) were computed using edgeR v3.22.0 [43] with the glmQLFit/glmQLFTest function using a model of the form y ~ 0 + group, where group represents the unique combinations of the genotype and age of the mice muscle samples. Genes having a false discovery rate (FDR) below 0.05 were considered differentially expressed. A gene set enrichment analysis (GSEA) was performed using clusterProfiler v3.10.0 [44]. Z-scores for the heatmap generation were calculated from CPM values of each gene and clustered using a “ward.D2” algorithm [45] using Pearson distance.
2.5.2. Statistical analysis
All data are presented as mean ± standard error of the mean (SEM), and the level of significance was set to p < 0.05. Statistical analysis was performed by Student's unpaired t-test, repeated-measures two-way or three-way analysis of variance (ANOVA), as appropriate, with Tukey's test as post-hoc. Survival rate was analyzed by a Mantel–Cox test (log-rank). Statistical analysis for the transcriptomic data was performed as described above. Explanation of the statistical outcome of each experiment can be found in figure legends.
3. Results
3.1. Skeletal muscle-specific Nampt ablation results in reduced growth and premature death
NAMPT was depleted in the skeletal muscle of skeletal muscle-specific Nampt knockout (SMNKO) mice (Figure 1A), leading to a 91% decrease in NAD+ and NADH levels (Figure 1B,C). Moreover, NADP+ and NADPH levels were reduced by 37% and 39%, respectively (Figure 1D,E). There were no significant changes in the NAD+/NADH or NADP+/NADPH ratios. SMNKO mice were born close to the expected Mendelian frequency of 25% (21%, n = 188) and showed no visual abnormalities at birth. At 4 weeks of age, body weight was reduced by 7.3 g (±0.1) in male and 6.4 g (±0.6) in female SMNKO mice compared to wild-type (WT) littermates, which may be explained by a slower growth rate in the early weeks of life. The differences in body weight persisted over the measured period (Figure 1F,G). Assessment of body composition revealed reductions in lean- and fat-mass from week 4–12 (Figure 1H,I, S1A, and S1B) as well as a decrease in body fat percentage in SMNKO mice (Figure 1J,S1C). Furthermore, SMNKO mice displayed spinal cord deformities and kyphosis (Figure 1K), which is often associated with aging phenotypes or severe neuromuscular defects [46]. The lifespan of the SMNKO mice was reduced, with only 37% of the mice surviving past 12 weeks of age (Figure 1L). The contractile function of soleus and EDL muscle from SMNKO mice was reduced in response to single electrical pulses ex vivo (Figure 1M and S1D). Maximum twitch force production was reduced in both muscles (Figure 1N and S1E), and the rate of force development and relaxation was slower (Figure 1O, 1P, S1F, and S1G) in soleus but not EDL muscles of SMNKO mice. The cumulative force generated from repeated tetanic contractions was also only significantly attenuated in soleus but not in EDL muscles from SMNKO mice compared to that in WT littermates (Figure 1Q and S1H).
Figure 1.

Skeletal muscle-specific Nampt ablation results in reduced growth and premature death.A) NAMPT protein levels in gastrocnemius muscle of male WT and SMNKO mice (9–14 weeks of age, n = 8–13). B and C) NAD+ and NADH levels in gastrocnemius muscle of male WT and SMNKO mice (9–14 weeks of age, n = 8–13). D and E) NADP+ and NADPH levels in gastrocnemius muscle of male WT and SMNKO mice (9–14 weeks of age, n = 8–13). F and G) Bodyweight measurements in (F) male and (G) female mice (n = 9–40). H and I) Lean and fat mass measurements in WT and SMNKO male mice (n = 9–40). J) Body fat percentage in WT and SMNKO male mice (n = 9–40). K) Representative CT scan of a WT and an SMNKO mouse at 5 weeks of age, displaying spinal cord deformities and kyphosis. L) Survival curves of WT (n = 102) and SMNKO (n = 40) mice. M and N) Twitch force traces (M) and max force (N) in soleus of WT and SMNKO mice (6 weeks of age, n = 8). O and P) Twitch force development (O) and decay (P) in soleus of WT and SMNKO mice (6 weeks of age, n = 8). Q) Tetanic force measured as area under the curve (AUC) in soleus of WT and SMNKO mice (6 weeks of age, n = 8). Error bars represent SEM. ∗ Difference to WT control of the same age. # Main effect of genotype.
3.2. SMNKO mice develop severe myopathy from 6 weeks of age
Survival curves separated from 4 weeks of age, and the SMNKO phenotype was further assessed in a longitudinal study of mice at 2, 4, 6, and 8 weeks of age. NAD+ levels in the skeletal muscle of SMNKO mice were depleted at all ages (Figure S1I). The poly (ADP-ribose) polymerase (PARP) family of enzymes is a significant consumer of NAD+ [47]. Thus, to determine the potential contribution of PARPs to the depletion of NAD+, we assessed PARylation in WT and SMNKO mice at 6 and 12 weeks of age. PARylation was increased in SMNKO mice at both ages compared to WT controls (Figure S1J). In a separate cohort, we observed a remarkable upregulation of PARP1 in the quadriceps muscle of SMNKO mice (Figure S1K). These data suggest that PARP activity may contribute significantly to depleting NAD+ levels in SMNKO mice. Immunohistochemical analysis of SMNKO mice showed striking morphological changes of the muscle fibers. The mean fiber size gradually increased over time in WT mice (Figure 2A), and at 2 and 4 weeks of age, the mean fiber area of the SMNKO mice was similar to littermate controls. However, while the mean fiber area doubled in WT mice from 4 to 6 weeks of age, there was no change in fiber area in SMNKO mice. A detailed analysis of fiber size distribution revealed a high frequency of smaller fibers (200–600 μm2) at 2 and 4 weeks of age in WT and SMNKO mice, which persisted at 6 and 8 weeks in the SMNKO mice (Figure 2B). The decrease in fiber size was not associated with changes in fiber type composition in soleus or EDL (Figure S1L and S1M). Moreover, atrophic fibers were not dominant in the SMNKO muscles (Figure 2C), indicating that the change in fiber size composition is likely due to ongoing fiber regeneration in the SMNKO mice. H&E staining showed infiltrated necrotic muscle fibers but no signs of apoptosis (Figure 2C). At 8 weeks of age, H&E staining revealed accumulation of adipocytes between the muscle fibers in the SMNKO mice, a phenomenon commonly seen together with fibrosis in chronic myopathies [48]. Concurring with these results, we found a marked increase in extracellular matrix content (wheat germ agglutinin [WGA] staining) at 8 weeks of age in SMNKO mice compared to WT littermates (Figure 2D), indicating tissue fibrosis. Ultimately, these findings indicate a severely degenerative muscle phenotype similar to those observed in DMD or muscle denervation.
Figure 2.

SMNKO mice develop severe myopathy from 6 weeks of age.A) Average fiber area in quadriceps muscle of WT and SMNKO mice (n = 2–3). B) Frequency distribution of fiber areas in quadriceps muscle of WT and SMNKO mice (n = 2–3). C) Representative hematoxylin and eosin (HE) staining in quadriceps muscle of WT and SMNKO mice at 8 weeks of age. → Marks central nuclei. ∗ Marks fat replacement. D) Percentage wheat germ agglutinin (WGA) deposition in quadriceps muscle of WT and SMNKO mice (n = 2–3), and representative WGA staining at 8 weeks of age. Bar = 50 μm. E) Quantification of PAX7 positive cells in quadriceps muscle of WT and SMNKO mice (n = 2–3) and representative image at 8 weeks of age. Bar = 50 μm ◄Marks PAX7 positive cells. F) Quantification of Myoblast determination protein 1 (MyoD) positive cells in quadriceps muscle of WT and SMNKO mice (n = 2–3) and representative image at 8 weeks of age. Bar = 50 μm ◄ Marks MyoD positive cells. G) Quantification of central nuclei of quadriceps muscle of WT and SMNKO mice (n = 2–3), and representative cross-section images at 8 weeks of age. Bar = 50 μm ◄ Marks central nuclei. H) Representative cross-sectional image of eMyHC positive cells in 8-week-old SMNKO mice. Bar = 50 μm ∗ Marks normal eMyHC positive fibers after regeneration, ◄ Marks small newly formed eMyHC positive fibers. I) Quantification of F4/80 positive macrophages in quadriceps muscle of WT and SMNKO mice (n = 2–3), and representative image at 8 weeks of age F4/80 and CCL3 double-positive macrophages. Bar = 50 μm ∗ Marks infiltrating F4/80 and CCL3 double-positive macrophages, ◄ marks interstitial F4/80 positive macrophages. Bar graphs: Error bars represent SEM. ∗ Difference to WT control of the same age.
Skeletal muscle regeneration is fully dependent on a pool of quiescent muscle stem cells [49,50]. To understand whether muscles in SMNKO mice were in a regenerative state, we quantified the content of PAX7+ muscle stem cells. We found no significant differences between the SMNKO and WT strains in the total number of PAX7+ muscle stem cells (Figure 2E). However, when examining the content of activated myogenic progenitor cells (MyoD+ cells), there was a marked increase in SMNKO mice starting at 6 weeks of age, which continued to rise at 8 weeks of age (Figure 2F). The content of activated myogenic stem cells was accompanied by a similar and robust increase (>30% of fibers) in centralized nuclei at 6 and 8 weeks of age in the SMNKO mice compared to WT (Figure 2G). Finally, in addition to the increase in active muscle stem cells and centralized nuclei, we noted the presence of muscle fibers expressing the embryonic isoform of myosin heavy chain (eMyHC) in SMNKO mice (Figure 2H), which was not evident in the WT mice (data not shown). Collectively, these findings suggest that a compensatory regenerative response is initiated between 4 and 6 weeks of age in the SMNKO mice under homeostatic conditions (i.e., without inducing an injury). Despite having what appears to be a functional pool of muscle stem cells, the SMNKO mice seem unable to recover, and the regenerative/degenerative phenotype is further exacerbated from 6 to 8 weeks of age, ultimately leading to premature death. Notably, the onset and development of the described phenotype are remarkably similar to degenerative conditions associated with defects in the interaction between the dystrophin sarcoglycan complex and laminin [51]. Based on the marked initiation of a regenerative program and evidence of necrosis, we decided to quantify macrophages. Macrophages are involved in the phagocytosis of necrotic fibers and provide essential indications for regeneration [52,53]. We observed the infiltration and accumulation of macrophages in skeletal muscle of SMNKO mice of 6 weeks of age (Figure 2I), concurring with the evidence of regeneration. Collectively, our data suggest that SMNKO mice progressively develop a severe myopathy beginning at 4 weeks of age, which appears to develop despite the presence of a functional pool of muscle stem cells.
3.3. Skeletal muscle from SMNKO mice show decreased mitochondrial function despite normal mitochondrial structure
The impaired regeneration and necrotic cell death observed in SMNKO mice could be due to an energy deficiency. To determine the impact of Nampt ablation on the energy status of skeletal muscle, we assessed ATP levels and the phosphocreatine to total creatine ratio. At 4 weeks of age, ATP levels were severely reduced by 86% in SMNKO mice (Figure 3A). This difference decreased in the following weeks, but ATP levels never reached those of WT littermates. At 8 weeks of age, the phosphocreatine to total creatine ratio was reduced by 41% in SMNKO mice (Figure 3B). We next assessed whether the energy stress translated to a decreased mitochondrial respiratory capacity in the NAD+ depleted cells by assessing mitochondrial respiration in permeabilized, single muscle fibers of WT and SMNKO mice. Coupled respiration (state 3) was reduced by 58% in the SMNKO mice (Figure 3C). However, the coupling ratio of O2 flux mediated by Complex I at 5 mM of ADP in relation to respiration stimulated by malate, glutamate, and pyruvate (MGP) was decreased in SMNKO mice. In contrast, the substrate control ratio (Complex II/Complex I-induced respiration) was higher in SMNKO fibers (Figure 3D–E). Moreover, Complex IV respiration induced by TMPD and ascorbate was not different between genotypes (Figure 3C). These data point to Complex I as the primary defective site of the respiratory chain. The impaired function of Complex I has been associated with the increased production of reactive oxygen species (ROS) [54,55]. Thus, we assessed lipid peroxidation in the skeletal muscle of SMNKO and WT mice at 6 and 12 weeks of age. Malondialdehyde (MDA) was not different between genotypes (Figure 3F), suggesting similar levels of lipid peroxidation. Furthermore, gene expression levels of the ROS scavenger proteins Catalase and MnSOD were assessed. Cat expression was not different between genotypes, but Sod2 was decreased at 6 and 8 weeks of age in SMNKO mice compared to WT controls (Figure S2A–B). These data indicate similar levels of ROS in both genotypes despite defective Complex I respiration in the SMNKO mice.
Figure 3.

Mitochondrial function in skeletal muscle and whole-body energy metabolism is diminished in SMNKO mice.A) ATP levels in tibialis anterior (TA) muscle of WT and SMNKO mice (n = 2–6). B) Phosphocreatine (PCr) to total creatine ratios in TA muscle of WT and SMNKO mice (n = 2–6). C) Mitochondrial respiration in permeabilized single muscle fibers of WT and SMNKO mice. O2 flux was measured during the addition of malate (2 mM) + glutamate (10 mM) + pyruvate (5 mM) (MGP), ADP 0.25 mM (submaximal response), ADP 5 mM (maximal response), cytochrome c (10 μM), succinate (10 mM), antimycin A (2.5 μM), and N,N,N′,N'-tetramethyl-p-phenylenediamine (TMPD) (0.5 mM) + ascorbate (2 mM), (7–10 weeks of age, n = 4). D and E) Substrate control ratio (Complex II to Complex I respiration) (D) and complex IV to complex I respiration (E), (7–10 weeks of age, n = 4). F) Lipid peroxidation (TBARS, Fluorometric assay) in gastrocnemius muscle of WT and SMNKO mice (6 + 12 weeks of age, n = 6–9). G) Longitudinal transmission electron microscopy picture of quadriceps muscles from an 8-week-old WT and SMNKO mouse. H-J) Total (H), intermyofibrillar (I), and subsarcolemmal (J) mitochondrial volume in quadriceps muscles of WT and SMNKO male mice, (5–8 weeks of age, n = 6). K) Surface area of the mitochondrial cristae in quadriceps muscles of WT and SMNKO male mice. (5–8 weeks of age, n = 6). L and M) Protein levels of 5′-adenosine monophosphate-activated protein kinase (AMPK) pT172 (L) and Unc-51 like autophagy activating kinase (ULK1) pS555 (M) in quadriceps muscle of WT and SMNKO mice (n = 2–6). N) 24-hour time course of respiratory exchange ratio (RER) and average RER in the light and the dark phase of sedentary WT and SMNKO male mice (8–14 weeks of age, n = 8–13). O) 24-h time course of energy expenditure (EE) in the light and the dark phase of sedentary WT and SMNKO male mice (8–14 weeks of age, n = 8–13). P) ANCOVA analysis with EE in the light and the dark phase as the dependent variable and body weight as a covariant for WT and SMNKO male mice (8–14 weeks of age, n = 8–13). The analysis shows that genotype does not significantly affect EE independently of body weight. Q) Food intake in the light and the dark phase of sedentary WT and SMNKO male mice (8–14 weeks of age, n = 8–13). R) ANCOVA analysis with food intake in the light and the dark phase as the dependent variable and body weight as a covariant for WT and SMNKO male mice (8–14 weeks of age, n = 8–13). The analysis shows that genotype significantly affects EE independently of body weight. Error bars represent SEM. ∗ Difference to WT control of the same age/treatment/light phase. # Main effect of genotype.
Interestingly, protein abundance of the OXPHOS Complex I subunit (NDUFB8), the Complex IV subunit (MTCO1; Figure S2C,S2D, and S2L), and citrate synthase activity (Figure S2E) in SMNKO mice and WT littermates were similar at all ages. This finding indicates a comparable mitochondrial content in the skeletal muscle of SMNKO and WT mice. To directly evaluate mitochondrial volume and structure, we performed TEM imaging in the quadriceps of SMNKO and WT mice (Figure 3G). Z-disc width was unaltered between genotypes (Figure S2F). Z-disc width varies coordinately with fiber type, with fast-twitch muscle fibers having thinner z-discs [56]. Therefore, the maintenance of z-disc distance is consistent with a similar fiber type composition between genotypes. Total intermyofibrillar and subsarcolemmal mitochondrial volumes were similar between genotypes (Figure 3H–J), and the surface area of the mitochondrial cristae was identical (Figure 3K). Thus, the deletion of Nampt in skeletal muscle leads to severe energy stress and decreased mitochondrial respiratory capacity but does not affect mitochondrial content or structure as measured by OXPHOS protein abundance and TEM imaging, respectively.
In response to the severe energy stress associated with the lack of Nampt, phosphorylation of AMPK in skeletal muscle of SMNKO mice was dramatically increased at 6 and 8 weeks of age (Figure 3L and S2L). Cellular autophagy plays a vital role during muscle development and maintains cellular homeostasis and energy balance in muscle fibers [57]. Autophagy is induced by AMPK activation [58] through a direct phosphorylation on Unc-51 like autophagy activating kinase (ULK1) S555 [59]. Accordingly, we observed increased ULK1 S555 phosphorylation in skeletal muscle from SMNKO mice from 6 weeks of age (Figure 3M and S2L). The protein abundance of autophagic initiators, such as Beclin 1 and p62, was also increased by Nampt deletion (Figure S2G,S2H, and S2L). An increase in the LC3B II and LC3B I ratio indicates increased autophagy flux [60]. An abundance of LC3B II was increased in the SMNKO mice at 6 and 8 weeks of age (Figure S2I and S2L), with no change in LC3B I (Figure S2J and S2L), resulting in an increased LC3B II/LC3B I ratio at 6 weeks of age (Figure S2K). Collectively, these data suggest that autophagy is increased upon Nampt deletion in skeletal muscle.
3.4. Adult SMNKO mice have altered whole-body energy metabolism
SMNKO mice were placed in metabolic chambers to investigate how increased energy stress affects whole-body metabolism. SMNKO mice had a lower respiratory exchange ratio (RER) in both light and dark phases (Figure 3N), suggesting an increased reliance on lipid oxidation. Moreover, energy expenditure was lower in SMNKO mice than in WT littermates (Figure 3O), but an ANCOVA analysis showed that this effect was dependent on body weight (Figure 3P). Thus, SMNKO mice and WT littermates use similar amounts of energy according to body weight. Food intake differed between genotypes only in the dark phase, with reduced consumption in SMNKO mice (Figure 3Q and 3R). Therefore, differences in body weight between genotypes may be due to reduced energy intake in the SMNKO mice. When SMNKO mice were given access to running wheels, the distance and running time were shorter than in WT littermates (Figure S3A,S3B). SMNKO mice ran 1.7 km/night, whereas WT littermates ran 9.0 km/night (Figure S3A). We were unable to detect differences in RER between genotypes when mice had access to running wheels (Figure S3C). This lack of difference was potentially due to an exercise-induced lowering of daily average RER in WT mice that did not occur in SMNKO mice. A similar effect of exercise on the daily RER in WT mice has been reported [61]. As expected, there was a greater increase in energy expenditure in response to wheel running in WT mice than in SMNKO mice (Figure S3D), and this effect was independent of body weight (Figure S3E). Moreover, food intake was reduced in SMNKO mice compared to WT littermates during the active phase (Figure S3F,S3G). Thus, the depletion of Nampt in skeletal muscle alters substrate utilization in the sedentary state and reduces voluntary exercise volume.
3.5. Knockout of Nampt results in time-dependent changes in skeletal muscle gene expression patterns
To identify potential mediators of the SMNKO phenotype, we performed RNA sequencing in gastrocnemius muscles from the longitudinal study of mice sacrificed at 2, 4, 6, and 8 weeks of age. The analysis revealed extensive changes in gene expression over time, indicated by the distinct separation of the 2-week-old mice from the older mice in the heatmap and principal coordinate analysis (PCoA; Figure S3H and 4A). SMNKO mice did not separate from WT mice at 2 and 4 weeks of age, but at 6 and 8 weeks of age, there was a clear separation between WT and SMNKO mice (Figure 4A). At 2, 4, 6, and 8 weeks of age, we found 11, 895, 1469, and 8605 genes to be differentially expressed between genotypes, respectively (Figure 4B). A gene set enrichment analysis of these genes separated by age showed the regulation of four main types of biological pathways (Figure S3I). Genes related to mitochondrial respiration and energy metabolism were downregulated in SMNKO mice at 6 and 8 weeks of age. Moreover, gene expression associated with neuronal ensheathment and myelination was reduced at 2 and 8 weeks of age, indicating a defect in the normal development of innervation in response to Nampt deletion in skeletal muscle fibers. At 4 weeks of age, genes related to cell division were downregulated in the SMNKO mice (Figure S3I). Conversely, genes related to this term were upregulated at 8 weeks of age, supporting the observed increase in tissue regeneration observed at later time points. Genes associated with immune system activation and inflammation were increased at all investigated time points (Figure S3I). This finding was in line with histological observations of increased macrophage infiltration (Figure 2I).
Figure 4.

Gene expression, Ca2+-homeostasis, and Ca2+-induced mitochondrial swelling are altered by Nampt depletion.A) Principal coordinate analysis (PCoA) of RNA sequencing data from gastrocnemius muscle of WT and SMNKO mice (n = 2–6). B) Upset plot showing overlaps of genes differentially expressed between genotypes at the four ages (n = 2–6). C and D) Expression based on RNA sequencing data of mitochondria permeability transition pore (mPTP) related proteins: Peptidyl-prolyl cis–trans isomerase F (Ppif) (C), and Bcl-2-associated X (Bax) (D), on gastrocnemius muscle of WT and SMNKO mice (n = 2–6). E and F) Protein levels of CYPD (E) and BAX (F) in WT and SMNKO male mice (9–14 weeks of age, n = 8–13). G) Mitochondrial volume measured as basal absorbance at 540 nm in isolated mitochondria from gastrocnemius muscle of WT and SMNKO mice (4–5 weeks of age, n = 7–9). H) Mitochondrial swelling in response to stimulation with a submaximal (100 μM CaCl2) or maximal Ca2+ (400 μM CaCl2) concentration, measured in isolated mitochondria from gastrocnemius muscle of WT and SMNKO mice. A 3-way interaction between treatment, time, and genotype was found (4–5 weeks of age, n = 7–9, p < 0.001). I) Rate of mitochondrial swelling in response to stimulation with a submaximal (100 μM CaCl2) or maximal Ca2+ (400 μM CaCl2) concentration in WT and SMNKO mice, calculated as the slope of the curves in 4H over the entire time course (n = 7–9). J and K) Basal cytosolic Ca2+ levels (J) and ΔCa2+ levels upon addition of Thapsigargin, reflecting Ca2+ replenishment in endoplasmic reticulum (ER) (K) of C2C12 myoblasts transduced with scramble or shRNA against Nampt. The Nampt knockdown cells were treated with vehicle or nicotinamide (NAM) for 24 h before the measurement (n = 3). L and M) Protein levels of cAMP-Responsive Element-Binding Protein (CREB) pS133 (L) and sarcoplasmic and endoplasmic reticulum Ca2+ ATPase 1 (SERCA1) (M) in WT and SMNKO male mice (9–14 weeks of age, n = 8–13). N and O) Expression based on RNA sequencing data of the SERCA1 regulatory proteins: Sarcalumenin (Srl) (N), and Sarcolipin (Sln) (O), in gastrocnemius muscle of WT and SMNKO mice (n = 2–6). P and Q) Ca2+ reuptake measured as the τ value (P) or the high and the low slope (Q) in isolated sarcoplasmic reticulum (SR) vesicles from male WT and SMNKO mice, (13 weeks of age, n = 4). R) Ca2+ release in isolated SR vesicles from male WT and SMNKO mice (13 weeks of age, n = 4). Bar graphs: error bars represent SEM. Box plot: boxes extend from the 25th to 75th percentiles, and the whiskers represent the smallest to the largest value. ∗ Difference to WT/scramble control of the same age/treatment.
Data were screened for differentially regulated genes at 2 weeks of age (Table S1). Of the 11 genes that were differentially regulated at this time point, we were intrigued to find an upregulation of Peptidyl-prolyl cis–trans isomerase F (Ppif), which was upregulated throughout the time course (Figure 4C). Ppif encodes for CYPD, a well-characterized regulator of the mPTP [20]. In addition to Ppif, the expression of four other genes related to mPTP and mitochondrial Ca2+ handling: Bcl-2-associated X (Bax), Mitochondrial Calcium Uniporter (Mcu), Translocator protein (Tspo), and Solute Carrier Family 8 Member B1 (Slc8b1). These genes were elevated in SMNKO mice at 8 weeks of age (Figure 4D,S4A, S4B, and S4C). In a separate cohort of adult SMNKO mice, we confirmed the increased levels of CYPD and BAX at the protein level (Figure 4E,F). Together, these findings demonstrate increased levels of mPTP and Ca2+ handling components in SMNKO mice.
3.6. Mitochondria from SMNKO mice show increased sensitivity to Ca2+-induced swelling
We isolated mitochondria from the gastrocnemius muscle to test whether the increased abundance of CYPD in SMNKO mice was associated with altered sensitivity to Ca2+-induced mitochondrial swelling. Absorbance at 540 nm is inversely correlated with mitochondrial size [37]. The lower absorbance of mitochondria from SMNKO mice suggests a larger basal volume of isolated mitochondria (Figure 4G). In response to stimulation with submaximal or maximal Ca2+ concentrations, mitochondria from both WT and SMNKO mice showed a dose-dependent decrease in absorbance (Figure 4H). In this data set, there was a 3-way interaction between treatment, time, and genotype (n = 7–9; p < 0.001). The calculation of the average swelling rate for each group revealed an interaction between treatment and genotype, which was driven by an increased swelling rate in the mitochondria of SMNKO mice during submaximal Ca2+ stimulation (Figure 4I). This effect demonstrates that mitochondria from SMNKO mice have an increased sensitivity to Ca2+-induced swelling.
To determine how NAMPT depletion affects Ca2+ homeostasis, we used C2C12 myoblasts with a stable 80% knockdown of Nampt [16]. Cytosolic Ca2+ levels were 2.4-fold higher, and endoplasmic reticulum (ER) Ca2+ levels were 38% lower in the Nampt knockdown cells compared to control cells (Figure 4J,K). Treatment with nicotinamide (NAM) rescued cytoplasmic Ca2+ levels but did not affect ER Ca2+ levels. Consistent with indications of perturbed Ca2+ homeostasis in C2C12 knockdown cells, the biological pathway term “positive regulation of cytosolic calcium ion concentration” was enriched in the RNAseq data in SMNKO mice at 8 weeks of age. Moreover, we observed increased phosphorylation of the Ca2+ responsive transcription factor cAMP-Responsive Element-Binding Protein (CREB) at S133 [62] in SMNKO mice (Figure 4L). The increased cytosolic Ca2+ could be due to the aberrant uptake of extracellular Ca2+ uptake, mediated by sarcolemma damage, as previously reported [15]. Furthermore, the expression of Ca2+ transporters connected to the sarcolemma was not increased in the SMNKO mice (Figure S4D–J). Perturbed Ca2+ homeostasis could also be mediated by changes in Ca2+ release or reuptake from the sarcoplasmic reticulum (SR). Sarco/endoplasmic reticulum Ca2+ ATPase (SERCA) 1 levels were decreased in the SMNKO mice (Figure 4M), along with the expression of sarcalumenin (Srl; Figure 4N), a Ca2+ buffering and SERCA interacting protein in the skeletal muscle SR [63]. Moreover, the expression of sarcolipin (Sln), an inhibitor of SERCA [64], was increased at 6 and 8 weeks of age (Figure 4O). Higher Sln expression may translate to higher SLN levels, serving to lower ATP consumption by SERCA1. Collectively, these observations suggest that SERCA1 activity is affected, but neither Ca2+ release nor Ca2+ reuptake (τ) in isolated SR vesicles was altered in SMNKO mice compared to WT (Figure 4P–4R). As this analysis of Ca2+ handling capacity was performed under conditions with surplus ATP, these data suggest that the specific activity of the SERCA pump in SMNKO mice is unaffected and that the putative increase in cytosolic Ca2+ may be a consequence of lower SERCA abundance, altered allosteric regulation of Ca2+ handling components, or increased extracellular Ca2+ influx.
3.7. Cyclosporine a treatment increases survival rate in SMNKO mice
To test the importance of increased mPTP sensitivity for the survival of the SMNKO mice, we treated the SMNKO mice with the CYPD inhibitor Cyclosporine A (CsA). CsA is also known to have potent immunosuppressant abilities [65]. Based on previous studies, mice were treated with 210 mg/L CsA in the drinking water [66,67]. The CsA treatment increased the survival rates of SMNKO mice by 42% from birth to 12 weeks of age (Figure 5A), but CsA did not appear to affect the energetic stress of the SMNKO muscle (Figure 5A–B). To study whether CsA treatment had positive effects on skeletal muscle morphology, we performed histological analyses of quadriceps muscle from mice treated with CsA for either 6 or 12 weeks. CsA treatment did not prevent the reduction in fiber size in SMNKO mice but unexpectedly decreased the fiber area in both genotypes (Figure 5D). However, treatment with CsA reduced the number of centrally located nuclei in SMNKO mice and WT littermates, indicating fewer regenerative myofibers (Figure 5E). CsA treatment did not affect CYPD protein abundance (Figure 5F). To directly assess whether CsA treatment reduced myofiber damage, we analyzed the content of IgG+ fibers (i.e., fibers with sarcolemma damage) in WT and SMNKO mice with or without CsA treatment. This analysis revealed a marked increase in IgG+ in the SMNKO mice at 12 weeks of age compared to WT at 6 weeks of age (Figure 5G–H). Interestingly, the CsA treatment completely prevented the presence of IgG+ fibers at 6 weeks in SMNKO mice, though this effect was not maintained at the 12-week time point (Figure 5G–H). This finding confirms that CsA delays the degenerative muscle phenotype and sarcolemmal damage, which may ultimately increase the lifespan of the SMNKO mice. Collectively, these data show that CsA treatment increases the survival rate in SMNKO mice, which was associated with a reduced need for muscle regeneration and improved muscle health.
Figure 5.

Cyclosporine A treatment improves survival of the SMNKO mice.A) Survival curve of WT and SMNKO mice given drinking water supplemented with or without 210 mg/L Cyclosporine A (CsA) (n = 30–31). B) ATP levels in quadriceps muscle from WT and SMNKO mice treated +/− CsA (6 or 12 weeks of age, n = 6–13). C) AMPK pT172 levels in quadriceps muscle from WT and SMNKO mice treated +/− CsA (6 or 12 weeks of age, n = 6–13). D) Average fiber area in quadriceps muscle of WT and SMNKO mice treated +/− CsA in the drinking water (6 or 12 weeks of age, n = 5–7). E) Quantification of central nuclei of quadriceps muscle of WT and SMNKO mice given +/− CsA in the drinking water (6 or 12 weeks of age, n = 5–7). F) Protein levels of Cyclophilin D in gastrocnemius muscle from WT and SMNKO mice given +/− CsA in the drinking water (6 or 12 weeks of age, n = 6–13). G) Quantification of IgG+ positive cells in quadriceps from WT and SMNKO mice treated +/− CsA (6 or 12 weeks of age, n = 5–7). H) Representative images from IgG staining of Quadriceps muscle of WT and SMNKO mice treated +/− CsA. Error bars represent SEM. ∗ Difference to WT control mice. # Main effect of genotype. $Main effect of CsA.
3.8. Decreases in NAMPT or NAD+ is not a common mechanism for human muscle atrophy or myopathies
Provided with evidence that the loss of NAD+ leads to severe muscle atrophy and myopathy, we investigated if conditions of age-related muscle atrophy (sarcopenia) or common myopathies were associated with the loss of NAD+. Firstly, we obtained biopsies from individuals with sarcopenia and age-matched healthy controls. NAMPT and NAD+ levels were previously found to be decreased in muscle from a small number of individuals with sarcopenia [68]. However, we observed no differences in NAMPT and NAD+ levels between healthy and sarcopenic muscle (Figure S5A–B). Moreover, sarcopenia did not alter the abundance of CYPD, HK2, and phosphorylated AMPK levels (Figure S5C–E), indicating no aberrant regulation of mPTP opening and energy status in this cohort of patients. Next, we obtained biopsies from individuals with two types of myopathy: Becker muscular dystrophy (BMD) and Hypokalemic periodic paralysis (HypoPP). BMD is a common structural myopathy caused by mutations in the gene coding for the large sarcolemma scaffold protein dystrophin [69]. HypoPP is a rare, autosomal dominant channelopathy characterized by muscle weakness or paralysis in response to low potassium levels. Most cases are caused by a mutation in the voltage-gated Ca2+ channel dihydropyridine receptor (DHPR) gene CACNA1S [70,71], which leads to dysregulated Ca2+-signaling. We did not observe a change in NAMPT levels in the two patient groups (Figure S5F), but surprisingly, NAD+ levels increased by 26% in the HypoPP patients (Figure S5G). Neither CYPD nor HK2 protein abundance was affected in the myopathy patients (Figure S5H–I), while AMPK phosphorylation was increased with BMD (Figure S5J). Collectively, while SMNKO mice are clearly atrophic and display a degenerative muscle phenotype, our human data indicate that muscle atrophy or severe myopathies are not necessarily related to the loss of NAD+.
3.9. SMNKO mice die due to energy deficiency
To determine the cause of death of the SMNKO mice, muscle tissue was collected just before death. Mice were considered close to death when fulfilling more than one of the following criteria: a 10% reduction in body weight, limited locomotion by handling, or abnormal breathing. The minimal mobility was observed in most cases. Under these terminal conditions, SMNKO mice had decreased NAMPT, NAD+, NADH, NADP+, and NADPH levels in skeletal muscle compared to WT littermates (Figure 6A–E). However, there was no further reduction in these metabolite levels compared to that in the surviving SMNKO mice (Figure 1A–E). Likewise, the average fiber area and the number of central nuclei showed a similar change in the terminal and the surviving SMNKO mice (Figure 6F–G vs. 2A and 2G). The mPTP-related proteins CYPD and BAX were also not further induced in the terminal SMNKO mice (Figure 6H–I vs. 4E-F). To exclude cardiac failure as a cause of death, we compared the hearts of SMNKO mice and WT littermates. Under terminal conditions, cardiac levels of NAMPT did not differ between SMNKO mice and WT littermates, whereas NAMPT protein abundance was significantly reduced in the surviving SMNKO mice compared to their WT littermates (Fig. S6A). However, this reduction did not affect cardiac levels of NAD+, which remained similar between SMNKO mice and WT littermates from the survival cohort (Fig. S6B). In the death cohort, NAD+ levels were found to be slightly elevated compared with WT mice (Fig. S6B). In addition, we assessed cardiac tissue weight in SMNKO mice and WT littermates from both cohorts. The cardiac growth rate was found to be similar between SMNKO mice and WT littermates (Fig. S6C), and though the hearts of SMNKO mice generally appear smaller, no significant reduction in cardiac weight was found once normalized to body weight (Fig. S6D). Based on these data, there does not seem to be any macroscopic differences in the hearts of SMNKO mice and WT littermates.
Figure 6.

Dying SMNKO mice suffer from whole-body energy depletion.A-C) NAMPT (A), NAD+ (B), and NADH (C) levels in gastrocnemius muscle of WT and SMNKO mice sacrificed just before natural death of the SMNKO mice (4–11 weeks of age, n = 15). D and E) NADP+ (D) and NADPH (E) levels in gastrocnemius muscle of WT and SMNKO mice sacrificed just before natural death of the SMNKO mice (4–11 weeks of age, n = 15). F and G) Average fiber area (F) and number of central nuclei (G) in quadriceps muscle of WT and SMNKO mice sacrificed just before natural death of the SMNKO mice (4–11 weeks of age, n = 15). H and I) CYPD (H) and BAX (I) protein levels in gastrocnemius muscle of WT and SMNKO mice sacrificed just before natural death of the SMNKO mice (4–11 weeks of age, n = 15). J and K) ATP (J) and phosphocreatine (PCr) (K) levels in tibialis anterior (TA) muscle of WT and SMNKO mice sacrificed just before natural death of the SMNKO mice (Death cohort, 4–11 weeks of age, n = 15), and in male WT and SMNKO mice (Survival cohort, 9–14 weeks of age, n = 8–13). L and M) Glycogen (L) and lactate (M) levels in TA muscle of WT and SMNKO mice sacrificed just before natural death of the SMNKO mice (Death cohort, 4–11 weeks of age, n = 15), and in male WT and SMNKO mice (Survival cohort, 9–14 weeks of age, n = 8–13). N and O) Hexokinase 2 protein levels in gastrocnemius muscle of (N) 4–11 weeks of age WT and SMNKO mice sacrificed just before natural death of the SMNKO mice (n = 15), and (O) 9–14 weeks of age male WT and SMNKO mice (n = 8–13). P) Glycogen levels in liver of WT and SMNKO mice sacrificed just before natural death of the SMNKO mice (Death cohort, 4–11 weeks of age, n = 15), and in male WT and SMNKO mice (Survival cohort, 9–14 weeks of age, n = 8–13). Q) Blood glucose levels of WT and SMNKO mice sacrificed just before natural death of the SMNKO mice (4–11 weeks of age, n = 15). Error bars represent SEM. ∗ Difference to WT mice in the same cohort. # Main effect of cohort. ¤ Difference to mice of the same genotype in the other cohort.
Next, we evaluated the energy status of the terminal SMNKO mice. ATP levels were decreased to 18 mmol/kg dry weight in both the terminal and the surviving SMNKO mice, whereas phosphocreatine levels were unchanged (Figure 6J–K). Muscle glycogen levels were increased in both cohorts (Figure 6L). The subsarcolemmal and inter- and intra-myofibrillar accumulation of glycogen was evident in electron microscopy images and caused ultrastructural changes by occasionally breaking up the Z-line and splitting myofibrils longitudinally (Figure S6E). This did not cause apparent changes in the Z-line register. This process is unlike that observed in WT muscle, where no accumulation of glycogen is present. In the diaphragm of the terminal SMNKO mice, ATP levels were decreased, and glycogen levels were increased (Figure S6F–G). The general increase in glycogen levels could indicate a metabolic ‘block’ of glycolysis or a reduction in the spatial availability of glycogen for break-down, though no effect of the genotype was observed in muscle lactate levels in the two cohorts (Figure 6M). HK2 overexpression can enhance glycogen storage in skeletal muscle [72], and both cohorts of SMNKO mice showed increased HK2 levels (Figure 6N–O). Liver glycogen levels were similar between the genotypes in the survival cohort but decreased by 43% in the terminal SMNKO mice (Figure 6P). The decrease in liver glycogen was likely driven by an acute energy shortage. Supporting this notion, blood glucose levels were low in the terminal SMNKO mice (Figure 6Q), possibly due to inadequate food intake. Thus, our results highlight the essential role of NAMPT in regulating glucose storage and/or utilization and in maintaining whole-body energy homeostasis.
3.10. NR supplementation delays but does not rescue the SMNKO phenotype
In an attempt to rescue the phenotype of the SMNKO mice, the diet was changed to a purified diet (Table S2) supplemented with the NAD+ precursor, NR (200 mg/kg body weight). The NR-supplemented diet was given to breeding parents and their offspring throughout the experiment. Though NAD+ levels in muscle from SMNKO mice remained unaffected, the NR-supplemented diet increased NAD+ levels in skeletal muscle of WT mice at 4 weeks of age (Figure 7A). The NR-supplemented diet increased ATP content in the skeletal muscle of both WT and SMNKO mice at 4 weeks of age, but not at later time points (Figure 7B). The average fiber area was increased, and the number of centrally located nuclei was rescued in response to the NR-enriched diet at 6 weeks but not at 8 weeks of age (Figure 7C–D). However, the survival of the SMNKO mice was not affected by the NR-supplemented diet (Figure 7E). Thus, the NR-supplemented diet only delayed muscle degeneration in the SMNKO mice.
4. Discussion
Growing evidence highlights the importance of NAD+ availability in aging and disease development [73,74]. Here, we demonstrate that the deletion of Nampt in skeletal muscle results in severe growth deficiency, myopathy, and decreased survival, indicating the essential role of NAD+ biosynthesis in skeletal muscle development and maintenance. Only 10% of NAD+ remained in the skeletal muscle of SMNKO mice, demonstrating that salvaging from alternative NAD+ precursors, such as nicotinic acid and NR, does not contribute significantly to the NAD+ pool in skeletal muscle.
SMNKO mice suffer from myopathy, characterized by decreased sarcolemma integrity, decreased fiber size, fibrosis, and centrally located nuclei. We found Nampt to be important for intracellular Ca2+ homeostasis, indicating a direct link between NAD+ salvage capacity and Ca2+ handling. We also observed a decrease in SERCA1 protein abundance and an increase in the sarcolipin expression in SMNKO mice. Similar observations were reported for muscular dystrophies [75,76]. Indeed, animal models of DMD and other myopathies can be rescued by SERCA1 overexpression or sarcolipin reduction [[76], [77], [78]], highlighting the general importance of Ca2+ homeostasis in the development of muscular dystrophies.
We found that neither Ca2+ release nor Ca2+ reuptake in isolated SR vesicles from SMNKO mice was affected. However, Ca2+ homeostasis may be affected in vivo, as isolated SR vesicles lack direct contact with regulatory proteins in the cytosol and plasma membrane. In addition, the experiments with isolated SR were performed under conditions with non-limiting ATP levels. ATP is essential for the activity of the SERCA pump and for Ca2+ pumps in the plasma membrane [79], in addition to acting as an essential buffer of Ca2+ [80]. Therefore, the substantial decrease in ATP levels seen in SMNKO mice may directly affect Ca2+ homeostasis.
Moreover, the decrease in ATP levels in SMNKO mice leads to increased AMPK phosphorylation. Increased AMPK phosphorylation has also been observed in mdx mice [81]. In these mice, further activation of AMPK can ameliorate their dystrophic phenotype, including a rescue of their abnormal sensitivity to the Ca2+-stimulated mPTP opening [81]. Extracellular Ca2+ influx is sufficient to induce muscle dystrophy [82]. Our data indicate decreased sarcolemma integrity, which would increase Ca2+ levels in the cytosol. The knockout of Nampt has been shown to impair sarcolemma integrity in skeletal muscle [15] and may be a consequence of impaired ADP ribosylation of proteins necessary for maintaining membrane organization and structure. ADP ribosylation is an NAD+-dependent process, and modification of integrin α7 is important for the binding of integrin α7β1 to laminin to maintain membrane integrity [83,84]. Our current thinking is that the lack of sarcolemma integrity is the primary driver of the disrupted Ca2+ homeostasis in the SMNKO mice and that low NAD+ levels and the resulting low ATP concentrations may exacerbate this condition.
The expression of CYPD and sensitivity to the Ca2+-stimulated mPTP opening was increased in SMNKO mice. This finding identifies low NAD+ levels as a signal for mPTP opening. One pathway by which NAMPT deficiency could regulate the mPTP opening is via an increased expression of CYPD. CYPD levels are increased in response to the knockout of Mitochondrial Transcription factor A (Tfam) and in patients with mitochondrial myopathies [85]. Thus, decreased mitochondrial metabolism in SMNKO mice could promote the increase in CYPD levels. Another more direct effect of low NAD+ levels on mPTP opening could arise from increased CYPD activity in response to NAD+-dependent changes in acetylation levels. Acetylation of the Complex V protein, oligomycin-sensitive conferring protein (OSCP), at K70 promotes an interaction between OSCP and CYPD, which sensitizes the opening of the mPTP [23]. In addition, SIRT3 directly deacetylates CYPD on K166 [24]. The CYPD-mediated opening of the mPTP plays an essential role in several types of human and murine myopathies, as treatment with CYPD inhibitors rescue the dystrophic phenotype [[85], [86], [87], [88], [89]]. Consistently, CsA treatment has increased the survival rate in SMNKO mice and reduced the number of centrally located nuclei in skeletal muscle. This improvement in muscle health occurred independently of changes in CYPD protein levels, suggesting that CsA exerts its effect by inhibiting CYPD activity.
Besides inhibiting CYPD, CsA interacts with other cyclophilins. The binding of CsA to cyclophilin A inhibits a calcineurin-mediated immune response [90]. Calcineurin also plays a role in myotube formation and myocyte hypertrophy via the myogenic transcription factors MEF2 and MyoD [91]. Thus, the inhibition of calcineurin may explain the negative effect of CsA treatment on fiber size in SMNKO mice and WT littermates. In support of this notion, CsA treatment inhibits muscle cell differentiation in vitro and skeletal muscle regeneration after induced trauma in vivo [92]. Conversely, the immunosuppressive effect of CsA may play a positive role. We found an increased number of infiltrating macrophages in SMNKO mice at 6 and 8 weeks of age, and genes related to immune reactions were upregulated at 2 weeks of age. Inflammation is an integral part of the pathogenesis of muscular dystrophies such as DMD [93]. Thus, we cannot exclude the possibility that the positive effects of CsA treatment are due to its immunosuppressive effects.
Decreased NAD+ levels in the mdx mice may result in impaired mitochondrial volume and function. This hypothesis is supported by the fact that NR supplementation boosts protein levels of the OXPHOS complexes and CS activity in the skeletal muscle of mdx mice [18]. As we did not observe a decrease in the nuclear- and mitochondrial-encoded OXPHOS complexes, CS activity, or mitochondrial volume in SMNKO mice, where the reduction in NAD+ levels is much more severe, NAD+ depletion alone is unlikely to regulate the mitochondrial protein level. However, NAD+ certainly plays an essential role in mitochondrial function. Here, we observed the substantial impairment of mitochondrial oxygen consumption upon NAD+ depletion.
Our data support previous findings on the importance of NAMPT in skeletal muscle function [15]. However, SMNKO mice display a distinct phenotype regarding juvenile development, muscle function, and survival compared to the previously described muscle-specific Nampt knockout model. This difference could be due to the choice of Cre promoter. Postnatal human α-skeletal actin (HSA) is expressed across all muscle fiber types [94], whereas the expression of the myosin light-chain 1f (Mlc1f) promoter used previously [15] has a low expression in type I fibers, present in muscle types, such as the diaphragm and soleus [95]. A difference in KO efficiency in the diaphragm, where we see a severe effect measured by changes in ATP and glycogen levels, could potentially explain the observed variations in survival between the two knockout models.
The reduction in adiposity and RER in SMNKO mice suggest an increased reliance on lipid metabolism. This reliance could be due to a block in glycolysis in the NAD+-depleted muscles. In support of this possibility, glycogen levels were increased in the skeletal muscle from SMNKO mice. The chemical inhibition of NAMPT with FK866 blocks glycolysis at the level of GAPDH in C2C12 cells [15,16], whereas the stable knockdown of Nampt increases glycolysis [16]. Metabolomic analyses showed no alterations of intermediates in the distal part of the glycolytic pathway in response to the muscle-specific knockout of Nampt, suggesting no block in glycolysis [15]. This inconsistency could depend on the level of NAD+ left in the cell, as models with very low NAD+ levels, seen in the FK866 treated cells and the SMNKO mice, seem to have a common block in glycolysis [15].
The NR-enriched diet only increased NAD+ levels in the skeletal muscle of 4-week-old WT mice. This discovery is consistent with previous observations, which found that NAD+ levels in skeletal muscle are unaltered by supplementing NR in the drinking water [15]. A study with double-labeled NR demonstrated that orally administered NR only reached the skeletal muscle in the form of nicotinamide or NMN [11], and the bioavailability of NR for human skeletal muscle is debatable [96,97]. Despite the unaffected NAD+ levels, the NR-enriched diet increased ATP levels in both genotypes at 4 weeks of age and rescued fiber size, and also increased the appearance of centralized nuclei in SMNKO mice at 6 weeks of age. Similar positive effects of oral NR treatment were previously reported [15]. While NR may not affect NAD+ availability inside the fiber, it is interesting to note that NRK2 has been shown to interact with the integrin α7β1 complex [98] and that exogenous NAD+ is important for reducing muscle fiber degeneration and increases laminin organization in zebrafish skeletal muscle [99]. Thus, as NR is not detected in blood after oral administration [11], strategies to bypass the first-pass metabolism of NR could prove useful for improving sarcolemma integrity and muscle function in specific dystrophic conditions.
In conclusion, we demonstrate that NAMPT-mediated NAD+ biosynthesis constitutes the primary route of NAD+ salvaging in mouse skeletal muscle. Nampt deletion causes a profound loss of NAD+ in skeletal muscle, concomitant with reduced membrane integrity, altered Ca2+-homeostasis, and impaired mitochondrial function and integrity, which has fatal consequences for skeletal muscle development and survival.
Author contributions
ALB, MA, and JTT conceived and designed the experiments. MA, ALB, JF, ED, NØ, JN, JBJ, MD, RdG, TK, JV, AK, MK, and SB performed the experiments. MA, ALB, JF, ED, AA, NØ, JN, MD, RdG, RB, SB, SL, NJ, and JTT analyzed and interpreted the data. ALB and ED prepared the figures and drafted the manuscript. All authors read, revised, and approved the final manuscript. JTT is the guarantor of the work, has full access to all the data in the study, and takes responsibility for the integrity of the data and the accuracy of the data analysis.
Acknowledgement
We thank ChromaDex for its generous supply of NR. Transmission electron microscopy was performed at the Core Facility for Integrated Microscopy, Faculty of Health and Medical Sciences, University of Copenhagen. The authors would also like to thank Marianne M. Andersen at the Novo Nordisk Foundation Center for Basic Metabolic Research (CBMR) and the University of Copenhagen for excellent technical assistance. Mie Mechta, Mette Carlsen Mohr, and Lars Ingerslev from the Single-Cell Omics Platform at the CBMR are acknowledged for great technical and computational expertise and support. Finally, we would like to thank Juleen R. Zierath for valuable support as well as input and discussions during the preparation of this manuscript.
Support for this study was provided by the Novo Nordisk Foundation Center for Basic Metabolic Research (CBMR). CBMR is an independent Research Center at the University of Copenhagen that is partially funded by an unrestricted donation from the Novo Nordisk Foundation (NNF18CC0034900). This study was also funded by separate grants from the Novo Nordisk Foundation (Excellence Project Award NNF14OC0009315 to JTT and Challenge Grant NNF14OC0011493 to Juleen R. Zierath) from the Danish Council for Independent Research (Research Project Grant DFF 4004-00235 to JTT and DFF 5053-00195 to JF), and from the European Foundation for the Study of Diabetes (EFSD/Lilly Research Fellowship to JTT).
Footnotes
Supplementary data to this article can be found online at https://doi.org/10.1016/j.molmet.2021.101271.
Conflict of interest
None declared.
Appendix A. Supplementary data
The following is the supplementary data to this article:
References
- 1.Haigis M.C., Sinclair D.A. Mammalian sirtuins: biological insights and disease relevance. Annual Review of Pathology: Mechanisms of Disease. 2010;5:253–295. doi: 10.1146/annurev.pathol.4.110807.092250. [DOI] [PMC free article] [PubMed] [Google Scholar]
- 2.Canto C., Sauve A.A., Bai P. Crosstalk between poly(ADP-ribose) polymerase and sirtuin enzymes. Molecular Aspects of Medicine. 2013;34(6):1168–1201. doi: 10.1016/j.mam.2013.01.004. [DOI] [PMC free article] [PubMed] [Google Scholar]
- 3.Gibson B.A., Kraus W.L. New insights into the molecular and cellular functions of poly(ADP-ribose) and PARPs. Nature Reviews Molecular Cell Biology. 2012;13(7):411–424. doi: 10.1038/nrm3376. [DOI] [PubMed] [Google Scholar]
- 4.Malavasi F., Deaglio S., Funaro A., Ferrero E., Horenstein A.L., Ortolan E. Evolution and function of the ADP ribosyl cyclase/CD38 gene family in physiology and pathology. Physiological Reviews. 2008;88(3):841–886. doi: 10.1152/physrev.00035.2007. [DOI] [PubMed] [Google Scholar]
- 5.Houtkooper R.H., Canto C., Wanders R.J., Auwerx J. The secret life of NAD+: an old metabolite controlling new metabolic signaling pathways. Endocrine Reviews. 2010;31(2):194–223. doi: 10.1210/er.2009-0026. [DOI] [PMC free article] [PubMed] [Google Scholar]
- 6.Partida-Sanchez S., Cockayne D.A., Monard S., Jacobson E.L., Oppenheimer N., Garvy B. Cyclic ADP-ribose production by CD38 regulates intracellular calcium release, extracellular calcium influx and chemotaxis in neutrophils and is required for bacterial clearance in vivo. Natural Medicines. 2001;7(11):1209–1216. doi: 10.1038/nm1101-1209. [DOI] [PubMed] [Google Scholar]
- 7.Masri S., Cervantes M., Sassone-Corsi P. The circadian clock and cell cycle: interconnected biological circuits. Current Opinion in Cell Biology. 2013;25(6):730–734. doi: 10.1016/j.ceb.2013.07.013. [DOI] [PMC free article] [PubMed] [Google Scholar]
- 8.Bogan K.L., Brenner C. Nicotinic acid, nicotinamide, and nicotinamide riboside: a molecular evaluation of NAD+ precursor vitamins in human nutrition. Annual Review of Nutrition. 2008;28:115–130. doi: 10.1146/annurev.nutr.28.061807.155443. [DOI] [PubMed] [Google Scholar]
- 9.Fletcher R.S., Ratajczak J., Doig C.L., Oakey L.A., Callingham R., Da Silva Xavier G. Nicotinamide riboside kinases display redundancy in mediating nicotinamide mononucleotide and nicotinamide riboside metabolism in skeletal muscle cells. Molecular Metabolism. 2017;6(8):819–832. doi: 10.1016/j.molmet.2017.05.011. [DOI] [PMC free article] [PubMed] [Google Scholar]
- 10.Stein L.R., Imai S. The dynamic regulation of NAD metabolism in mitochondria. Trends in Endocrinology and Metabolism. 2012;23(9):420–428. doi: 10.1016/j.tem.2012.06.005. [DOI] [PMC free article] [PubMed] [Google Scholar]
- 11.Liu L., Su X., Quinn W.J., 3rd, Hui S., Krukenberg K., Frederick D.W. Quantitative analysis of NAD synthesis-breakdown fluxes. Cell Metabolism. 2018;27(5):1067–1080. doi: 10.1016/j.cmet.2018.03.018. e1065. [DOI] [PMC free article] [PubMed] [Google Scholar]
- 12.Rongvaux A., Shea R.J., Mulks M.H., Gigot D., Urbain J., Leo O. Pre-B-cell colony-enhancing factor, whose expression is up-regulated in activated lymphocytes, is a nicotinamide phosphoribosyltransferase, a cytosolic enzyme involved in NAD biosynthesis. European Journal of Immunology. 2002;32(11):3225–3234. doi: 10.1002/1521-4141(200211)32:11<3225::AID-IMMU3225>3.0.CO;2-L. [DOI] [PubMed] [Google Scholar]
- 13.Revollo J.R., Korner A., Mills K.F., Satoh A., Wang T., Garten A. Nampt/PBEF/Visfatin regulates insulin secretion in beta cells as a systemic NAD biosynthetic enzyme. Cell Metabolism. 2007;6(5):363–375. doi: 10.1016/j.cmet.2007.09.003. [DOI] [PMC free article] [PubMed] [Google Scholar]
- 14.Berger F., Lau C., Dahlmann M., Ziegler M. Subcellular compartmentation and differential catalytic properties of the three human nicotinamide mononucleotide adenylyltransferase isoforms. Journal of Biological Chemistry. 2005;280(43):36334–36341. doi: 10.1074/jbc.M508660200. [DOI] [PubMed] [Google Scholar]
- 15.Frederick D.W., Loro E., Liu L., Davila A., Jr., Chellappa K., Silverman I.M. Loss of NAD homeostasis leads to progressive and reversible degeneration of skeletal muscle. Cell Metabolism. 2016;24(2):269–282. doi: 10.1016/j.cmet.2016.07.005. [DOI] [PMC free article] [PubMed] [Google Scholar]
- 16.Agerholm M., Dall M., Jensen B.A.H., Prats C., Madsen S., Basse A.L. Perturbations of NAD(+) salvage systems impact mitochondrial function and energy homeostasis in mouse myoblasts and intact skeletal muscle. American Journal of Physiology. Endocrinology and Metabolism. 2018;314(4):E377–E395. doi: 10.1152/ajpendo.00213.2017. [DOI] [PubMed] [Google Scholar]
- 17.Ryder S., Leadley R.M., Armstrong N., Westwood M., de Kock S., Butt T. The burden, epidemiology, costs and treatment for Duchenne muscular dystrophy: an evidence review. Orphanet Journal of Rare Diseases. 2017;12(1):79. doi: 10.1186/s13023-017-0631-3. [DOI] [PMC free article] [PubMed] [Google Scholar]
- 18.Ryu D., Zhang H., Ropelle E.R., Sorrentino V., Mazala D.A., Mouchiroud L. NAD+ repletion improves muscle function in muscular dystrophy and counters global PARylation. Science Translational Medicine. 2016;8(361):361ra139. doi: 10.1126/scitranslmed.aaf5504. [DOI] [PMC free article] [PubMed] [Google Scholar]
- 19.Khan N.A., Auranen M., Paetau I., Pirinen E., Euro L., Forsstrom S. Effective treatment of mitochondrial myopathy by nicotinamide riboside, a vitamin B3. EMBO Molecular Medicine. 2014;6(6):721–731. doi: 10.1002/emmm.201403943. [DOI] [PMC free article] [PubMed] [Google Scholar]
- 20.Briston T., Selwood D.L., Szabadkai G., Duchen M.R. Mitochondrial permeability transition: a molecular lesion with multiple drug targets. Trends in Pharmacological Sciences. 2019;40(1):50–70. doi: 10.1016/j.tips.2018.11.004. [DOI] [PubMed] [Google Scholar]
- 21.Hurst S., Hoek J., Sheu S.S. Mitochondrial Ca(2+) and regulation of the permeability transition pore. Journal of Bioenergetics and Biomembranes. 2017;49(1):27–47. doi: 10.1007/s10863-016-9672-x. [DOI] [PMC free article] [PubMed] [Google Scholar]
- 22.Kharechkina E.S., Nikiforova A.B., Teplova V.V., Odinokova I.V., Krestinina O.V., Baburina Y.L. Regulation of permeability transition pore opening in mitochondria by external NAD(H) Biochimica et Biophysica Acta (BBA) - General Subjects. 2019;1863(5):771–783. doi: 10.1016/j.bbagen.2019.01.003. [DOI] [PubMed] [Google Scholar]
- 23.Lee C.F., Chavez J.D., Garcia-Menendez L., Choi Y., Roe N.D., Chiao Y.A. Normalization of NAD+ redox balance as a therapy for heart failure. Circulation. 2016;134(12):883–894. doi: 10.1161/CIRCULATIONAHA.116.022495. [DOI] [PMC free article] [PubMed] [Google Scholar]
- 24.Hafner A.V., Dai J., Gomes A.P., Xiao C.Y., Palmeira C.M., Rosenzweig A. Regulation of the mPTP by SIRT3-mediated deacetylation of CypD at lysine 166 suppresses age-related cardiac hypertrophy. Aging. 2010;2(12):914–923. doi: 10.18632/aging.100252. [DOI] [PMC free article] [PubMed] [Google Scholar]
- 25.Schwander M., Leu M., Stumm M., Dorchies O.M., Ruegg U.T., Schittny J. Beta1 integrins regulate myoblast fusion and sarcomere assembly. Developmental Cell. 2003;4(5):673–685. doi: 10.1016/s1534-5807(03)00118-7. [DOI] [PubMed] [Google Scholar]
- 26.Shi H., Munk A., Nielsen T.S., Daughtry M.R., Larsson L., Li S. Skeletal muscle O-GlcNAc transferase is important for muscle energy homeostasis and whole-body insulin sensitivity. Molecular Metabolism. 2018;11:160–177. doi: 10.1016/j.molmet.2018.02.010. [DOI] [PMC free article] [PubMed] [Google Scholar]
- 27.Dall M., Penke M., Sulek K., Matz-Soja M., Holst B., Garten A. Hepatic NAD(+) levels and NAMPT abundance are unaffected during prolonged high-fat diet consumption in C57BL/6JBomTac mice. Molecular and Cellular Endocrinology. 2018;473:245–256. doi: 10.1016/j.mce.2018.01.025. [DOI] [PubMed] [Google Scholar]
- 28.Basse A.L., Dalbram E., Larsson L., Gerhart-Hines Z., Zierath J.R., Treebak J.T. Skeletal muscle insulin sensitivity show circadian rhythmicity which is independent of exercise training status. Frontiers in Physiology. 2018;9:1198. doi: 10.3389/fphys.2018.01198. [DOI] [PMC free article] [PubMed] [Google Scholar]
- 29.Smith L.R., Barton E.R. SMASH - semi-automatic muscle analysis using segmentation of histology: a MATLAB application. Skeletal Muscle. 2014;4:21. doi: 10.1186/2044-5040-4-21. [DOI] [PMC free article] [PubMed] [Google Scholar]
- 30.Henriquez-Olguin C., Knudsen J.R., Raun S.H., Li Z., Dalbram E., Treebak J.T. Cytosolic ROS production by NADPH oxidase 2 regulates muscle glucose uptake during exercise. Nature Communications. 2019;10(1):4623. doi: 10.1038/s41467-019-12523-9. [DOI] [PMC free article] [PubMed] [Google Scholar]
- 31.Ørtenblad N., Macdonald W.A., Sahlin K. Glycolysis in contracting rat skeletal muscle is controlled by factors related to energy state. Biochemical Journal. 2009;420(2):161–168. doi: 10.1042/BJ20082135. [DOI] [PubMed] [Google Scholar]
- 32.Harris R.C., Hultman E., Nordesjo L.O. Glycogen, glycolytic intermediates and high-energy phosphates determined in biopsy samples of musculus quadriceps femoris of man at rest. Methods and variance of values. Scandinavian Journal of Clinical & Laboratory Investigation. 1974;33(2):109–120. [PubMed] [Google Scholar]
- 33.Lowry O.H., Passonneau J.V. Academic Press; New York: 1972. A flexible system of enzymatic analysis. [Google Scholar]
- 34.Pesta D., Gnaiger E. High-resolution respirometry: OXPHOS protocols for human cells and permeabilized fibers from small biopsies of human muscle. Methods in Molecular Biology. 2012;810:25–58. doi: 10.1007/978-1-61779-382-0_3. [DOI] [PubMed] [Google Scholar]
- 35.Weibel E.R. Academic Press; London ; New York: 1979. Stereological methods. [Google Scholar]
- 36.Tonkonogi M., Sahlin K. Rate of oxidative phosphorylation in isolated mitochondria from human skeletal muscle: effect of training status. Acta Physiologica Scandinavica. 1997;161(3):345–353. doi: 10.1046/j.1365-201X.1997.00222.x. [DOI] [PubMed] [Google Scholar]
- 37.Wang X., Du H., Shao S., Bo T., Yu C., Chen W. Cyclophilin D deficiency attenuates mitochondrial perturbation and ameliorates hepatic steatosis. Hepatology. 2018;68(1):62–77. doi: 10.1002/hep.29788. [DOI] [PubMed] [Google Scholar]
- 38.Magnone M., Bauer I., Poggi A., Mannino E., Sturla L., Brini M. NAD+ levels control Ca2+ store replenishment and mitogen-induced increase of cytosolic Ca2+ by Cyclic ADP-ribose-dependent TRPM2 channel gating in human T lymphocytes. Journal of Biological Chemistry. 2012;287(25):21067–21081. doi: 10.1074/jbc.M111.324269. [DOI] [PMC free article] [PubMed] [Google Scholar]
- 39.Ørtenblad N., Lunde P.K., Levin K., Andersen J.L., Pedersen P.K. Enhanced sarcoplasmic reticulum Ca(2+) release following intermittent sprint training. American Journal of Physiology - Regulatory, Integrative and Comparative Physiology. 2000;279(1):R152–R160. doi: 10.1152/ajpregu.2000.279.1.R152. [DOI] [PubMed] [Google Scholar]
- 40.Dobin A., Davis C.A., Schlesinger F., Drenkow J., Zaleski C., Jha S. STAR: ultrafast universal RNA-seq aligner. Bioinformatics. 2013;29(1):15–21. doi: 10.1093/bioinformatics/bts635. [DOI] [PMC free article] [PubMed] [Google Scholar]
- 41.Liao Y., Smyth G.K., Shi W. featureCounts: an efficient general purpose program for assigning sequence reads to genomic features. Bioinformatics. 2014;30(7):923–930. doi: 10.1093/bioinformatics/btt656. [DOI] [PubMed] [Google Scholar]
- 42.Frankish A., Diekhans M., Ferreira A.M., Johnson R., Jungreis I., Loveland J. GENCODE reference annotation for the human and mouse genomes. Nucleic Acids Research. 2019;47(D1):D766–D773. doi: 10.1093/nar/gky955. [DOI] [PMC free article] [PubMed] [Google Scholar]
- 43.Robinson M.D., McCarthy D.J., Smyth G.K. edgeR: a Bioconductor package for differential expression analysis of digital gene expression data. Bioinformatics. 2010;26(1):139–140. doi: 10.1093/bioinformatics/btp616. [DOI] [PMC free article] [PubMed] [Google Scholar]
- 44.Yu G., Wang L.G., Han Y., He Q.Y. clusterProfiler: an R package for comparing biological themes among gene clusters. OMICS. 2012;16(5):284–287. doi: 10.1089/omi.2011.0118. [DOI] [PMC free article] [PubMed] [Google Scholar]
- 45.Murtagh F., Legendre P. Ward's hierarchical agglomerative clustering method: which algorithms implement ward's criterion? Journal of Classification. 2014;31(3):274–295. [Google Scholar]
- 46.Yaman O., Dalbayrak S. Kyphosis and review of the literature. Turkish Neurosurgery. 2014;24(4):455–465. doi: 10.5137/1019-5149.JTN.8940-13.0. [DOI] [PubMed] [Google Scholar]
- 47.Stromland O., Niere M., Nikiforov A.A., VanLinden M.R., Heiland I., Ziegler M. Keeping the balance in NAD metabolism. Biochemical Society Transactions. 2019;47(1):119–130. doi: 10.1042/BST20180417. [DOI] [PubMed] [Google Scholar]
- 48.Kopinke D., Roberson E.C., Reiter J.F. Ciliary hedgehog signaling restricts injury-induced adipogenesis. Cell. 2017;170(2):340–351. doi: 10.1016/j.cell.2017.06.035. e312. [DOI] [PMC free article] [PubMed] [Google Scholar]
- 49.Lepper C., Partridge T.A., Fan C.M. An absolute requirement for Pax7-positive satellite cells in acute injury-induced skeletal muscle regeneration. Development. 2011;138(17):3639–3646. doi: 10.1242/dev.067595. [DOI] [PMC free article] [PubMed] [Google Scholar]
- 50.von Maltzahn J., Jones A.E., Parks R.J., Rudnicki M.A. Pax7 is critical for the normal function of satellite cells in adult skeletal muscle. Proceedings of the National Academy of Sciences of the United States of America. 2013;110(41):16474–16479. doi: 10.1073/pnas.1307680110. [DOI] [PMC free article] [PubMed] [Google Scholar]
- 51.Gawlik K.I., Holmberg J., Durbeej M. Loss of dystrophin and beta-sarcoglycan significantly exacerbates the phenotype of laminin alpha2 chain-deficient animals. American Journal Of Pathology. 2014;184(3):740–752. doi: 10.1016/j.ajpath.2013.11.017. [DOI] [PubMed] [Google Scholar]
- 52.Arnold L., Henry A., Poron F., Baba-Amer Y., van Rooijen N., Plonquet A. Inflammatory monocytes recruited after skeletal muscle injury switch into antiinflammatory macrophages to support myogenesis. Journal of Experimental Medicine. 2007;204(5):1057–1069. doi: 10.1084/jem.20070075. [DOI] [PMC free article] [PubMed] [Google Scholar]
- 53.Heredia J.E., Mukundan L., Chen F.M., Mueller A.A., Deo R.C., Locksley R.M. Type 2 innate signals stimulate fibro/adipogenic progenitors to facilitate muscle regeneration. Cell. 2013;153(2):376–388. doi: 10.1016/j.cell.2013.02.053. [DOI] [PMC free article] [PubMed] [Google Scholar]
- 54.Luo N., Yue F., Jia Z., Chen J., Deng Q., Zhao Y. Reduced electron transport chain complex I protein abundance and function in Mfn2-deficient myogenic progenitors lead to oxidative stress and mitochondria swelling. The FASEB Journal. 2021;35(4) doi: 10.1096/fj.202002464R. [DOI] [PMC free article] [PubMed] [Google Scholar]
- 55.Bandara A.B., Drake J.C., James C.C., Smyth J.W., Brown D.A. Complex I protein NDUFS2 is vital for growth, ROS generation, membrane integrity, apoptosis, and mitochondrial energetics. Mitochondrion. 2021;58:160–168. doi: 10.1016/j.mito.2021.03.003. [DOI] [PMC free article] [PubMed] [Google Scholar]
- 56.Eisenberg B.R., Kuda A.M. Discrimination between fiber populations in mammalian skeletal muscle by using ultrastructural parameters. Journal of Ultrastructure Research. 1976;54(1):76–88. doi: 10.1016/s0022-5320(76)80010-x. [DOI] [PubMed] [Google Scholar]
- 57.Bonaldo P., Sandri M. Cellular and molecular mechanisms of muscle atrophy. Disease Models Mechanisms. 2013;6(1):25–39. doi: 10.1242/dmm.010389. [DOI] [PMC free article] [PubMed] [Google Scholar]
- 58.Bujak A.L., Crane J.D., Lally J.S., Ford R.J., Kang S.J., Rebalka I.A. AMPK activation of muscle autophagy prevents fasting-induced hypoglycemia and myopathy during aging. Cell Metabolism. 2015;21(6):883–890. doi: 10.1016/j.cmet.2015.05.016. [DOI] [PMC free article] [PubMed] [Google Scholar]
- 59.Egan D.F., Shackelford D.B., Mihaylova M.M., Gelino S., Kohnz R.A., Mair W. Phosphorylation of ULK1 (hATG1) by AMP-activated protein kinase connects energy sensing to mitophagy. Science. 2011;331(6016):456–461. doi: 10.1126/science.1196371. [DOI] [PMC free article] [PubMed] [Google Scholar]
- 60.Kabeya Y., Mizushima N., Ueno T., Yamamoto A., Kirisako T., Noda T. LC3, a mammalian homologue of yeast Apg8p, is localized in autophagosome membranes after processing. The EMBO Journal. 2000;19(21):5720–5728. doi: 10.1093/emboj/19.21.5720. [DOI] [PMC free article] [PubMed] [Google Scholar]
- 61.O'Neal T.J., Friend D.M., Guo J., Hall K.D., Kravitz A.V. Increases in physical activity result in diminishing increments in daily energy expenditure in mice. Current Biology. 2017;27(3):423–430. doi: 10.1016/j.cub.2016.12.009. [DOI] [PMC free article] [PubMed] [Google Scholar]
- 62.Carrasco M.A., Riveros N., Rios J., Muller M., Torres F., Pineda J. Depolarization-induced slow calcium transients activate early genes in skeletal muscle cells. American Journal of Physiology - Cell Physiology. 2003;284(6):C1438–C1447. doi: 10.1152/ajpcell.00117.2002. [DOI] [PubMed] [Google Scholar]
- 63.Yoshida M., Minamisawa S., Shimura M., Komazaki S., Kume H., Zhang M. Impaired Ca2+ store functions in skeletal and cardiac muscle cells from sarcalumenin-deficient mice. Journal of Biological Chemistry. 2005;280(5):3500–3506. doi: 10.1074/jbc.M406618200. [DOI] [PubMed] [Google Scholar]
- 64.Hughes E., Clayton J.C., Kitmitto A., Esmann M., Middleton D.A. Solid-state NMR and functional measurements indicate that the conserved tyrosine residues of sarcolipin are involved directly in the inhibition of SERCA1. Journal of Biological Chemistry. 2007;282(36):26603–26613. doi: 10.1074/jbc.M611668200. [DOI] [PubMed] [Google Scholar]
- 65.Zimecki M., Kaczmarek K. Effects of modifications on the immunosuppressive properties of cyclolinopeptide A and its analogs in animal experimental models. Molecules. 2021;26(9) doi: 10.3390/molecules26092538. [DOI] [PMC free article] [PubMed] [Google Scholar]
- 66.Coffey P.J., Girman S., Wang S.M., Hetherington L., Keegan D.J., Adamson P. Long-term preservation of cortically dependent visual function in RCS rats by transplantation. Nature Neuroscience. 2002;5(1):53–56. doi: 10.1038/nn782. [DOI] [PubMed] [Google Scholar]
- 67.Huang R., Baranov P., Lai K., Zhang X., Ge J., Young M.J. Functional and morphological analysis of the subretinal injection of human retinal progenitor cells under Cyclosporin A treatment. Molecular Vision. 2014;20:1271–1280. [PMC free article] [PubMed] [Google Scholar]
- 68.Migliavacca E., Tay S.K.H., Patel H.P., Sonntag T., Civiletto G., McFarlane C. Mitochondrial oxidative capacity and NAD(+) biosynthesis are reduced in human sarcopenia across ethnicities. Nature Communications. 2019;10(1):5808. doi: 10.1038/s41467-019-13694-1. [DOI] [PMC free article] [PubMed] [Google Scholar]
- 69.Thada P.K., Bhandari J., Umapathi K.K. StatPearls: Treasure Island (FL); 2020. Becker muscular dystrophy. [PubMed] [Google Scholar]
- 70.Statland J.M., Fontaine B., Hanna M.G., Johnson N.E., Kissel J.T., Sansone V.A. Review of the diagnosis and treatment of periodic paralysis. Muscle & Nerve. 2018;57(4):522–530. doi: 10.1002/mus.26009. [DOI] [PMC free article] [PubMed] [Google Scholar]
- 71.Ptacek L.J., Tawil R., Griggs R.C., Engel A.G., Layzer R.B., Kwiecinski H. Dihydropyridine receptor mutations cause hypokalemic periodic paralysis. Cell. 1994;77(6):863–868. doi: 10.1016/0092-8674(94)90135-x. [DOI] [PubMed] [Google Scholar]
- 72.Fueger P.T., Shearer J., Krueger T.M., Posey K.A., Bracy D.P., Heikkinen S. Hexokinase II protein content is a determinant of exercise endurance capacity in the mouse. The Journal of Physiology. 2005;566(Pt 2):533–541. doi: 10.1113/jphysiol.2005.085043. [DOI] [PMC free article] [PubMed] [Google Scholar]
- 73.Katsyuba E., Auwerx J. Modulating NAD(+) metabolism, from bench to bedside. The EMBO Journal. 2017;36(18):2670–2683. doi: 10.15252/embj.201797135. [DOI] [PMC free article] [PubMed] [Google Scholar]
- 74.Yoshino J., Baur J.A., Imai S.I. NAD(+) intermediates: the biology and therapeutic potential of NMN and NR. Cell Metabolism. 2018;27(3):513–528. doi: 10.1016/j.cmet.2017.11.002. [DOI] [PMC free article] [PubMed] [Google Scholar]
- 75.Toral-Ojeda I., Aldanondo G., Lasa-Elgarresta J., Lasa-Fernandez H., Fernandez-Torron R., Lopez de Munain A. Calpain 3 deficiency affects SERCA expression and function in the skeletal muscle. Expert Reviews in Molecular Medicine. 2016;18:e7. doi: 10.1017/erm.2016.9. [DOI] [PMC free article] [PubMed] [Google Scholar]
- 76.Voit A., Patel V., Pachon R., Shah V., Bakhutma M., Kohlbrenner E. Reducing sarcolipin expression mitigates Duchenne muscular dystrophy and associated cardiomyopathy in mice. Nature Communications. 2017;8(1):1068. doi: 10.1038/s41467-017-01146-7. [DOI] [PMC free article] [PubMed] [Google Scholar]
- 77.Goonasekera S.A., Lam C.K., Millay D.P., Sargent M.A., Hajjar R.J., Kranias E.G. Mitigation of muscular dystrophy in mice by SERCA overexpression in skeletal muscle. Journal of Clinical Investigation. 2011;121(3):1044–1052. doi: 10.1172/JCI43844. [DOI] [PMC free article] [PubMed] [Google Scholar]
- 78.Mazala D.A., Pratt S.J.P., Chen D., Molkentin J.D., Lovering R.M., Chin E.R. SERCA1 overexpression minimizes skeletal muscle damage in dystrophic mouse models. American Journal of Physiology - Cell Physiology. 2015;308(9):C699–C709. doi: 10.1152/ajpcell.00341.2014. [DOI] [PMC free article] [PubMed] [Google Scholar]
- 79.Dong Z., Saikumar P., Weinberg J.M., Venkatachalam M.A. Calcium in cell injury and death. Annual Review of Pathology: Mechanisms of Disease. 2006;1:405–434. doi: 10.1146/annurev.pathol.1.110304.100218. [DOI] [PubMed] [Google Scholar]
- 80.Michailova A., McCulloch A. Model study of ATP and ADP buffering, transport of Ca(2+) and Mg(2+), and regulation of ion pumps in ventricular myocyte. Biophysical Journal. 2001;81(2):614–629. doi: 10.1016/S0006-3495(01)75727-X. [DOI] [PMC free article] [PubMed] [Google Scholar]
- 81.Pauly M., Daussin F., Burelle Y., Li T., Godin R., Fauconnier J. AMPK activation stimulates autophagy and ameliorates muscular dystrophy in the mdx mouse diaphragm. American Journal Of Pathology. 2012;181(2):583–592. doi: 10.1016/j.ajpath.2012.04.004. [DOI] [PubMed] [Google Scholar]
- 82.Millay D.P., Goonasekera S.A., Sargent M.A., Maillet M., Aronow B.J., Molkentin J.D. Calcium influx is sufficient to induce muscular dystrophy through a TRPC-dependent mechanism. Proceedings of the National Academy of Sciences of the United States of America. 2009;106(45):19023–19028. doi: 10.1073/pnas.0906591106. [DOI] [PMC free article] [PubMed] [Google Scholar]
- 83.Zolkiewska A., Moss J. Processing of ADP-ribosylated integrin alpha 7 in skeletal muscle myotubes. Journal of Biological Chemistry. 1995;270(16):9227–9233. doi: 10.1074/jbc.270.16.9227. [DOI] [PubMed] [Google Scholar]
- 84.Zhao Z., Gruszczynska-Biegala J., Zolkiewska A. ADP-ribosylation of integrin alpha7 modulates the binding of integrin alpha7beta1 to laminin. Biochemical Journal. 2005;385(Pt 1):309–317. doi: 10.1042/BJ20040590. [DOI] [PMC free article] [PubMed] [Google Scholar]
- 85.Gineste C., Hernandez A., Ivarsson N., Cheng A.J., Naess K., Wibom R. Cyclophilin D, a target for counteracting skeletal muscle dysfunction in mitochondrial myopathy. Human Molecular Genetics. 2015;24(23):6580–6587. doi: 10.1093/hmg/ddv361. [DOI] [PMC free article] [PubMed] [Google Scholar]
- 86.Gattazzo F., Molon S., Morbidoni V., Braghetta P., Blaauw B., Urciuolo A. Cyclosporin A promotes in vivo myogenic response in collagen VI-deficient myopathic mice. Frontiers in Aging Neuroscience. 2014;6:244. doi: 10.3389/fnagi.2014.00244. [DOI] [PMC free article] [PubMed] [Google Scholar]
- 87.Merlini L., Angelin A., Tiepolo T., Braghetta P., Sabatelli P., Zamparelli A. Cyclosporin A corrects mitochondrial dysfunction and muscle apoptosis in patients with collagen VI myopathies. Proceedings of the National Academy of Sciences of the United States of America. 2008;105(13):5225–5229. doi: 10.1073/pnas.0800962105. [DOI] [PMC free article] [PubMed] [Google Scholar]
- 88.Tiepolo T., Angelin A., Palma E., Sabatelli P., Merlini L., Nicolosi L. The cyclophilin inhibitor Debio 025 normalizes mitochondrial function, muscle apoptosis and ultrastructural defects in Col6a1-/- myopathic mice. British Journal of Pharmacology. 2009;157(6):1045–1052. doi: 10.1111/j.1476-5381.2009.00316.x. [DOI] [PMC free article] [PubMed] [Google Scholar]
- 89.Millay D.P., Sargent M.A., Osinska H., Baines C.P., Barton E.R., Vuagniaux G. Genetic and pharmacologic inhibition of mitochondrial-dependent necrosis attenuates muscular dystrophy. Natural Medicines. 2008;14(4):442–447. doi: 10.1038/nm1736. [DOI] [PMC free article] [PubMed] [Google Scholar]
- 90.Liu J., Farmer J.D., Jr., Lane W.S., Friedman J., Weissman I., Schreiber S.L. Calcineurin is a common target of cyclophilin-cyclosporin A and FKBP-FK506 complexes. Cell. 1991;66(4):807–815. doi: 10.1016/0092-8674(91)90124-h. [DOI] [PubMed] [Google Scholar]
- 91.Schulz R.A., Yutzey K.E. Calcineurin signaling and NFAT activation in cardiovascular and skeletal muscle development. Developmental Biology. 2004;266(1):1–16. doi: 10.1016/j.ydbio.2003.10.008. [DOI] [PubMed] [Google Scholar]
- 92.Abbott K.L., Friday B.B., Thaloor D., Murphy T.J., Pavlath G.K. Activation and cellular localization of the cyclosporine A-sensitive transcription factor NF-AT in skeletal muscle cells. Molecular Biology of the Cell. 1998;9(10):2905–2916. doi: 10.1091/mbc.9.10.2905. [DOI] [PMC free article] [PubMed] [Google Scholar]
- 93.Rosenberg A.S., Puig M., Nagaraju K., Hoffman E.P., Villalta S.A., Rao V.A. Immune-mediated pathology in Duchenne muscular dystrophy. Science Translational Medicine. 2015;7(299) doi: 10.1126/scitranslmed.aaa7322. 299rv294. [DOI] [PMC free article] [PubMed] [Google Scholar]
- 94.Miniou P., Tiziano D., Frugier T., Roblot N., Le Meur M., Melki J. Gene targeting restricted to mouse striated muscle lineage. Nucleic Acids Research. 1999;27(19):e27. doi: 10.1093/nar/27.19.e27. [DOI] [PMC free article] [PubMed] [Google Scholar]
- 95.Kelly R., Alonso S., Tajbakhsh S., Cossu G., Buckingham M. Myosin light chain 3F regulatory sequences confer regionalized cardiac and skeletal muscle expression in transgenic mice. The Journal of Cell Biology. 1995;129(2):383–396. doi: 10.1083/jcb.129.2.383. [DOI] [PMC free article] [PubMed] [Google Scholar]
- 96.Dollerup O.L., Chubanava S., Agerholm M., Sondergard S.D., Altintas A., Moller A.B. Nicotinamide riboside does not alter mitochondrial respiration, content or morphology in skeletal muscle from obese and insulin-resistant men. The Journal of Physiology. 2020;598(4):731–754. doi: 10.1113/JP278752. [DOI] [PubMed] [Google Scholar]
- 97.Trammell S.A., Schmidt M.S., Weidemann B.J., Redpath P., Jaksch F., Dellinger R.W. Nicotinamide riboside is uniquely and orally bioavailable in mice and humans. Nature Communications. 2016;7:12948. doi: 10.1038/ncomms12948. [DOI] [PMC free article] [PubMed] [Google Scholar]
- 98.Goody M.F., Kelly M.W., Lessard K.N., Khalil A., Henry C.A. Nrk2b-mediated NAD+ production regulates cell adhesion and is required for muscle morphogenesis in vivo: Nrk2b and NAD+ in muscle morphogenesis. Developmental Biology. 2010;344(2):809–826. doi: 10.1016/j.ydbio.2010.05.513. [DOI] [PMC free article] [PubMed] [Google Scholar]
- 99.Goody M.F., Kelly M.W., Reynolds C.J., Khalil A., Crawford B.D., Henry C.A. NAD+ biosynthesis ameliorates a zebrafish model of muscular dystrophy. PLoS Biology. 2012;10(10) doi: 10.1371/journal.pbio.1001409. [DOI] [PMC free article] [PubMed] [Google Scholar]
Associated Data
This section collects any data citations, data availability statements, or supplementary materials included in this article.
Supplementary Materials
Data Availability Statement
The RNAseq dataset generated during this study is publicly available on the GEO database with the accession number: GSE147453.