Significance Statement
Stagnating long-term outcomes are a persistent obstacle for the transplant community, but surprisingly, large contemporary studies investigating the causes of graft failure are rare. However, it is obvious that a thorough analysis of graft failures is the first step to improve outcomes. A study that is on the basis of a database designed and implemented for kidney transplant recipients over 20 years ago and an active effort to keep allograft recipients in the post-transplant care program reveals previously overlooked information that leads to insights into the complexity of allograft failure. These include the effect of T cell–mediated rejection, the role of antibody-mediated rejection in late graft failure, and the influence of recipient age on the causes of graft failure.
Keywords: transplantation, chronic allograft failure, clinical nephrology, transplant outcomes, transplant pathology
Visual Abstract
Abstract
Background
Few studies have thoroughly investigated the causes of kidney graft loss (GL), despite its importance.
Methods
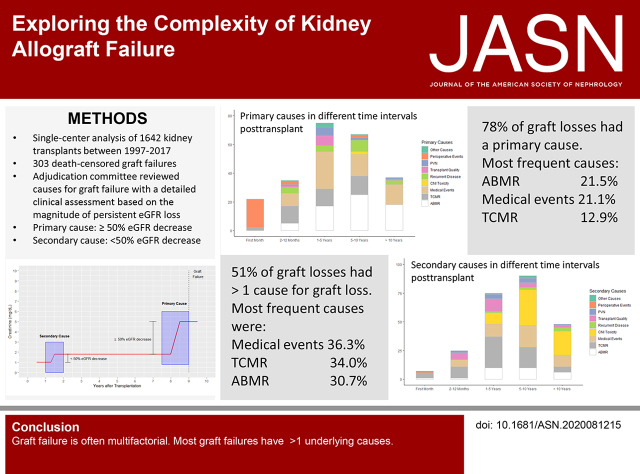
A novel approach assigns each persistent and relevant decline in renal function over the lifetime of a renal allograft to a standardized category, hypothesizing that singular or multiple events finally lead to GL. An adjudication committee of three physicians retrospectively evaluated indication biopsies, laboratory testing, and medical history of all 303 GLs among all 1642 recipients of transplants between January 1, 1997 and December 31, 2017 at a large university hospital to assign primary and/or secondary causes of GL.
Results
In 51.2% of the patients, more than one cause contributed to GL. The most frequent primary or secondary causes leading to graft failure were intercurrent medical events in 36.3% of graft failures followed by T cell–mediated rejection (TCMR) in 34% and antibody-mediated rejection (ABMR) in 30.7%. In 77.9%, a primary cause could be attributed to GL, of which ABMR was most frequent (21.5%). Many causes for GL were identified, and predominant causes for GL varied over time.
Conclusions
GL is often multifactorial and more complex than previously thought.
Compared with maintenance dialysis, kidney transplantation is associated with a higher life expectancy and a better quality of life, and therefore, it is the treatment of choice for most patients with ESKD.1–5 In contrast to improvements of short-term survival, usually defined as up to 1 year after transplantation, long-term graft survival remains unsatisfactory, with only marginal improvements over the past decades.6,7 Despite its importance, it is surprising to see that only a few studies have investigated causes for graft loss (GL) in greater detail. Recently, some studies evaluated the causes for death-censored kidney allograft loss, with rejection (18%–64%) and glomerular disease (8%–37%) as the leading causes.8–12 Because of heterogeneous definitions of causes for graft failure, relatively small cohorts, limited availability of kidney transplant biopsies, and a variable and incomplete follow-up, it is difficult to compare the results of these studies. Additionally, in most studies only one cause has been assigned to GL, not taking into account potentially multifactorial reasons, as already suggested, especially for long-term allograft failure.10 The aim of this study is to bring light into the complex process of death-censored kidney allograft failure on the basis of clear a priori well-defined categories in a large cohort, with complete follow-up in a 20-year-period and a lifelong close monitoring of patients after transplantation.
Methods
Study Design
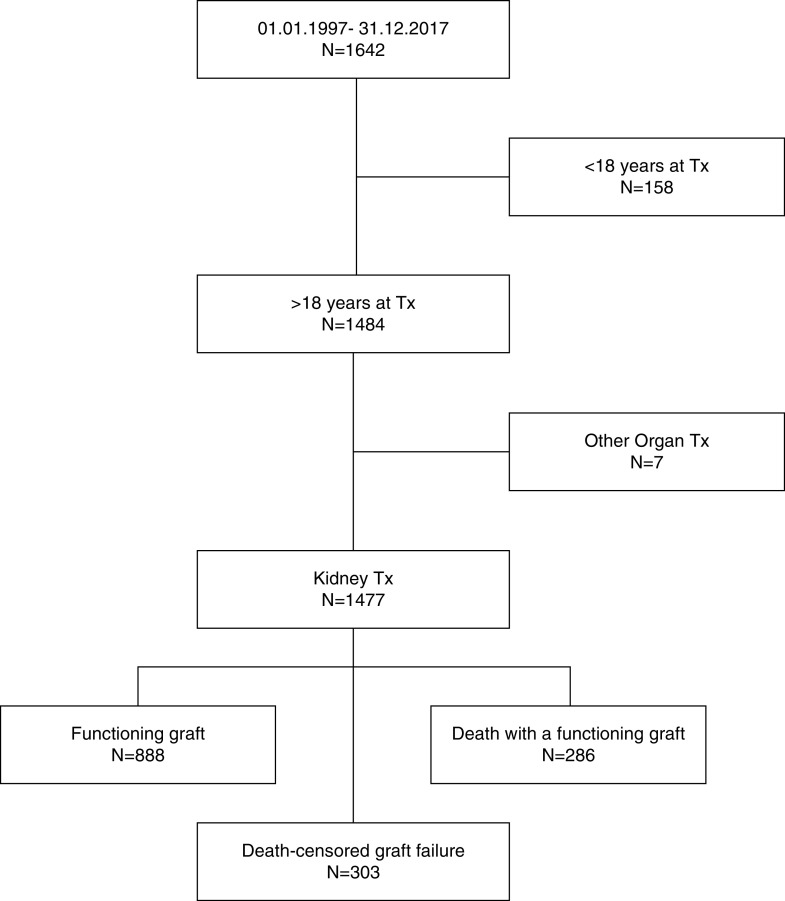
All kidney allograft recipients transplanted at Charité Universitätsmedizin Berlin, Campus Charité Mitte between January 1, 1997 and December 31, 2017 were included (Figure 1). Kidney transplants after another solid organ transplantation, combined transplants, and pediatric transplants (recipient age <18 years at time of transplantation) were excluded. All patients received follow-up in regular intervals at our transplant center, and at least annual follow-up data were obtained until December 31, 2019, which marked the end of observation. All death-censored graft failures over that period were retrospectively analyzed. No patients were lost to follow-up.
Figure 1.
Flowchart showing patient enrollment. End of observation was December 31, 2019. Tx, transplantation.
Database
Information was obtained from a database specially designed for kidney transplant recipients (TBase), which was implemented over 20 years ago.13 Since 1999, the database has provided the basis for routine care of all kidney transplant recipients and since then, automatically collects medical notes and records, diagnoses, laboratory data, and radiology and pathology data (including all kidney biopsy data) as well as donor and transplant characteristics and all medication in a prospective way. The data were collected as part of patient’s routine follow-up after kidney transplantation. Additionally, information on donor-specific antibodies (DSAs) against HLA were collected during routine care since 1997 and provided by the Institute of Transfusion Medicine. Patients were scheduled for at least three to four regular follow-up visits per year as long as the graft was functioning.
Adjudication of Graft Failure
All GLs were classified by an adjudication committee consisting of three physicians (M. Mayrdorfer, L.L., and K.B.), two of whom had >20 years of personal knowledge of the recipients.
The general assumption was that several different events could potentially lead to a persistent impairment of nephron function resulting in an irreversible loss of nephrons and a subsequent decline of renal function. A single injury or repeated injuries will cause an abrupt or gradual decline of renal function measured by serum creatinine levels and/or proteinuria. As a consequence, the adjudication committee reviewed all GLs in a comprehensive way assessing longitudinal changes in serum creatinine levels and proteinuria, all biopsy results, medical records, concurrent medical events, and laboratory data (such as HLA antibodies or viremia) in order to assign a cause to each persistent decline in renal function. As multiple repeated or different injuries may cause a persistent decline in renal function over the lifetime of a graft, the reasons for GL were classified as primary or secondary cause, upon their contribution to overall transplant failure (Figure 2, A and B). A primary cause was defined as a cause responsible for a persistent eGFR decrease of ≥50% of the presumed maximal allograft GFR, whereas secondary causes contribute <50% to the observed eGFR decline. Each GL was assigned either to one primary cause with or without secondary causes or exclusively to secondary causes if no dominant primary cause was attributable. If the clinical course before GL was not sufficient to assign a cause to transplant failure unambiguously, the reason for GL was categorized as unknown. The basic prerequisite for all attributed causes was a temporal and well-defined association of an irreversible and relevant decrease of renal function, determined by serum creatinine levels and/or proteinuria. Attribution rules for the main categories are defined in Table 1. Nonadherence has been assessed retrospectively by reviewing clinical course and clinical notes using key word search in combination with personal knowledge of the patients.
Figure 2.
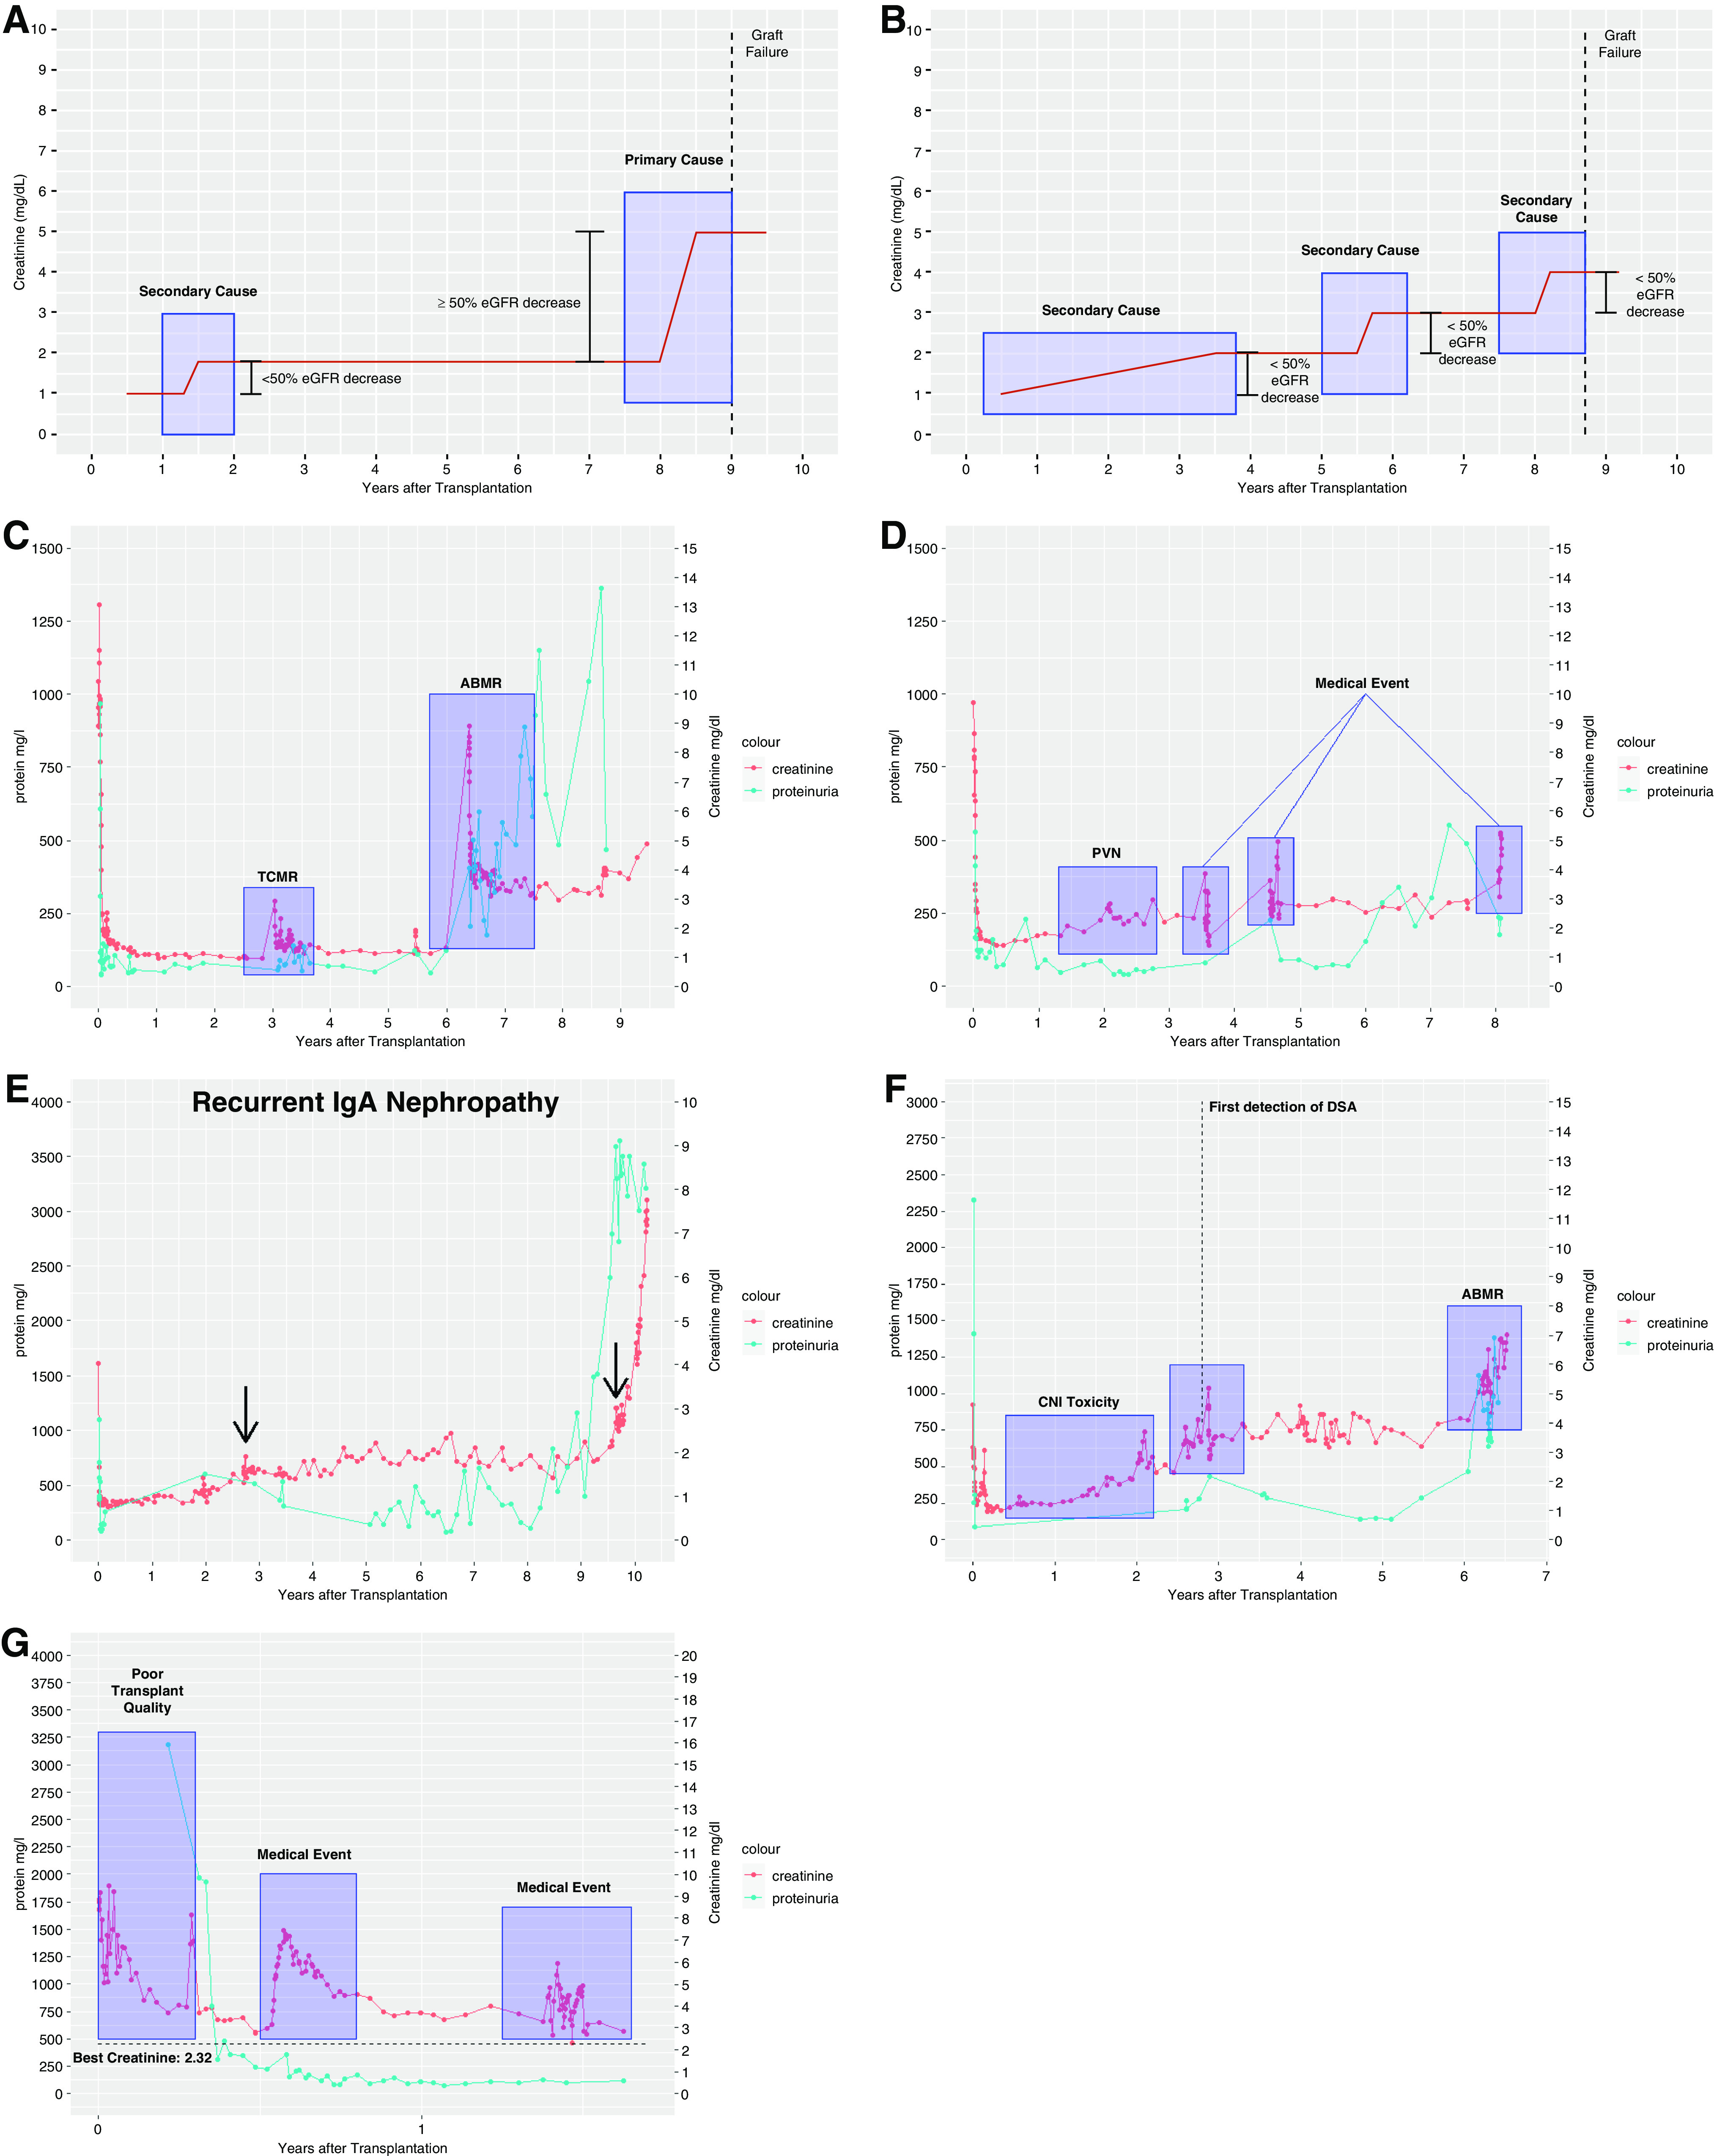
Evolution of kidney function and assignement of causes for graft failure. (A) Schematic diagram demonstrating the assignment of a primary and a secondary cause. (B) Schematic diagram demonstrating the assignment of multiple secondary causes. (C) Transplant failure due to rejection. Because kidney function was less affected after TCMR compared with ABMR, the latter has been categorized as primary cause. (D) PVN plus medical events (cardiorenal). (E) Recurrent disease. Patient with recurrent IgA nephropathy. Arrows show the biopsy dates confirming the diagnosis. (F) CNI toxicity followed by ABMR. After CNI withdrawal, creatinine improved; however, de novo DSA and ABMR developed during follow-up. (G) Patient with poor transplant quality (baseline creatinine >2.3 mg/dl) followed by a medical event (infection).
Table 1.
Attribution rules for causes leading to graft failure
| Category | Attribution Criteria |
|---|---|
| ABMR | Mandatory detection of HLA DSA before GL |
| Histologic findings consistent with Banff 2017 lesion grading, including at least one of the following scores, in absence of other causes more likely to contribute to the scores: | |
| (1) ptc + g≥2 | |
| (2) Transplant glomerulopathy (cg>0) with prior documented evidence of DSA | |
| (3) C4d positivity plus (g>0 or ptc>0 or v>0) | |
| (4) Acute thrombotic microangiopathy | |
| In case of not meeting the histopathologic diagnostic criteria mentioned above but evidence of DSA timely linked to an increase of creatinine and proteinuria >1 g/L, the category was referred to as “highly suggestive of ABMR” | |
| TCMR | TCMR≥IA on the basis of the Banff 2017 classification |
| In case of concomitant positivity of BKV DNA in kidney biopsies, TCMR scoring was thought to be caused by virus replication and therefore, not counted | |
| Medical events | Severe medical conditions, such as cardiovascular events or infections, timely linked to a persistent and relevant decrease in renal function |
| CNI toxicity | CNI as part of immunosuppression, prior to biopsy, and |
| Biopsy showing severe hyalinisis (ah3) in absence of an early post-transplant biopsy linking severe hyalinosis to poor transplant quality or | |
| Increase in the ah score by ≥2 over time in case of >1 biopsy, in absence of other causes more likely to contribute to the increase; in case of only one biopsy, donors <40 yr of age were presumed to have an ah score of 0 | |
| PVN | BKV viremia |
| PCR positive for BKV DNA or immunohistochemistry staining positivity for simian virus-40 in the kidney biopsy | |
| Perioperative events | Medical events related to kidney transplant surgery (within maximum 30 d after transplantation), excluding TCMR and ABMR |
| Recurrent disease | Histologic diagnosis of recurrent disease |
| Poor transplant quality | Early post-transplant biopsy indicating poor transplant quality, especially through fibrosis and changes in vasculature related to increased age or donor report retrospectively highly suggestive for poor transplant quality |
| Best baseline creatinine >2 mg/dl post-transplant |
ptc, peritubular capillaritis; g, glomerulitis; cg, glomerular basement membrane double contours; v, intimal arteritis; BKV, BK virus; ah, arteriolar hyalinosis.
HLA Antibody Screening
DSA levels were assessed as previously described.14 Serum samples were collected once a year or at biopsy and screened for HLA DSA using two ELISA-based screening methods (PRA-STAT [SangStat Medical Corp., Menlo Park, CA] and Lambda Antigen Tray [LAT] [One Lambda, West Hills, CA]) from 1996 to 2006 and the Luminex-based bead assay LABScreen Mixed (One Lambda, West Hills, CA) from 2007 onward.
Review of Allograft Pathology
Biopsy specimens were processed as previously described.15 Biopsies were performed when clinically indicated. No protocol biopsies were performed. All biopsy results have been reread and reinterpreted according to the Banff 2017 classification16 by two independent nephropathologists (K.W. and B.R.). Most importantly, all histologic slides of biopsies that potentially could be considered as antibody-mediated rejection (ABMR; with one of the Banff lesion scores glomerulitis, glomerular basement membrane double contours, peritubular capillaritis, or intimal arteritis) or cases with serologic evidence of DSA at biopsy were reviewed, and the diagnostic criteria strictly adhered to the updated Banff 2017 classification. In order to meet the diagnostic criteria, additional stains (e.g., C4d) have been performed if necessary. Complement split product C4d was detected by indirect immunofluorescence on paraffin sections of formalin-fixed tissue using polyclonal anti-C4d antibody (Dianova, Hamburg, Germany). If the diagnostic criteria did not meet Banff 2017 criteria or no adequate biopsy was available but evidence of DSA timely linked to an increase of creatinine and proteinuria, the category was classified as “highly suggestive of ABMR.”
Statistical Methods/Quantitative Variables
Data analysis was performed using the statistical programming language R, version 3.6.3.17 Data of variables with normal distribution are expressed as mean ± SD. Otherwise, variables are displayed as median, interquartile range (IQR), and range. Mann–Whitney U test, two-sample t test, or two-proportion z test were used for group comparisons. Kaplan–Meier estimates were used to describe graft survival. The following R software packages were used in the analysis and production of images: ggplot218 (version 3.3.0), tidyverse19 (version 1.3.0), networkD320 (version 0.4), and survminer21 (version 0.4.6).
Independent Validation
Six additional physicians (three residents and three attending physicians) were randomly assigned to 25 graft failures each (total 150 of 303 different graft failures) and extensively instructed in the application of the adjudication criteria. Inter-rater reliability (IRR) was evaluated using two different coefficients (Cohen's κ for primary causes, and iota coefficient for overall causes). We refrained from calculating the mean IRR because each rater evaluated a different subset of graft failures. The R code for IRR calculation can be provided upon request.
Results
Study Population
Between 1997 and 2017, we performed 1477 isolated kidney transplants in our center and captured 12,182 patient years until end of observation. The cohort had a complete follow-up after transplantation; no patients were lost to follow-up. Until end of observation (December 31, 2019), 303 death-censored allograft losses (in the following referred to as graft failure) occurred in our cohort, 286 patients died with a functioning allograft, and 888 patients were alive with a functioning transplant (Figure 1). Death-censored graft survival of this cohort was 95.7% at 1 year, 88.5% at 5 years, and 76.9% at 10 years, whereas overall graft survival for all patients receiving a renal allograft was 93.7% at 1 year, 80% at 5 years, and 60.6% at 10 years (Figure 3). Mean follow-up in our cohort was 7.9±5.1 years (median, 7.2 years; IQR, 4.2–11.5 years; range, 0–23 years). Follow-up for patients with graft failure was 5.6±4.5 years (median, 4.8 years; IQR, 1.4–9 years; range, 0–18.4 years). Characteristics of patients who progressed to graft failure are summarized in Table 2. Biopsies before GL were performed in a high proportion of patients, as our center’s policy calls for exclusion of potentially reversible factors by biopsies in all patients with elevated serum creatinine levels not explained by other reasons. Consequently, a transplant biopsy was available in 93.1% of the graft failures, 70% within 2 years of graft failure, and 60.4% within 1 year of graft failure. Patients with graft failure had more HLA mismatches (mean, 3.1 versus 2.5; P<0.001), fewer living donors (percentage living donors, 20.8 versus 40.8; P<0.001), and more elderly donors (mean, 55.9 versus 50; P<0.001) compared with patients with a functioning graft at the end of observation (Table 2).
Figure 3.
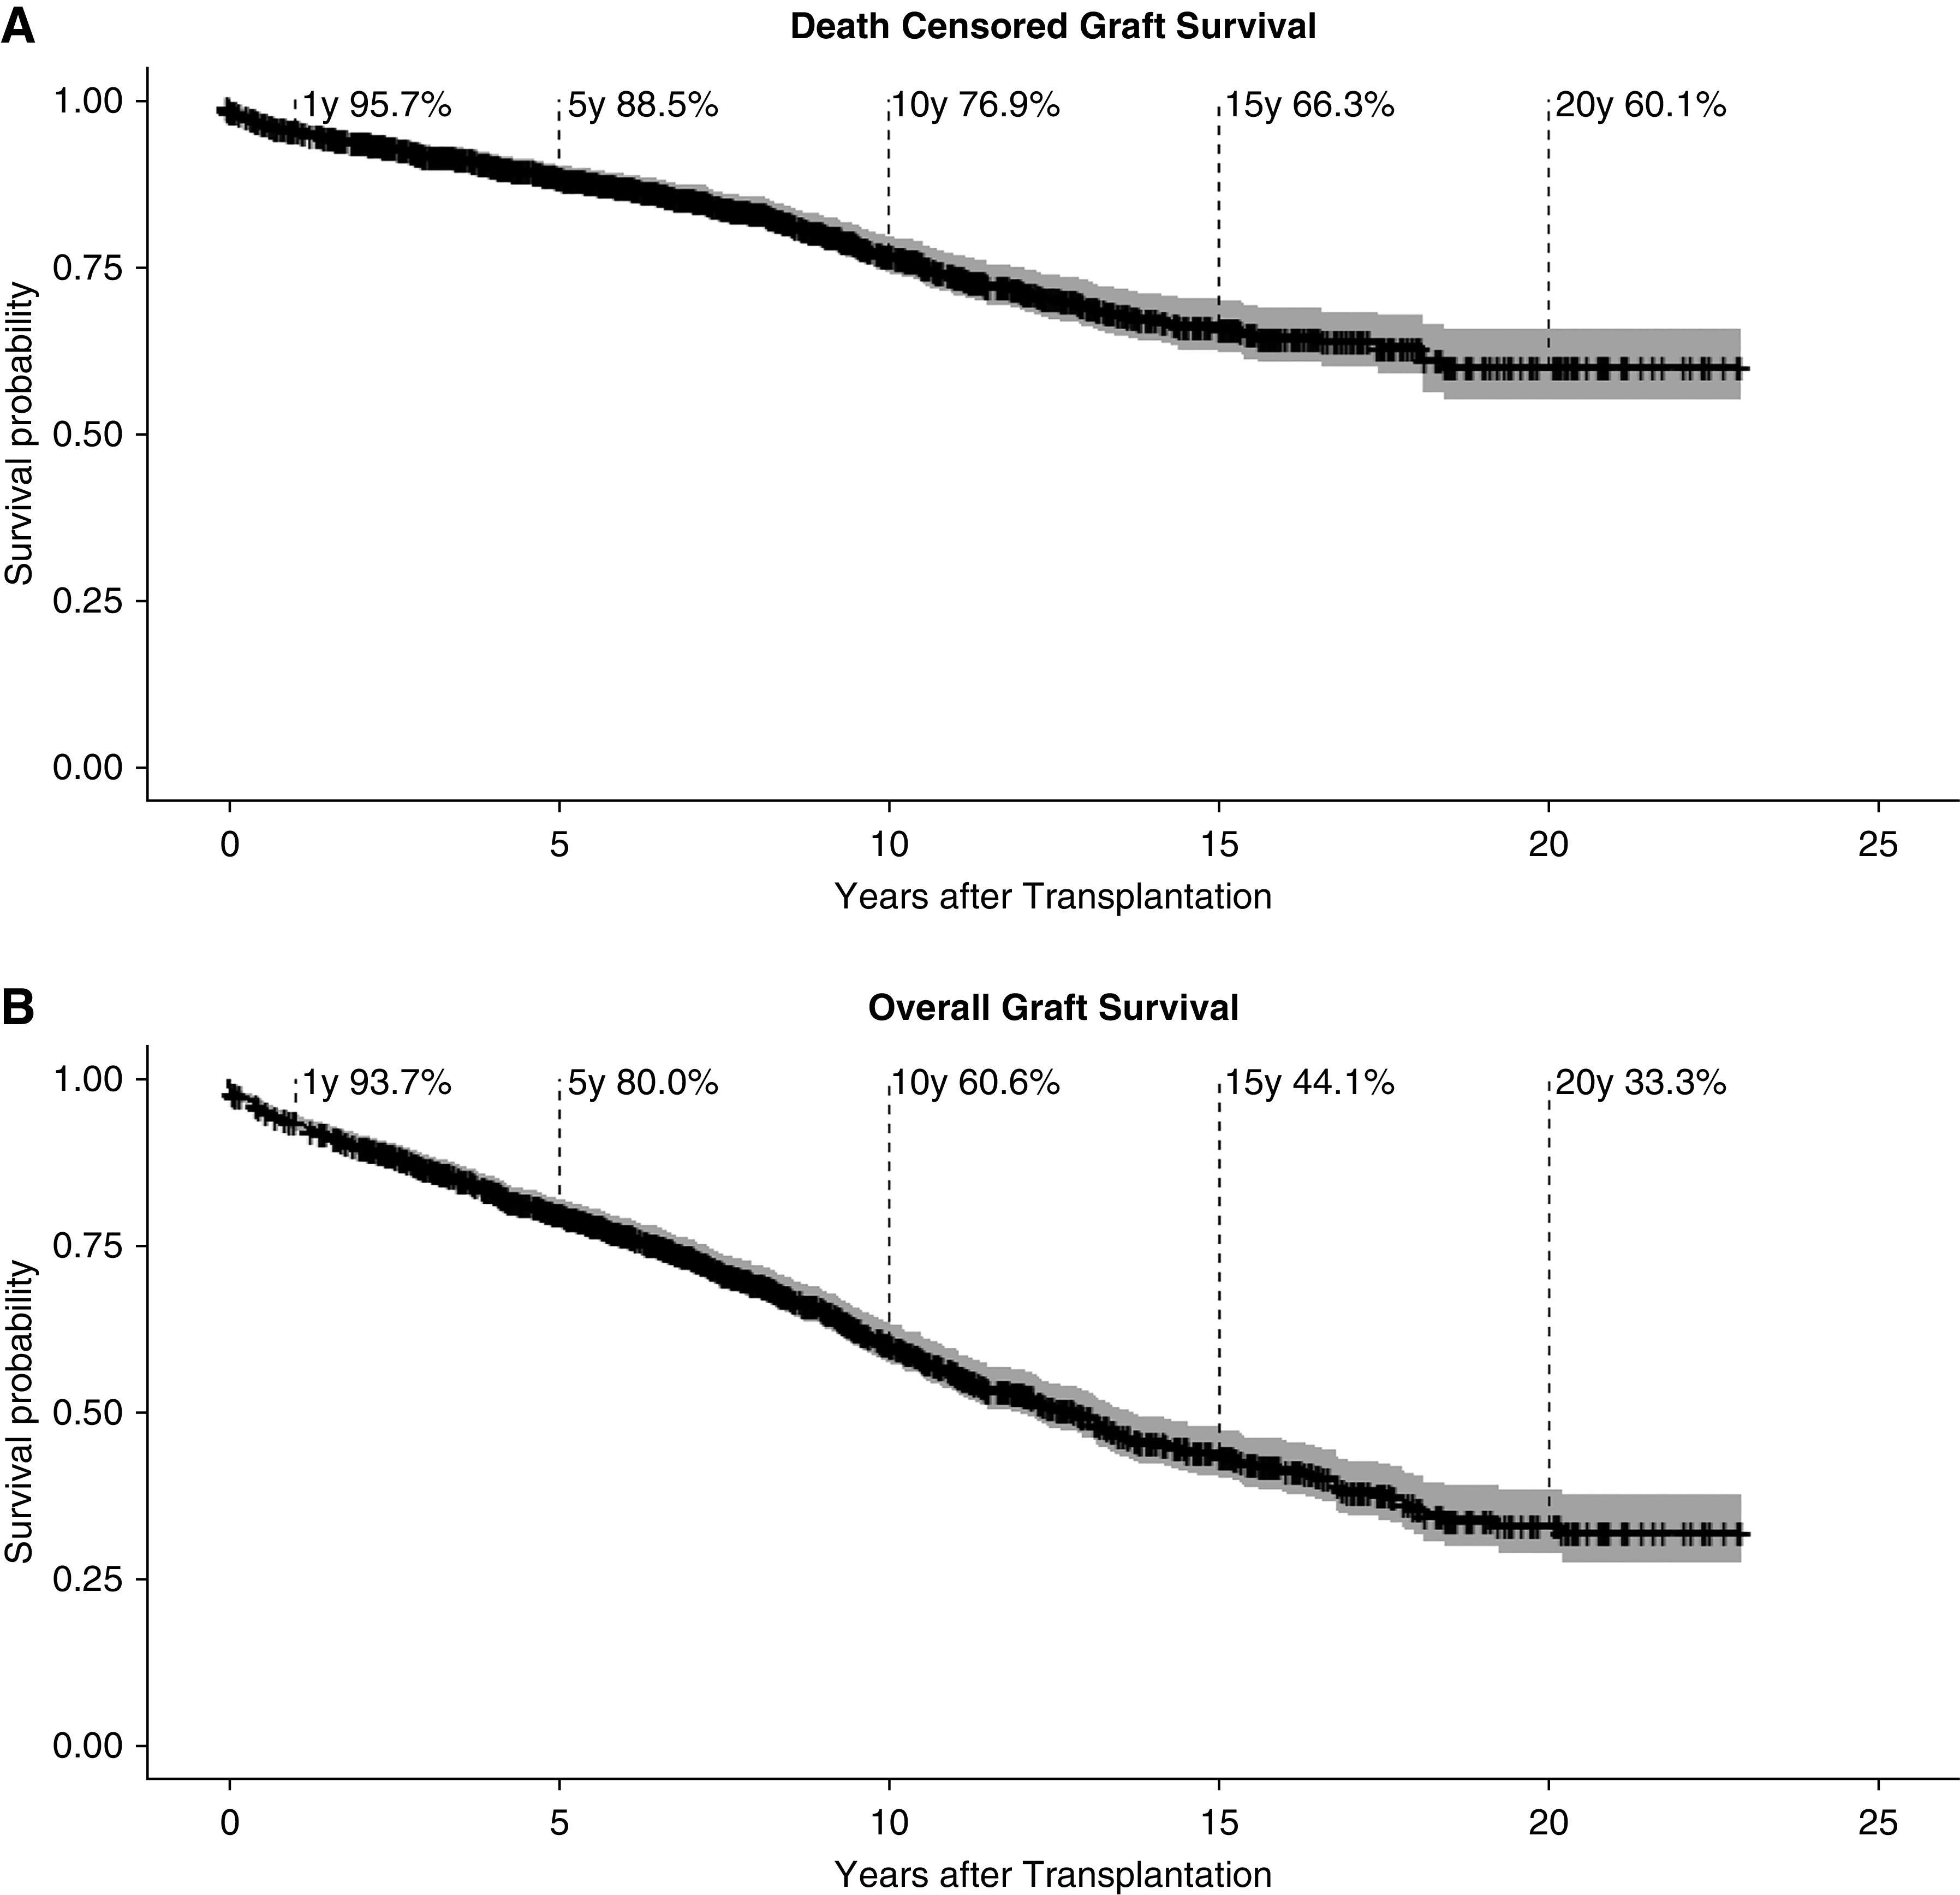
Survival curves showing Kaplan-Meier estimates for graft survival in all 1477 adult kidney transplant recipients. Confidence interval is shown in grey. (A) Death-censored graft survival (in case of death with a functioning graft the follow-up period is censored at the date of death) and (B) overall graft survival.
Table 2.
Patient characteristics
| Clinical Characteristic | Death-Censored Graft Failure | Functioning Graft | P Value |
|---|---|---|---|
| Donor | |||
| Age, yr, mean ± SD | 55.9±15.9 | 50±13.3 | <0.001 |
| Age >64 yr, % | 34.3 | 12.9 | <0.001 |
| Women, % | 50.2 | 51 | 0.78 |
| Living donor, % | 20.8 | 40.8 | <0.001 |
| HLA mismatch, mean ± SD | 3.1±1.6 | 2.5±1.6 | <0.001 |
| Recipient | |||
| Age, yr, mean ± SD | 49.9±16.1 | 48.5±14.5 | 0.18 |
| Age >64 yr, % | 31 | 18.1 | <0.001 |
| Women, % | 40.6 | 38.3 | 0.52 |
| First transplantation, % | 78.5 | — | |
| Transplant survival, yr, mean ± SD | 5.6±4.5 | — | |
| Biopsy, n (%) | |||
| Available before graft failure | 282 (93.1) | — | |
| <2 yr before graft failure | 212 (70.0) | — | |
| <1 yr before graft failure | 183 (60.4) | — | |
| No. of causes per graft failure, n (%) | |||
| 1 | 132 (43.6) | — | |
| 2 | 123 (40.6) | — | |
| 3 | 27 (8.9) | — | |
| 4 | 5 (1.7) | — | |
| Unknown | 16 (5.3) | — | |
| Adherence, % nonadherent | 17.8 | — | |
| DSA before graft failure, n (%) | 117 (38.6) | — |
—, not available; SD, standard deviation; yr, years; HLA, human leukocyte antigen; DSA, donor-specific antibodies.
Distribution of Causes Leading to Death-Censored Graft Failure
In 236 of 303 (77.9%) graft failures, a primary cause was identified; in 51 of 303 (16.8%), no primary cause but at least one secondary cause was assigned (Figure 4A). In only 16 of 303 (5.2%) graft failures, the information was not sufficient to assign unambiguously neither a primary nor a secondary cause. In 122 (40.3%) transplants, only a primary cause and no secondary causes were assigned. Graft failures with a primary cause and at least one secondary cause accounted for 114 (37.6%) of the cases. In 51 graft failures (16.8%), only secondary causes were assigned. Per transplant, a maximum of three secondary causes have been assigned. Overall, in 51.2% of graft failures, more than one cause contributed to GL. In late graft failure, 131 of 240 (54.5%) transplants had more than one cause for GL.
Figure 4.
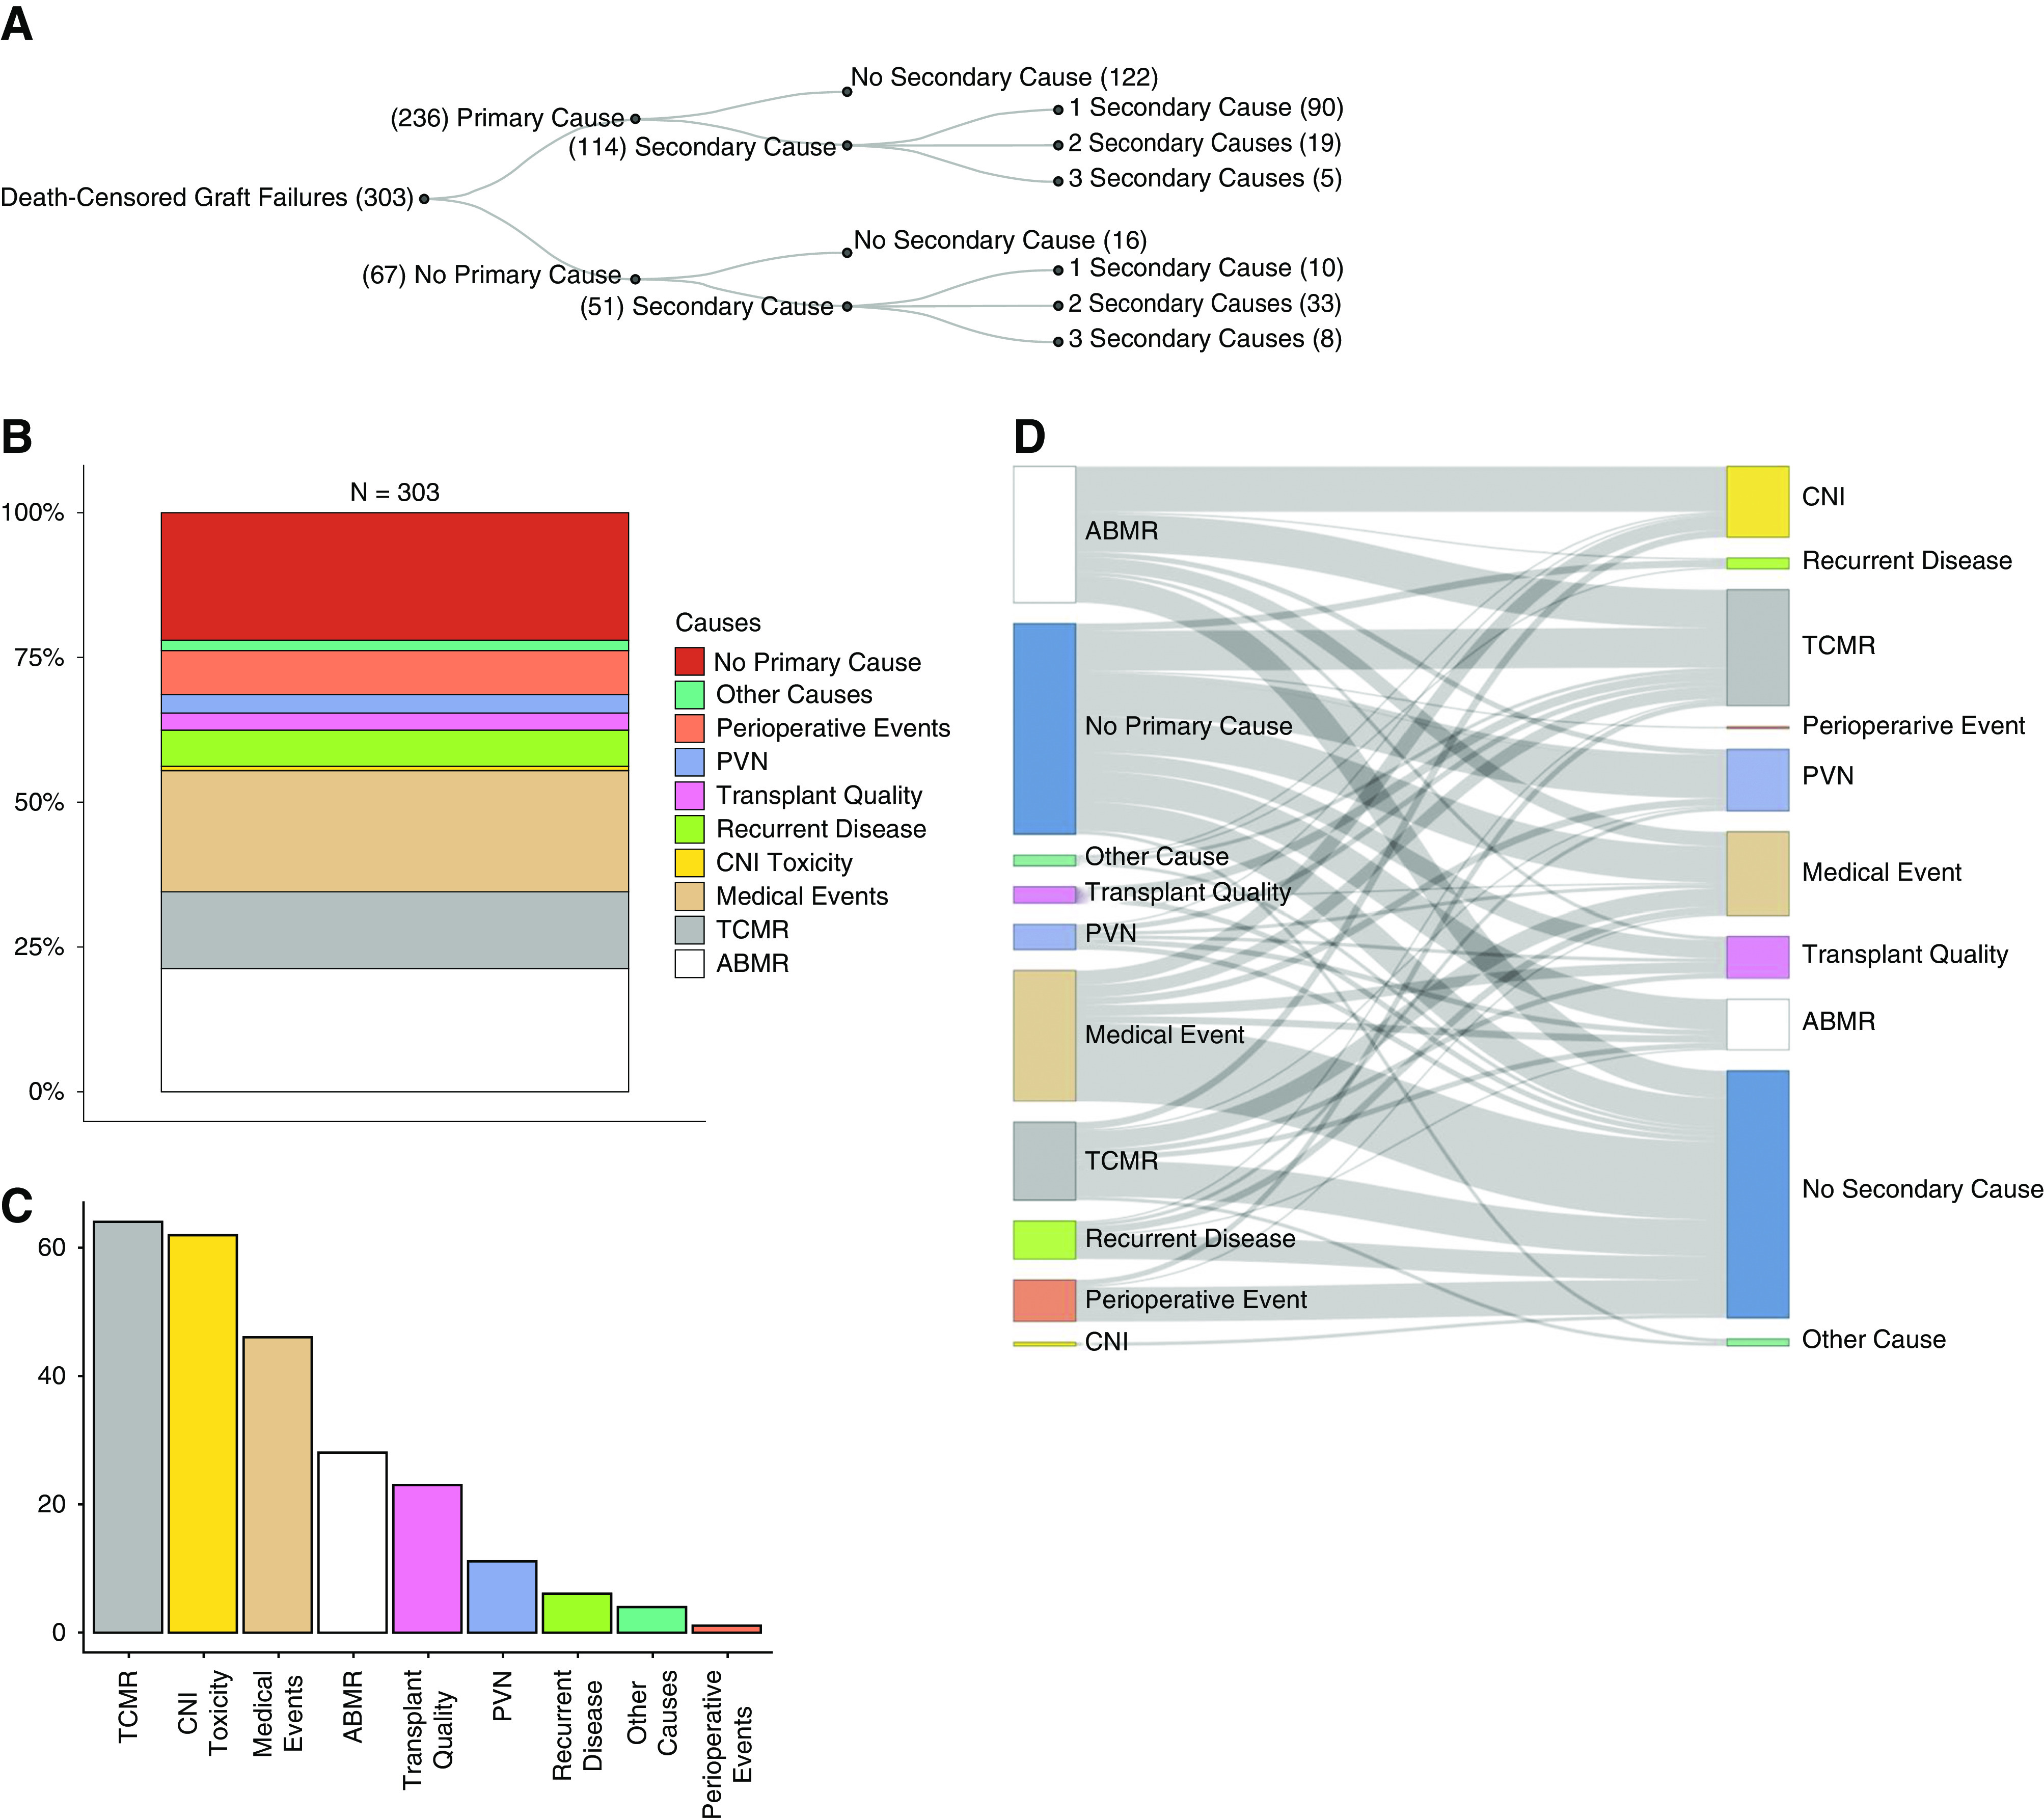
Distribution and co-occurence of primary and secondary causes. (A) Overview of primary and secondary causes for graft failure. (B) Percentage of primary causes of graft failures in relation to all 303 graft failures. (C) Absolute numbers of secondary causes for graft failure. (D) Co-occurrence of primary causes (left panel) with secondary causes (right panel) per transplant failure. Bar length of primary causes (left panel) does not correlate with the corresponding absolute number because it is influenced by the number of secondary causes per transplant.
Causes Leading to Death-Censored Graft Failure
The most frequent cause leading to graft failure as primary or secondary cause (overall) were intercurrent medical events in 36.3% (n=110) of transplant failures followed by T cell–mediated rejection (TCMR) in 34% (n=103) and ABMR in 30.7% (n=93) (Table 3). Focusing only on primary causes, ABMR (n=65; 21.5%) was the leading cause followed by medical events (n=64; 21.1%) and TCMR (n=39; 12.9%). Figure 4, B and C shows the proportion of causes attributed as primary or secondary cause.
Table 3.
Causes leading to death-censored graft failure
| Causes for Graft Failure, n (%) | Primary (%) | Secondary (%) | Total (%) |
|---|---|---|---|
| TCMR | 39 (12.9) | 64 (21.1) | 103 (34.0) |
| ABMR | 65 (21.5) | 28 (9.2) | 93 (30.7) |
| Medical event | 64 (21.1) | 46 (15.2) | 110 (36.3) |
| CNI toxicity | 2 (0.7) | 62 (20.5) | 64 (21.1) |
| PVN | 10 (3.3) | 11 (3.6) | 21 (6.9) |
| Perioperative event | 23 (7.6) | 1 (0.3) | 24 (7.9) |
| Poor transplant quality | 9 (3.0) | 23 (7.6) | 32 (10.6) |
| Recurrent disease | 19 (6.3) | 6 (2.0) | 25 (8.3) |
| Other cause | 5 (1.7) | 4 (1.3) | 9 (3.0) |
| Total | 236 (77.9) | 245 | 481 |
The most frequent primary cause with no additional causes assigned to graft failure was medical events (n=43) followed by TCMR (n=20) (Figure 4D). The major co-occurring causes per transplant failure with a primary cause and at least one secondary cause contributing to GL are ABMR plus calcineurin inhibitor (CNI) toxicity (n=25) (Figure 2F) and ABMR plus TCMR (n=21) (Figure 2C).
Evolution of Causes Depending on Timing of Graft Failure
When analyzing different causes of graft failure over time, it becomes obvious that different causes dominate different periods. The most frequent cause in early (<1-year post-transplant) graft failure was TCMR in 28 of 63 transplants (six within the first month). Other primary reasons for early graft failure in the first year were medical events, ABMR, recurrent disease, and failure due to early perioperative problems (Figure 5, A–C). Graft failure primarily due to perioperative events, defined as every single event related to transplant surgery up to 30 days after transplantation (excluding TCMR and ABMR), was rare, accounting for only 23 graft failures in 1477 (1.56%) transplantations and 7.6% of all death-censored graft failures.
Figure 5.
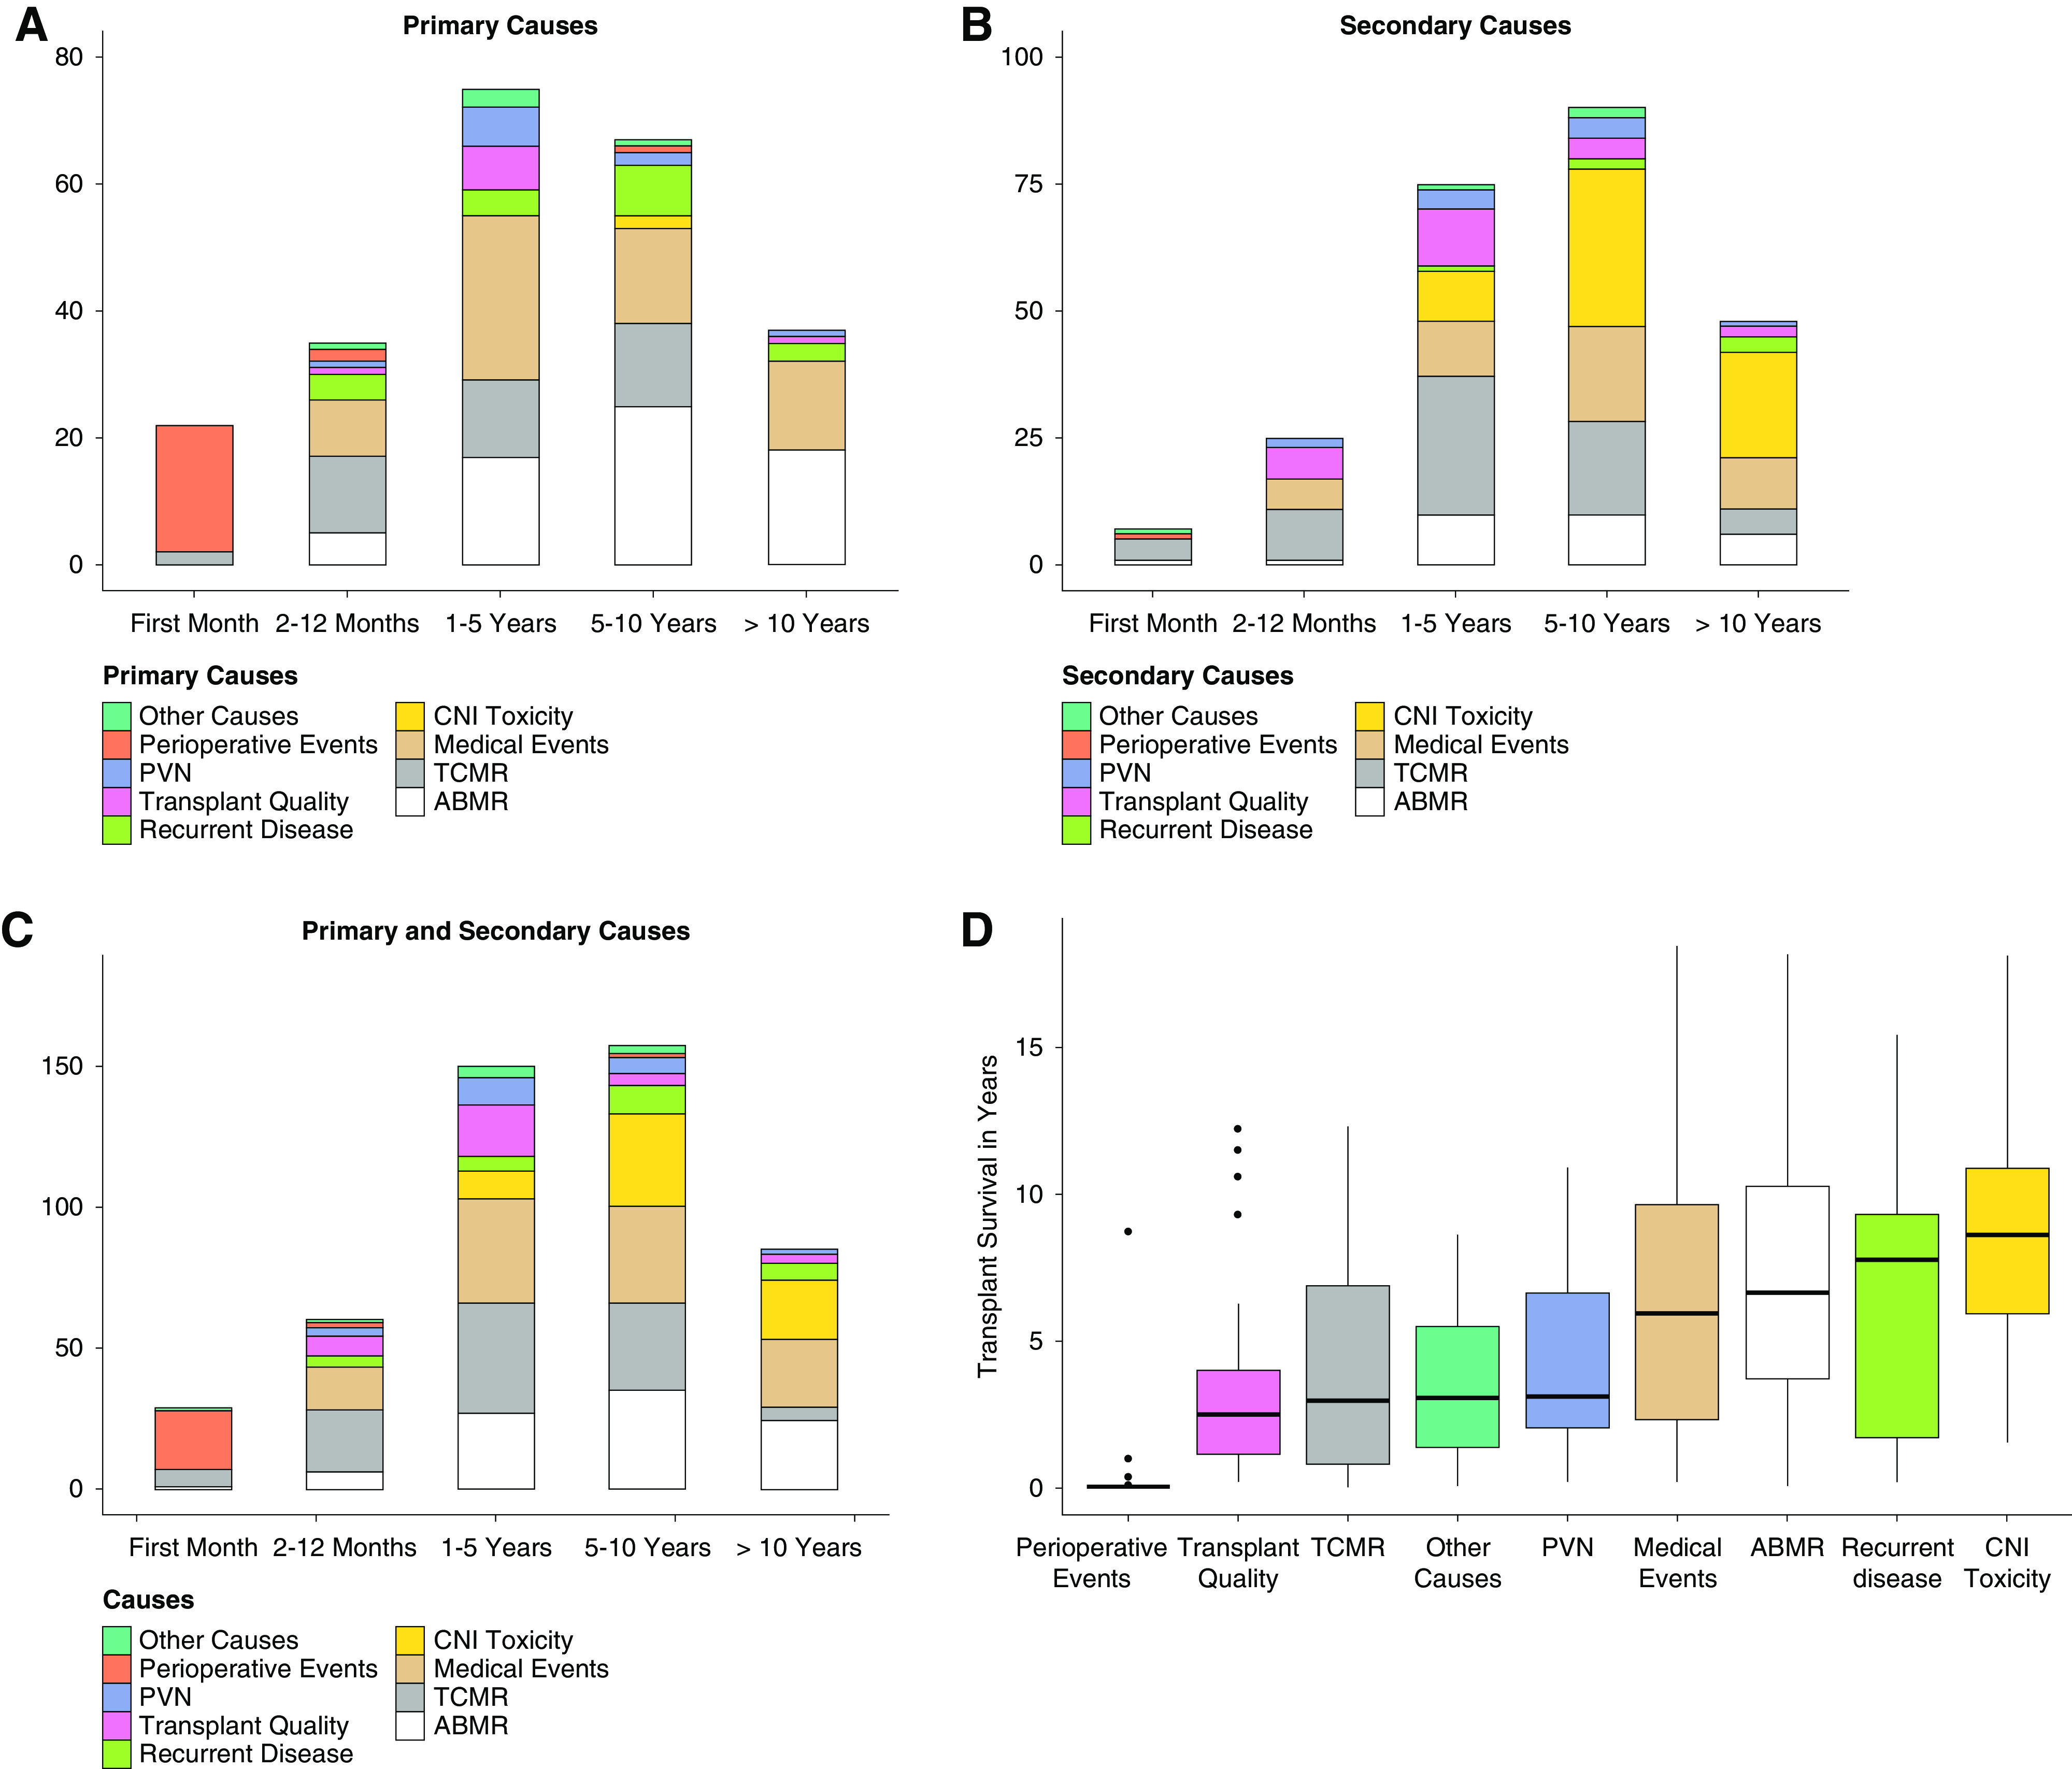
Evolution of causes depending on timing of graft failure and transplant survival for all categories. (A) Primary causes in different time intervals post-transplant. (B) Secondary causes in different time intervals post-transplant. (C) Primary plus secondary causes in different time intervals post-transplant. (D) Transplant survival for all main categories.
In patients with late (>1-year post-transplant) graft failure, medical events evolved as a main reason for late graft failure (95 of 240 late graft failures). As expected, we observed an increasing relative frequency of ABMR as primary cause for graft failure (1–5 years: 22.7% [17 of 75]; 5–10 years: 37.3% [25 of 67]; >10 years: 48.6% [18 of 37]). Remarkably, we noticed a sharp decline in graft failure due to TCMR as primary (zero of 37) or secondary cause (five of 48) if graft survival exceeded 10 years (Figure 5, A–C, Supplemental Figure 1). Interestingly, the consequences of polyoma virus nephropathy (PVN) and poor transplant quality became obvious between 1 and 5 years after transplantation, whereas recurrent diseases peaked between 5 and 10 years post-transplant. CNI toxicity was a rare event in primary causes (only two of 303 patients), but it was the most frequent secondary cause leading to graft failure in late graft failure (64 of 240 late graft failures).
Rejection and Nonadherence
ABMR was the most frequent primary cause in our cohort, accounting for 27.5% (65 of 236) of primary causes mostly occurring as late graft failure. Adding 28 transplants in which ABMR was assigned as a secondary cause, in total 93 of 303 transplants were affected by ABMR. As our attribution criteria required a mandatory detection of DSA before graft failure, transplants affected by ABMR accounted for 93 of 117 (79.5%) graft failures in which DSAs were detected before GL. Only eight of those 93 transplants did not fulfill the biopsy grading criteria defined in Table 1, and they were therefore classified as “highly suggestive of ABMR” because longitudinal changes in serum creatinine, proteinuria (>1 g/L), and DSA were still sufficiently indicative. However, it was also interesting to note that we could not find evidence for ABMR in 24 of 117 patients with DSA prior to GL, in whom graft failure was attributed to at least one of the other categories.
Affecting 103 of 303 transplants and therefore, over one third, TCMR was more frequently contributing to graft failure than ABMR. If we had focused exclusively on the last biopsy before graft failure, the majority of TCMR leading to nephron loss would have been overlooked (Figure 2C). Supplemental Figure 2 shows the co-occurrence of ABMR and TCMR with other causes. In contrast to ABMR, fewer transplants affected by TCMR also showed CNI toxicity, which may be partly explained by a shorter transplant survival (Figure 5D), whereas TCMR contributing to graft failure was associated more frequently with ABMR and medical events.
Nonadherence was documented in 54 of 303 (17.8%) patients with graft failure. In 44 of 54 (81.5%) nonadherent patients, kidney function was persistently affected by ABMR and/or TCMR. Supplemental Figure 3 shows the proportion of primary causes assigned to graft failure in patients with documented nonadherence.
Medical Events
With 110 of 303 transplants affected, medical events (Figure 2, D and G) were the most frequent cause for graft failure. Nearly two thirds of medical events were either infections (n=42) or cardiorenal events (n=31). Other medical events contributing to graft failure were vascular disease, malignancy, and postrenal events (Figure 6). Importantly, mean age at transplantation of recipients who experienced medical events contributing to graft failure was 57.4 years, compared with 45.6 years (P<0.001) in graft failures without medical events.
Figure 6.
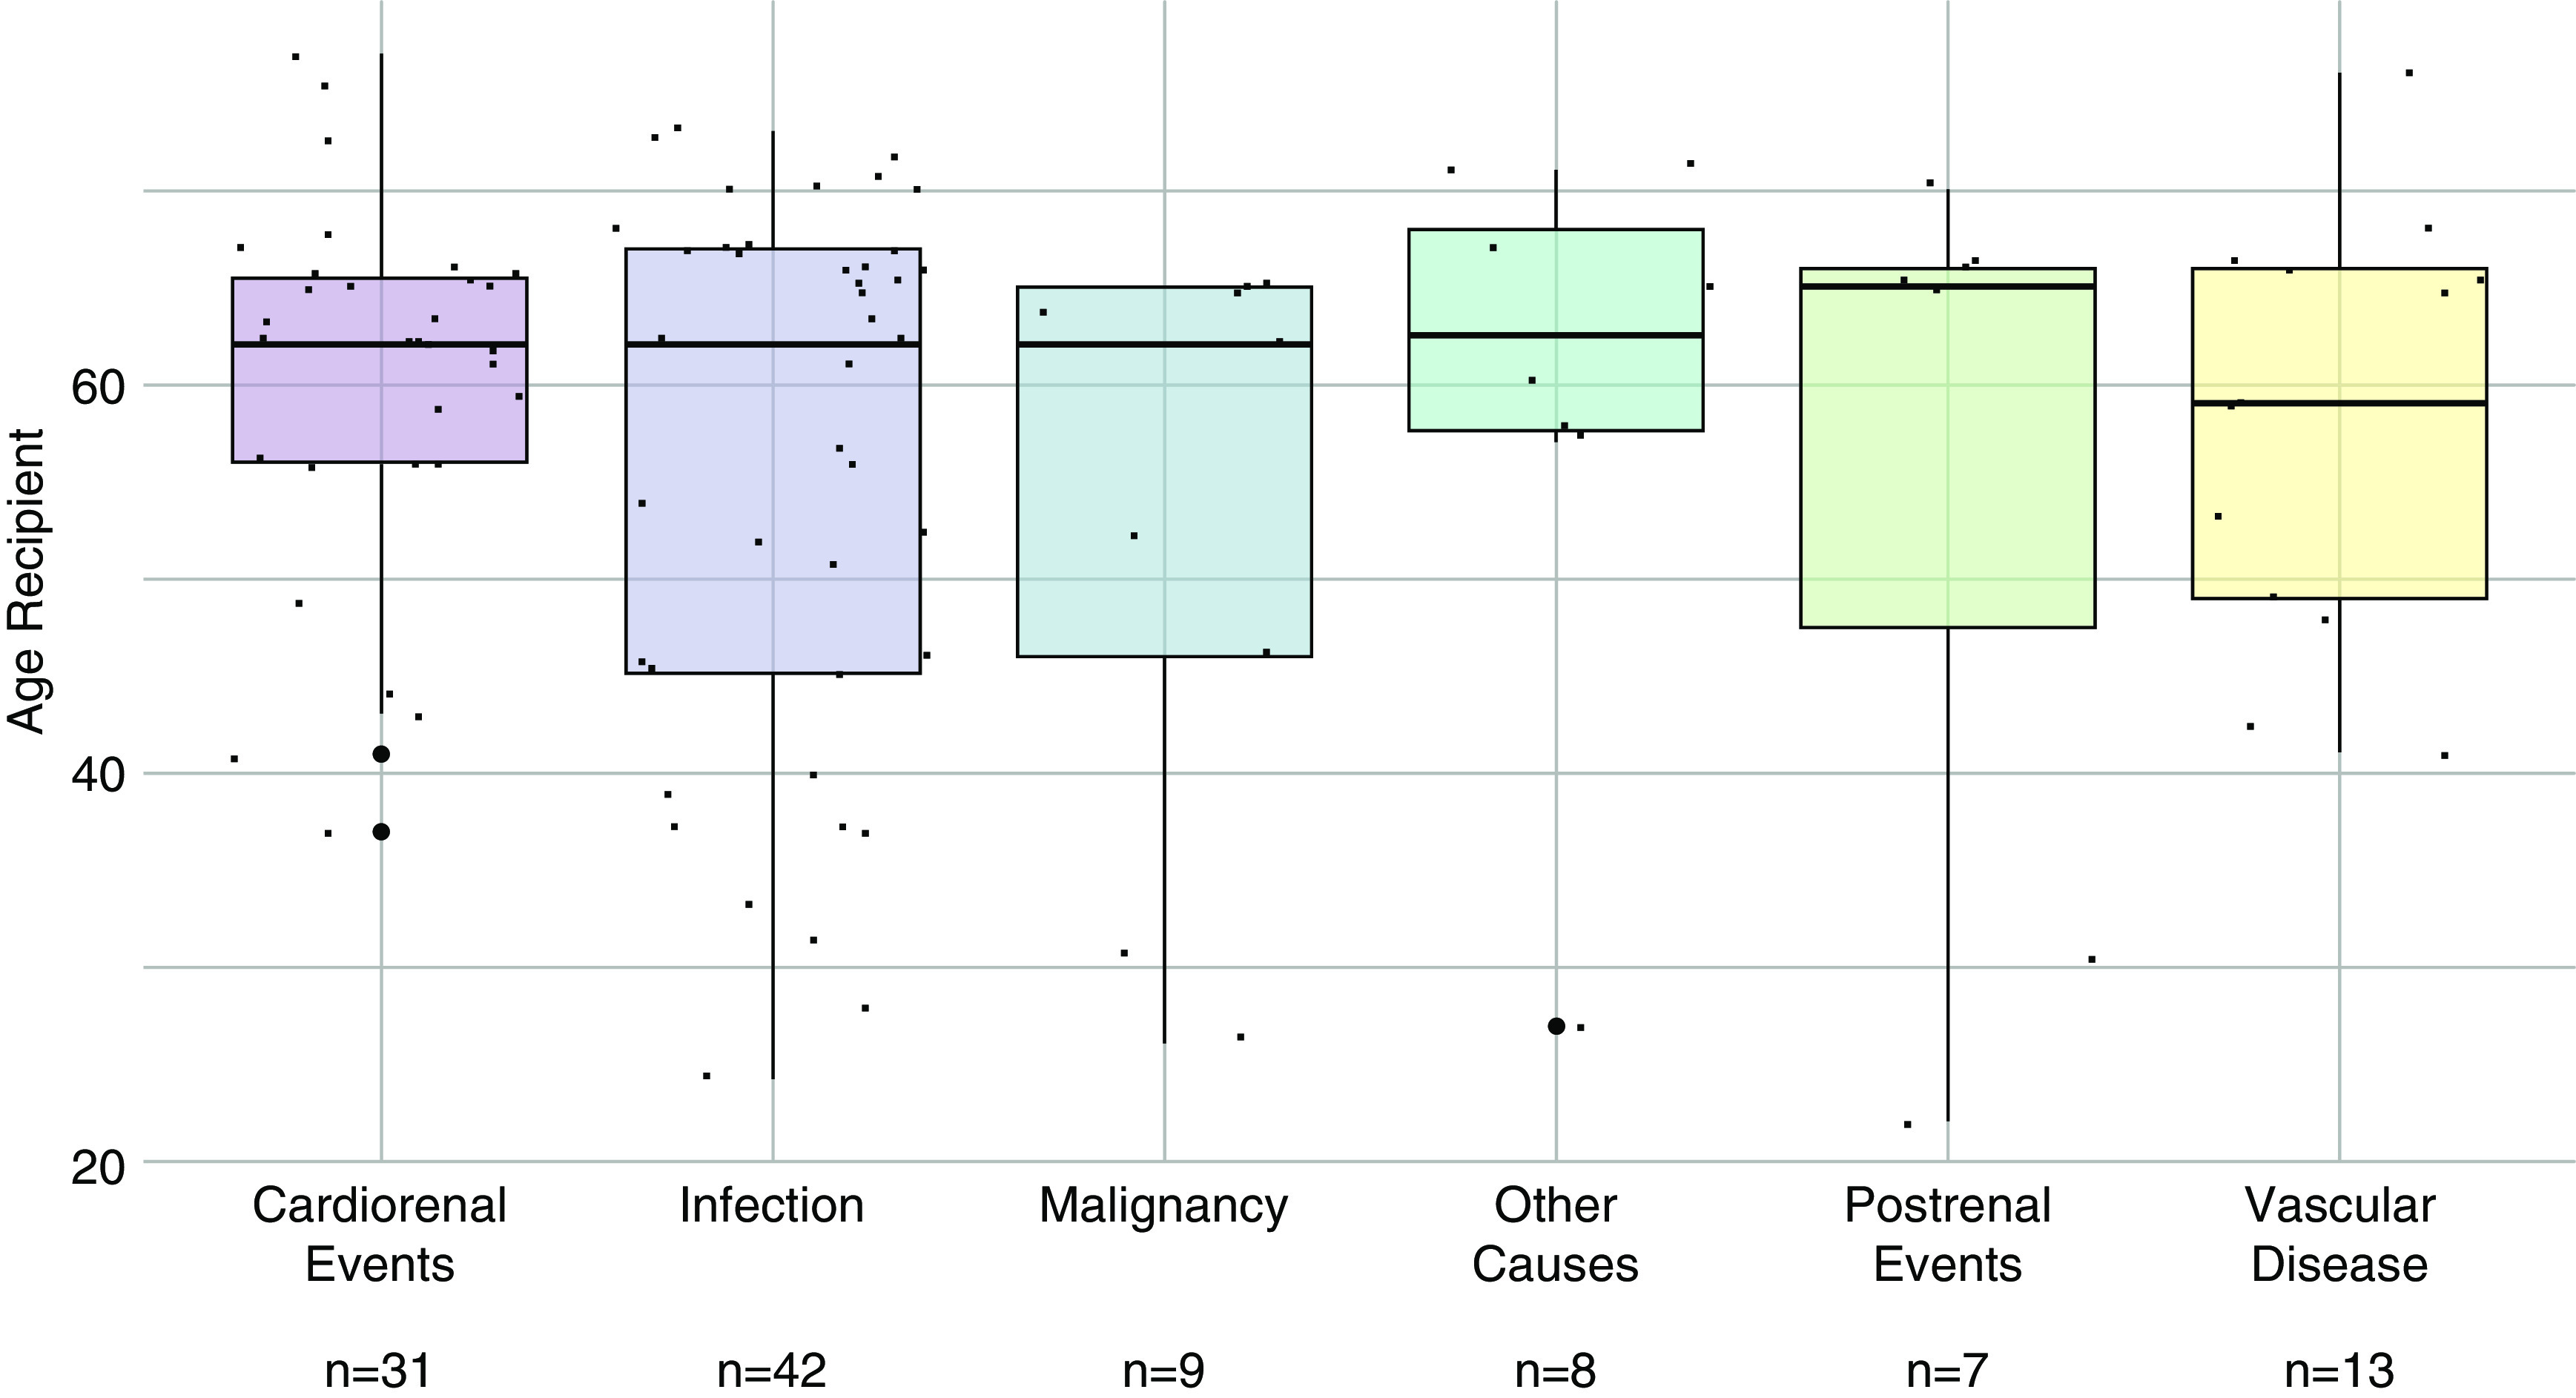
Recipient's age at transplantation and medical events leading to graft failure. Box plots showing recipient’s age (years) of patients with medical events leading to graft failure (n=110) divided in subcategories. Mean recipient’s age for all medical subcategories was 57.4 years.
Recurrent Disease
Recurrent disease occurred in 25 of 303 (8.3%) graft failures and was rather infrequent in our cohort. FSGS (n=13) and IgA nephropathy (n=6) (Figure 2E) accounted for most of the 25 transplant failures affected by disease recurrence.
CNI Toxicity
Occurring in only two of 303 transplant failures, CNI toxicity was rare as a primary cause in our cohort but at the same time, frequent as a secondary cause (n=62). All 64 transplants affected by CNI toxicity failed >1 year post-transplant. Additionally, we observed an increased relative frequency over time to graft failure regarding overall causes (1–5 years: 6.7% [ten of 150]; 5–10 years: 22% [33 of 157]; >10 years: 24.7% [21 of 85]).
In 37 of 64 (57.8%) transplants affected by CNI toxicity, immunosuppression was switched to a CNI-free regimen. In 25 of 37 transplants (67.6%), a rejection contributed to graft failure after switching to a CNI-free regimen (Figure 2F).
Transplant Quality
In total, about 10% of graft failures were due to poor transplant quality (n=32) (Figure 2G) in a cohort with high numbers of marginal donors (34.3% of donors were >65 years; n=104). Most grafts in this category failed 1–5 years after transplantation, whereas early graft failure due to poor donor quality occurred in seven transplants.
Perioperative Events
In 24 transplants, a perioperative event contributed to graft failure. The most frequent events related to transplant surgery leading to graft failure were thromboses (n=12), which can be divided into arterial thrombosis (n=7) and venous thrombosis (n=5), and bleeding events (n=5).
PVN
PVN led to graft failure as the main reason in ten transplants, and additionally, it was a secondary reason in 11 transplants, thereby contributing to graft failure in 21 of 303 (6.9%) transplants (Figure 2D). Most of the patients (13 of 21; 62%) affected by PVN progressed to graft failure <5 years after transplantation.
IRR
The Cohen κ for IRR for assignment of a primary cause ranged from 0.524 to 0.764 (Supplemental Table 1). Percentage agreement for primary causes ranged from 60% to 80%. Iota coefficient of all causes assigned to a graft failure ranged from 0.643 to 0.899. Supplemental Figure 4 shows the comparison of the causes assigned to the subset of 150 (6×25) graft failures by the original adjudication committee and the independent raters. The total numbers of causes assigned were higher in the external rater group (242 versus 264). The distribution between categories was almost identical, although the independent raters assigned slightly more medical events (56 versus 71) and CNI toxicity (32 versus 40). Agreement was highest for perioperative events (11 versus 11), recurrent disease (11 versus 11), ABMR (49 versus 48), and TCMR (51 versus 49).
Discussion
Stagnating long-term outcomes remain a main obstacle for the transplant community, but surprisingly, large contemporary studies investigating the causes of graft failure are rare. However, it is obvious that a thorough analysis of graft failures is the first step to improve outcomes. Only when we understand the causes of graft failure will we be able to improve our results in a second step. While analyzing the clinical courses of our transplant failures, it became obvious that graft failure was often multifactorial as already suggested by others.10,22 Analyzing the prospective Deterioration of Kidney Allograft Function (DeKAF) cohort, Gaston et al. 23 emphasize the importance of late events, defined as a creatinine increase or new-onset proteinuria >90 days after transplantation, for long-term death-censored graft failure. On the contrary, stable graft function is associated with an excellent graft survival independently of eGFR at 1 year as observed in a recent study analyzing long-term trajectories of eGFR in kidney transplant recipients.24 Under the assumption that nephron injury may result in an irreversible loss of nephrons, which will result in an increase of serum creatinine, we used a novel approach of assigning a cause to each quantifiable, relevant, and persistent decline in renal function over the course of allograft life, in order to describe the events leading to graft failure in greater detail. Combining this approach with an in-depth and careful adjudication of each graft failure in our center by three physicians, of whom two physicians knew the patients’ clinical course for >20 years, we were able to thoroughly investigate the causes for nephron injury and assign causes for persistent graft injuries that would have been overlooked otherwise. Interestingly, in around 51% of the graft failures, we found a multifactorial etiology for graft failure. This was particularly evident in patients with late graft failure. As expected, our study demonstrates that the timing of graft failure plays an important role in the distribution of causes leading to graft failure, with perioperative events and TCMR dominating early graft failure (<1 year post-transplant), and ABMR, medical events, and CNI toxicity as the leading causes for transplant failures >10 years post-transplant. An important unexpected finding was the high frequency of different medical events, which was the main contributor to late graft failure in our cohort. Recurrent disease, PVN, nonadherence, and poor donor quality contribute in relevant proportions to the multitude of factors leading ultimately to graft failure in the current era of marginal donors and elderly recipients.
In this large single-center study, we used a novel approach, derived from the careful observation of all clinical courses with graft failure. While reviewing the data, it immediately became evident that a simple attribution chart or tick boxes with a few predefined causes do not reflect the reality in 2020 anymore. Over the life of a transplant, immunosuppression may be switched25 (e.g., due to deteriorating renal function, side effects, and suspected or biopsy-proven CNI toxicity). The patient may develop ABMR or TCMR and after treatment of the rejection, will present with repeated severe episodes of infections. Other patients may experience severe AKIs, diarrhea, toxic medications, heart failure, or surgery. In such cases, it is obvious that several different causes contributed to graft failure and that the previous “tick box” approach falls short, especially if only one cause selected from a few predefined categories could be assigned or only the final deterioration was taken into account. Our findings highlight the need for extensive long-term care and monitoring, with timely diagnosis and treatment of potentially reversible injuries, in order to improve long-term graft survival.26
In order to fully understand the reasons for graft failure, a complete follow-up and many kidney biopsies are needed. Patients who are lost to follow-up are suspected to have a high number of informative events, which may cause a biased interpretation. An important aspect in our study is the high frequency of biopsies and the complete follow-up over a 20-year period. By this means, we were able to assess all graft failures in a reasonably large contemporary cohort, resulting in good validity and reliability of the results, in combination with a case by case review of every single graft failure and precisely defined definitions for all main categories leading to graft failures.
Compared with previous studies,9,14 we confirm that HLA DSAs have an important effect on graft failure, especially in late allograft failure. Over one third of the transplants (117 of 303) developed HLA DSA prior to graft failure, 93 of 303 (30.7%) being quantifiably affected by ABMR. It is important to note that our center’s policy aimed to avoid pretransplant DSA whenever possible; no desensitization procedures were performed. Because of early implementation of regular HLA antibody screening14 with mandatory need for HLA antibody detection and frequent biopsies, we believe that this number should be representative of centers with a similar policy and strict follow-up in a European health system.
Because of our meticulous approach, we were able to detect 103 of 303 transplants in which TCMR contributed to early and late graft failure, suggesting that TCMR remains an important therapeutic target for preventing graft failure in general. A high frequency of ABMR and TCMR in patients with documented nonadherence confirms the importance of adherence for reducing rejection, as previously suggested by other studies.9,27 In 44 of 303 graft failures (14.5%) documented, nonadherence was associated with rejection (either ABMR or TCMR), and many more cases most likely were not documented. Thus, it becomes obvious that effective rejection prophylaxis is more than simple immunosuppression and that strategies to increase adherence are desperately needed in order to improve outcomes.
The high number of medical events was surprising and not yet described. Our population with many elderly donors and recipients, who are more vulnerable to concomitant medical events, most likely differs from previous cohorts, where elderly patients were transplanted rarely. With 110 of 303 transplants affected, medical events were the most often represented reason leading to graft failure. Taking into account that 42 medical events were infections, that 21 graft failures were due to PVN, and additionally, that nine events were due to malignancy, it becomes obvious that also overimmunosuppression (infections and malignancy; 72 of 303 graft failures [23.8%]) was responsible for almost a quarter of graft failures, again highlighting the delicate balance between over- and underimmunosuppression. Further, 31 of 303 transplants (10.2%) were lost due to cardiorenal events, surpassing PVN and recurrent disease and confirming recently published results.12,28 Most patients already had a long history of cardiovascular events, pointing toward the need for careful selection of transplant candidates.
Given the high proportion of death with a functioning graft due to infections, malignancy, and cardiovascular disease,8 our findings stress the importance of those events for death-censored graft failure as well. Our results imply that, even though death-censored graft failure and death with a functioning graft may represent differing clinical phenotypes as previously described,29 they share common causes, which—if adequately prevented—will lead to significant improvements of overall graft survival.
The importance of CNI toxicity has largely varied over the last two decades: whereas Nankivell et al. 30,31 suggested that almost all organs are affected by histologic signs of CNI toxicity, the DeKAF study had 35% locally diagnosed CNI toxicity, with around 15% graft failures attributed to CNI toxicity during follow-up.32 A paper from the Mayo Clinic suggested only marginal contribution of CNI toxicity to graft failure over an average observation period of around 4 years post-transplant.8 The main problems are that there is no accepted classification, histology may be unspecific, and it takes years to develop. For our assessment, we used histology, mainly the evolution of hyalinosis, combined with the clinical course (progressive deterioration of renal function in the absence of other identifiable causes). It is important to mention that the switch to a CNI-free treatment addresses the underlying cause of nephron injury and was performed frequently in our center. In many cases, renal function stabilized as shown in many previous studies. However, we also noticed the development of DSA in many CNI-free patients with subsequent graft failure due to rejection. The threat of developing a rejection after changing to a CNI-free regime due to CNI toxicity adds an additional layer of complexity to the prevention of graft failure and points toward the need for a multidimensional classification.
Recurrent disease, BK virus, and transplant quality contributed each with around 7%–10% to graft failures, further pointing toward the large variety of different causes for graft failure. In previous studies, recurrent disease was more prominent, which might be partly explained by the higher number of elderly recipients >65 years of age in our cohort. Most of them participated in the Eurotransplant Senior Program, receiving an elderly organ (>65 years), which explains that around 10% of graft failures were associated with poor transplant quality (defined by poor functional outcome and histology). Fortunately, there were only a very few nonfunctioning kidneys, but many of those kidneys with poor quality failed within 1–5 years after transplantation. Our analysis clearly demonstrates that poor transplant quality with only a limited number of viable nephrons is a problem in today’s organ shortage and highlights the need for better identification of those elderly donors who will have acceptable long-term outcomes.
Nevertheless, there are still some limitations to this study. First, it was not possible to catch every single reason for a persistent decline in renal function. This was mostly caused by biopsy availability but also, by inconclusive biopsy results. In order to increase reproducibility, we defined exact attribution rules for the main reasons leading to graft failure. However, medicine is not binary, and there may be some uncertainty regarding specificity and sensitivity of category attribution. This is especially the case for categories without a consensus in literature, such as CNI toxicity.
The second independent validation, although showing a high overall agreement, underlined the complexity of graft failure. The validation clearly revealed how difficult the assignment of a cause to a persistent decline in renal function can be and which cause was primarily responsible for the GL. Typical examples were situations where two causes co-occurred for a short period (e.g., a rejection followed by an infection after adjustment of the immunosuppressive regimen) or even were present simultaneously for a longer period (e.g., signs for CNI toxicity and chronic ABMR), making it impossible to objectively split the effect of each entity on graft failure. Another difficult assessment is early potentially harmful events leading to a delayed and incomplete decline of creatinine after transplantation. During the second review process, it became obvious how difficult it is to assess the effect of one or multiple early events, such as poor donor quality, delayed graft function, early TCMR, perioperative problems, and infections, on renal function and long-term outcome. Although reviewers agreed that the early injury and nephron loss were important contributing factors for premature graft loss, the judgement on magnitude and the causality of the simultaneous occurring events is sometimes challenging.
In summary, we were able to identify at least 30 different reasons for graft failure (Figure 7). Interestingly, in around 51% of graft failures, more than one reason for a persistent and clinically relevant decline in renal function was obvious. As expected, ABMR, recurrent disease, BK virus, perioperative events, and CNI toxicity were major categories for graft failure. However, here we also found that TCMR, poor donor, quality and medical events play an important role for irreversible nephron injury, which might be especially detrimental if only a reduced number of functioning nephrons is transplanted. Thus, in the current era of marginal donors and elderly recipients, we should broaden our understanding for the complexity of GL mechanisms if we want to improve results after kidney transplantation.
Figure 7.
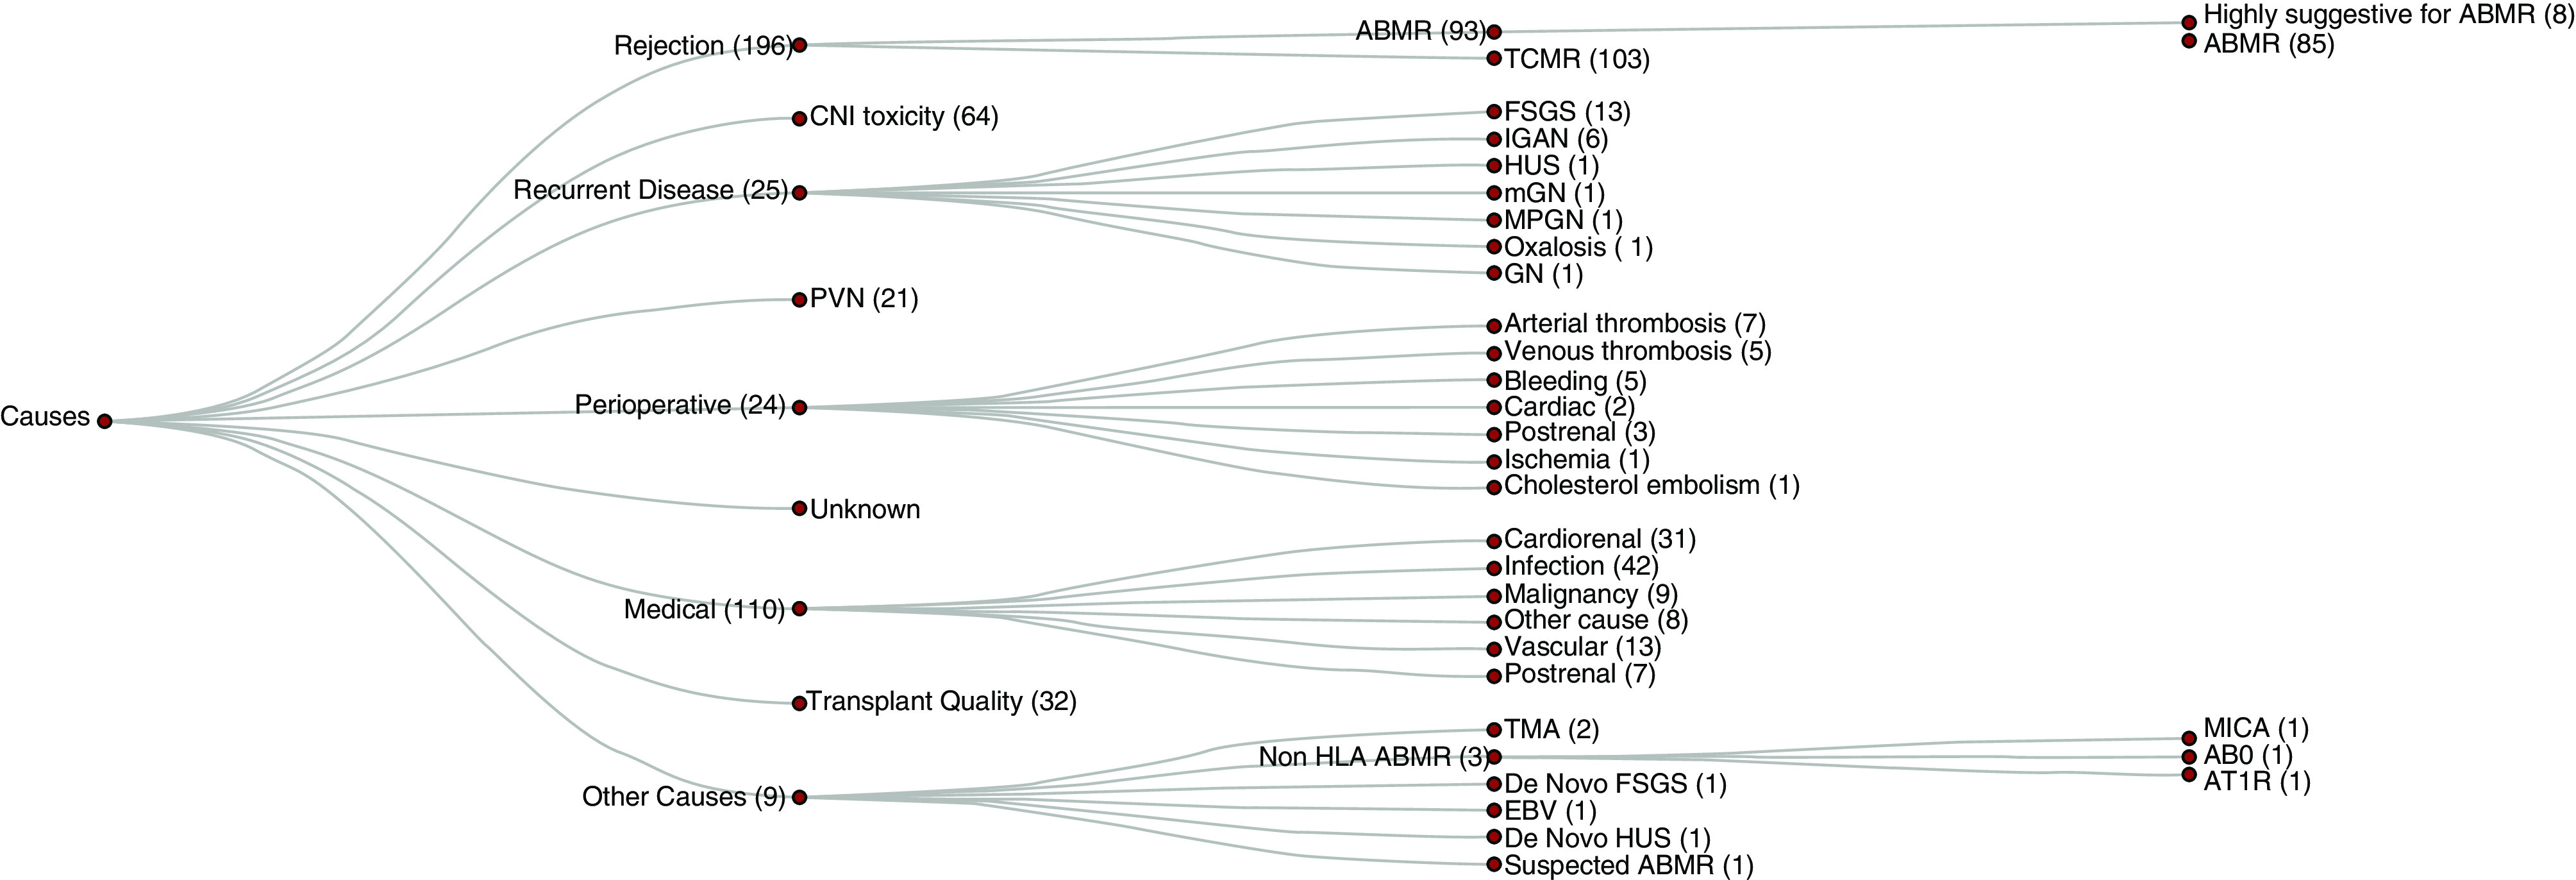
Granular breakdown of primary and secondary causes leading to graft failure. The most common cause for graft failure caused by disease recurrence was FSGS (13) followed by IGAN (6). Graft failures caused by perioperative events were mostly due to thromboses (12). ABO, ABO blood group system; AT1R, Angiotensin II Type 1–Receptor; EBV, Epstein–Barr virus; Focal segmental glomerulosclerosis; HUS, Hemolytic uremic syndrome; IGAN, IgA nephropathy; mGN, Membranous glomerulonephritis; MICA, Major Histocompatibility Complex Class I Chain-Related A; MPGN, Membranoproliferative glomerulonephritis; TMA, thrombotic microangiopathy.
Disclosures
K. Budde reports consultancy agreements with Abbvie, Alexion, Astellas, Bristol-Myers Squibb, Chiesi, CSL-Behring, Fresenius, Hansa, Hexal, MSD, Novartis, Otsuka, Pfizer, Quark, Roche, Sandoz, Shire, Veloxis, Vifor, and Vitaeris; research funding from Abbvie, Alexion, Astellas, Bristol-Myers Squibb, Chiesi, CSL-Behring, Fresenius, Hansa, Hexal, MSD, Novartis, Otsuka, Pfizer, Quark, Roche, Sandoz, Shire, Veloxis, Vifor, and Vitaeris; honoraria from Abbvie, Alexion, Astellas, Bristol-Myers Squibb, Chiesi, Fresenius, Hexal, Novartis, Otsuka, Pfizer, Quark, Roche, Sandoz, Shire, and Veloxis Pharma; and scientific advisor or membership with Astellas, Bristol-Myers Squibb, Chiesi, Hansa, Hexal, MSD, Novartis, Pfizer, Roche, and Veloxis. M. Duerr reports research funding from Bristol-Myers Squibb; honoraria from Novartis and Shire; and scientific advisor or membership with Novartis. N. Lachmann reports consultancy agreements with BmT GmbH. L. Liefeldt reports honoraria from Chiesi. M. Naik reports research funding from the Berlin Institute of Health; honoraria from travel expenditures to Abbot Pharma, Neovii, Pfizer, and TevaPharm; scientific advisor or membership with Pfizer; and ownership interest in Alexion Pharmaceuticals, Bayer, and Fresenius Medical Care. All remaining authors have nothing to disclose.
Funding
None.
Supplementary Material
Acknowledgments
K. Budde, L. Liefeldt, and Dr. M. Mayrdorfer designed the study; B. Rudolph and K. Wu analyzed the biopsies; K. Budde, W. Duettmann, F. Friedersdorff, F. Halleck, N. Lachmann, L. Liefeldt, Dr. M. Mayrdorfer, M. Merkel, M. Naik, B. Rudolph, D. Schmidt, E. Schrezenmeier, J. Waiser, K. Wu, and Q. Zhang participated in the writing of the paper; K. Budde, Dr. M. Mayrdorfer, M.G. Naik, and D. Schmidt participated in data analysis; Dr. M. Mayrdorfer made the figures; M. Duerr, F. Halleck, M. Naik, B. Osmanodja, E. Schrezenmeier, and J. Waiser performed the second independent validation; and all authors approved the final version of the manuscript.
Footnotes
Published online ahead of print. Publication date available at www.jasn.org.
Supplemental Material
This article contains the following supplemental material online at http://jasn.asnjournals.org/lookup/suppl/doi:10.1681/ASN.2020081215/-/DCSupplemental.
Supplemental Figure 1. Density plot for primary plus secondary causes leading to graft failure.
Supplemental Figure 2. Co-occurrence of ABMR or TCMR with other causes (primary or secondary) per transplant.
Supplemental Figure 3. Percentage of primary causes in nonadherent patients progressing to graft failure.
Supplemental Figure 4. Comparison of causes assigned to a subset of 150 graft failures by external raters and the original assignment.
Supplemental Table 1. Inter-rater reliability.
References
- 1. Wolfe RA, Ashby VB, Milford EL, Ojo AO, Ettenger RE, Agodoa LY, et al.: Comparison of mortality in all patients on dialysis, patients on dialysis awaiting transplantation, and recipients of a first cadaveric transplant. N Engl J Med 341: 1725–1730, 1999. [DOI] [PubMed] [Google Scholar]
- 2. Suthanthiran M, Strom TB: Renal transplantation. N Engl J Med 331: 365–376, 1994. [DOI] [PubMed] [Google Scholar]
- 3. Schnuelle P, Lorenz D, Trede M, Van Der Woude FJ: Impact of renal cadaveric transplantation on survival in end-stage renal failure: Evidence for reduced mortality risk compared with hemodialysis during long-term follow-up. J Am Soc Nephrol 9: 2135–2141, 1998. [DOI] [PubMed] [Google Scholar]
- 4. Oniscu GC, Brown H, Forsythe JL: Impact of cadaveric renal transplantation on survival in patients listed for transplantation. J Am Soc Nephrol 16: 1859–1865, 2005. [DOI] [PubMed] [Google Scholar]
- 5. Valderrábano F, Jofre R, López-Gómez JM: Quality of life in end-stage renal disease patients. Am J Kidney Dis 38: 443–464, 2001. [DOI] [PubMed] [Google Scholar]
- 6. Lamb KE, Lodhi S, Meier-Kriesche HU: Long-term renal allograft survival in the United States: A critical reappraisal. Am J Transplant 11: 450–462, 2011. [DOI] [PubMed] [Google Scholar]
- 7. Coemans M, Süsal C, Döhler B, Anglicheau D, Giral M, Bestard O, et al.: Analyses of the short- and long-term graft survival after kidney transplantation in Europe between 1986 and 2015. Kidney Int 94: 964–973, 2018. [DOI] [PubMed] [Google Scholar]
- 8. El-Zoghby ZM, Stegall MD, Lager DJ, Kremers WK, Amer H, Gloor JM, et al.: Identifying specific causes of kidney allograft loss. Am J Transplant 9: 527–535, 2009. [DOI] [PubMed] [Google Scholar]
- 9. Sellarés J, de Freitas DG, Mengel M, Reeve J, Einecke G, Sis B, et al.: Understanding the causes of kidney transplant failure: The dominant role of antibody-mediated rejection and nonadherence. Am J Transplant 12: 388–399, 2012. [DOI] [PubMed] [Google Scholar]
- 10. Naesens M, Kuypers DR, De Vusser K, Evenepoel P, Claes K, Bammens B, et al.: The histology of kidney transplant failure: A long-term follow-up study. Transplantation 98: 427–435, 2014. [DOI] [PubMed] [Google Scholar]
- 11. Chand S, Atkinson D, Collins C, Briggs D, Ball S, Sharif A, et al.: The spectrum of renal allograft failure. PLoS One 11: e0162278, 2016. [DOI] [PMC free article] [PubMed] [Google Scholar]
- 12. Van Loon E, Senev A, Lerut E, Coemans M, Callemeyn J, Van Keer JM, et al.: Assessing the complex causes of kidney allograft loss. Transplantation 104: 2557–2566, 2020. [DOI] [PubMed] [Google Scholar]
- 13. Schröter K, von Trzebiatowski GL, Fritsche L: TBase2 — a web-based electronic patient record. Fundamenta Informaticae 43: 343–353, 2000. [Google Scholar]
- 14. Lachmann N, Terasaki PI, Budde K, Liefeldt L, Kahl A, Reinke P, et al.: Anti-human leukocyte antigen and donor-specific antibodies detected by luminex posttransplant serve as biomarkers for chronic rejection of renal allografts. Transplantation 87: 1505–1513, 2009. [DOI] [PubMed] [Google Scholar]
- 15. Wu K, Budde K, Lu H, Schmidt D, Liefeldt L, Glander P, et al.: The severity of acute cellular rejection defined by Banff classification is associated with kidney allograft outcomes. Transplantation 97: 1146–1154, 2014. [DOI] [PubMed] [Google Scholar]
- 16. Haas M, Loupy A, Lefaucheur C, Roufosse C, Glotz D, Seron D, et al.: The Banff 2017 Kidney Meeting Report: Revised diagnostic criteria for chronic active T cell-mediated rejection, antibody-mediated rejection, and prospects for integrative endpoints for next-generation clinical trials. Am J Transplant 18: 293–307, 2018. [DOI] [PMC free article] [PubMed] [Google Scholar]
- 17. R Core Team: R: A Language and Environment for Statistical Computing, Vienna, Austria, R Foundation for Statistical Computing, 2020. [Google Scholar]
- 18. Wickham H: ggplot2: Elegant Graphics for Data Analysis, New York, Springer, 2016. [Google Scholar]
- 19. Wickham H, Averick M, Bryan J, Chang W, McGowan L, François R, et al.: Welcome to the tidyverse. J Open Source Softw 4: 1686, 2019. [Google Scholar]
- 20. Allaire J, Ellis P, Gandrud C, Kuo K, Lewis BW, Owen J, et al.: Package networkD3. D3 javaScript network graphs from R, 2017. Available at: https://cran.r-project.org/web/packages/networkD3/index.html. Accessed January 4, 2021
- 21. Kassambara A, Kosinski M, Biecek P, Fabian S: survminer: Drawing survival curves using 'ggplot2', 2019. Available at: https://cran.r-project.org/web/packages/survminer/index.html. Accessed January 4, 2021
- 22. Van Loon E, Bernards J, Van Craenenbroeck AH, Naesens M: The causes of kidney allograft failure: More than alloimmunity. A viewpoint article. Transplantation 104: e46–e56, 2020. [DOI] [PubMed] [Google Scholar]
- 23. Gaston RS, Fieberg A, Hunsicker L, Kasiske BL, Leduc R, Cosio FG, et al.: Late graft failure after kidney transplantation as the consequence of late versus early events. Am J Transplant 18: 1158–1167, 2018. [DOI] [PubMed] [Google Scholar]
- 24. Raynaud M, Aubert O, Reese PP, Bouatou Y, Naesens M, Kamar N, et al.: Trajectories of glomerular filtration rate and progression to end stage kidney disease after kidney transplantation. Kidney Int 99: 186–197, 2021. [DOI] [PubMed] [Google Scholar]
- 25. Meier-Kriesche HU, Li S, Gruessner RW, Fung JJ, Bustami RT, Barr ML, et al.: Immunosuppression: Evolution in practice and trends, 1994–2004. Am J Transplant 6: 1111–1131, 2006. [DOI] [PubMed] [Google Scholar]
- 26. Gaston RS: Improving long-term outcomes in kidney transplantation: Towards a new paradigm of post-transplant care in the United States. Trans Am Clin Climatol Assoc 127: 350–361, 2016. [PMC free article] [PubMed] [Google Scholar]
- 27. Denhaerynck K, Dobbels F, Cleemput I, Desmyttere A, Schäfer-Keller P, Schaub S, et al.: Prevalence, consequences, and determinants of nonadherence in adult renal transplant patients: A literature review. Transpl Int 18: 1121–1133, 2005. [DOI] [PubMed] [Google Scholar]
- 28. Waiser J, Knebel F, Rudolph B, Wu K, Müller E, Sanad W, et al.: Renal allograft loss caused by cardiorenal syndrome: Frequency and diagnosis. Transplantation 99: 1208–1215, 2015. [DOI] [PubMed] [Google Scholar]
- 29. Gaston RS, Fieberg A, Helgeson ES, Eversull J, Hunsicker L, Kasiske BL, et al.; DeKAF Investigators*: Late graft loss after kidney transplantation: Is “death with function” really death with a functioning allograft? Transplantation 104: 1483–1490, 2020. [DOI] [PubMed] [Google Scholar]
- 30. Nankivell BJ, PʼNg CH, OʼConnell PJ, Chapman JR: Calcineurin inhibitor nephrotoxicity through the lens of longitudinal histology: Comparison of cyclosporine and tacrolimus eras. Transplantation 100: 1723–1731, 2016. [DOI] [PubMed] [Google Scholar]
- 31. Nankivell BJ, Borrows RJ, Fung CL, O’Connell PJ, Allen RD, Chapman JR: The natural history of chronic allograft nephropathy. N Engl J Med 349: 2326–2333, 2003. [DOI] [PubMed] [Google Scholar]
- 32. Gaston RS, Cecka JM, Kasiske BL, Fieberg AM, Leduc R, Cosio FC, et al.: Evidence for antibody-mediated injury as a major determinant of late kidney allograft failure. Transplantation 90: 68–74, 2010. [DOI] [PubMed] [Google Scholar]
Associated Data
This section collects any data citations, data availability statements, or supplementary materials included in this article.


