

Significance Statement
Nicotinamide mononucleotide (NMN) is the precursor of NAD+ that activates Sirtuin1 (Sirt1), an antiaging enzyme. Although some studies have administered NMN treatment in several disease models with favorable outcomes, NMN treatment in diabetic nephropathy has been scarcely examined. The authors showed a long-lasting renoprotective effect by transient pulse NMN administration in early DN in a murine model. Specifically, although NMN treatment did not change metabolic parameters, it attenuated decreased Sirt1, foot-process effacement of podocytes, and decreased albuminuria even long after pulse NMN treatment cessation. These findings indicate NMN is a potential preventive treatment in DN.
Keywords: diabetic nephropathy
Visual Abstract

Abstract
Background
The activation of NAD+-dependent deacetylase, Sirt1, by the administration of nicotinamide mononucleotide (NMN) ameliorates various aging-related diseases.
Methods
Diabetic db/db mice were treated with NMN transiently for 2 weeks and observed for effects on diabetic nephropathy (DN).
Results
At 14 weeks after the treatment period, NMN attenuated the increases in urinary albumin excretion in db/db mice without ameliorating hemoglobin A1c levels. Short-term NMN treatment mitigated mesangium expansion and foot process effacement, while ameliorating decreased Sirt1 expression and increased claudin-1 expression in the kidneys of db/db mice. This treatment also improved the decrease in the expression of H3K9me2 and DNMT1. Short-term NMN treatment also increased kidney concentrations of NAD+ and the expression of Sirt1 and nicotinamide phosphoribosyltransferase (Nampt), and it maintained nicotinamide mononucleotide adenyltransferase1 (Nmnat1) expression in the kidneys. In addition, survival rates improved after NMN treatment.
Conclusions:
Short-term NMN treatment in early-stage DN has remote renal protective effects through the upregulation of Sirt1 and activation of the NAD+ salvage pathway, both of which indicate NMN legacy effects on DN.
Diabetic nephropathy (DN) is the leading cause of ESKD.1 Some 20%–40% of patients with diabetes progress to DN.2 Before progression to ESKD, DN is clinically characterized by glomerular hyperfiltration and albuminuria, and it is histologically characterized by glomerular hypertrophy, glomerular podocyte foot process effacement, and glomerular mesangium expansion.3 In addition to these glomerular lesions, tubulointerstitial lesions independently lead to renal tissue damage. We have previously reported early changes in proximal tubule (PT) metabolic abnormalities in diabetic mice that precede glomerular dysfunction and diabetic albuminuria.4 We have demonstrated that the downregulation of Sirtuin proteins, key molecules of energy metabolism, plays an essential role in this initial step and progression of DN concomitantly with dysregulation of NAD+ metabolism in the PT.
Sirtuin is an NAD+-dependent deacetylase whose expression decreases with age and in several diseases, including diabetes.5–7 A member of the Sirtuin family, Sirt1, also plays an important role in DN. DN deteriorates in podocyte-specific Sirt1 knockout diabetic db/db mice. In addition, streptozotocin (STZ)-induced DN was more progressed in Sirt1 knockdown mice than in its control STZ-induced DN mice.8,9 In contrast, Sirt1 overexpression ameliorates DN,10 which involves several transcription factors, such as p53, FOXO, RelA/p65NF-κB, STAT3, and PGC1α/PPARγ.11,12 Sirt1 exerts its effects via protein deacetylase activity against these molecules and via histone deacetylase activity. Through histone deacetylation activity, Sirt1 regulates various gene expression levels epigenetically, along with DNA methylation. We have previously demonstrated that Sirt1 inactivation in podocytes upregulated ectopic expression of the claudin-1 gene, leading to the abrogation of glomerular barrier function through epigenetic mechanisms of reduced methylation of the claudin-1 gene.4 Given the epigenetic effects could last for a prolonged period, the upregulation of claudin-1 might lead to glomerular damage. This gene regulation effect is thought to be a molecular mechanism underlying memory or legacy effects in diabetic complications, which have been observed in a previous large clinical trial (United Kingdom Prospective Diabetes Study [UKPDS] 80).13 Along these lines, reactivation of Sirt1 is expected to provide legacy effects in diabetic complications, including DN.
Sirt1 activity depends on the cellular levels of NAD+. NAD+ concentrations in each organ have been reported to decrease with aging, which contributes to the pathophysiology of various age-related diseases, including DN.14–16 Therefore, in these diseases, declines in Sirt1 activation could be a potential therapeutic target.17 Several strategies to increase Sirt1 activity have been reported,18 including caloric restriction,19–21 administration of resveratrol,22–24 and approaches to restore NAD+ levels, such as the administration of NAD+ metabolites25 or the inhibition of Sirt1 consumers such as polymerase ADP-ribose polymerase.26,27 In addition, several substances have been reported to increase NAD+ concentration and Sirt1 activity or expression in DN.28–30 In terms of supplementation with NAD+ metabolites, nicotinamide riboside (NR) and nicotinamide mononucleotide (NMN), have fewer adverse effects and they efficiently enhance NAD+ biosynthesis.31–35 As for kidney diseases, NAM treatments have been reported,36–38 whereas NMN treatments have been reported in cisplatin-induced AKI murine and STZ-induced DN murine models.39–41
NMN is an intermediate of the NAD+ salvage pathway produced by the NAM phosphoribosyltransferase (Nampt) enzyme from NAM. In this pathway, NMN is further converted into NAD+ by NMN adenyltransferase1 (Nmnat), and this NAD+ is recycled in various metabolic and cellular reactions.
In this study, we assessed the renoprotective effect of preemptive short-term NMN treatment in mice with DN. Our results suggest NAD+ and Sirt1 deficits in mice with diabetes contribute to kidney damage susceptibility. Short-term NMN treatment rescued the diabetic kidneys from podocyte damage through the restoration of renal NAD+ concentrations even after the termination of the treatment. Additionally, we observed long-term effects of the dynamics of NAD+ metabolites after the treatment, suggesting legacy effects by reactivation of Sirt1. This study suggests a novel treatment paradigm for DN, which could enhance possibilities for achieving the remission of DN and other diabetic complications.
Methods
Animal Experiment Protocols
Eight-week-old male diabetic db/db mice (BKS.Cg-+ Lepr db/+ Lepr db/Jcl) and nondiabetic control 8-week-old male db/m mice (BKS.Cg-m +/+ Lepr db/Jcl) were purchased from Japan CLEA Co. (Tokyo, Japan). We only used male mice, because development of overt diabetes was reported to be less frequent in female than in male db/db mice.42 The animals were housed at a constant room temperature (22±1°C) under a controlled 12-hour light/dark cycle. The mice had free access to water and regular chow. Db/db mice were randomly assigned to one of two groups (36 per group): treatment with vehicle (normal saline) or treatment with NMN (500 mg/kg per day) in normal saline. In total, 36 db/m (BKS.Cg-m +/+ Lepr db/Jcl) mice were treated with vehicle as nondiabetic controls. Vehicle and NMN were administered intraperitoneally every day for 14 consecutive days. Kidneys were harvested after 14 days of treatment. Serum and urine analyses were performed. Mice were also examined at 24 and 30 weeks of age. We measured body weight biweekly and HbA1c levels at 10 weeks of age just after treatment termination, at 24 weeks of age (14 weeks after treatment termination), and at 30 weeks of age (20 weeks after treatment termination). Histologic analyses were performed at 10 weeks of age, just after treatment termination, 24 weeks of age (14 weeks after treatment termination), and 30 weeks of age (20 weeks after treatment termination). The treatment protocol for NAM treatment was almost the same as the NMN treatment protocol. Normal saline or NAM (200 mg/kg per day) in normal saline was administered intraperitoneally every day for 14 consecutive days. Moreover, HbA1c and urine analyses were performed at 10 weeks of age. All animal studies were approved by the Animal Care Committee of the Keio University School of Medicine in accordance with the national and regional guidelines.
Blood and Urine Examination
Urine was collected for 24 hours from metabolic cages at 10, 24, and 30 weeks of age before the mice were sacrificed. Blood was drawn at 10, 24, and 30 weeks of age. Renal function was evaluated on the basis of serum creatinine levels and creatinine clearance (Ccr). Furthermore, Ccr was calculated using urinary creatinine × urine volume/serum creatinine/1440. Albuminuria was assessed on the basis of the urine albumin-creatinine ratio (ACR). Urine albumin was assessed by Albuwell M ELISA (Ethos Biosciences, PA). Urine and serum creatinine were assessed using the QuantiChrom Creatinine Assay Kit (BioAssay Systems, CA). HbA1c levels were measured with an A1C Now-Plus (PTS Diagnostics, IN) device before sacrificing the mice.
Animal Survival Analysis
The mice were followed until 24 weeks of age and were evaluated for the survival analysis. Survival was monitored several times a week. A Kaplan-Meyer survival analysis and log rank test were performed. P<0.05 was considered statistically significant.
Kidney Histology and Immunohistochemistry
Images from at least 20 sequential glomerular cross-sections divided approximately at the glomerular equator were collected for each histologic section by blinded observers. Periodic acid–Schiff (PAS) stained samples from 20 consecutive glomeruli per animal were examined. The glomerular surface area was traced along the outline of the capillary loop using Image-Pro Plus 7.0J software (Media Cybernetics, Silver Spring, MD). For the quantitative analysis of mesangial expansion, the PAS-positive area in the glomeruli was evaluated. Specifically, a minimum hue–saturation–intensity threshold was set on Image-Pro Plus 7.0J software (Media Cybernetics, Silver Spring, MD), and the area exceeding this threshold was counted as a PAS-positive area. Consequently, the percentage of PAS-positive area per glomeruli was calculated. Immunohistochemistry (IHC) was performed as previously described. Briefly, paraffin sections (4 μm) were fixed in 3% formaldehyde and stained using claudin-1 (51–9000, 1:50; Invitrogen), Sirt1 (07–131, 1:100; Sigma-Alrdich), synaptopodin (10R-S125A, undiluted; Fitzgerald), WT-1 (C-19, 1:200; Santa Cruz), Nampt (A300–372A, 1:500; Bethyl Laboratories), Nmnat1 (11399–1AP, 1:500; Proteintech), Sirt3 (C73E3, 1:50; Cell Signaling), Sirt6 (aa250–334, 1:2500; LSBio), DNMT1 (5032, 1:100; Cell Signaling Technology), and H3K9me2 (mAbcam 1220, 1:200; Abcam) primary antibodies. Goat anti-rabbit IgG (414341; Nichirei) and goat anti-mouse IgG (414321; Nichirei) antibodies were used as the secondary antibody.
All sections were examined under a light microscope (Olympus BX53 microscope) and digitized with a high-resolution camera. For the quantitative analysis of staining for Sirt1, claudin-1, synaptopodin, Sirt3, Sirt6, H3K9me2, and DNMT1, the DAB-stained area per glomerular surface area was calculated using Image-Pro Plus 7.0J software. For the quantitative analysis of staining for Nampt and Nmnat1, the DAB-stained area per section per kidney was calculated using Definiens Tissue Studio software (Definiens, Munich, Germany). All assessments were performed in a blinded manner. Four kidneys were examined in each group.
Electron Microscopy
For the electron microscopy (EM) evaluation, kidney tissues were harvested and fixed overnight at 4°C, with 2% paraformaldehyde and 2% glutaraldehyde in 0.1 M phosphate buffer (PB) pH 7.4. After fixation, the samples were washed three times with 0.1 M PB for 30 minutes each and were postfixed with 2% osmium tetroxide in 0.1 M PB at 4°C for 2 hours. Fixed tissue blocks were embedded in Epon epoxy resin. The average number of podocyte foot processes were counted and divided by the glomerular basement membrane (GBM) length (μm) to determine the foot process densities. Counts were made on 105 micrographs from at least three glomeruli in each mouse. The length and thickness of GBM were measured using Image-Pro Plus 7.0J software.
NAD+ Metabolite Measurement
The tissues were homogenized with three volumes of methanol containing 6% perchloric acid and 4% phosphoric acid. Next, three volumes of methanol, including deuterated internal standard, were added to the tissue homogenate or serum samples. The mixture was vortexed and centrifuged. The supernatant was diluted with water and analyzed using liquid chromatography/mass spectrometry/mass spectrometry (LC/MS/MS). A Shimadzu Nexera ultra high-performance liquid chromatograph system (Shimadzu, Kyoto, Japan) consisting of an LC-30 AD pump, DGU-20A5R degasser, CTO-20AC column oven, and an SIL-30ACMP autosampler was used. Separation was performed on a Triart C18 column (3.0×150 mm, 5 μm, YMC, Kyoto, Japan) at 50°C. Mobile phase A was water/formic acid/undecafluorohexanoic acid (1000/0.1/0.2, v/v/v) and mobile phase B was methanol. The chromatographic conditions were 0–4 minutes (5%–80% B, 0.5 ml/min), 4–4.01 minutes (80%–95% B, 0.5–1.0 ml/min), 4.01–7 minutes (95% B, 1.0 ml/min), 7–7.01 minutes (95%–5% B, 1.0–0.5 ml/min), and 7.01–13 minutes (5% B, 0.5 ml/min). Mass spectrometric detection was performed using an API5000 triple quadrupole mass spectrometer (SCIEX, Framingham, MA) with electrospray ionization operated in positive ion mode. The electrospray ionization mass spectrometry/mass spectrometry (MS/MS) parameters were optimized using standard solutions for each analyte. Quantitation was performed by multiple reaction monitoring with the following transitions: m/z 123 →80 for NAM, m/z 335 →123 for NMN, and m/z 664 →136 for NAD+.
Statistical Analyses
We used SPSS (Version 25) or GraphPad Prism 8 software (GraphPad Software, CA) to perform the statistical analyses. Data are expressed as mean±SEM. Comparisons among several groups were analyzed by one-way ANOVA with Tukey’s post hoc test. P<0.05 was considered statistically significant.
Results
Metabolic Changes after NMN Treatment
NMN is an NAD+ precursor in the salvage pathway (Figure 1A). We previously reported that deficiencies in NMN in the PTs triggered diabetic albuminuria.4 We administered transient short-term NMN treatment. Type 2 diabetic 8-week-old db/db mice were treated intraperitoneally with NMN at a dose of 500 mg/kg per day or with normal saline alone for 14 consecutive days (Figure 1B). Each week, the body weights of the db/db mice treated with normal saline (db/db) or NMN (NMN500) were greater than those of db/m mice treated with normal saline (db/m). There was no difference between the db/db and NMN500 groups (Figure 1C). HbA1c levels were significantly higher in the db/db or NMN500 group than in the db/m mice at 10, 24, and 30 weeks of age (Figure 1, D–F). There were no significant differences in HbA1c levels between NMN500 and db/db groups at these three ages. To assess the metabolic changes during and immediately after treatment, we examined the intraperitoneal glucose tolerance test (IPGTT), insulin tolerance test (ITT), food intake, oxygen consumption, respiratory quotient, and energy expenditure (EE). Although diabetic changes were observed in the db/db group compared with the db/m group, there was no significant difference in IPGTT, ITT, food intake, oxygen consumption, respiratory quotient, or EE between the db/db and the NMN500 groups (Supplemental Methods, Supplemental Figures 1 and 2). Taken together, NMN treatment did not affect energy or glucometabolism after treatment.
Figure 1.
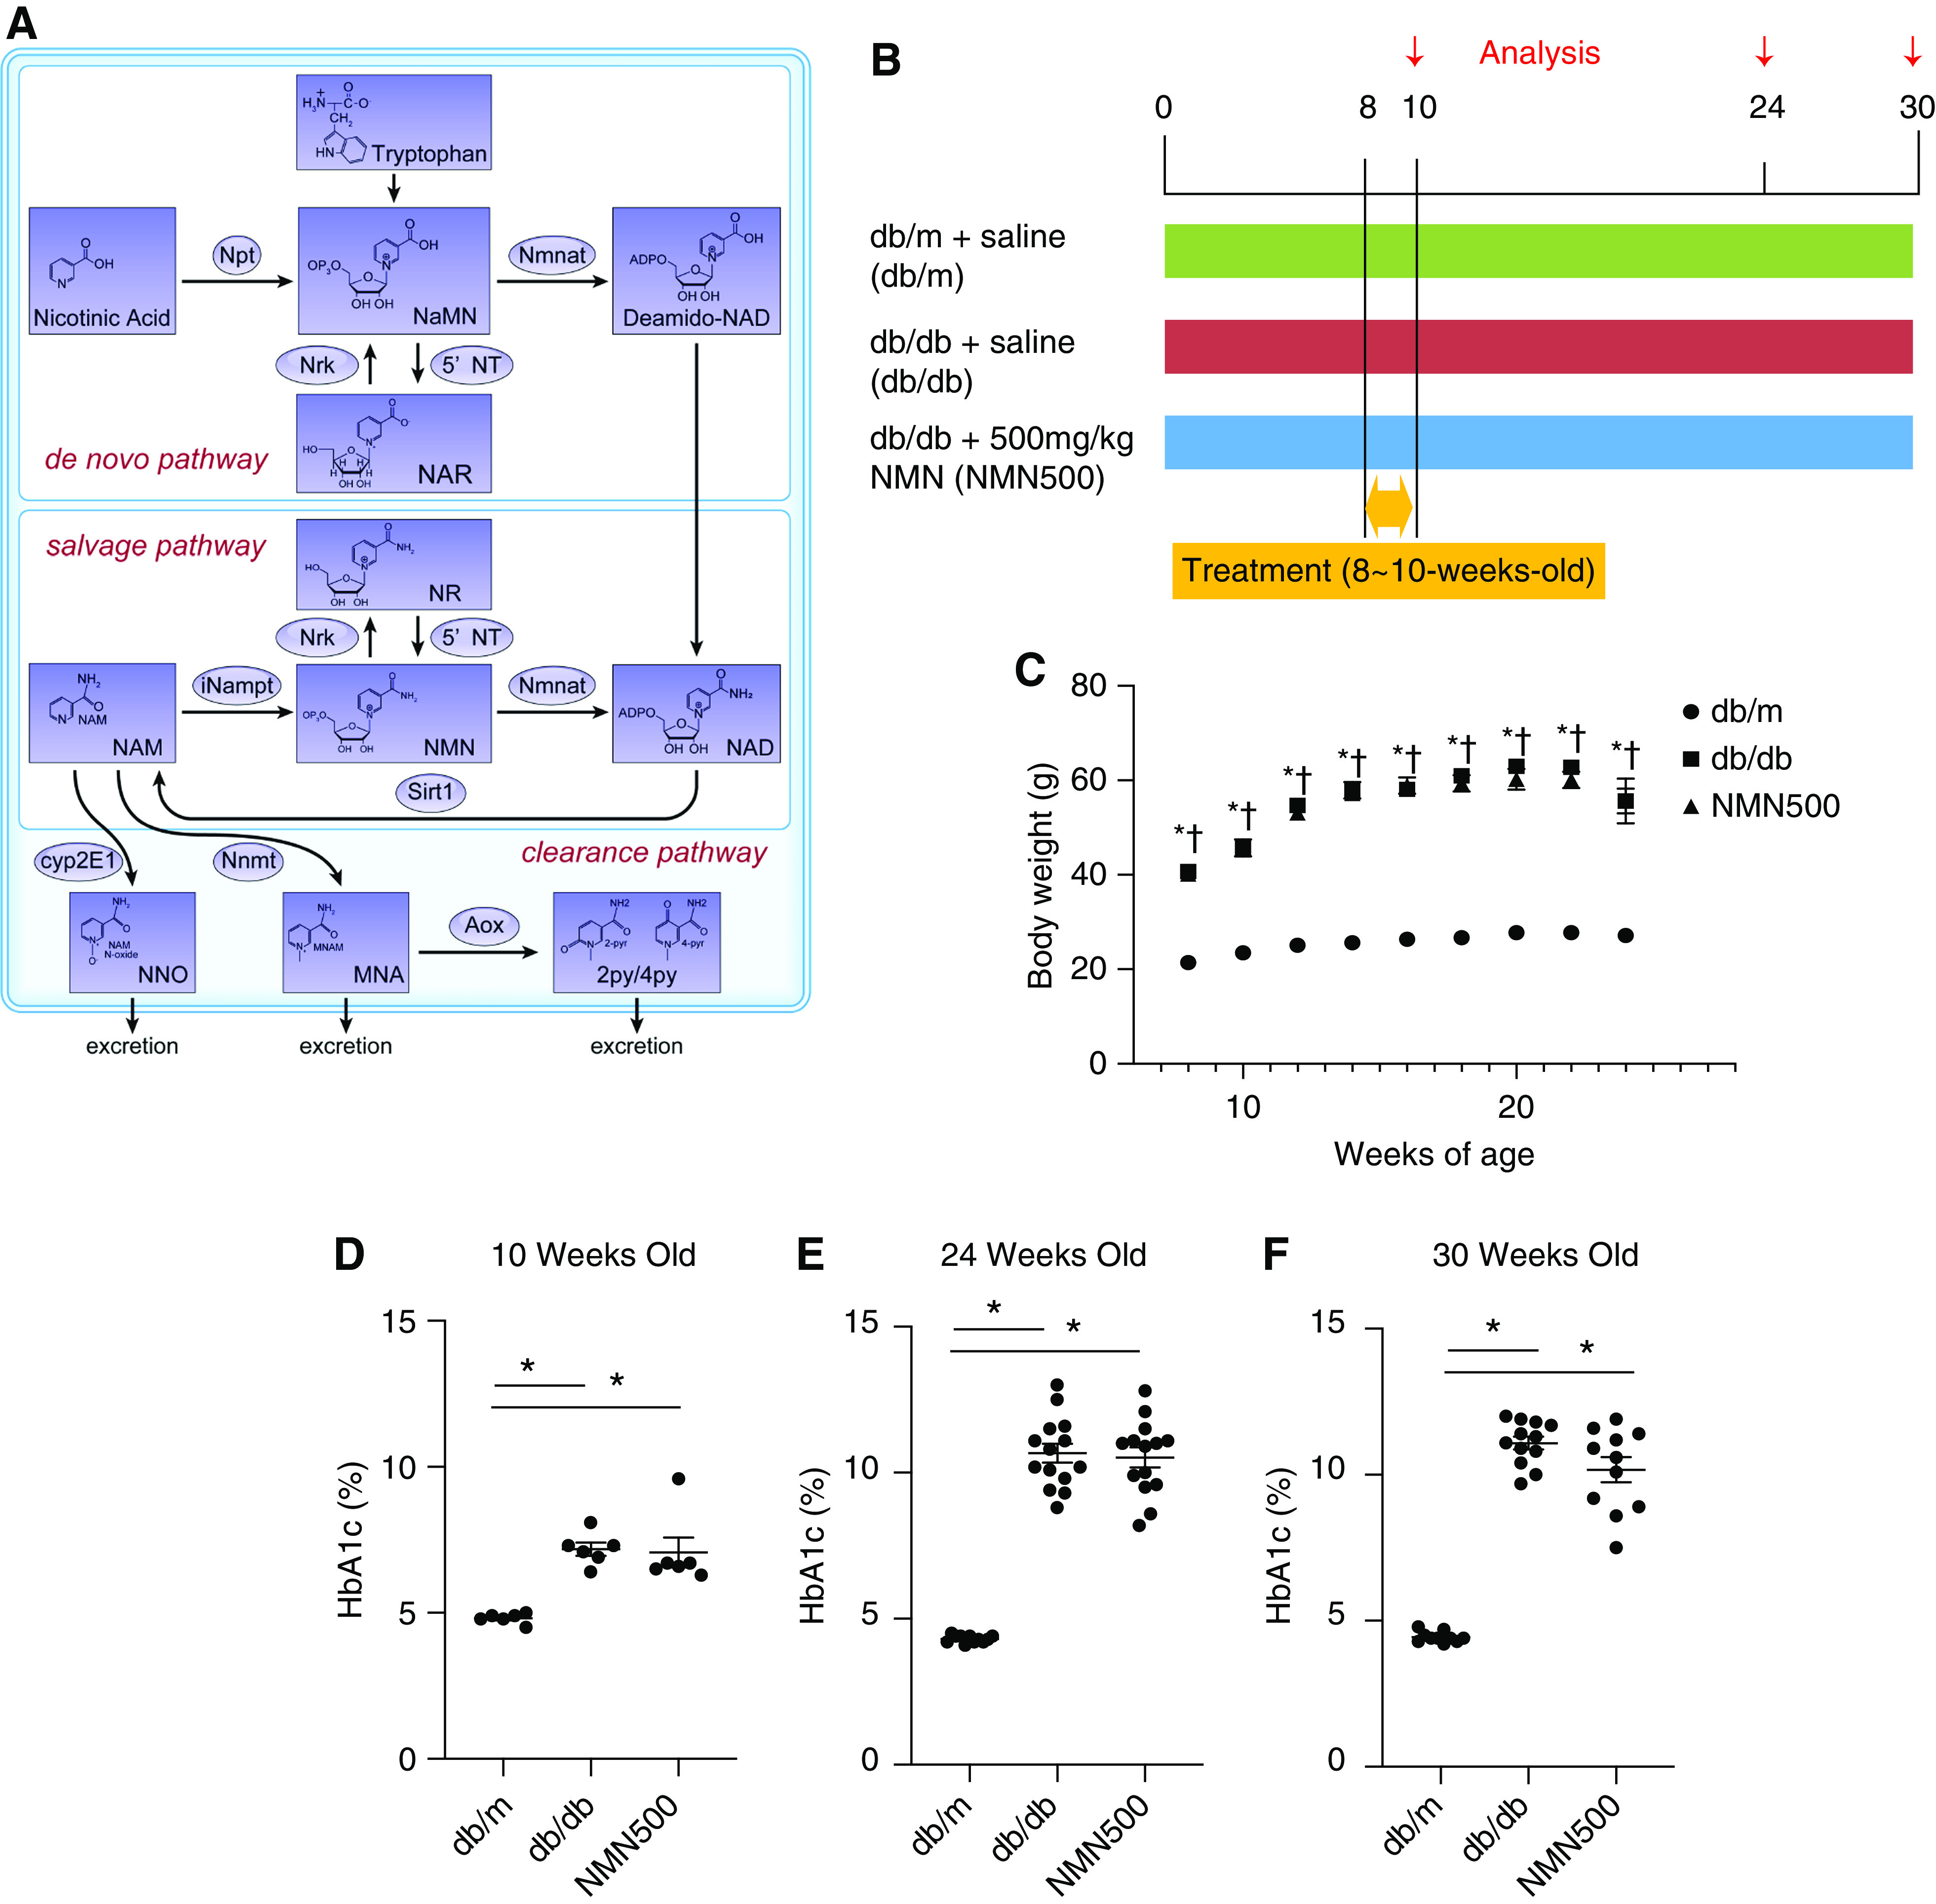
Metabolic changes after NMN treatment. (A) Schematic diagram showing the NAD+ metabolic pathway. Npt, nicotinic acid phosphoribosyltransferase; Nmnat, nicotinamide mononucleotide adenylyl transferase; NRK, nicotinamide riboside kinase; 5′-NT, 5′-nucleotidase; NaMN, iNampt, intracellular NAM phosphoribosyl transferase; Sirt1, Sirtuin1; Cyp2E1, Cytochrome P450 2E1; Nnmt, nicotinamide N-Methyltransferase; Aox, aldehyde oxidase; NaNM, nicotinic acid mononucleotide; NAR, nicotinic acid riboside; NAD, nicotinamide adenine dinucleotide; NNO, NAM N-oxide; MNA, N1-methylniacinamide; 2py, N1-methyl-2-pyridone-5-carboxamide; 4py, N1-methyl-4-pyridone-3-carboxamide. (B) Schematic diagram for the NMN treatment protocol. (C) Temporal changes in body weights of the three groups (db/m, db/db, and NMN500; n=12). *P<0.05 db/m versus db/db. † P<0.05 db/m versus NMN500. HbA1c levels at (D) 10 (n=6), (E) 24 (n=14), and (F) 30 (n=12) weeks of age in the three groups (db/m, db/db, and NMN500). All data are shown as mean±SEM. Statistical significance between each group is represented by a horizontal bar. *P<0.05 by ANOVA with Tukey’s post hoc test.
The Effect of Short-term NMN Treatment on Kidney Functions and Survival
At both 10 and 24 weeks of age, the kidney weights in the db/db and NMN500 groups were higher than those in the db/m group (Figure 2, A and B). There were no differences in kidney weights between the db/db and NMN500 groups. There were no significant differences in serum creatinine levels among the three groups at 24 weeks of age (Figure 2C). The Db/db group exhibited a significantly higher urinary ACR compared with the db/m group at both 10 and 24 weeks of age (Figure 2, D and E). The NMN500 group exhibited lower albuminuria levels than those of the db/db group at both 10 and 24 weeks of age, which suggests an inhibitory effect of NMN on albuminuria, and this effect was sustained even after the termination of the short-term NMN intervention. Moreover, this effect was still observed even at 30 weeks of age (Figure 2F). To evaluate the effect of NMN treatment on hyperfiltration, we measured Ccr. As hyperfiltration is reported to be seen from 40 to 120 days of age in db/db mice,43 we evaluated hyperfiltration at 10 weeks of age. Although hyperfiltration was observed in the db/db mice, there was no significant difference between the db/db and the NMN500 groups (Figure 2G). Murine survival rates in this study protocol were evaluated by Kaplan-Meier and log rank tests, which revealed that the short-term treatment with NMN conferred a longer survival time (Figure 2H). NMN treatment was associated with 0.153-fold lower death rates (P=0.05) in male db/db mice.
Figure 2.
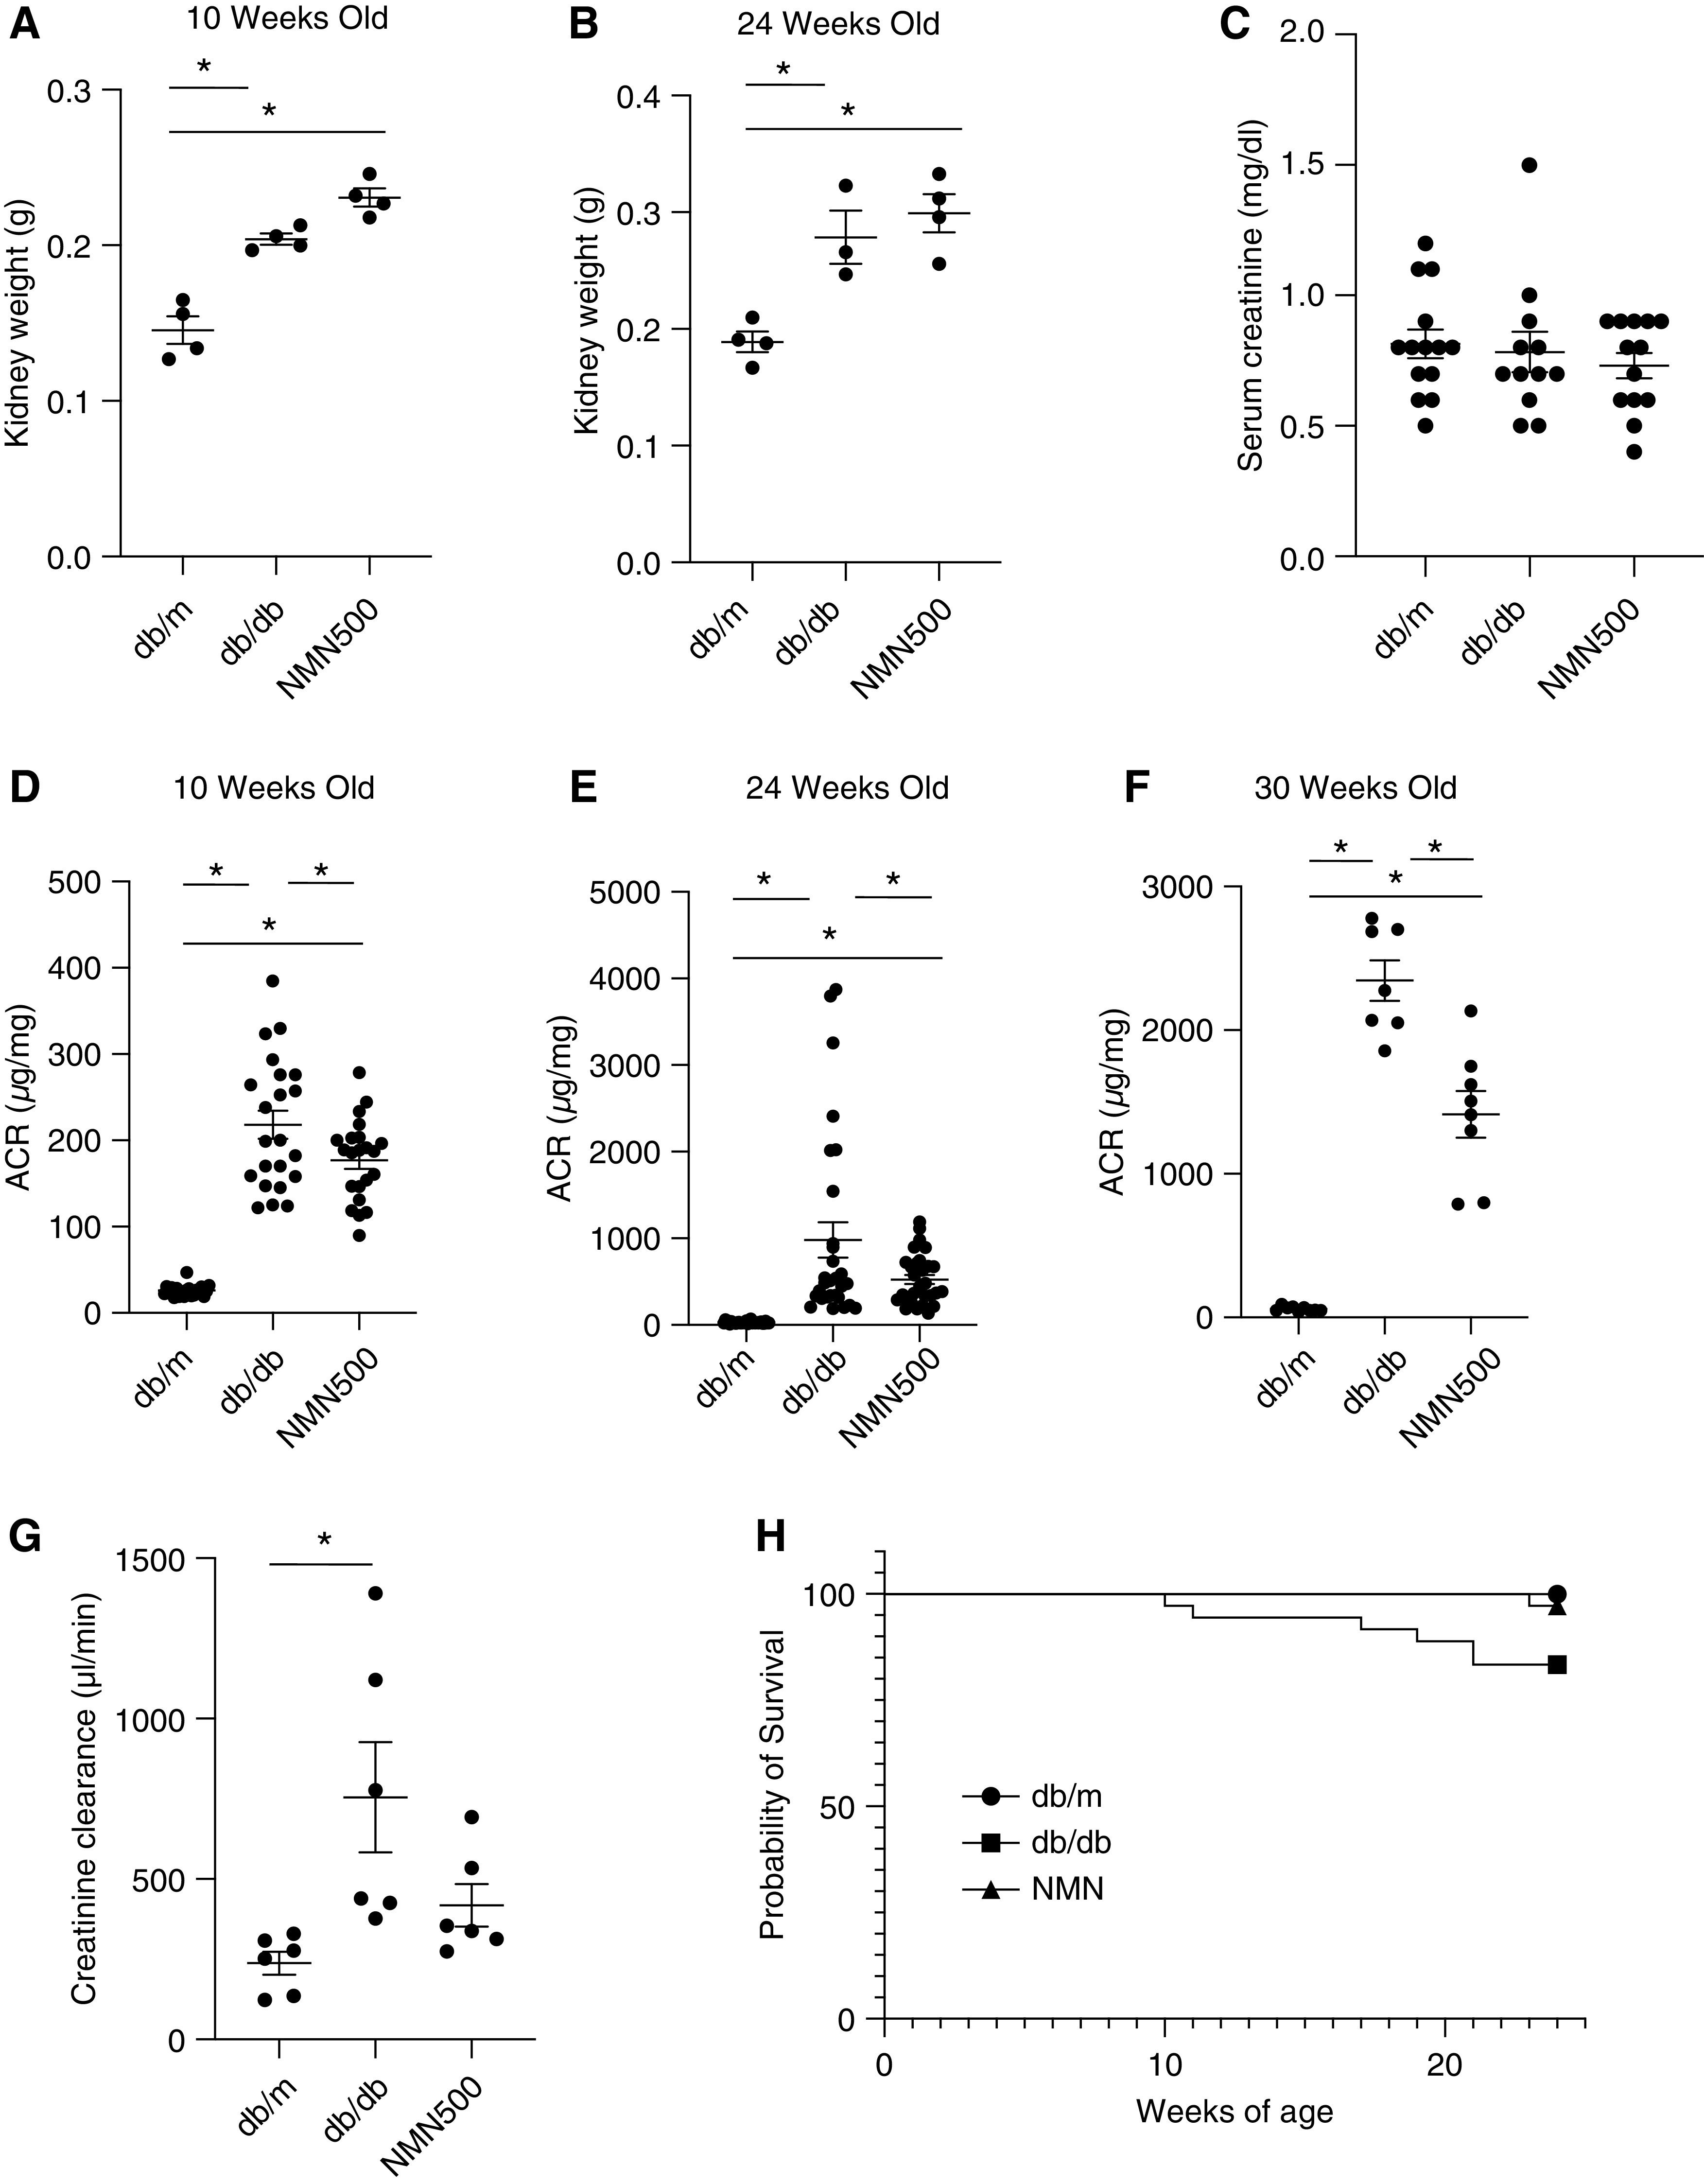
The effect of short-term NMN treatment on kidney function and overall survival. (A and B) Kidney weight at 10 and 24 weeks of age in the three groups (db/m, db/db, and NMN500; n=4). (C) Serum creatinine levels were measured at 24 weeks of age in the three groups (db/m, db/db, and NMN500; n=14). (D) Urine ACR at 10 (n=20), (E) 24 (n=30), (F) and 30 (n=8) weeks of age in the three groups (db/m, db/db, and NMN500). (G) Ccr at 10 weeks of age in the three groups (db/m, db/db, and NMN500; n=10). All data are shown as mean±SEM. Statistical significance between each group is represented by a horizontal bar. *P<0.05 by ANOVA with Tukey’s post hoc test. (H) Kaplan-Meier curves for the survivors in the treatment groups (db/m, db/db, and NMN500; n=36). The significance of the differences between the survival curves were obtained by a log rank test.
The Effect of Short-term NAM Treatment on HbA1c and Urine ACR
We tried administering another NAD+ metabolite, NAM. This treatment was performed in the same manner as NMN treatment (Supplemental Figure 3A). We evaluated HbA1c and urine ACR at 10 weeks of age. There was no significant difference in HbA1c between the db/db and the NAM200 group (Supplemental Figure 3B). There was no significant difference in urine ACR between the db/db and the NAM 200 group (Supplemental Figure 3C). These results were different from those of the NMN treatment experiment.
Dose-response Study of NMN Treatment
We further examined the dose-dependent effects of short-term NMN treatment (Figure 3A). The effects of short-term treatment with two additional doses of NMN, 100 mg/kg and 300 mg/kg, on HbA1c levels and urine ACR levels were evaluated at 24 weeks of age. HbA1c levels of db/db mice treated with 100 mg/kg NMN (NMN100) and db/db mice treated with 300 mg/kg NMN (NMN300) were not different from those in db/db mice or db/db mice treated with 500 mg/kg NMN (NMN500) (Figure 3B). In comparison with db/db mice, the NMN300 group and the NMN500 group exhibited reduced ACR, whereas the NMN100 group did not show a significant reduction in ACR (Figure 3C). We have therefore observed dose-dependent effects of short-term NMN treatment on diabetic albuminuria.
Figure 3.
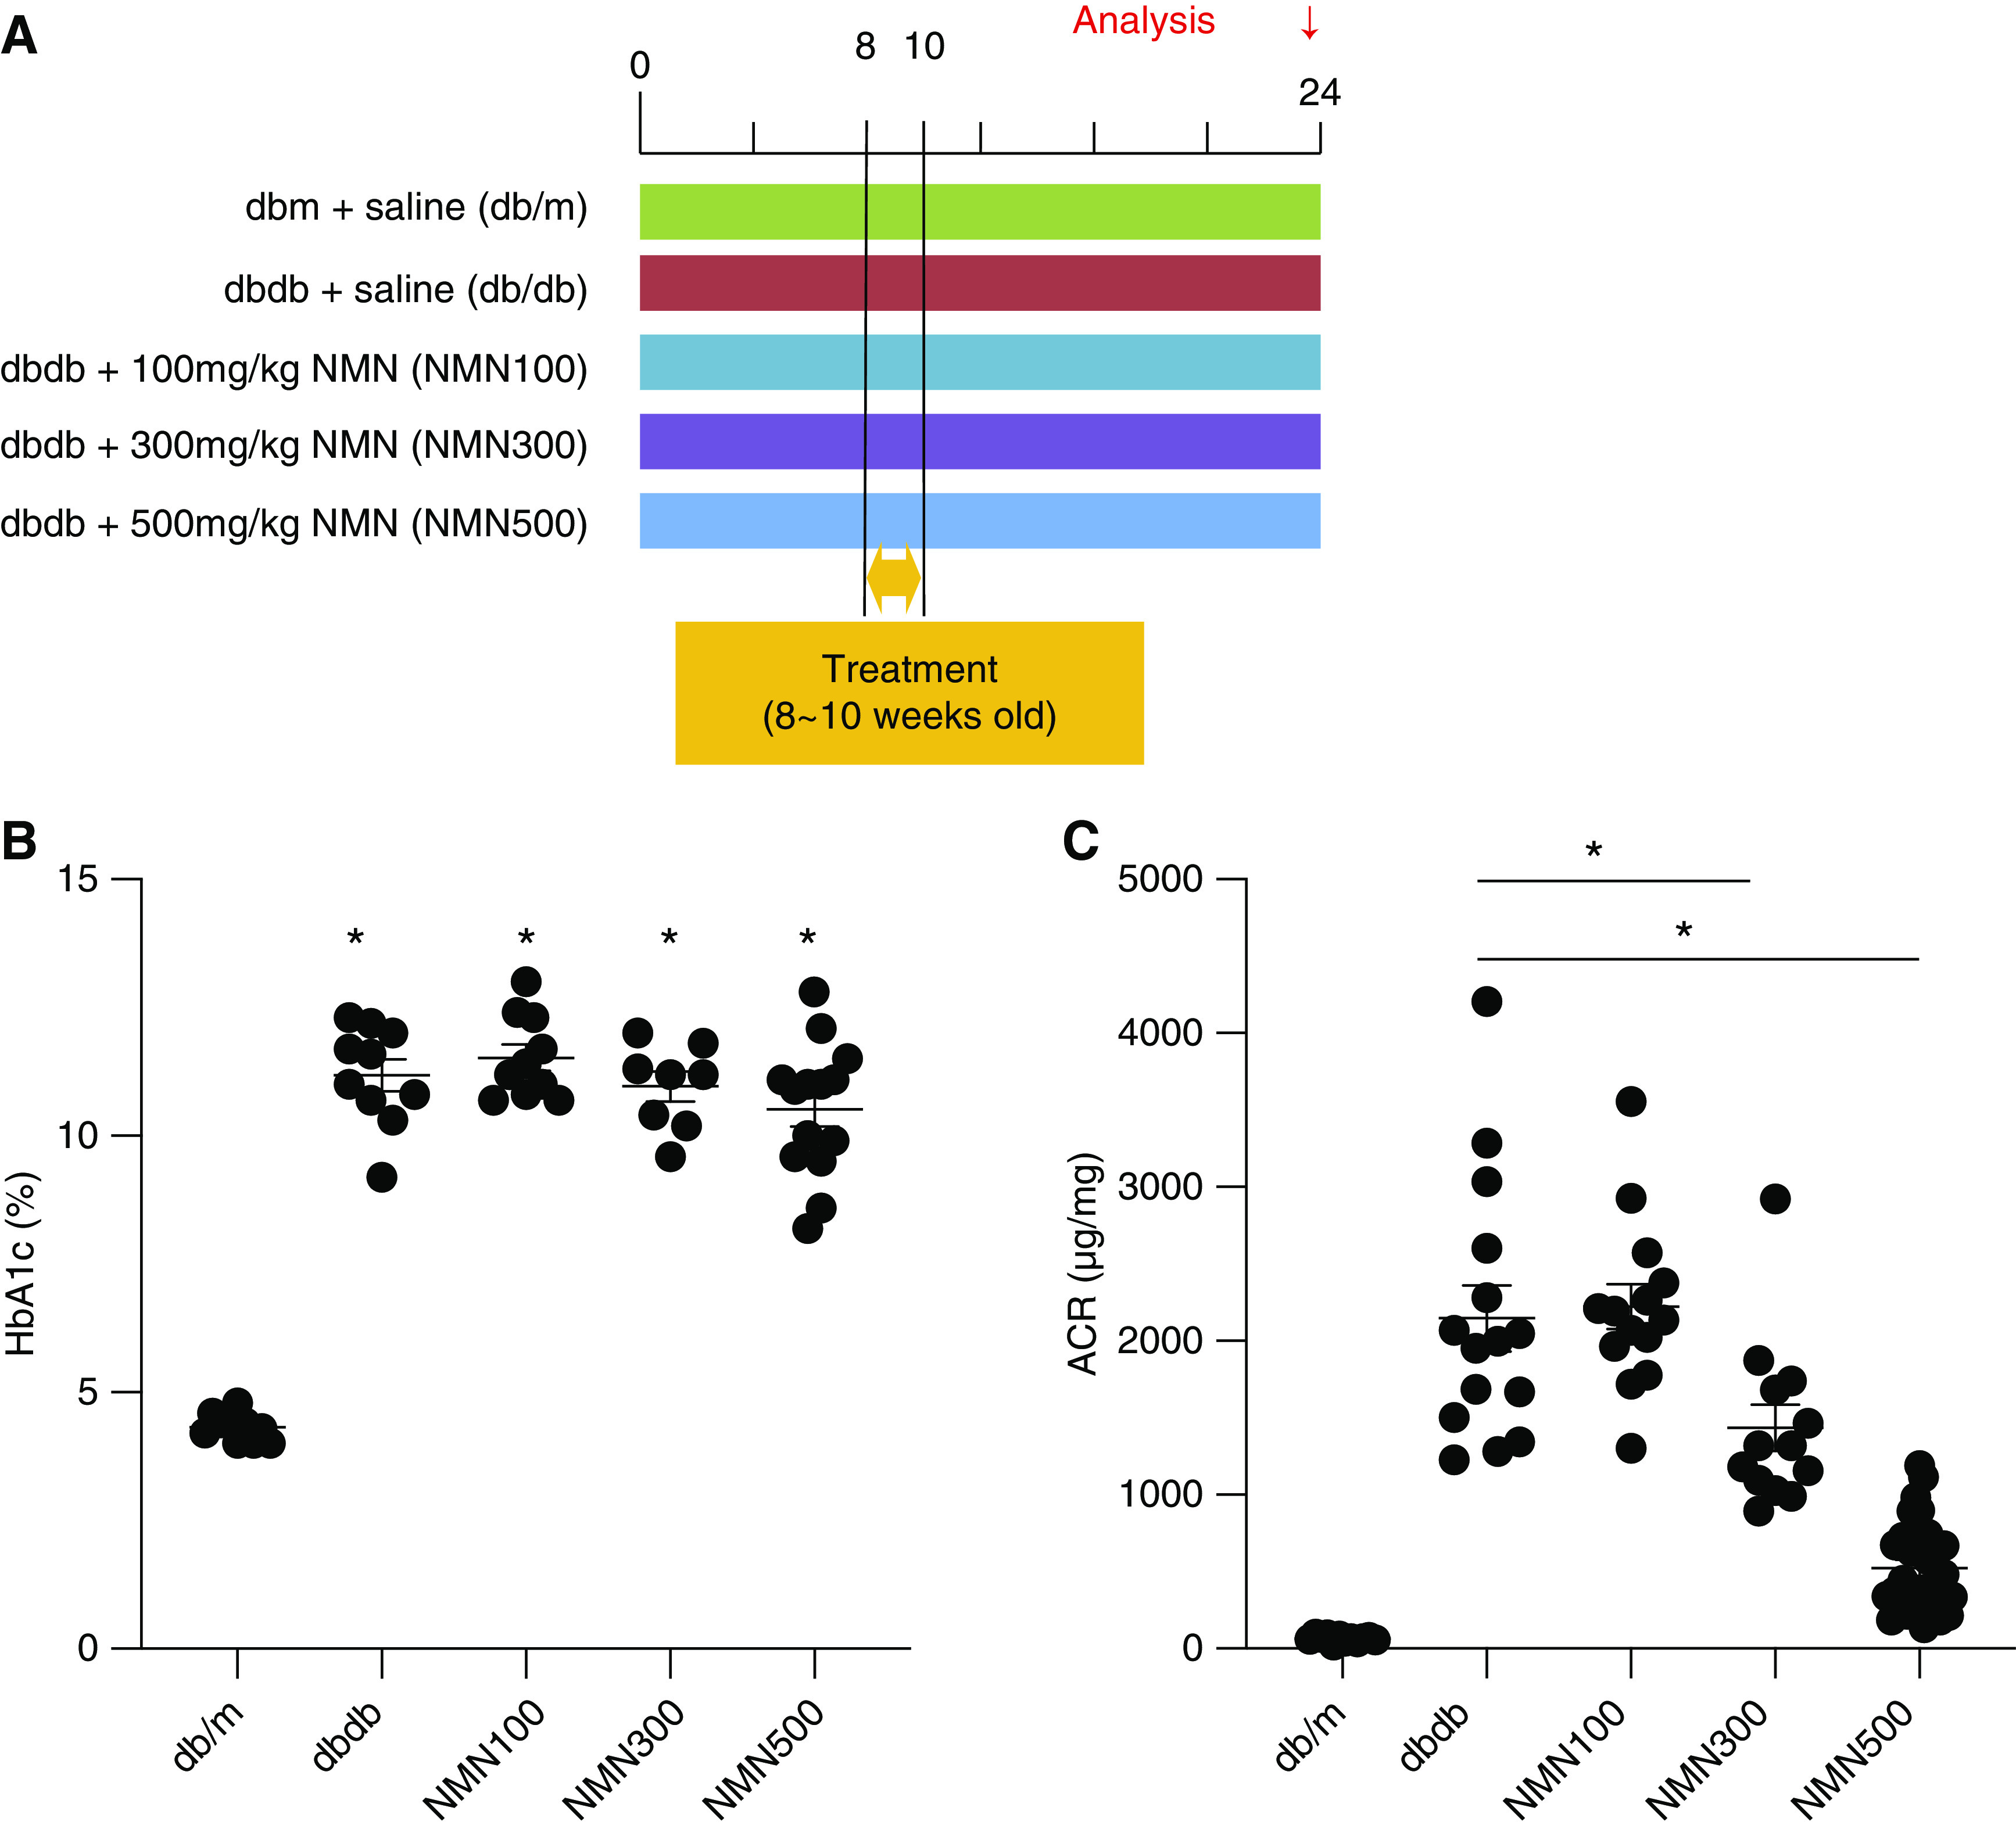
Dose-response study of NMN treatment. (A) Schematic diagram illustrating the dose-response study. (B) HbA1c at 24 weeks of age in the five groups (db/m, db/db, NMN100, NMN300, and NMN500; n=15). Statistical significance is represented by an asterisk. *P<0.05 versus db/m. (C) Urine ACR at 24 weeks of age in the five groups (db/m, db/db, NMN100, NMN300, and NMN500; n=15). All data are shown as mean±SEM. Statistical significance between each group is represented by a horizontal bar. *P<0.05 by ANOVA with Tukey’s post hoc test.
Short-term NMN Treatment Ameliorated Histologic Changes in DN
To histologically assess the effect of NMN on DN, we measured glomerular volume and mesangial expansion by PAS staining and assessing podocyte number by podocyte marker WT-1 immunostaining (Figure 4A). There was no significant difference in glomerular surface area among the three groups at the age of 10 weeks (Supplemental Figure 4, A and B). However, at the age of 24 and 30 weeks, both the db/db and NMN500 groups exhibited larger glomerular surface areas than those of the db/m group. There was no significant difference in glomerular surface area between the db/db and NMN500 groups (Figure 4B, Supplemental Figure 5, A and B). The Db/db groups exhibited more PAS-positive area than the db/m group from the age of 10–30 weeks (Figure 4, A and C, Supplemental Figures 4, A and C and 5, A and C). The NMN500 group showed decreased PAS-positive area compared with the db/db group at the age of 24 and 30 weeks (Figure 4C, Supplemental Figure 5C). To verify glomerular fibrosis, we assessed collagen IV and fibronectin expressions in the glomeruli (Supplemental Figure 6A). Both collagen IV and fibronectin expressions in the db/db and the NMN500 groups were higher than those in the db/m group. Collagen IV expression and fibronectin expression in the NMN500 group was lower than that in the db/db group (Supplemental Figure 6, B and C). From the age of 10–30 weeks, there was no significant difference in the number of podocytes per glomerular section among the three experimental groups (Figure 4D, Supplemental Figures 4D and 5D). In terms of EM findings, the diffuse uniform thickening of capillary walls is the earliest change present in DN and foot process effacement is also an early change in glomerular epithelial cells in DN. We investigated EM histologic changes by measuring GBM thickness and foot process density (Figure 4E). GBM thickness did not differ among the db/m, db/db, and NMN500 groups (Figure 4F). Foot process density was lower in the db/db group than in the db/m group, and this reduction was ameliorated in the NMN500 groups (Figure 4G).
Figure 4.

Short-term NMN treatment ameliorated histologic changes in DN. (A) Representative PAS staining and immunostaining for WT1 in the glomeruli of the db/m, db/db, and NMN500 groups (scale bar, 500 µm). (B) Glomerular surface area and (C) PAS positivity of the glomerular area in PAS-stained kidney sections determined by Image-Pro Plus 7.0J software; n=20 glomerular sections per group. (D) Number of podocytes per glomerulus detected with antibodies to WT1. Podocytes/glomerular sections were determined using Image-Pro Plus 7.0J software. (E) Representative EM images of GBM in the db/m, db/db, and NMN500 groups. GBM (double-headed arrow) and foot process (arrowhead) are indicated (scale bar, 1 µm). (F) GBM thickness obtained from 35 measurements per group. (G) Foot process density per micron of GBM obtained from approximately 35 measurements per group. All data are shown as mean±SEM. Statistical significance between each group is represented by a horizontal bar. *P<0.05 by ANOVA with Tukey’s post hoc test.
Molecular Changes in Glomerulus after NMN Treatment
We previously reported “PT-podocyte communication” in DN.4 In this cellular communication, decreased Sirt1 in PT subsequently increases ectopic claudin-1 and causes foot process effacement in the podocyte in the glomerulus, leading to diabetic albuminuria. We assessed the levels of expression of several proteins involved in this mechanism using IHC (Figure 5, Supplemental Figures 7 and 8). At the age of 10 weeks, Sirt1 expression was increased in the NMN500 group compared with the db/m and the db/db groups (Supplemental Figure 7B). There was no significant difference in claudin-1 expression among the three groups (Supplemental Figure 7C). Synaptopodin expression was decreased in the db/db group than in the db/m group, but there was no significant difference between the db/db and the NMN500 groups (Supplemental Figure 7D). At the age of 24 weeks, in comparison with the db/m group, Sirt1 expression was decreased in the db/db group (Figure 5B). Claudin-1 expression was increased (Figure 5C) and synaptopodin expression was decreased in the db/db group (Figure 5D). These changes were attenuated in the NMN500 group. Similar results were obtained in the assessment at the age of 30 weeks (Supplemental Figure 8, A–D). We also evaluated Sirt1 changes in tubular regions. Sirt1 expression in tubular regions was also maintained in the NMN500 group (Figure 5, E and F). Our data demonstrated the morphologic and molecular changes induced by short-term NMN treatment were sustained even after discontinuation of the treatment, indicating legacy effects against diabetic albuminuria due to NMN treatment.
Figure 5.
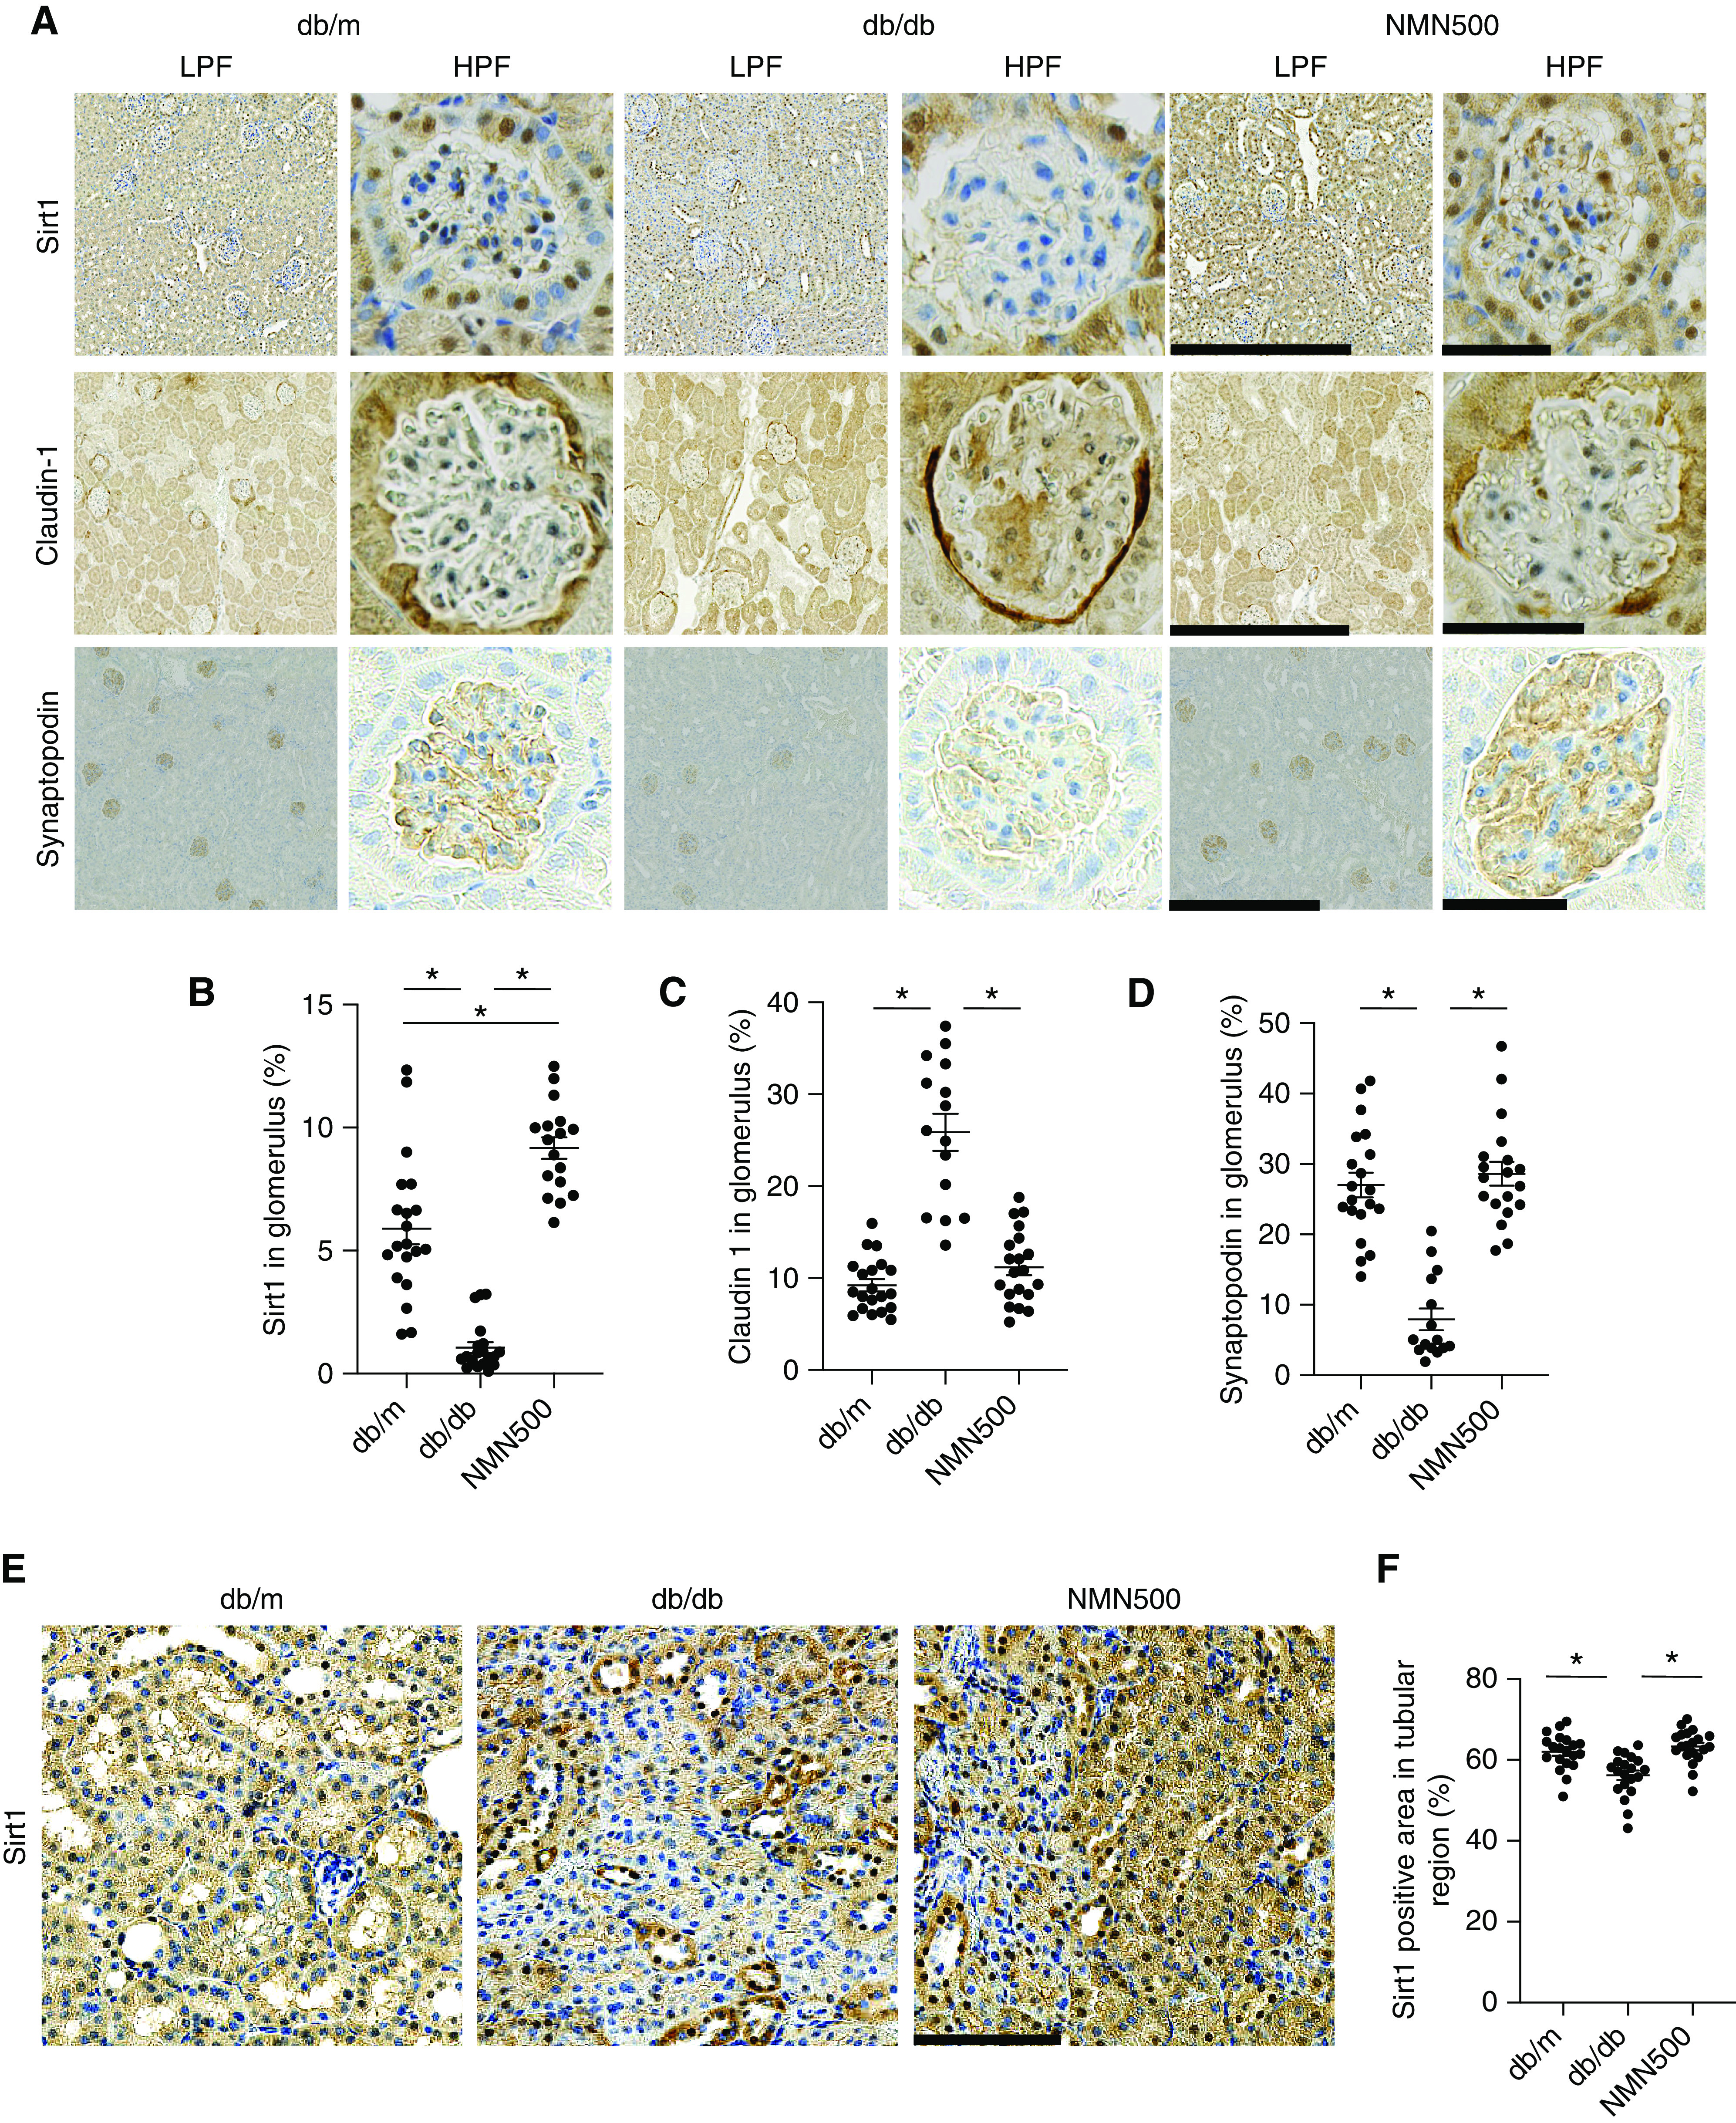
Molecular changes in glomerulus after NMN treatment (A) Representative immunostaining for Sirt1, claudin-1, and synaptopodin in the glomeruli of the db/m, db/db, and NMN500 groups. Left, low-magnification pictures (scale bar, 50 µm); right, high-magnification pictures (scale bar, 500 µm). (B) Proportional areas of Sirt1, (C) claudin-1, and (D) synaptopodin staining determined by Image-Pro Plus 7.0J software. (n=20 glomerular sections per group). (E) Representative immunostaining for Sirt1 in the tubular region of the db/m, db/db, and NMN500 groups (scale bar, 100 µm). (F) Proportional areas of Sirt1 staining determined by Image-Pro Plus 7.0J software (n=20 tubular regions per group). All data are shown as mean±SEM. Statistical significance between each group is represented by a horizontal bar. *P<0.05 by ANOVA with Tukey’s post hoc test.
The Effect of NMN Treatment on the Epigenetic Mechanism of the Sirt1–Claudin-1 Axis
We previously reported that decreased Sirt1 expression causes claudin-1 expression and podocyte damage through decreased H3K9 methylation and decreased Dnmt1 expression in a diabetic background.4,44 We assessed the effect of NMN on this sequence. To assess other Sirtuin isoforms that are abundantly expressed in the kidney,45 we tested Sirt3 and Sirt6 expressions in glomeruli. We did not observe any changes in the expressions of Sirt3 or Sirt6 between the db/db and the NMN500 groups (Figure 6, A–C). Subsequently, we assessed the expressions of H3K9me2 and DNMT1 in the glomeruli. The expression of H3K9me2 was decreased in the db/db group compared with the db/m group, but it was maintained in the NMN500 group (Figure 6D). The expression of DNMT1 was decreased in the db/db group compared with the db/m mice. This change was ameliorated in the NMN500 group (Figure 6E). These results support the long-lasting renoprotective effect by NMN.
Figure 6.
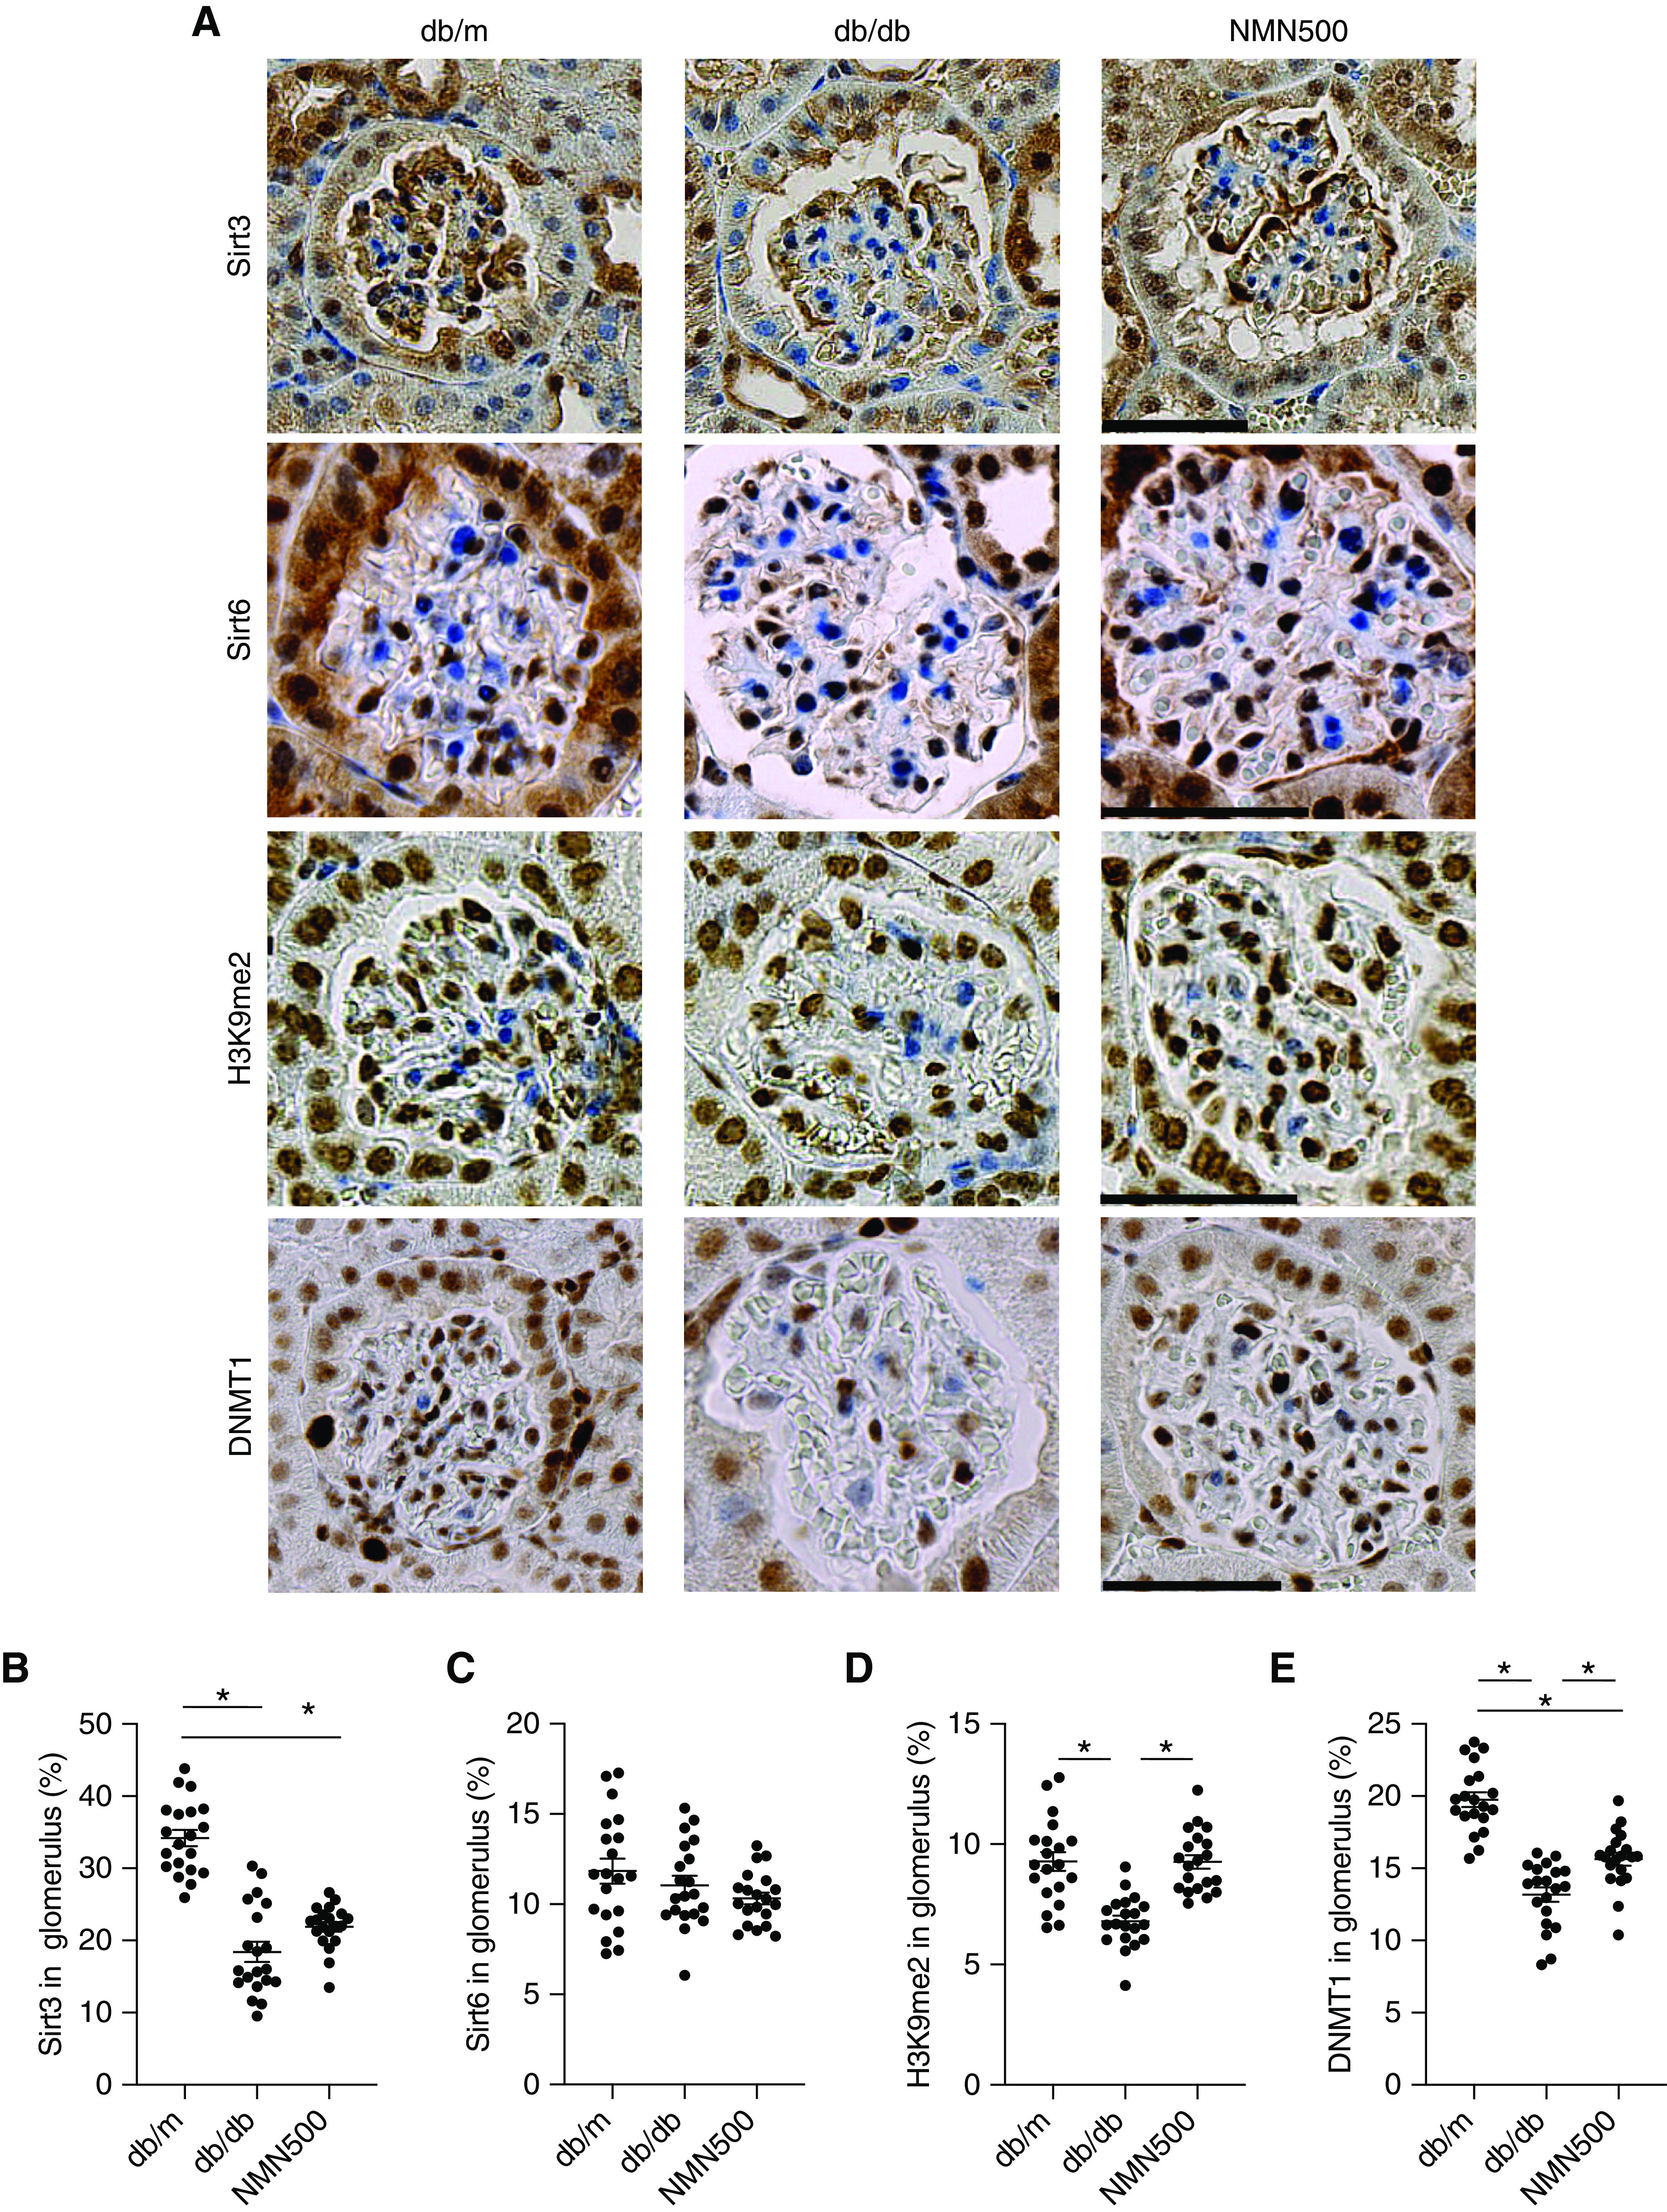
The effect of NMN treatment on the epigenetic mechanism of the Sirt1-claudin-1 axis. (A) Representative immunostaining for Sirt3, Sirt6, H3K9me2, and DNMT1 in the glomeruli of the db/m, db/db, and NMN500 groups (scale bar, 50 µm). Proportional areas of (B) Sirt3, (C) Sirt6, (D) H3K9me2, and (E) DNMT1 staining determined by Image-Pro Plus 7.0J software (n=20 glomerular sections per group). All data are shown as mean±SEM. Statistical significance between each group is represented by a horizontal bar. *P<0.05 by ANOVA with Tukey’s post hoc test.
Effects of NMN Treatment on NAD+ Metabolites
To evaluate chronological NAD+ metabolite changes, we examined kidney NAD+ concentrations in the db/m and db/db groups from 8 to 30 weeks of age. In comparison with the db/m group, the db/db group had lower NAD+ concentrations in the kidneys at 8 weeks of age. In the db/m and db/db groups, the kidney NAD+ concentrations were decreased at 10 weeks of age, and further decreased at 24 and 30 weeks of age relative to 8 weeks of age in a time-dependent manner, and the difference between NAD+ levels in the db/m and db/db groups also decreased (Figure 7A). We also measured other NAD+ metabolites in the kidney. At 24 weeks of age (14 weeks after the treatment), the NMN500 group had lower NAM and NMN concentrations in the kidneys than those of the db/m and db/db groups, although there was no difference in NAM and NMN concentrations between the db/m and db/db groups (Figure 7, B and C). The NMN500 group showed higher kidney NAD+ concentrations than the db/m and db/db groups (Figure 7D). We assessed the ratio of kidney concentrations of the following metabolites: NAD+/NMN, NMN/NAM, and NAD+/NAM. There was no difference in NMN/NAM among the three groups (Figure 7E). Kidney NAD+/NMN and NAD+/NAM were higher in the NMN500 group than in the db/m and db/db groups (Figure 7, F and G). These results suggest changes in the activities of Nampt and/or Nmnat in the kidneys. The absence of changes in NMN/NAM ratio could be explained by the fact that Nampt is the rate-limiting enzyme of the salvage pathway.46
Figure 7.

Effects of NMN treatment on NAD+ metabolites. (A) Temporal changes in kidney NAD+ concentrations in db/m and db/db groups. (B–D) Renal tissue concentrations of NAD+ metabolites, (B) NAM, (C) NMN, and (D) NAD+ of the salvage pathway at 24 weeks of age in the db/m, db/db, and NMN500 groups (n=20–22). (E) Kidney NMN/NAM concentration ratios at 24 weeks of age. (F) Kidney NAD+/NMN concentration ratios at 24 weeks of age. (G) Kidney NAD+/NAM concentration ratios at 24 weeks of age. All data are shown as mean±SEM. Statistical significance between each group is represented by a horizontal bar. *P<0.05 by ANOVA with Tukey’s post hoc test.
Effects of NMN Treatment on the Salvage Pathway
To evaluate the enzymes in the salvage pathway, we conducted IHC for Nampt and Nmnat1 at 10, 24, and 30 weeks of age (Figure 8A, Supplemental Figures 9A and 10A). At 10 weeks of age, the expression of Nampt was increased in the db/db group than in the db/m group, which may suggest compensation for decreased NAD+. There was no significant difference between the db/m and the NMN500 groups (Supplemental Figure 9B). There was no significant difference in Nmnat1 expression among the three groups (Supplemental Figure 9C). At 24 weeks of age, consistent with changes in NAD+ metabolites and their ratios (Figure 7, E–G), IHC in the kidneys for two enzymes in the salvage pathway revealed that Nampt expression was higher in the NMN500 group than in the db/m and in db/db groups and that Nampt expression was lower in the db/db group than in the db/m group (Figure 8B). Similarly, Nmnat1 expression was lower in the db/db group than in the db/m group, and the reduction was ameliorated in the NMN500 groups (Figure 8C). At 30 weeks of age, the expression of Nampt was decreased both in the db/db group and the NMN500 groups (Supplemental Figure 10B). The expression of Nmnat1 was lower in the db/db group than in the db/m group, but its decrease was milder in the NMN500 group (Supplemental Figure 10C). These results suggest that NMN treatment increases Nampt expression and ameliorates the decrease in Nmnat1 expression in db/db mice.
Figure 8.

Effects of NMN treatment on the salvage pathway. (A) Representative immunostaining for Nampt, Nmnat1 in the kidneys of the db/m, db/db, and NMN500 groups (scale bar, 50 µm). (B and C) Proportional staining areas for (B) Nampt and (C) Nmnat1 determined by Definiens Tissue Studio software (n=20 sections/group). All data are shown as mean±SEM. Statistical significance between each group is represented by a horizontal bar. *P<0.05 by ANOVA with Tukey’s post hoc test.
Discussion
We provide a proof of concept for transient short-term administration of NMN as an effective treatment for early-stage DN. In the type 2 diabetic db/db model, NMN administration ameliorated DN functionally and histologically. The results of this study also showed NMN maintained declining kidney NAD+ levels with aging and diabetes, and demonstrated NMN altered Nampt and Nmnat1 expression. We demonstrated the treatment protocol had legacy effects, given these changes were evident and sustained even after the discontinuation of short-term NMN treatment.
A number of NMN studies have tested the effects of NMN treatment on the pathophysiology of various organs. In the first study, NMN treatment comprised a single injection for a short period of time.5,14,47 More recently, NMN administration for as long as 1 year has been performed and the effects were evaluated immediately or soon after the treatment,48–50 On the basis of our previous study,4 we anticipate legacy effects of NMN supplementation through epigenetic gene modulation by NAD+-dependent Sirtuin deacetylase. In this study, we tested the effects of preemptive short-term treatment with NMN before the onset of albuminuria, and assessed the effects long after the discontinuation of the treatment. Then 14 days of NMN treatment led to persistently reduced albuminuria in DN and ameliorated histologic changes, such as foot process effacement and mesangial expansion. We previously reported that decreased Sirt1 in podocytes epigenetically upregulated claudin-1 through DNMT1 activation and reduced synaptopodin levels, subsequently causing foot process effacement and albuminuria. Consistent with our previous study, our IHC results showed low Sirt1, high claudin-1, and low synaptopodin expression in the glomeruli of db/db mice. Furthermore, the expressions of H3K9me2 and DNMT1 were lower in the glomeruli of db/db mice. These unfavorable changes were ameliorated by NMN treatment even after the termination of the treatment, suggesting Sirt1 reactivation halts the aggravation of Sirt1–claudin-1–synaptopodin molecular changes through long-lasting epigenetic effects.
Improvements in insulin secretion and action by NMN have been previously reported.6,14,46,49–51 In this study, however, NMN treatment did not decrease HbA1c levels. In previous studies, insulin tolerance and glucose tolerance tests were conducted after one bolus NMN injection or immediately after the NMN treatment period. Those studies differed from this study in the method of NMN administration and in the timing of the assessments after NMN treatment. Therefore, we evaluated glucose metabolism immediately after NMN treatment by IPGTT and ITT. However, NMN treatment did not alter IPGTT or ITT. Furthermore, NMN treatment did not cause any changes in energy metabolism, such as body weight, food intake, or EE. The discrepancy between past studies and this study may be explained by the difference in the models used in the experiments.
We observed chronologically decreased NAD+ concentrations in the db/db group, which is consistent with previous reports.5,14,15 Surprisingly, we observed higher kidney NAD+ levels in NMN-treated db/db mice even at 14 weeks after the termination of the treatment period. NMN is rapidly converted to NAD+ and disappears from blood and organs within 15 minutes and the t 1/2 of NAD is <10 hours.14 We also found paradoxically low levels of NMN in the NMN500 group at 24 weeks of age despite prior NMN supplementation. On the basis of these findings, we suspect this short-term treatment modified the salvage pathway for a long period of time. We observed that NMN treatment upregulated Nampt expression and rescued Nmnat1 expression at 24 weeks of age. These results suggest that, even at 14 weeks after NMN treatment, the altered Nampt and Nmnat1 expression patterns were maintained and contributed persistently to elevated kidney NAD+ levels. These expressions might be epigenetically regulated, particularly in the case of Nmnat1, which has a CpG island in its promoter region. Moreover, it turned out the expression of Nampt after NMN treatment was higher than that in the db/m group. To elucidate the mechanisms for this excessive upregulation, we evaluated the acetylated-p65 whose decrease reflects Sirt1 activity.52,53 We found Ac-p65 was decreased in the NMN500 group, which implies the increase in turnover of the salvage pathway (Supplemental Figure 11). Therefore, Nampt overexpression may be the result of this increased turnover. Further research will be required to confirm these long-lasting effects.
The dosage applied in this study merits explanation, given some studies have reported that lower doses of NMN improved pathogeneses more than higher doses.50,54 In one study, a total of 100 mg/kg NMN improved oxygen consumption, EE, and physical activity more than 300 mg/kg NMN.50 In another report, reduced cell death of CA1 neurons was best achieved with 62.5 mg/kg compared with higher and lower doses.54 In contrast, another study reported dose-dependent effects of NMN treatment on body weight gain, bone density, and some age-related changes.50 Our dose-response study demonstrated that NMN treatment at a dosage of 300 mg/kg and 500 mg/kg improved albuminuria, whereas 100 mg/kg NMN had no effects. Thus, the ideal dose might vary depending on the organs involved and the pathogenesis. In terms of adverse effects of NMN, 1 year of treatment with 100 and 300 mg/kg NMN orally per day appears to be tolerable.50 One study reported that 90 days of treatment with 3000 mg/kg of NR had several adverse metabolic and histologic effects, including increased kidney weight, basophilic tubules, tubular atrophy, FSGS, and monocyte infiltration in the kidneys. However, treatment with 300 mg/kg NR for 90 days led to no adverse effects.55 In this study, we adopted the short-term transient treatment for 2 weeks at the relatively high dose intraperitoneally, as compared with our previous report. However, we did not observe obvious adverse effects and we did obtain better survival rates (Figure 2H), which suggests the feasibility of this treatment protocol.
In this study, NMN administration improved survival rates, which had not been reported to date. One explanation is its effects on the upregulation of Sirt1 expression that has been suggested to promote survival and longevity.5–7 The molecular mechanism for this upregulation remains to be explored. Xiong et al.56 reported an autofeedback loop of Sirt1 expression, and they also reported Sirt1 activation by resveratrol increased the expression of Sirt1. By this theory, we speculate that NMN could also increase the expression of Sirt1 by activating Sirt1 activity through FOXO-1 deacetylation. We observed gastrointestinal tract perforation in deceased db/db mice, whereas such mice were not observed in NMN500 group. An inhibitory effect of NMN on the brain damage caused by global cerebral ischemia has been reported, which could partially explain the present survival results.54
DN increases morbidity and mortality. In addition, the progression of DN requires RRT as treatment. Therefore, DN is a huge burden not only for patients, but for medical economics. The development of preventive strategies against DN would decrease these burdens. So far, the ameliorating effect by NMN treatment on kidney diseases has been proven. In this study, we, for the first time, observed a long-lasting renoprotective effect by short-term transient NMN treatment on DN. This finding could lead to the prevention and treatment of DN.
In conclusion, supplementation with short-term NMN for 2 weeks sufficiently restored and maintained NAD+ and Sirt1 levels, and protected kidneys from DN in mice 14 or even 20 weeks after the termination of the treatment. This study provides evidence of legacy effects of NMN treatment and that short-term NMN supplementation suppresses the long-term progression of DN.
Disclosures
H. Tokuyama reports being a scientific advisor or member as councilor of the Japanese Society of Hypertension and councilor of the Japanese Society of Nephrology. T. Kanda reports receiving research funding from Shionogi. T. Ono is employed by Shionogi & Co., Ltd. All remaining authors have nothing to disclose.
Funding
This work was supported by the Scientific Research Fund of the Ministry of Education, Culture, Sports, Science, and Technology of Japan (19K08732) and Keio University Doctoral Student Grant-in-Aid Program.
Supplementary Material
Acknowledgments
K. Hasegama, H. Itoh, S. Wakino, and I. Yasuda designed the experiments and the study; K. Hasegawa, Y. Sakamaki, and I. Yasuda collected data or performed experiments; and K. Hasegawa, H. Itoh, T. Kanda, T. Kawaguchi, H. Muraoka, Y. Sakamaki, H. Tokuyama, S. Wakino, and I. Yasuda analyzed the data and wrote the paper.
Footnotes
Published online ahead of print. Publication date available at www.jasn.org.
See related editorial, “Could NAD+ Precursor Supplements Induce a Legacy of Protection against Diabetic Nephropathy?” on pages 1270–1272.
Supplemental Material
This article contains the following supplemental material online at http://cjasn.asnjournals.org/lookup/suppl/doi:10.1681/ASN.2020081188/-/DCSupplemental.
Supplemental Figure 1. The treatment effect by NMN on glucometabolism.
Supplemental Figure 2. The treatment effect by NMN on metabolic changes.
Supplemental Figure 3. The effect of short-term NAM treatment on HbA1c and urine ACR.
Supplemental Figure 4. The effect of NMN treatment on histological changes in DN at 10 weeks of age.
Supplemental Figure 5. The effect of NMN treatment on histological changes in DN at 30 weeks of age.
Supplemental Figure 6. The effect of NMN treatment on profibrotic genes in glomeruli.
Supplemental Figure 7. Molecular changes in glomerulus at 10 weeks of age.
Supplemental Figure 8. Molecular changes in glomerulus at 30 weeks of age.
Supplemental Figure 9. Effects of NMN treatment on the salvage pathway at 10 weeks of age.
Supplemental Figure 10. Effects of NMN treatment on the salvage pathway at 30 weeks of age.
Supplemental Figure 11. Effect of NMN treatment on acetylated p65.
References
- 1. United States Renal Data System : Chapter 1: Incidence, prevalence, patient characteristics, and treatment modalities. 2019. Available at: https://www.usrds.org/media/1736/v2_c01_incprev_18_usrds.pdf. Accessed February 25, 2021
- 2. Afkarian M, Zelnick LR, Hall YN, Heagerty PJ, Tuttle K, Weiss NS, et al.: Clinical manifestations of kidney disease among US adults with diabetes, 1988-2014.. JAMA 316: 602–610, 2016. [DOI] [PMC free article] [PubMed] [Google Scholar]
- 3. Raparia K, Usman I, Kanwar YS: Renal morphologic lesions reminiscent of diabetic nephropathy. Arch Pathol Lab Med 137: 351–359, 2013. [DOI] [PubMed] [Google Scholar]
- 4. Hasegawa K, Wakino S, Simic P, Sakamaki Y, Minakuchi H, Fujimura K, et al.: Renal tubular Sirt1 attenuates diabetic albuminuria by epigenetically suppressing Claudin-1 overexpression in podocytes. Nat Med 19: 1496–1504, 2013. [DOI] [PMC free article] [PubMed] [Google Scholar]
- 5. Gomes AP, Price NL, Ling AJY, Moslehi JJ, Montgomery MK, Rajman L, et al.: Declining NAD(+) induces a pseudohypoxic state disrupting nuclear-mitochondrial communication during aging. Cell 155: 1624–1638, 2013. [DOI] [PMC free article] [PubMed] [Google Scholar]
- 6. Ramsey KM, Mills KF, Satoh A, Imai S: Age-associated loss of Sirt1-mediated enhancement of glucose-stimulated insulin secretion in beta cell-specific Sirt1-overexpressing (BESTO) mice. Aging Cell 7: 78–88, 2008. [DOI] [PMC free article] [PubMed] [Google Scholar]
- 7. Chang HC, Guarente L: SIRT1 mediates central circadian control in the SCN by a mechanism that decays with aging. Cell 153: 1448–1460, 2013. [DOI] [PMC free article] [PubMed] [Google Scholar]
- 8. Liu R, Zhong Y, Li X, Chen H, Jim B, Zhou MM, et al.: Role of transcription factor acetylation in diabetic kidney disease. Diabetes 63: 2440–2453, 2014. [DOI] [PMC free article] [PubMed] [Google Scholar]
- 9. Chuang PY, Xu J, Dai Y, Jia F, Mallipattu SK, Yacoub R, et al.: In vivo RNA interference models of inducible and reversible Sirt1 knockdown in kidney cells. Am J Pathol 184: 1940–1956, 2014. [DOI] [PMC free article] [PubMed] [Google Scholar]
- 10. Hong Q, Zhang L, Das B, Li Z, Liu B, Cai G, et al.: Increased podocyte Sirtuin-1 function attenuates diabetic kidney injury. Kidney Int 93: 1330–1343, 2018. [DOI] [PMC free article] [PubMed] [Google Scholar]
- 11. Zhong Y, Lee K, He JC: SIRT1 is a potential drug target for treatment of diabetic kidney disease. Front Endocrinol (Lausanne) 9: 624, 2018. [DOI] [PMC free article] [PubMed] [Google Scholar]
- 12. Chuang PY, Dai Y, Liu R, He H, Kretzler M, Jim B, et al.: Alteration of forkhead box O (foxo4) acetylation mediates apoptosis of podocytes in diabetes mellitus. PLoS One 6: e23566, 2011. [DOI] [PMC free article] [PubMed] [Google Scholar]
- 13. Holman RR, Paul SK, Bethel MA, Matthews DR, Neil HAW: 10-year follow-up of intensive glucose control in type 2 diabetes. N Engl J Med 359: 1577–1589, 2008. [DOI] [PubMed] [Google Scholar]
- 14. Yoshino J, Mills KF, Yoon MJ, Imai S: Nicotinamide mononucleotide, a key NAD(+) intermediate, treats the pathophysiology of diet- and age-induced diabetes in mice. Cell Metab 14: 528–536, 2011. [DOI] [PMC free article] [PubMed] [Google Scholar]
- 15. Mouchiroud L, Houtkooper RH, Moullan N, Katsyuba E, Ryu D, Cantó C, et al.: The NAD(+)/sirtuin pathway modulates longevity through activation of mitochondrial UPR and FOXO signaling. Cell 154: 430–441, 2013. [DOI] [PMC free article] [PubMed] [Google Scholar]
- 16. Camacho-Pereira J, Tarragó MG, Chini CCS, Nin V, Escande C, Warner GM, et al.: CD38 dictates age-related NAD decline and mitochondrial dysfunction through an SIRT3-dependent mechanism. Cell Metab 23: 1127–1139, 2016. [DOI] [PMC free article] [PubMed] [Google Scholar]
- 17. Dai H, Sinclair DA, Ellis JL, Steegborn C: Sirtuin activators and inhibitors: Promises, achievements, and challenges. Pharmacol Ther 188: 140–154, 2018. [DOI] [PMC free article] [PubMed] [Google Scholar]
- 18. Elhassan YS, Philp AA, Lavery GG: Targeting NAD+ in metabolic disease: New insights into an old molecule. J Endocr Soc 1: 816–835, 2017. [DOI] [PMC free article] [PubMed] [Google Scholar]
- 19. Kume S, Uzu T, Horiike K, Chin-Kanasaki M, Isshiki K, Araki S, et al.: Calorie restriction enhances cell adaptation to hypoxia through Sirt1-dependent mitochondrial autophagy in mouse aged kidney. J Clin Invest 120: 1043–1055, 2010. [DOI] [PMC free article] [PubMed] [Google Scholar]
- 20. Ran M, Li Z, Yang L, Tong L, Zhang L, Dong H: Calorie restriction attenuates cerebral ischemic injury via increasing SIRT1 synthesis in the rat. Brain Res 1610: 61–68, 2015. [DOI] [PubMed] [Google Scholar]
- 21. Chen D, Steele AD, Lindquist S, Guarente L: Increase in activity during calorie restriction requires Sirt1. Science 310: 1641, 2005. [DOI] [PubMed] [Google Scholar]
- 22. Kim MY, Lim JH, Youn HH, Hong YA, Yang KS, Park HS, et al. : Resveratrol prevents renal lipotoxicity and inhibits mesangial cell glucotoxicity in a manner dependent on the AMPK-SIRT1-PGC1α axis in db/db mice [published correction appears in Diabetologia 56:681, 2013]. Diabetologia 56: 204–217, 2013. [DOI] [PubMed] [Google Scholar]
- 23. Ma S, Feng J, Zhang R, Chen J, Han D, Li X, et al.: SIRT1 activation by resveratrol alleviates cardiac dysfunction via mitochondrial regulation in diabetic cardiomyopathy mice. Oxid Med Cell Longev 2017: 4602715, 2017. [DOI] [PMC free article] [PubMed] [Google Scholar]
- 24. Sin TK, Tam BT, Yu AP, Yip SP, Yung BY, Chan LW, et al. : Acute treatment of resveratrol alleviates doxorubicin-induced myotoxicity in aged skeletal muscle through SIRT1-dependent mechanisms. J Gerontol A Biol Sci Med Sci 71: 730–739, 2016. [DOI] [PMC free article] [PubMed] [Google Scholar]
- 25. Yoshino J, Baur JA, Imai SI: NAD+ intermediates: The biology and therapeutic potential of NMN and NR. Cell Metab 27: 513–528, 2018. [DOI] [PMC free article] [PubMed] [Google Scholar]
- 26. Pirinen E, Cantó C, Jo YS, Morato L, Zhang H, Menzies KJ, et al.: Pharmacological Inhibition of poly(ADP-ribose) polymerases improves fitness and mitochondrial function in skeletal muscle. Cell Metab 19: 1034–1041, 2014. [DOI] [PMC free article] [PubMed] [Google Scholar]
- 27. Bai P, Cantó C, Oudart H, Brunyánszki A, Cen Y, Thomas C, et al.: PARP-1 inhibition increases mitochondrial metabolism through SIRT1 activation. Cell Metab 13: 461–468, 2011. [DOI] [PMC free article] [PubMed] [Google Scholar]
- 28. Sanajou D, Ghorbani Haghjo A, Argani H, Roshangar L, Rashtchizadeh N, Ahmad SNS, et al.: Reduction of renal tubular injury with a RAGE inhibitor FPS-ZM1, valsartan and their combination in streptozotocin-induced diabetes in the rat. Eur J Pharmacol 842: 40–48, 2019. [DOI] [PubMed] [Google Scholar]
- 29. Papadimitriou A, Silva KC, Peixoto EBMI, Borges CM, Lopes de Faria JM, Lopes de Faria JB: Theobromine increases NAD+/Sirt-1 activity and protects the kidney under diabetic conditions. Am J Physiol Renal Physiol 308: F209–F225, 2015. [DOI] [PubMed] [Google Scholar]
- 30. Yang Y, Wang Y, He Z, Liu Y, Chen C, Wang Y, et al.: Trimetazidine inhibits renal tubular epithelial cells to mesenchymal transition in diabetic rats via upregulation of Sirt1. Front Pharmacol 11: 1136, 2020. [DOI] [PMC free article] [PubMed] [Google Scholar]
- 31. Knip M, Douek IF, Moore WPT, Gillmor HA, McLean AEM, Bingley PJ, et al.; European Nicotinamide Diabetes Intervention Trial Group: Safety of high-dose nicotinamide: A review. Diabetologia 43: 1337–1345, 2000. [DOI] [PubMed] [Google Scholar]
- 32. Benyó Z, Gille A, Kero J, Csiky M, Suchánková MC, Nüsing RM, et al.: GPR109A (PUMA-G/HM74A) mediates nicotinic acid-induced flushing. J Clin Invest 115: 3634–3640, 2005. [DOI] [PMC free article] [PubMed] [Google Scholar]
- 33. Benyó Z, Gille A, Bennett CL, Clausen BE, Offermanns S: Nicotinic acid-induced flushing is mediated by activation of epidermal Langerhans cells. Mol Pharmacol 70: 1844–1849, 2006. [DOI] [PubMed] [Google Scholar]
- 34. Zachkeim HS, Vasily DB, Westphal ML, Hastings CW: Reactions to niacinamide. J Am Acad Dermatol 4: 736–738, 1981. [DOI] [PubMed] [Google Scholar]
- 35. Trammell SAAJ, Schmidt MS, Weidemann BJ, Redpath P, Jaksch F, Dellinger RW, et al.: Nicotinamide riboside is uniquely and orally bioavailable in mice and humans. Nat Commun 7: 12948, 2016. [DOI] [PMC free article] [PubMed] [Google Scholar]
- 36. Tran MT, Zsengeller ZK, Berg AH, Khankin EV, Bhasin MK, Kim W, et al.: PGC1α drives NAD biosynthesis linking oxidative metabolism to renal protection. Nature 531: 528–532, 2016. [DOI] [PMC free article] [PubMed] [Google Scholar]
- 37. Poyan Mehr A, Tran MT, Ralto KM, Leaf DE, Washco V, Messmer J, et al.: De novo NAD+ biosynthetic impairment in acute kidney injury in humans. Nat Med 24: 1351–1359, 2018. [DOI] [PMC free article] [PubMed] [Google Scholar]
- 38. Imaruoka K, Oe Y, Fushima T, Sato E, Sekimoto A, Sato H, et al.: Nicotinamide alleviates kidney injury and pregnancy outcomes in lupus-prone MRL/lpr mice treated with lipopolysaccharide. Biochem Biophys Res Commun 510: 587–593, 2019. [DOI] [PubMed] [Google Scholar]
- 39. Guan Y, Wang S-R, Huang X-Z, Xie QH, Xu Y-Y, Shang D, et al.: Nicotinamide mononucleotide, an NAD+ precursor, rescues age-associated susceptibility to AKI in a sirtuin 1-dependent manner. J Am Soc Nephrol 28: 2337–2352, 2017. [DOI] [PMC free article] [PubMed] [Google Scholar]
- 40. Chen Y, Liang Y, Hu T, Wei R, Cai C, Wang P, et al.: Endogenous Nampt upregulation is associated with diabetic nephropathy inflammatory-fibrosis through the NF-κB p65 and Sirt1 pathway; NMN alleviates diabetic nephropathy inflammatory-fibrosis by inhibiting endogenous Nampt. Exp Ther Med 14: 4181–4193, 2017. [DOI] [PMC free article] [PubMed] [Google Scholar]
- 41. Lynch MR, Tran MT, Ralto KM, Zsengeller ZK, Raman V, Bhasin SS, et al.: TFEB-driven lysosomal biogenesis is pivotal for PGC1α-dependent renal stress resistance [published correction appears in JCI Insight 5: e142898, 2020 10.1172/jci.insight.142898]. JCI Insight 5: e126749, 2019. [DOI] [PMC free article] [PubMed] [Google Scholar]
- 42. Chow F, Ozols E, Nikolic-Paterson DJ, Atkins RC, Tesch GH: Macrophages in mouse type 2 diabetic nephropathy: Correlation with diabetic state and progressive renal injury. Kidney Int 65: 116–128, 2004. [DOI] [PubMed] [Google Scholar]
- 43. Gärtner K: Glomerular hyperfiltration during the onset of diabetes mellitus in two strains of diabetic mice (c57bl/6j db/db and c57bl/ksj db/db). Diabetologia 15: 59–63, 1978. [DOI] [PubMed] [Google Scholar]
- 44. Hasegawa K, Wakino S, Sakamaki Y, Muraoka H, Umino H, Minakuchi H, et al.: Communication from tubular epithelial cells to podocytes through Sirt1 and nicotinic acid metabolism. Curr Hypertens Rev 12: 95–104, 2016. [DOI] [PubMed] [Google Scholar]
- 45. Muraoka H, Hasegawa K, Sakamaki Y, Minakuchi H, Kawaguchi T, Yasuda I, et al.: Role of Nampt-Sirt6 axis in renal proximal tubules in extracellular matrix deposition in diabetic nephropathy. Cell Rep 27: 199–212.e5, 2019. [DOI] [PubMed] [Google Scholar]
- 46. Revollo JR, Grimm AA, Imai S: The NAD biosynthesis pathway mediated by nicotinamide phosphoribosyltransferase regulates Sir2 activity in mammalian cells. J Biol Chem 279: 50754–50763, 2004. [DOI] [PubMed] [Google Scholar]
- 47. Revollo JR, Körner A, Mills KF, Satoh A, Wang T, Garten A, et al.: Nampt/PBEF/Visfatin regulates insulin secretion in beta cells as a systemic NAD biosynthetic enzyme. Cell Metab 6: 363–375, 2007. [DOI] [PMC free article] [PubMed] [Google Scholar]
- 48. Stein LR, Imai S: Specific ablation of Nampt in adult neural stem cells recapitulates their functional defects during aging. EMBO J 33: 1321–1340, 2014. [DOI] [PMC free article] [PubMed] [Google Scholar]
- 49. Stromsdorfer KL, Yamaguchi S, Yoon MJ, Moseley AC, Franczyk MP, Kelly SC, et al.: NAMPT-mediated NAD(+) biosynthesis in adipocytes regulates adipose tissue function and multi-organ insulin sensitivity in mice. Cell Rep 16: 1851–1860, 2016. [DOI] [PMC free article] [PubMed] [Google Scholar]
- 50. Mills KF, Yoshida S, Stein LR, Grozio A, Kubota S, Sasaki Y, et al.: Long-term administration of nicotinamide mononucleotide mitigates age-associated physiological decline in mice. Cell Metab 24: 795–806, 2016. [DOI] [PMC free article] [PubMed] [Google Scholar]
- 51. Uddin GM, Youngson NA, Sinclair DA, Morris MJ: Head to head comparison of short-term treatment with the NAD(+) precursor nicotinamide mononucleotide (NMN) and 6 weeks of exercise in obese female mice. Front Pharmacol 7: 258, 2016. [DOI] [PMC free article] [PubMed] [Google Scholar]
- 52. Yeung F, Hoberg JE, Ramsey CS, Keller MD, Jones DR, Frye RA, et al.: Modulation of NF-kappaB-dependent transcription and cell survival by the SIRT1 deacetylase. EMBO J 23: 2369–2380, 2004. [DOI] [PMC free article] [PubMed] [Google Scholar]
- 53. Kauppinen A, Suuronen T, Ojala J, Kaarniranta K, Salminen A: Antagonistic crosstalk between NF-κB and SIRT1 in the regulation of inflammation and metabolic disorders. Cell Signal 25: 1939–1948, 2013. [DOI] [PubMed] [Google Scholar]
- 54. Park JH, Long A, Owens K, Kristian T: Nicotinamide mononucleotide inhibits post-ischemic NAD(+) degradation and dramatically ameliorates brain damage following global cerebral ischemia. Neurobiol Dis 95: 102–110, 2016. [DOI] [PMC free article] [PubMed] [Google Scholar]
- 55. Conze DB, Crespo-Barreto J, Kruger CL: Safety assessment of nicotinamide riboside, a form of vitamin B3 . Hum Exp Toxicol 35: 1149–1160, 2016. [DOI] [PubMed] [Google Scholar]
- 56. Xiong S, Salazar G, Patrushev N, Alexander RW: FoxO1 mediates an autofeedback loop regulating SIRT1 expression. J Biol Chem 286: 5289–5299, 2011. [DOI] [PMC free article] [PubMed] [Google Scholar]
Associated Data
This section collects any data citations, data availability statements, or supplementary materials included in this article.