Significance Statement
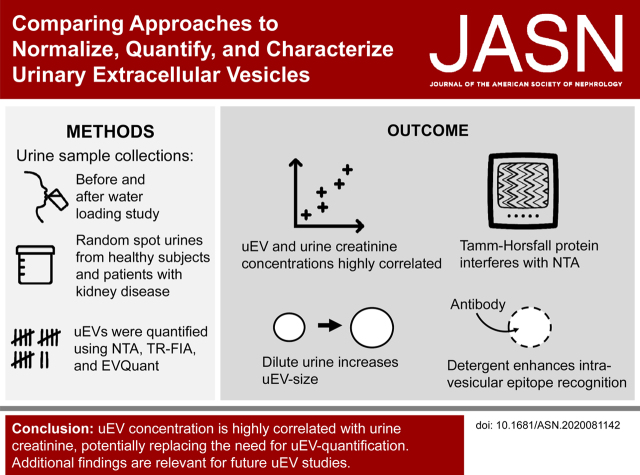
Urinary extracellular vesicles (uEVs) are a promising noninvasive source of kidney biomarkers, but the optimal approaches for normalization, quantification, and characterization in spot urines are unclear. To address the hypothesis that urine creatinine can be used as a normalization variable, urine particles were quantified in dilute and concentrated urines (water deprivation–loading study) and randomly from healthy subjects and patients with kidney disease. In these various settings, urine creatinine was highly correlated with particle counts, suggesting it can be used as a normalization variable. Additional findings relevant for future uEV studies include interference of Tamm-Horsfall protein with nanoparticle tracking analysis, excretion of larger uEVs in dilute urine, and the ability to treat uEVs with detergent to enhance intracellular epitope recognition.
Keywords: creatinine, osmolality, exosomes, urinary extracellular vesicles, biomarker, uromodulin, particles, aquaporin-2, tetraspanin, normalization
Visual Abstract
Abstract
Background
Urinary extracellular vesicles (uEVs) are a promising source for biomarker discovery, but optimal approaches for normalization, quantification, and characterization in spot urines are unclear.
Methods
Urine samples were analyzed in a water-loading study, from healthy subjects and patients with kidney disease. Urine particles were quantified in whole urine using nanoparticle tracking analysis (NTA), time-resolved fluorescence immunoassay (TR-FIA), and EVQuant, a novel method quantifying particles via gel immobilization.
Results
Urine particle and creatinine concentrations were highly correlated in the water-loading study (R 2 0.96) and in random spot urines from healthy subjects (R 2 0.47–0.95) and patients (R 2 0.41–0.81). Water loading reduced aquaporin-2 but increased Tamm-Horsfall protein (THP) and particle detection by NTA. This finding was attributed to hypotonicity increasing uEV size (more EVs reach the NTA size detection limit) and reducing THP polymerization. Adding THP to urine also significantly increased particle count by NTA. In both fluorescence NTA and EVQuant, adding 0.01% SDS maintained uEV integrity and increased aquaporin-2 detection. Comparison of intracellular- and extracellular-epitope antibodies suggested the presence of reverse topology uEVs. The exosome markers CD9 and CD63 colocalized and immunoprecipitated selectively with distal nephron markers.
Conclusions uEV concentration is highly correlated with urine creatinine, potentially replacing the need for uEV quantification to normalize spot urines. Additional findings relevant for future uEV studies in whole urine include the interference of THP with NTA, excretion of larger uEVs in dilute urine, the ability to use detergent to increase intracellular-epitope recognition in uEVs, and CD9 or CD63 capture of nephron segment–specific EVs.
Urinary extracellular vesicles (uEVs) provide a noninvasive readout of cellular processes in kidney epithelial cells during health and disease.1 Large-scale proteomics have shown that uEVs contain many proteins implicated in kidney function and pathology.2 Indeed, uEVs have been studied in AKI,3,4 polycystic kidney disease,5,6 glomerular disease,7 and tubulopathies.8 Therefore, the application of uEVs offers an attractive noninvasive alternative to current diagnostic tests, in particular for early diagnosis of kidney disease.9 However, clinical application of uEV analysis in random spot urine requires validated normalization and quantification methods. The uEV concentration depends on the uEV excretion rate (secretion minus possible uptake) and the overall urine concentration. Therefore, a normalization variable is required to substitute for time in analyzing the relative excretion rate of uEV proteins.10
Several normalization variables have been proposed, including urine creatinine, exosomal markers, and Tamm-Horsfall protein (THP). In clinical practice, urine creatinine is routinely used to normalize analytes in spot urines, for example in the urine protein to creatinine ratio.11 Although many investigators use urine creatinine to normalize uEVs12–15, this is not universal10,16,17 and the relationship between uEV number and urine creatinine has not been systematically studied. Exosomal markers include proteins implied in exosomal biogenesis (ALIX, TSG101), and the tetraspanin surface markers CD9 and CD63, which can also be used to capture uEVs. However, it is not known if CD9- and CD63-capture antibodies isolate EVs from all nephron segments.1 Finally, THP highly correlates with exosomal markers such as ALIX and TSG101, and may be analyzed on Coomassie gel.10
At present, a myriad uEV isolation and detection techniques are available. uEV isolation techniques include differential ultracentrifugation, density gradient centrifugation, size-exclusion chromatography, ultrafiltration, precipitation, and affinity isolation.18 An example of affinity isolation is time-resolved fluorescence immunoassay (TR-FIA) with uEV-capture antibodies (typically CD9 or CD63).19 uEV detection can be performed by (imaging) flow cytometry, dynamic light scattering, nanoparticle tracking analysis (NTA), electron microscopy, atomic force microscopy, and resistive pulse sensing.20 Recently, a novel method called EVQuant was developed, which detects EVs using fluorescence after immobilization in a gel (doi.org/10.1101/2020.10.21.348375 on BioRxiv).
Of these techniques, we selected three that allow a determination of the uEV excretion rate in whole urine, including NTA, TR-FIA, and EVQuant. A direct comparison between uEV and creatinine excretion rates would address the question of whether urine creatinine can be used to normalize for uEV concentration in spot urines. Therefore, we tested the hypothesis that urine creatinine can be used to normalize for uEV concentration in spot urines. A second aim of this study was to compare and further characterize the three uEV quantification techniques NTA, CD9–TR-FIA, and EVQuant. Our results show that urine creatinine is a reliable normalization marker, and we identify unique strengths and limitations of the three uEV techniques relevant for future uEV studies.
Methods
Urine Sample Collections
Urine samples were collected from five groups, including (1) before and after a water-loading study in healthy male subjects (Supplemental Table 1), (2) random spot-urine samples in healthy male and female subjects (Supplemental Table 1), (3) spot urines from male and female patients with kidney disease (autosomal dominant polycystic kidney disease, Supplemental Table 2), (4) second morning urines from healthy subjects for the immunoprecipitation studies (n=6, 27±2 years, 50% female) and fluorescence NTA studies (n=3–7, 28±2 years, all male). The protocols for the studies in healthy subjects (NL52107.078.15) and patients (NL43496.042.13) were approved by the medical ethics committee of the Erasmus Medical Center, and all participants provided informed consent. Healthy subjects had no previous medical history and did not use medication. For the water-loading study, 11 healthy male subjects were water deprived starting at 10 pm until noon the next day, when they received a water load (20 ml/kg body wt in 30 minutes) and a standardized meal (Supplemental Figure 1). They were also instructed to void at 7 am (discarded), 10 am, and noon (water-deprived samples T1 and T2), and 2, 3, 5, and 7 pm (water-loading samples W1–4). Three healthy males also served as time controls on a separate day, and were instructed to drink to thirst and did not receive the water load.
Processing of Urine Samples
All urine samples were processed within 2 hours. They were centrifuged at 2000 × g and 4°C for 10 minutes (Hettich Rotanta centrifuge; Beckman Coulter), after which they were aliquoted at room temperature, and stored with protease inhibitors (“cOmplete” protease inhibitor cocktail tablets, product code 11836145001; Roche, Basel, Switzerland) at −80°C until further analysis. These samples are referred to as “whole urine.” When describing the results of our uEV quantification studies, we use the term “particles,” because not all particles are uEVs.21 All particle counts were performed in whole urine, unless otherwise specified. Urine creatinine, electrolytes, and urea were measured by our center’s clinical chemistry laboratory using the ISE and C702 modules of the Cobas 8000 (Roche); urine osmolality was measured with a freezing-point osmometer (Osmo Station OM-6050; Arkray). Antibodies were used to characterize uEVs using different techniques (described below); an overview of the antibodies used in this study is provided in Supplemental Table 3.
Nanoparticle Tracking Analysis
NTA was performed using a NanoSight NS300 (Sysmex, Etten-Leur, The Netherlands) with Nanoparticle Tracking Analysis 3.1 software (NanoSight, Amesbury, UK). Whole urine samples were diluted in PBS (pH 7.4, 137 mM NaCl, used throughout the studies) to obtain around 40–100 particles per field, then inserted in an O-ring top plate NTA chamber with a syringe. Particles were detected by scattering of a 350 nm laser, with the same settings for each experiment (scatter mode; camera level = 14, i.e., highest level without pixel saturation; detection threshold = 3; i.e., lowest threshold without excessive noise or false results; five videos of 30 seconds each), and the Brownian motion was determined frame to frame. On the basis of these settings, the lower limit of detection was approximately 70 nm. To determine the effect of THP on particle counts by NTA, THP (human native uromodulin derived from multiple donors; Biovendor, Czech Republic) was added in physiologic concentrations (40 µg/ml)22 to PBS or whole urine from 15 healthy subjects (subjects 12–26 in Supplemental Table 1) and incubated for 1 hour at room temperature. To determine the effect of tonicity on particle count and size, different aliquots from these healthy subjects were also diluted in water, 0.9% NaCl or 2.5% NaCl, and measured by NTA. In addition, fluorescence flow NTA was performed in a low-volume flow cell top-plate NTA chamber with a syringe. Whole urine samples were treated with SDS (dissolved in water 2% v/v, final concentration 0.01% v/v) for 10 minutes at room temperature. Then, the samples (with SDS) were incubated with the primary antibody for 2 hours at 4°C, followed by the corresponding secondary antibody conjugated to Alexa488 in the dark at room temperature for 75 minutes. A 488 nm laser beam was used to track antibody-labeled particles (camera level = 15; detection threshold = 6; flow speed = 100). As control, 10 ml whole urine was ultrafiltered (Amicon Ultra-0.5 100 kDa, ACS510012; Merck Millipore, Germany) and centrifuged (20 minutes at 4000 × g at 4°C using a swinging bucket rotor) and the flow through was measured with NTA.
EVQuant
The characteristics of the EVQuant methodology have recently been reported (doi.org/10.1101/2020.10.21.348375 on BioRxiv). Briefly, the whole urine sample was diluted three-fold in PBS and nonspecifically labeled by the generic fluorescence membrane dye Rhodamine R18 (0.33 ng/µl, 568 nm). Subsequently, the labeled samples were mixed with a nondenaturing polyacrylamide gel solution. The mixtures were transferred to a 96-well plate (SensoPlate glass-bottom 96-well plate; Greiner). Immobilized particles were imaged using a spinning disk confocal microscope system (Opera Phenix; Perkin Elmer). Individual EVs were detected and analyzed on the basis of the generic membrane label Rhodamine R18. Particle concentration was corrected by dye in control solution (PBS). To determine CD9 and CD63 expression, this protocol was preceded by labeling the sample with CD9-Alexa647 and CD63-Alexa488 in BSA (0.03% w/v) for 2 hours. In this analysis, each detected EV (Rhodamine R18+) was assessed for CD9 or CD63 expression. The detection threshold (mean plus three times the SD) was determined using a 100 nm liposome sample lacking protein markers. To determine the effect of SDS on the detection of aquaporin-2+ (AQP2+) particles, urine samples from 15 healthy subjects (subjects 12–26 in Supplemental Table 1) were incubated without SDS or with 0.01% v/v SDS for 10 minutes, followed by 1 hour incubation with AQP2, followed by 1 hour incubation with anti-rabbit Alexa488.
CD9–TR-FIA
A white neutravidin plate (Life Technologies) was coated with biotinylated anti-human CD9 overnight at 4°C. Next, 100 µl of thawed whole urine was vortexed and added to incubate for 1 hour at room temperature. Then, Europium-conjugated anti-CD9 was added and incubated for 1 hour at room temperature. Incubation steps were performed on a plate shaker and were followed by six washes with wash buffer (Kaivogen, Finland). Before signal measurement on a Victor 1420 multilabel counter, a Europium enhancer (Kaivogen, Finland) was added to the empty well, and incubated for 15 minutes in the dark.
Ultracentrifugation
Before immunoprecipitation, immunoblotting, and electron microscopy, a “200K” pellet was obtained with ultracentrifugation using 50 ml whole urine as starting volume (Supplemental Table 4). Briefly, after the first 17,000 × g spin, the pellet was dissolved in 250 μl freshly made 200 mg/ml dithiothreitol diluted in ddH2O, heated, and added to isolation buffer (10 mM triethanolamine, 250 mM sucrose, pH 7.6) and again centrifuged at 17,000 × g. The two supernatants were combined and centrifuged at 200,000 × g for 2 hours. EVQuant was used to determine the yield of ultracentrifugation (Supplemental Figure 2).23 NTA was used to determine size before and after ultracentrifugation (Supplemental Figure 3).
Immunoprecipitation
The 200K pellets were dissolved in 100 µl PBS and divided into two equal samples of 50 µl, which were incubated overnight at 4°C with a biotinylated antibody against CD9 or CD63, followed by a 2-hour incubation at room temperature with streptavidin-coated magnetic beads (10 µl M280 beads; Invitrogen, ThermoFisher Scientific). The supernatant of the magnet separation was kept at 4°C, whereas the beads were resuspended in 50 µl RIPA buffer (50 mM Tris HCl, pH 8.0, Igepal 630 [1% v/v], deoxycholate [0.5% w/v], SDS [0.1% v/v], 150 mM NaCl) by vortexing for 10 minutes at 4°C. Both the precipitate and the supernatant were heated in Laemmli solution for 10 minutes at 60°C. Finally, the beads were separated from the precipitated proteins by the magnet.
Immunoblotting
The 200K pellet was suspended in PBS and divided into aliquots. For immunoblot analysis 6× Laemmli solution (440 mM Tris HCl, pH 6.8, SDS 10% v/v, glycerol 25% v/v, Bromphenol blue 0.1% w/v, β-mercaptoethanol 6% v/v) was added and heated for 10 minutes at 60°C. SDS-PAGE was carried out on a gradient gel (4%–12% Criterion precast gel, 26 well, 15 μl; Bio-Rad) and transferred semiwet to PVDF membranes (0.2 um PVDF; Bio-Rad) using a Trans-Blot Turbo Transfer system by Bio-Rad at 25 V, 1 A during 30 minutes. The membranes were blocked (tris-buffered saline with 0.1% v/v tween 20 and 5% w/v BSA or milk) and probed overnight at 4°C with the appropriate antibodies (Supplemental Table 3). Subsequently membranes were washed and incubated with a secondary antibody. After washing of the membranes, they were exposed to enhanced chemiluminescence substrate (Clarity Western ECL substrate; Bio-Rad) and analyzed by an Amersham system (GE Life Sciences). Analysis of exosomal markers ALIX, TSG101, CD63, CD81, and CD9 was performed by loading relative to original urine volume (50 ml of urine was ultracentrifuged and the pellet dissolved in 180 µl Laemmli solution, of which 15 µl was loaded). Analysis of AQP2 was performed with loading on the basis of urine volume and urine creatinine. After immunoprecipitation, the precipitated fractions were loaded in equal volumes, along with equal volume of the supernatant fractions.
Transmission Electron Microscopy
Thawed 200K pellets before and after the water load (T1 versus W1) of four subjects were spotted on Formvar-coated grids (200 mesh; Agar Scientific Ltd.). Adsorbed particles were directly negatively stained using UranyLess EM stain according to the manufacturer’s instructions (22409; Electron Microscopy Sciences). Briefly, grids were placed on a drop of UranyLess solution for 1 minute. Subsequently, grids were drained on filter paper and examined under a Philips CM100 electron microscope at 80 kV. Of each sample, approximately 50 particles were analyzed. EVs were defined as round-shaped membrane vesicles, rather homogenous in size and not exceeding 100–150 nm in diameter.
Immunolocalization
The localization of CD9, CD63, and CD81 was determined in human kidney, bladder, and prostate tissue obtained from healthy subjects, which were procured according to the Dutch Code of Conduct legislation concerning the use of residual tissue for research. The Code of Conduct maintains an opt-out consent system and, therefore, no written informed consent was required. Staining was done by automated immunohistochemistry using the Ventana Benchmark ULTRA (Ventana Medical Systems). Sequential 4 µm formalin-fixed paraffin-embedded sections were stained using the Ultraview Universal DAB detection Kit (Ventana Medical Systems). In brief, after deparaffinization and heat-induced antigen retrieval with cell conditioning 1 (CC1; Ventana Medical Systems) for 32 minutes at 100°C, the tissue samples were incubated with either anti-CD9, anti-CD63, or anti-CD81 for 32 minutes at 37°C. Incubation was followed by a hematoxylin II counter stain for 8 minutes, then a blue coloring reagent for 8 minutes at room temperature according to the manufacturer’s instructions (Ventana Medical Systems). Double-staining protocols were performed by automated multiplex immunofluorescence using the Ventana Benchmark Discovery (Ventana Medical Systems). In brief, after deparaffinization and heat-induced antigen retrieval with CC1 for 32 minutes, the tissue samples were incubated first with either CD9, CD63, or CD81 for 32 minutes at 37°C, followed by detection with FAM (6-carboxyfluorescein) at 37°C for 12 minutes. An antigen denature step was performed using CC2 for 8 minutes at 100°C. Slides were then incubated with anti-NHE3 (proximal tubule marker), anti-NKCC2 (thick ascending limb marker), anti-parvalbumin (distal convoluted tubule marker), anti-AQP2 (collecting duct marker), or anti-WT1 (glomerular marker) for 32 minutes at 37°C, followed by detection with Red610 at 37°C for 12 minutes (Ventana Medical Systems). Slides were washed in PBS and covered with DAPI in Vectashield (Vector Labs, United Kingdom).
Statistical Analyses
Results were first tested for normal distribution and the statistical analysis was selected accordingly (see Supplemental Table 5 for overview). Correlations were calculated using Pearson’s correlation coefficient. The serially obtained parameters in the water-loading test were analyzed using repeated-measures ANOVA. Comparison of particle quantification techniques was performed by Bland-Altman analysis. The electron microscopy data were analyzed using a mixed-linear model. A P value <0.05 was considered significant. Data are presented as mean±SEM, unless stated otherwise.
Results
Urine Creatinine Correlates with Particle Number
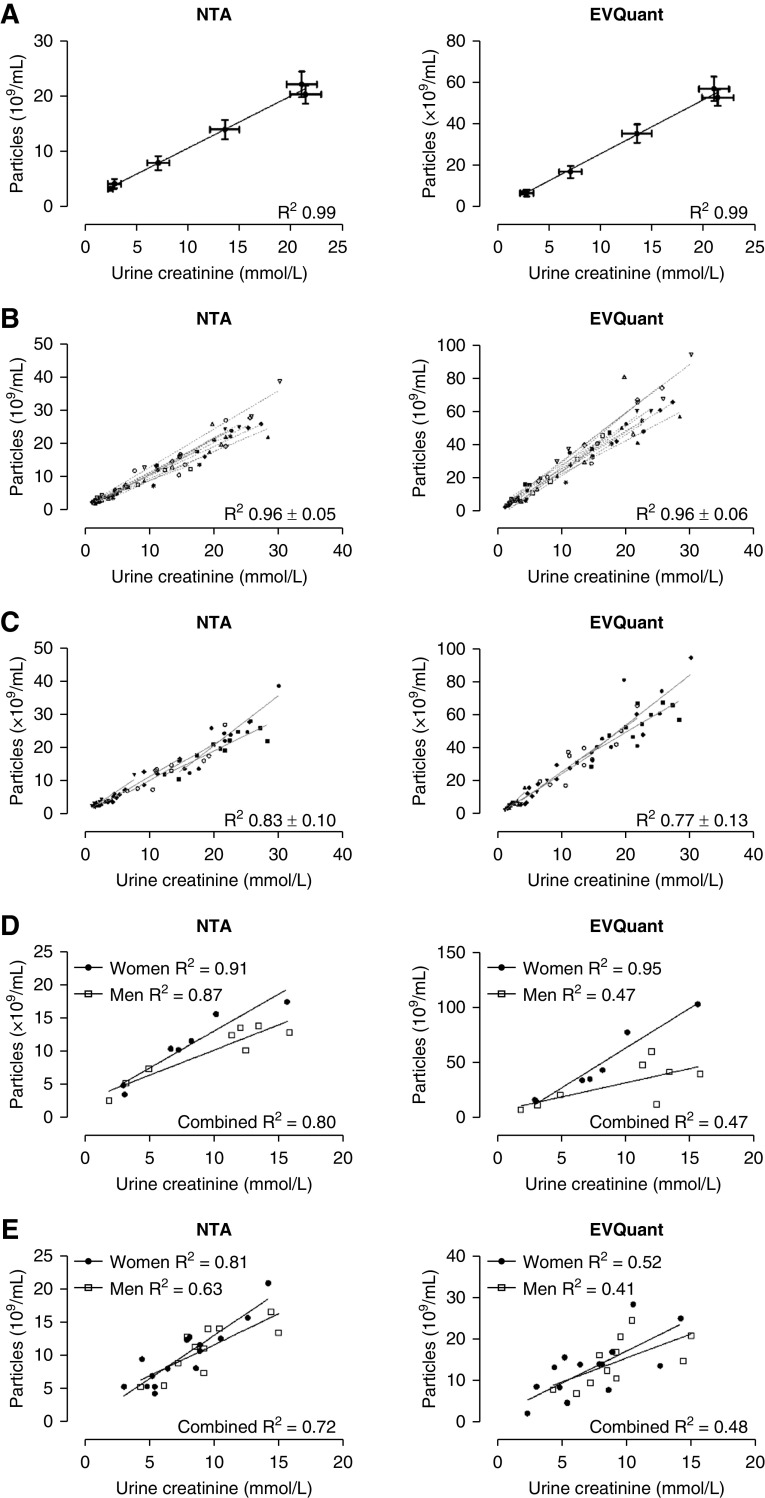
In the concentrated and dilute urine samples from the water-loading experiment, urine creatinine concentration highly correlated with particle count per time point (NTA and EVQuant, R 2 0.99, P<0.001, Figure 1A). This finding was confirmed in the individual (intraperson) correlations with an average R 2 of 0.96±0.05 using NTA and 0.96±0.06 using EVQuant (Figure 1B). No differences were identified in the individual slopes (NTA P=0.13; EVQuant P=0.12). When analyzing the correlations for each time point, the (interperson) correlations were still high (Figure 1C). The uEV marker CD9 was also analyzed with EVQuant and urine creatinine concentration showed a high correlation with CD9+ particles (Supplemental Figure 4). In random spot urines of another cohort of healthy subjects, we again identified high correlations between particle count and urine creatinine (Figure 1D). In random spot urines of patients with polycystic kidney disease, correlations also remained high, although slightly lower than in healthy subjects (Figure 1E). Correction of urine creatinine for the body surface area did not improve the correlations (data not shown). Of note, the lowest correlations were identified with EVQuant in male healthy subjects and male patients.
Figure 1.
Correlations between urine creatinine and particle concentrations. (A) Correlation between average urine creatinine and particle concentrations per time point of the water-loading experiment as measured by NTA and EVQuant in whole urine (n=11/time point). (B) Interindividual correlations between urine creatinine and particle concentrations as measured by NTA and EVQuant. The reported R 2 is the average of individual R 2±SD. Each symbol represents a healthy subject (six samples per subject, n=66). (C) Intraindividual correlations per time point of the water-loading experiment. Each symbol represents a time point (samples per time point, n=66). (D) Correlations between urine creatinine and particle concentrations in random spot urines from healthy male and female subjects (n=15). (E) Correlations between urine creatinine and particle concentrations in random spot urines from male and female patients with polycystic kidney disease (n=26).
Water Loading Reduces AQP2 but Increases THP Recovery
Water loading increased the urine flow rate, and decreased urine osmolality and urine creatinine concentration (Figure 2, A–C, Supplemental Figure 5). Water loading significantly decreased urine particle concentration as measured by NTA and EVQuant (Figure 2D). In the 200K pellet, water loading reduced the abundance per unit volume of the exosome markers ALIX, TSG101, CD63, CD81, and CD9, and of AQP2. In contrast, water loading increased the amount of THP recovered in the 200K pellet (Figure 2E). The excretion rate of creatinine remained constant, whereas the osmole excretion rate significantly increased on water loading (Figure 2F). This rise was mostly explained by an increase in urea, sodium, and potassium (Supplemental Table 6). When loading the immunoblots normalized to urine creatinine, AQP2 abundance per creatinine decreased after water loading, confirming the biologic response to the water load (Figure 2G).
Figure 2.
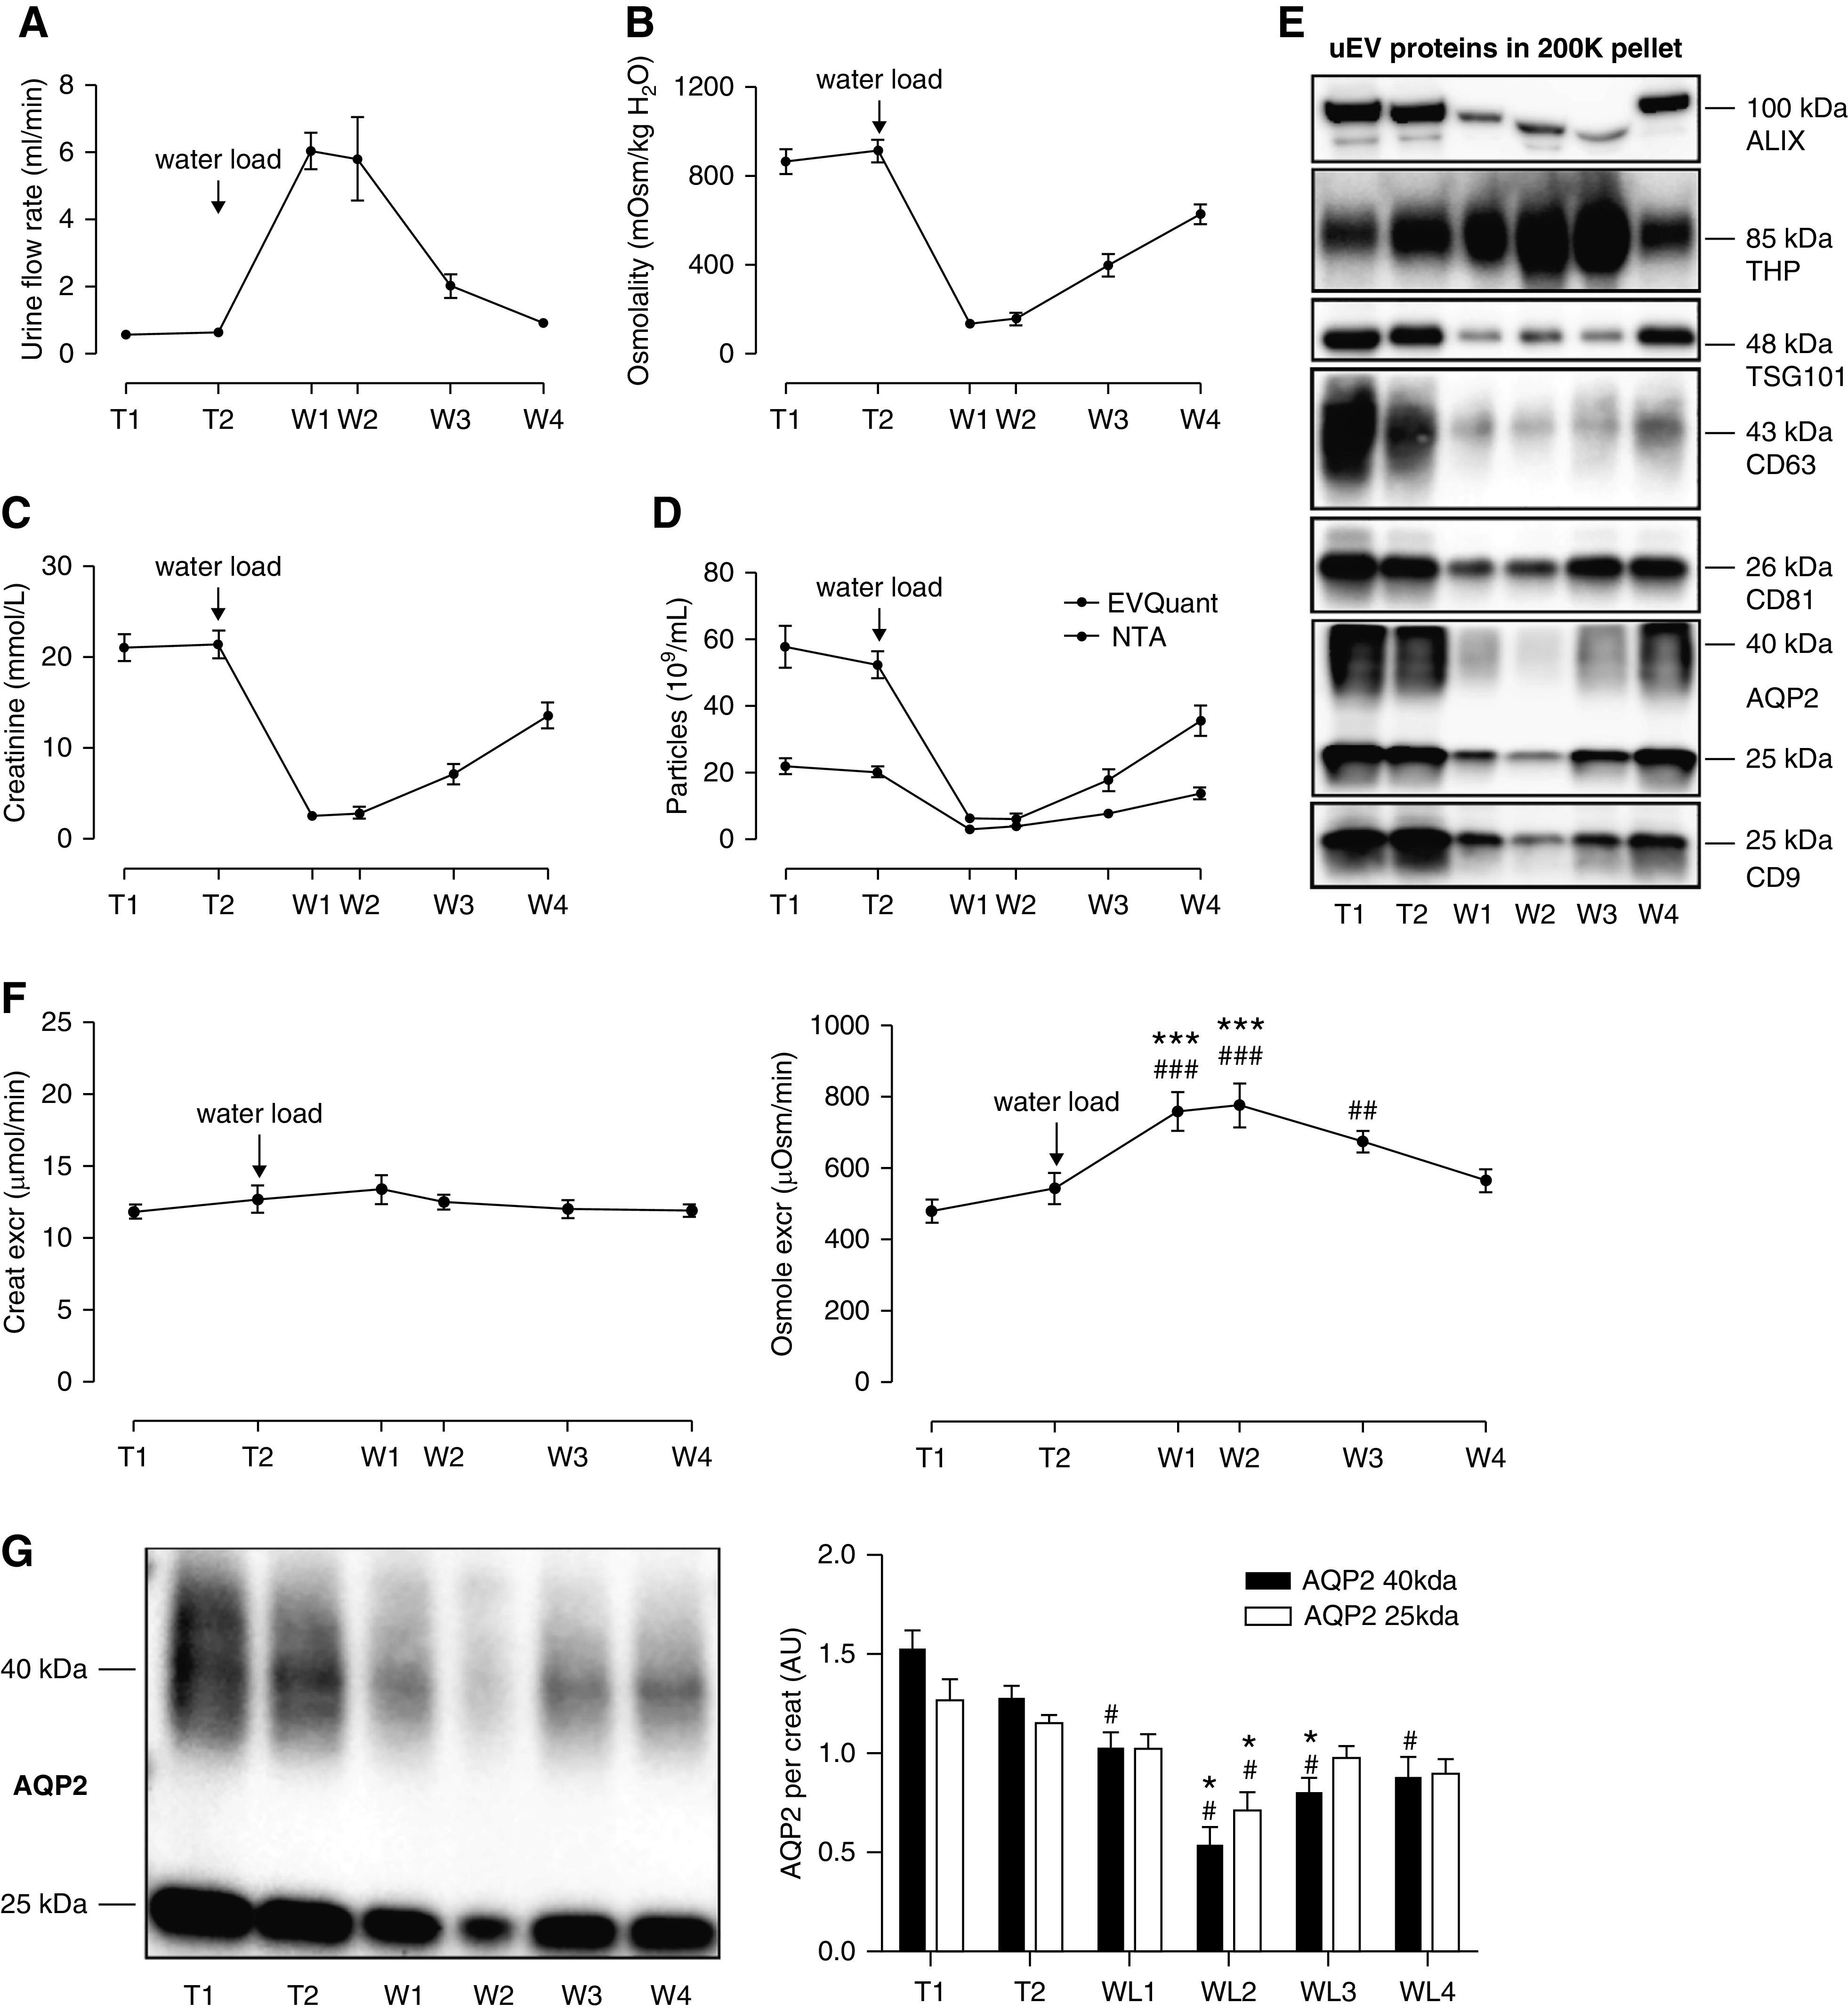
Effects of water deprivation and water loading on urine osmolality, urine creatinine, and urinary extracellular vesicle proteins. Urine flow rate (A), urine osmolality (B), urine creatinine (C), and urine particle concentration, (D) during water deprivation (T1–2) and water loading (W1–4) in 11 healthy subjects. (E) Representative immunoblots of uEV markers ALIX, TSG101, CD63, CD81, and CD9, and of THP and AQP2 loaded relative to original urine volume (50 ml of urine subjected to ultracentrifugation, pellet suspended in 180 µl, 15 µl loaded in each lane). Densitometry for all immunoblots (n=11) showed ANOVA P<0.001 with P<0.001 for post-hoc testing of W1 versus T2. (F) Urinary excretion rates of creatinine and osmoles (urine volume was recorded for n=8; formula: concentration × volume, expressed per minute). ### and ***P<0.001 versus T1 and T2, respectively; ## P<0.01 versus T1. (G) Representative immunoblot of AQP2 loaded by urine creatinine level and densitometry of the two AQP2 bands per creatinine in the 11 participants, with the average normalized to one. Repeated measures ANOVA was performed on the average of the two bands (25 and 40 kDa, # P<0.05 versus T1, *P<0.05 versus T2 in post-hoc tests).
THP Interferes with NTA, Water Loading Increases uEV Size
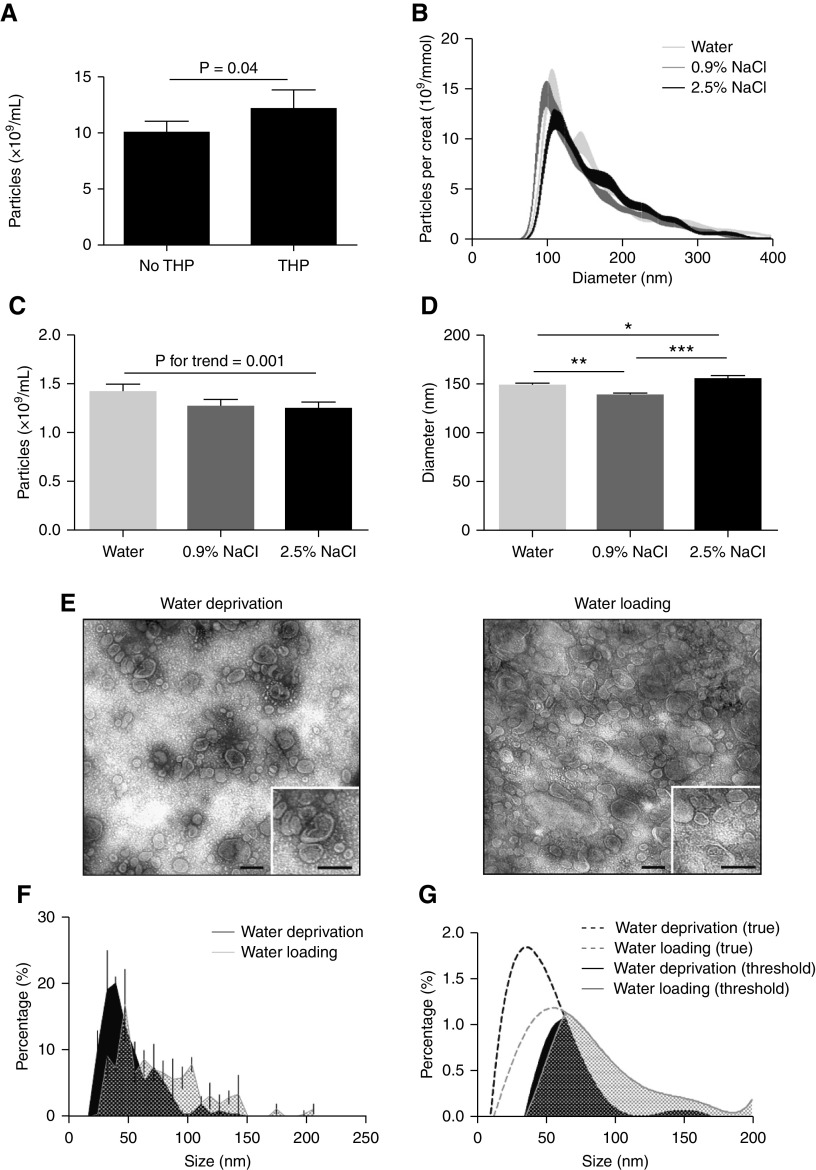
A 50% increase of urine particle excretion rate after water loading was detected by NTA (P<0.001, Figure 3A), which was accompanied by a 11 nm increase in median size (P<0.001, Figure 3B, Supplemental Figure 6). In contrast, the excretion rate of particles as measured by EVQuant or CD9–TR-FIA was not increased by water loading (Figure 3, C and D). We hypothesized that NTA detected THP as particles. To test this possibility, we added physiologic amounts of THP to urine22 and showed THP increased particle count (Figure 4A) and was visible as nonspherical particles (Supplemental Videos 1 and 2). However, this did not yet explain the increase in particle size. Therefore, we analyzed whether the ex vivo addition of hypotonic or hypertonic solutions affected particle count and particle size (Figure 4B). Increasing tonicity reduced particle count (Figure 4C), but both hypotonic and hypertonic solutions significantly increased particle size compared with isotonic solution (Figure 4D). To address this further, TEM was performed to compare the size of EVs in urine samples collected during water deprivation and water loading (Figure 4E) and after excluding an effect of ultracentrifugation on particle size (Supplemental Figure 3). Median uEV size by TEM during water deprivation was 47 nm (range 32–63 nm), which increased to 71 nm (39–103 nm) after water loading (P<0.001, Figure 4F). The TEM data were mathematically modeled using a sixth-degree polynomial equation to analyze whether the increase in uEV size after water loading could explain the enhanced detection by NTA (Figure 4G). With the detection limit set between 35 and 65 nm, 57% of uEVs in water-deprivation samples and 27% of uEVs in water-loading samples were missed. Therefore, water loading may have increased particle detection by NTA with as much as 70%.
Figure 3.
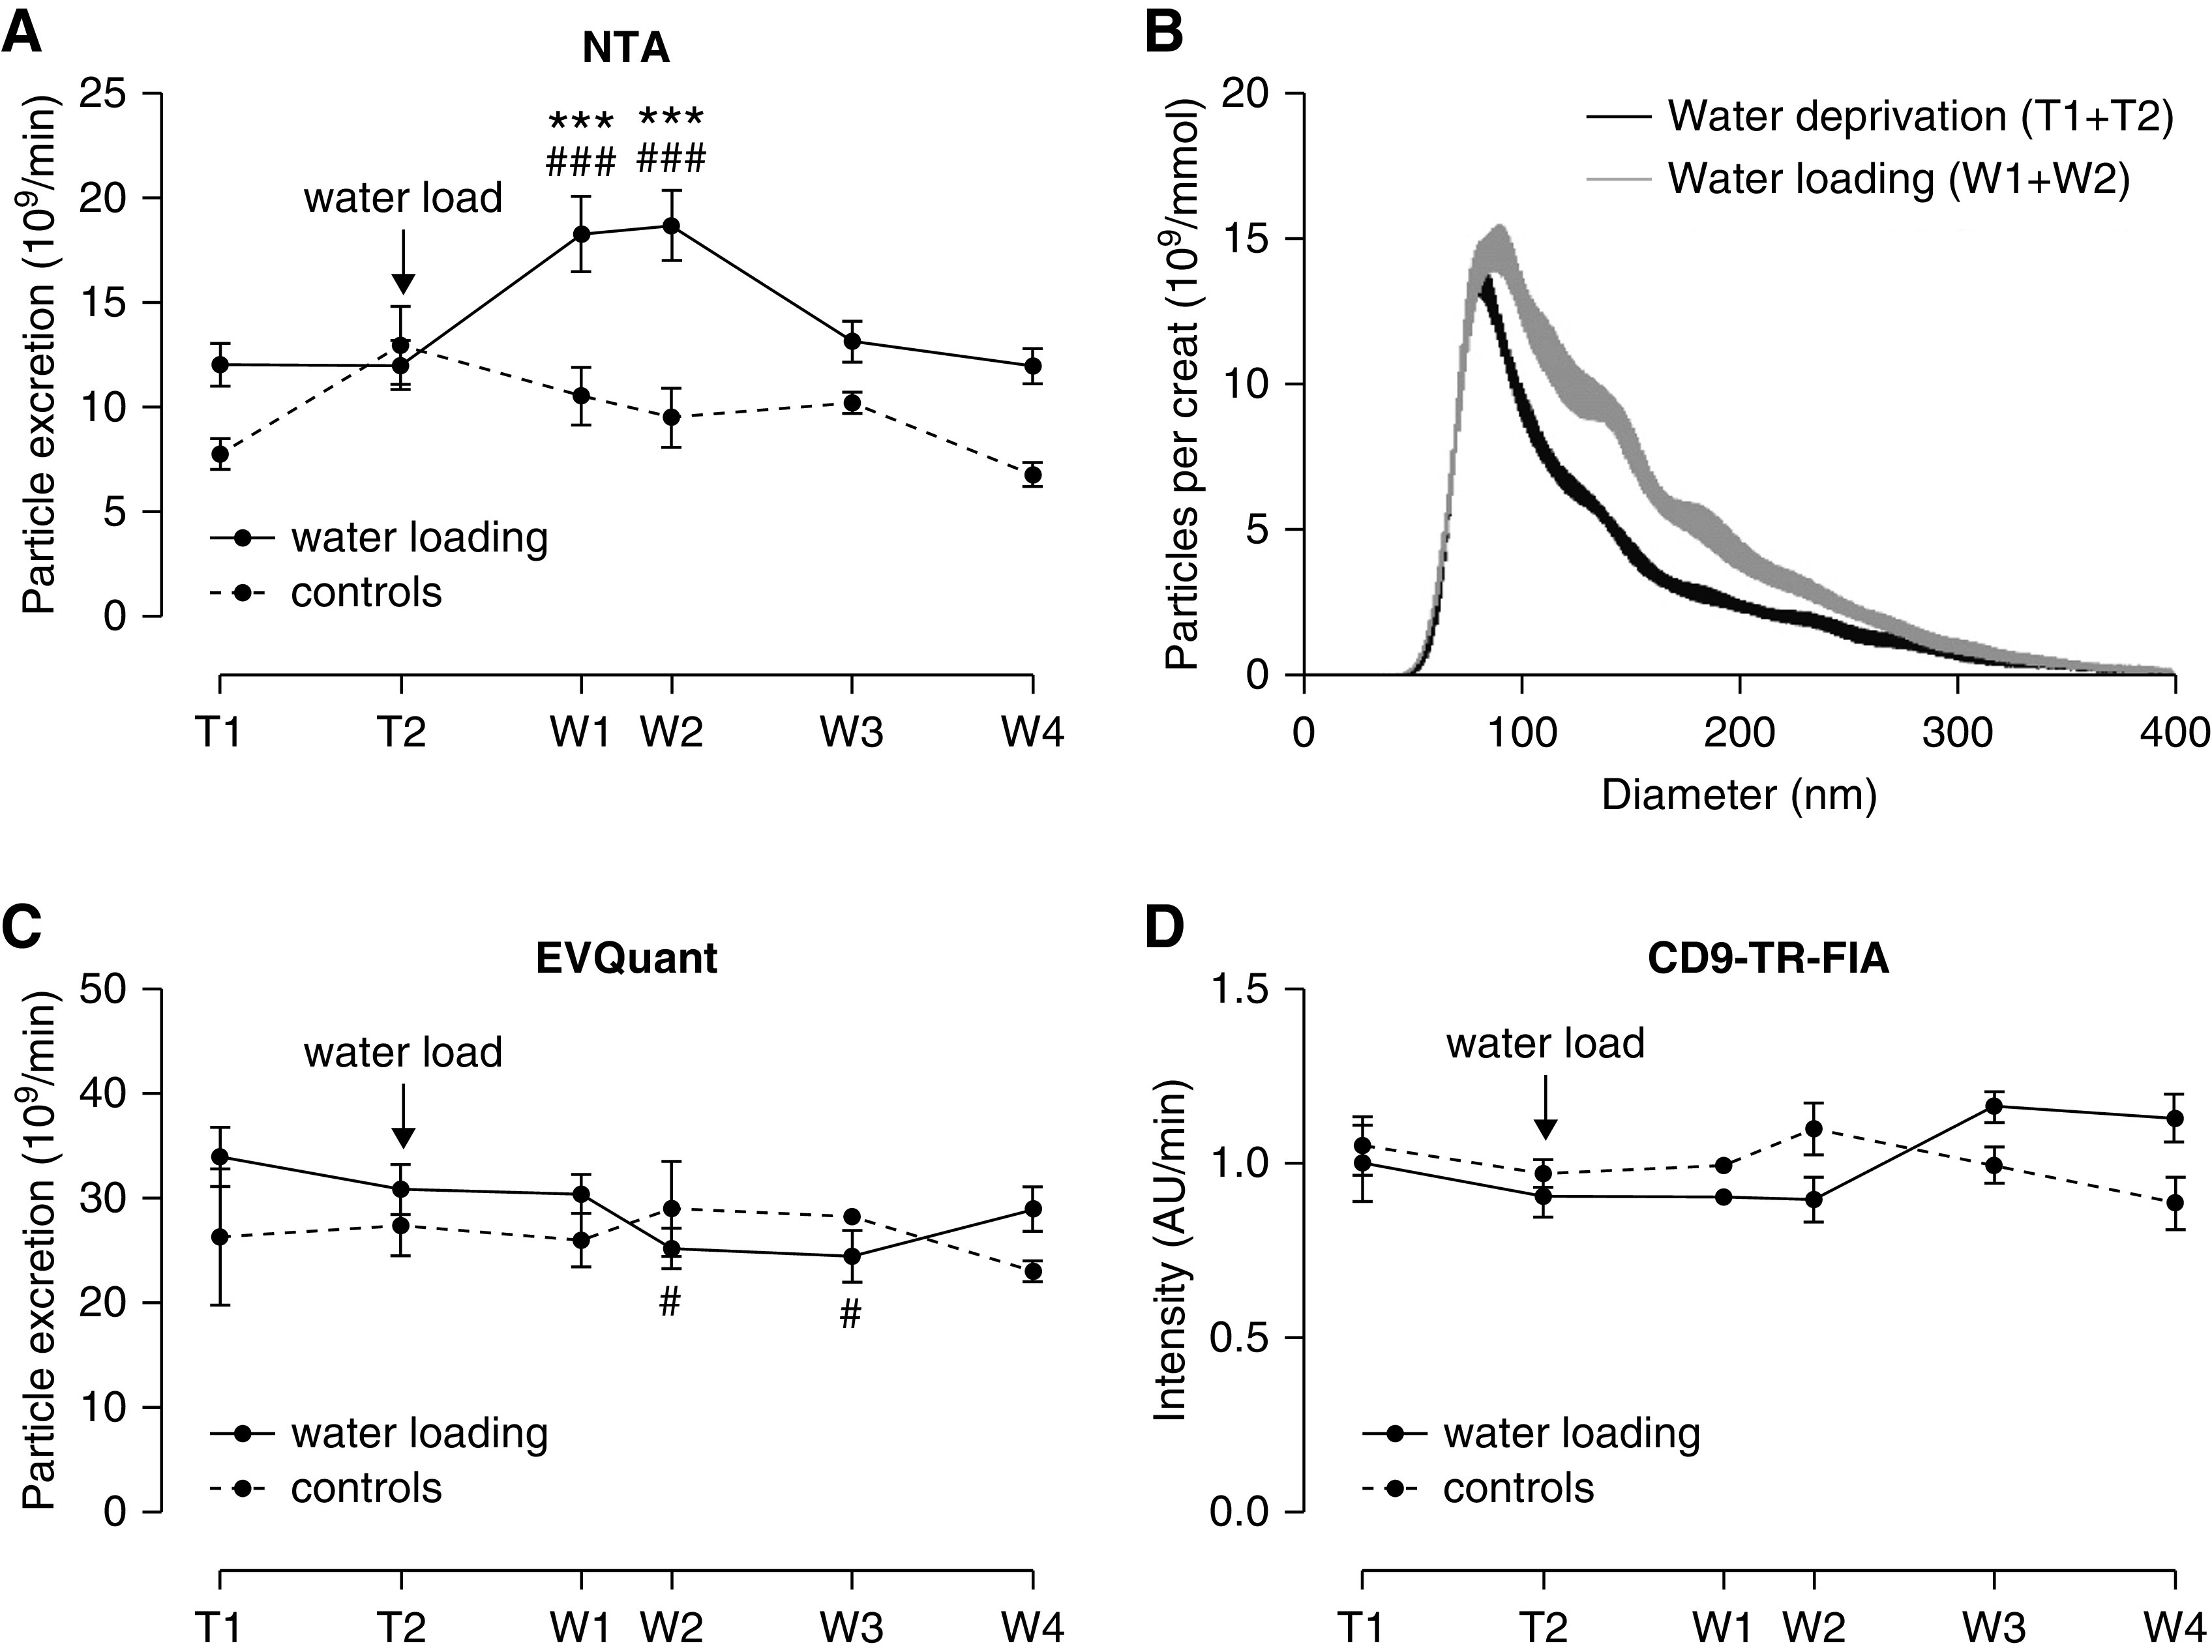
Particle excretion rate and size during water deprivation (T1–2) and after water loading (W1–4). (A) uEV excretion rate by NTA in subjects undergoing the water loading protocol (urine volume was recorded for n=8) and controls (n=3). ### and *** P<0.001 versus T1 and T2 in post-hoc tests. (B) NTA-based size distribution of particles/mmol creatinine at every time point of the water loading in whole urine (per 1 nm size bin±SEM, n=8, see also Supplemental Figure 5). (C and D) Particle excretion rate as measured by EVQuant and CD9–TR-FIA in subjects undergoing the water-loading protocol (n=8) and controls (n=3). # P<0.05 versus T1 in post-hoc test.
Figure 4.
Effect of THP and urinary concentration on particle count and size. (A) The addition of THP (40 µg/ml) significantly increased particle count by NTA (n=12/treatment). (B) NTA size-distribution graph with different solutions added to whole urine (n=15/treatment). (C) Particle count was significantly lower when solutions with increasing tonicity were added to whole urine (n=15/treatment). (D) Particle size was significantly higher when adding hypotonic or hypertonic solution to whole urine (n=15/treatment; *P<0.05, **P<0.01, ***P<0.001). (E) Representative image of negative staining transmission electron microscopy (TEM) of 200 K pellets from urine sample during water deprivation (T1, left panel) and directly after water loading (W1, right panel). The black bar represents 100 nm. (F) TEM size distribution of double membrane vesicles of water deprivation and water loading samples (n=4 per time-point, per 8 nm size bin±SEM). Analysis was performed by mixed linear model. (G) Polynomial model on the basis of TEM size distribution, with an arbitrary linear threshold between 35 and 65 nm representing the possible threshold of NTA. Areas under the curves were used to determine the percentage of uEVs that are missed with this threshold (per 1 nm size bin).
Comparison of Particle Quantification Techniques
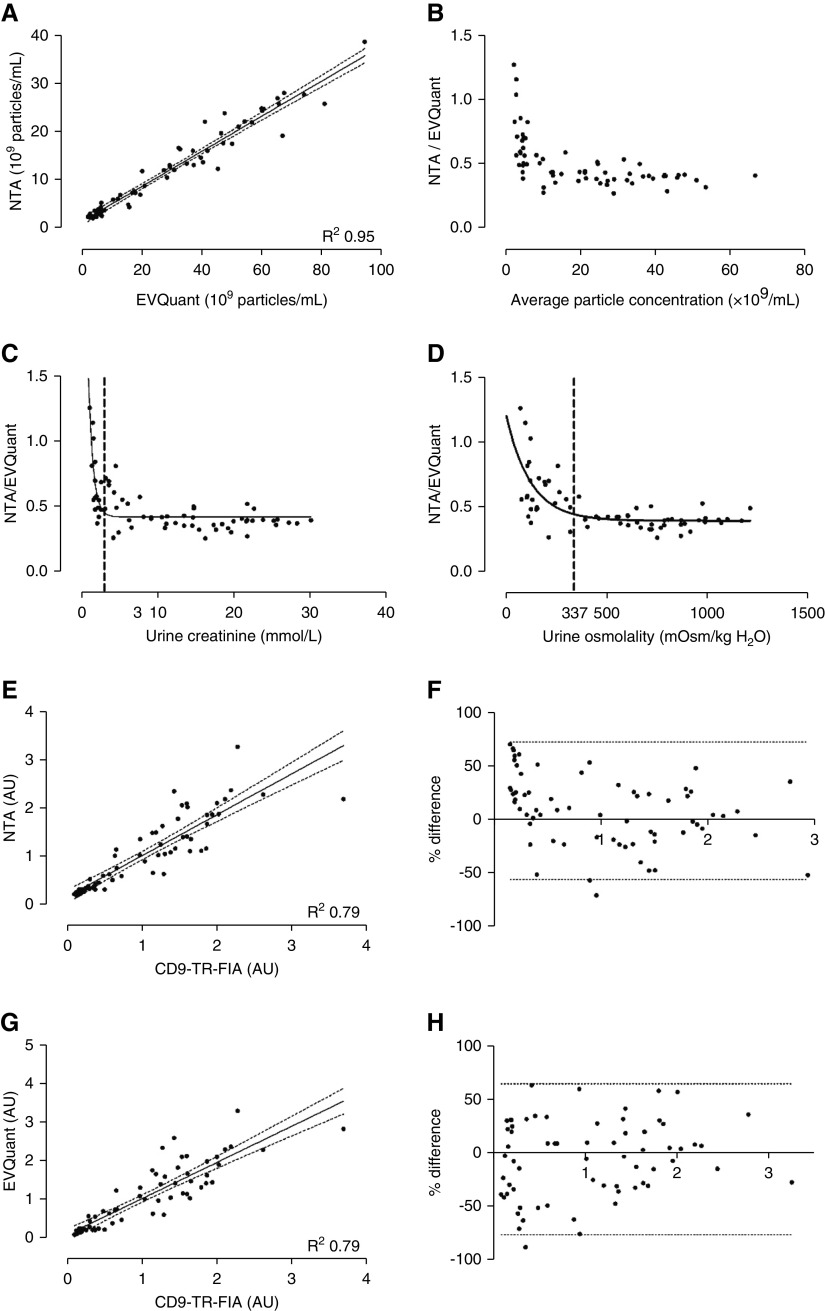
Representative raw image data of NTA, EVQuant, and CD9–TR-FIA are shown in Supplemental Figure 7. Urine particle concentrations as measured by NTA and EVQuant correlated strongly (R 2=0.95, Figure 5A). However, EVQuant identified 2.8±0.1 times more particles (P<0.001). Bland-Altman analysis demonstrated a high agreement between the two methods, but a skewed curve toward lower particle concentrations (P<0.001, Figure 5B). This is in line with the “pseudo increase” in particle excretion rate after water loading with NTA (Figure 3A). This skewing was relevant for urine creatinine concentrations below 3 mmol/L, or urine osmolalities below 337 mOsm/kg (Figure 5, C and D). Bland-Altman comparisons of particle quantification by CD9–TR-FIA demonstrated weaker correlations with NTA and EVQuant (Figure 5, E–H). Again, there was skewing at lower particle concentrations with NTA (P<0.05), but not with EVQuant (P=0.10).
Figure 5.
Comparison of three whole urine uEV quantification techniques. NTA, EVQuant, and CD9–TR-FIA were compared using the urine samples from the water-loading study (n=66). Correlation (A) and Bland-Altman plot (B) of particle concentrations measured by EVQuant versus NTA. Limits of agreements are not shown because of the severe skewing (P<0.001) at low concentrations. (C) Ratio of particles as measured by NTA versus EVQuant in relation to urinary creatinine and (D) osmolality, with representation of the deflection points, to determine at which urine creatinine concentration or urine osmolality skewing starts (dashed lines). (E) Correlation and (F) Bland-Altman plot of urinary particle concentrations measured by NTA versus TR-FIA. Correlation (G) and Bland-Altman plot (H) of EVQuant versus CD9–TR-FIA. In the Bland-Altman plots, limits of agreements are shown by the dotted lines. AU, arbitrary units.
CD9 and CD63 in Kidney and uEVs
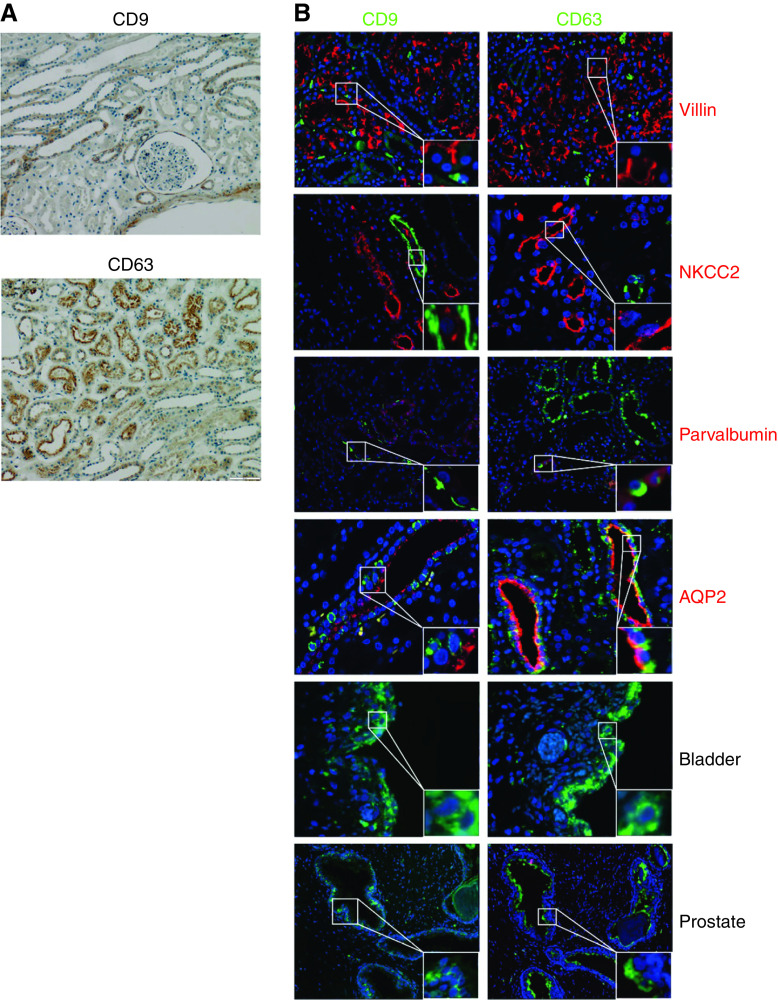
Although CD9 and CD63 are considered general markers for exosomes, and as such used as capture proteins for the TR-FIA assays, it is not known from which tubular segments EVs are isolated. CD9 and CD63 colocalized selectively with the distal convoluted tubule marker parvalbumin and the collecting duct marker AQP2 (Figure 6). Both tetraspanins were also detectable in prostate and bladder tissue. To analyze this further, the distribution of CD9+ and CD63+ particles in human urine was assessed using EVQuant (Figure 7A). This showed that 32±3% of particles were CD9+ and 8±2% were CD63+, whereas 10% of CD9+ particles were also CD63+, and 33% of CD63+ particles were also CD9+. Pull-down by both tetraspanins resulted in an immunoblot signal for NCC (another distal convoluted tubule marker) and AQP2, but not for NHE3, NaPi-IIa, and NKCC2 (markers of the proximal tubule and thick ascending limb, Figure 7, B and C, Supplemental Figure 8). Pull-down of AQP2 appeared more efficient with CD9 than with CD63. Colocalization was repeated with another CD9 and CD63 antibody and CD81, which only showed colocalizations of CD63 with parvalbumin and CD81 with the proximal tubule marker villin (Supplemental Figure 9).
Figure 6.
Immunohistochemistry and immunolocalization of CD9 and CD63 in healthy human kidney, bladder, and prostate tissue. (A) Immunohistochemistry of CD9 and CD63 (both brown). (B) Immunofluorescence of normal human kidney, prostate and bladder tissue, to determine colocalization of CD9 and CD63. The following markers were used for nephron segments, including villin for proximal tubule, NKCC2 for the thick ascending limb, parvalbumin for the distal convoluted tubule, and AQP2 for the collecting duct. Blue: nuclear staining with DAPI.
Figure 7.
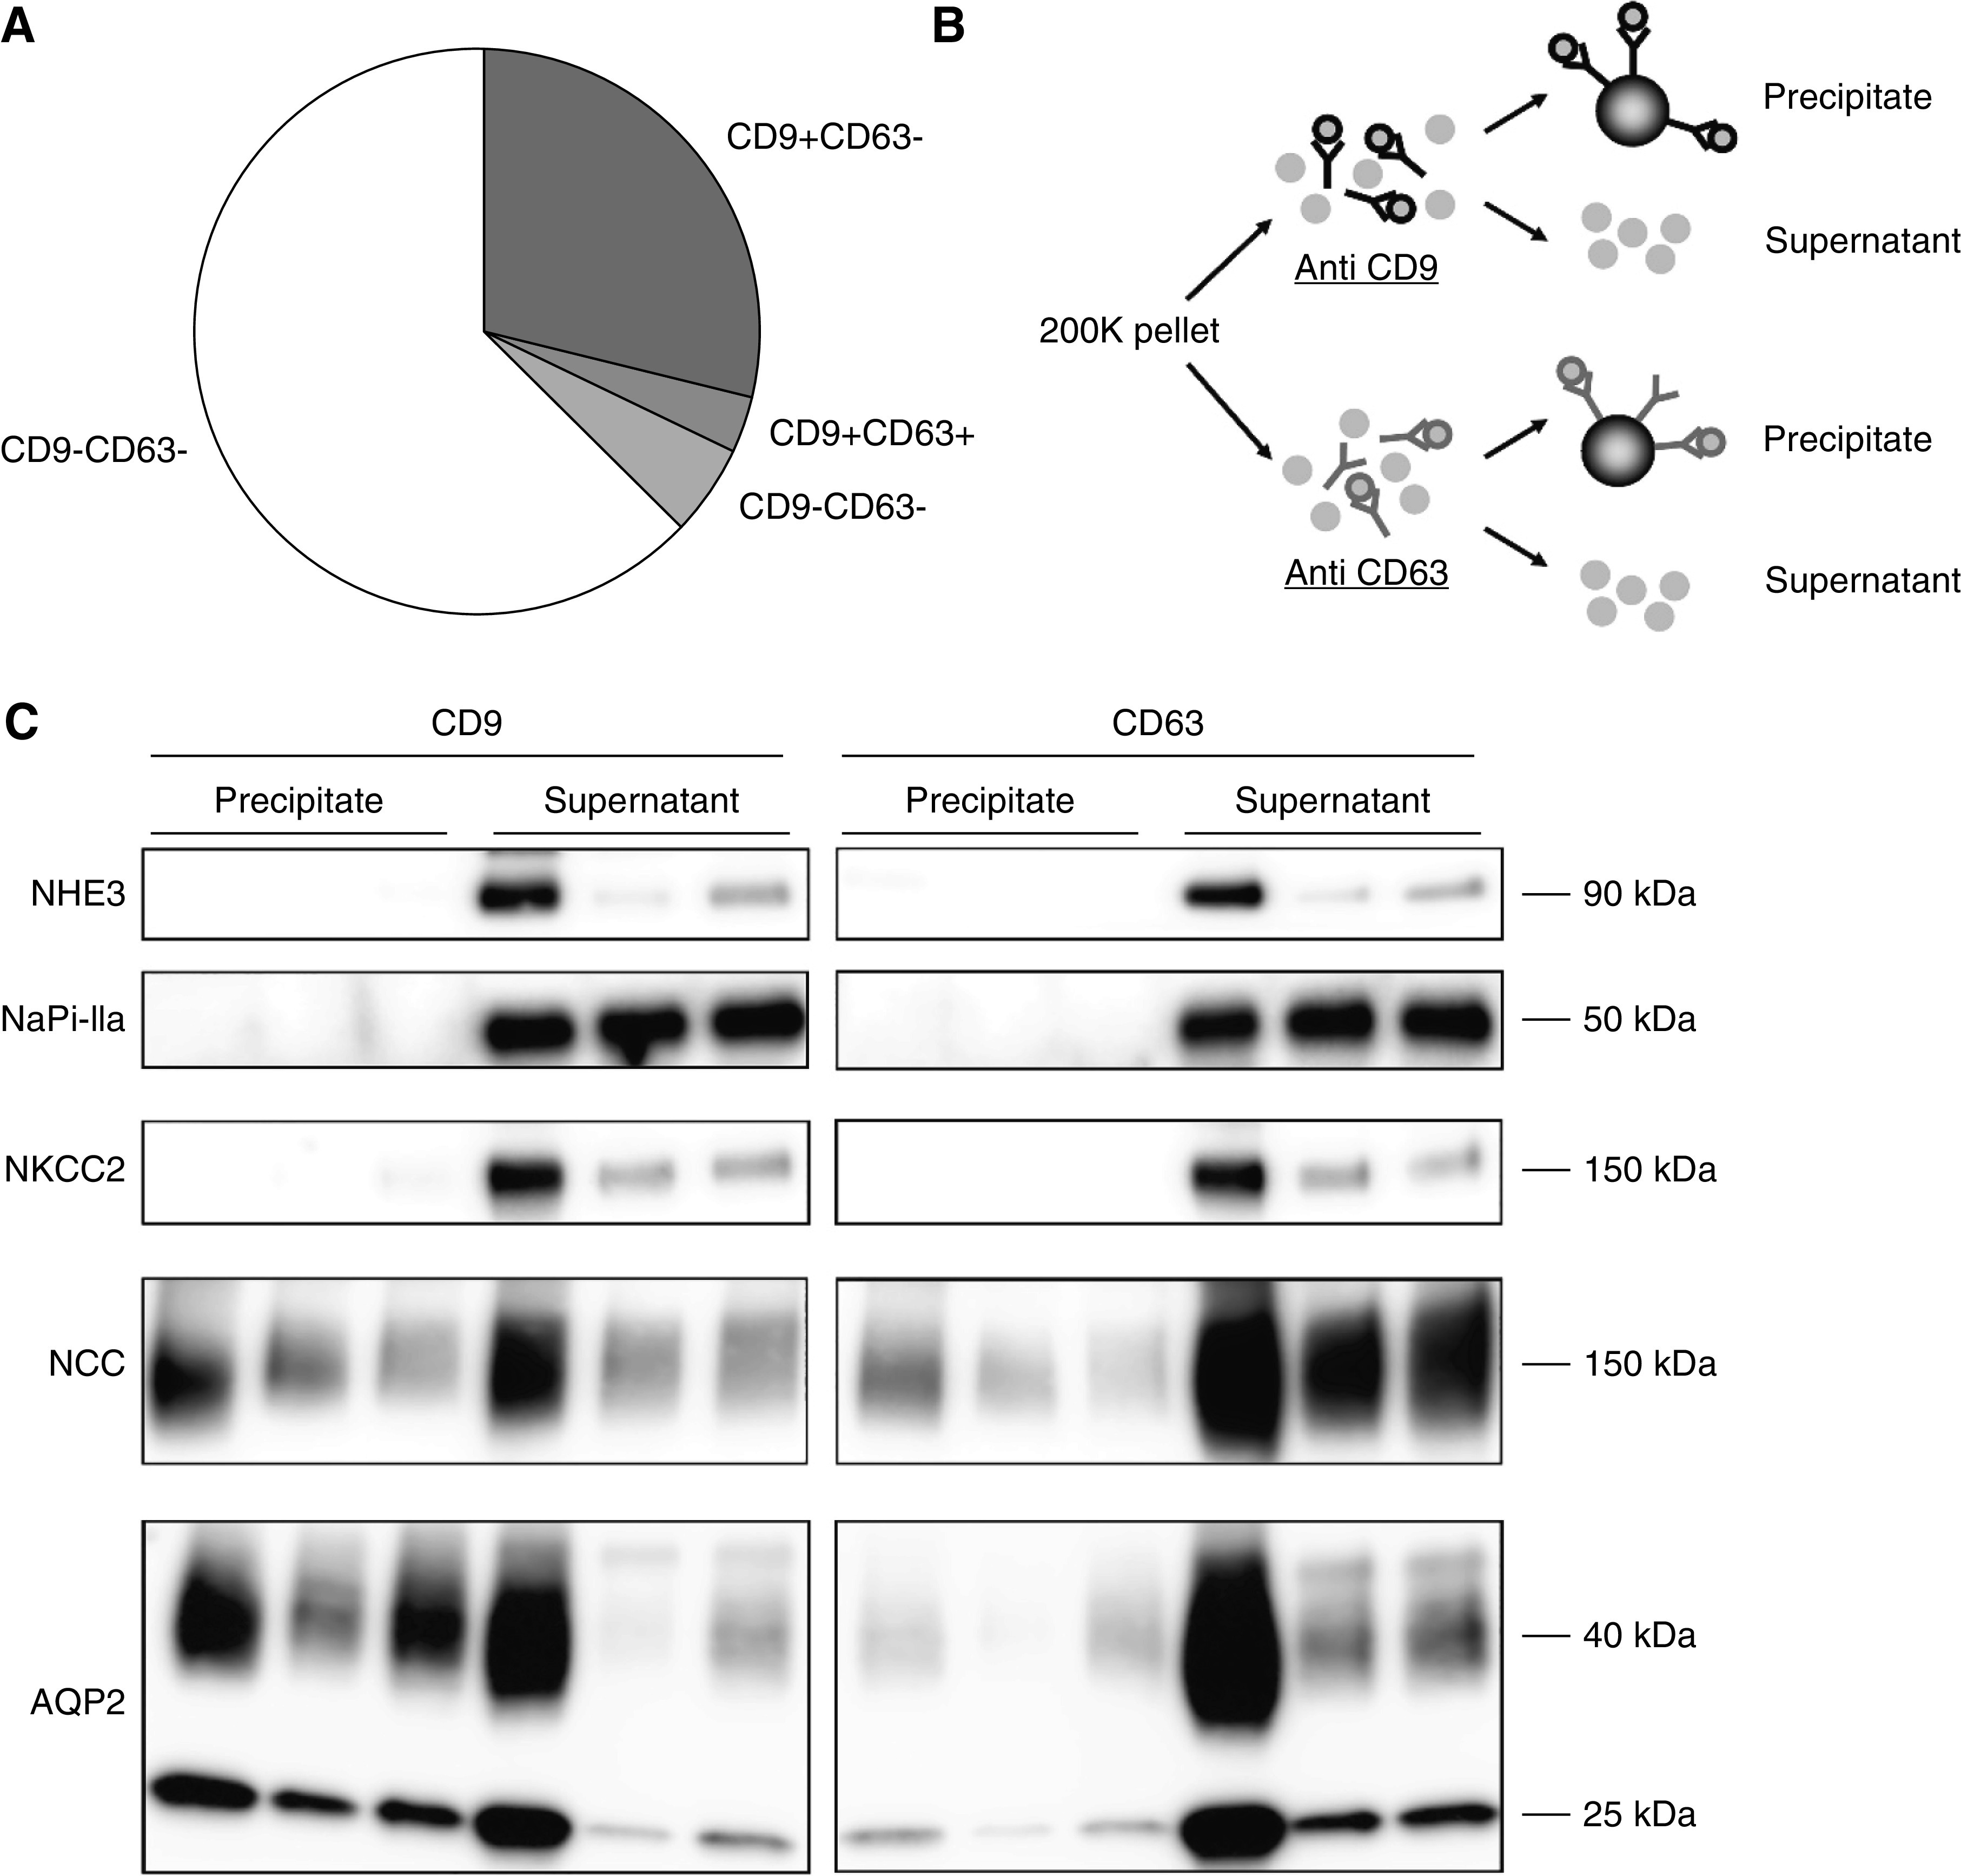
Characterization of CD9+ and CD63+ particles. (A) Pie chart showing CD9+ and CD63+ distribution of particles as measured by EVQuant in second void morning spot urines (n=6). (B) The 200 K pellet was divided and subjected to either anti-CD9 or anti-CD63 antibodies. The magnetic beads were added to separate antibody-bound (precipitate) from nonbound particles (supernatant). (C) Immunoblots of NHE3 and NaPi-IIa (proximal tubule marker), NKCC2 (thick ascending limb marker), NCC (distal convoluted tubule marker), and AQP2 (collecting duct marker) in particles precipitated from 200 K pellets (n=3 subjects) by either CD9- or CD63-antibody coated magnetic beads. See also Supplemental Figure 8 for the three additional subjects.
Use of Detergent for Intracellular Epitope Recognition
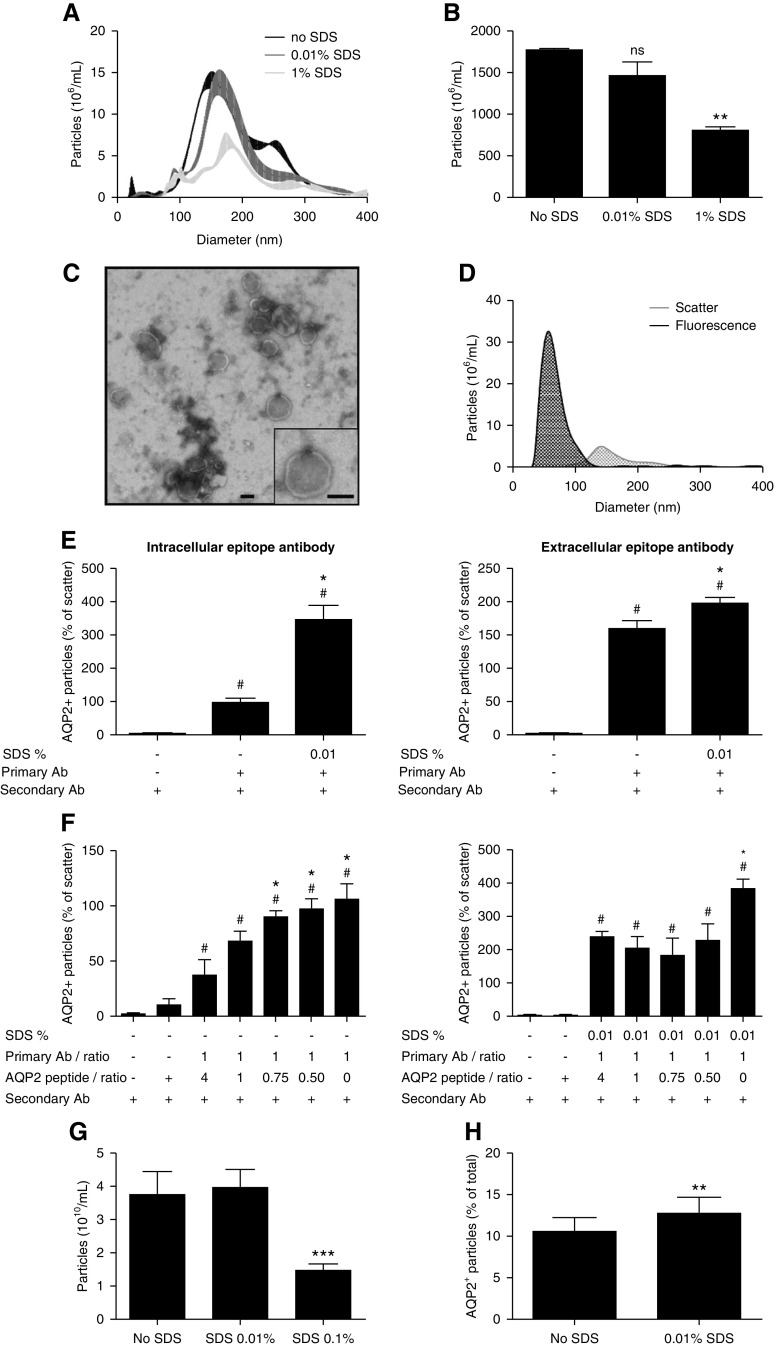
Current uEV characterization methods only allow for antibody characterization of extracellular epitopes of uEVs, although often antibodies against intracellular epitopes are used.24,25 Alternatively, the detergent SDS can be used to provide antibodies access to intracellular epitopes of uEVs.15 To this end, the effect of various SDS concentrations on whole urine particle size distribution and concentration was determined using fluorescence NTA. Whereas 1% v/v SDS significantly lowered particle concentration, SDS 0.01% v/v only elicited a small right shift of the size distribution (Figure 8A) and did not significantly reduce particle count (Figure 8B). Few particles were detected when using buffer with SDS or ultrafiltered urine with SDS (Supplemental Figure 10A). TEM of 0.01% v/v SDS-treated urine samples demonstrated particles resembling those of nontreated samples (Figure 8C). Fluorescence AQP2+ particles had a smaller size distribution than total particles, as measured in scatter mode (AQP2 63±7 nm, scatter mode 150±9 nm, Figure 8D). Few particles were detected when using buffer or secondary antibody only (Supplemental Figure 10B). An intracellular and extracellular epitope antibody against AQP2 was added to whole urine and secondarily labeled with fluorescence dye to study the influence of SDS 0.01% v/v on the number of fluorescence particles on NTA. SDS significantly increased the detection of AQP2+ particles with both types of antibodies, although the enhancement was more prominent with the intracellular-epitope antibody (approximately 3.5-fold increase, Figure 8E). With decreasing anti-AQP2 peptide to antibody ratio, the AQP2+ signal significantly increased with and without 0.01% v/v SDS, showing the signal specificity (Figure 8F). Finally, we addressed whether detergent could also increase AQP2 signal with EVQuant. SDS 0.01% v/v did not change particle count, whereas SDS 0.1% v/v markedly reduced the number of particles (Figure 8G). The 0.01% v/v SDS significantly increased the percentage of AQP2+ particles (Figure 8G).
Figure 8.
Use of detergent to enhance intracellular epitope recognition. (A) NTA size distribution graph of whole urine samples without SDS and treated by 0.01% v/v or 1% v/v SDS (n=3/treatment). (B) NTA particle counts without SDS, with 0.01% v/v or 1% v/v SDS (n=3/treatment, **P<0.01 versus no SDS). (C) Representative TEM image of 0.01% v/v SDS-treated 200 K pellets. The bar represents 100 nm. (D) Fluorescence NTA-based representative size distribution of uEVs treated with 0.01% v/v SDS versus controls using a NanoSight NS300 in fluorescence mode (AQP2–488) and in scatter mode. (E) Use of intracellular-epitope and extracellular-epitope AQP2 antibodies to determine the percentage of AQP2+ particles (relative to particle count in scatter mode) without SDS and with 0.01% v/v SDS (n=3–7/treatment). See Supplemental Figure 11 for characteristics of the extracellular-epitope AQP2 antibody. To determine the background noise, urine samples were also treated with only secondary antibody (n=3–6). # P<0.05 versus secondary antibody only, *P<0.05 versus primary and secondary antibody without SDS. (F) AQP2 antibody and anti-AQP2 peptide inhibition experiment in the absence of SDS (left panel: intracellular-epitope antibody, right panel: extracellular-epitope antibody, n=3–4/treatment, * and # P<0.05 versus 1:4 ratio and anti-AQP2 peptide + secondary antibody, respectively). (H) extracellular-epitope AQP2 antibody and anti-AQP2 peptide inhibition experiment in the presence of 0.01% v/v SDS (n=3–4/treatment, * and # P<0.05 versus 1:4 ratio and anti-AQP2 peptide + secondary antibody, respectively). (G) Particle counts by EVQuant of urine samples without SDS, with 0.01% SDS or 0.1% SDS (n=15/treatment, ***P<0.001 versus no SDS). (H) Percentage of EVQuant-detected particles that colocalized with AQP2-Alexa488 nm in urine samples without SDS versus 0.01% SDS (n=15/treatment, **P<0.01).
Discussion
This study addresses two important questions for high-throughput analysis of uEVs, namely how to normalize uEV concentration and how to quantify uEVs in spot urines. Using an intervention that produced maximal differences in urine concentration, both urinary creatinine and uEV excretion rates remained constant and were highly correlated. In random spot urines from healthy volunteers and patients with kidney disease, the correlation between particle and creatinine concentration was also high. This suggests that urine creatinine can be used as a normalization marker for uEV concentration in spot urines. Because differences in muscle mass and diet influence creatinine production, this should be taken into account in uEV studies using urine creatinine as a normalization variable. This may also explain the lower correlation in men who have higher muscle mass; an alternative explanation could be the presence of prostate-derived EVs. A previous study concluded that urine creatinine and osmolality are equally suitable for normalization.26 Our data suggest urine osmolality is less suitable in the specific setting of large differences in urinary concentration. This may be explained by water deprivation limiting osmolar excretion and water loading relieving it.
This study also identified several novel technical aspects that are relevant for future uEV studies in whole urine (summarized in Table 1). This includes (1) the interference of THP with NTA in whole urine, (2) excretion of larger uEVs in dilute urine, (3) selective tubular staining of CD9 and CD63 (frequently used as capture antibodies in TR-FIA), and (4) the ability to use detergent with NTA and EVQuant to increase intracellular epitope recognition. These findings will be discussed in more detail below.
Table 1.
Comparison of the three uEV techniques for quantification and protein characterization
| Characterization | NTA | CD9/63–TR-FIA | EVQuant |
|---|---|---|---|
| Quantification | ++ | + | +++ |
| Comments | Absolute number and uEV size | Only relative number of CD9/CD63+ uEVs | Absolute number |
| Affected by urinary dilution, Tamm-Horsfall protein, and proteinuria | Detects most particles | ||
| Detection threshold for smaller uEVs | |||
| uEV-protein detection | ++ | + | ++ |
| Comments | Can be combined with SDS and intracellular-epitope antibodies | Can be combined with SDS and intracellular-epitope antibodies | Can be combined with SDS and intracellular-epitope antibodies |
| EV selection depends on isoform affinity of capture antibodies used |
Our study clearly shows THP should be taken into account when studying uEVs, as emphasized previously.10,27 More THP was detected in dilute urine, suggesting that urinary concentration reduces THP polymerization, generating more THP oligomers. This is one possible explanation of why only NTA detected more particles after water loading. Indeed, adding THP to urine increased the particle count measured by NTA. Conversely, adding hypertonic solution to urine reduced particle count, likely because hypertonic saline enhanced THP polymerization, and caused a “salting out” effect28, or caused passive or active movement of water through aquaporins. A previous study showed that uEVs are remarkably resistant to osmotic stress29, rendering osmotic damage to membrane integrity unlikely. Of interest, both the addition of hypotonic and hypertonic solution increased particle size. We propose that the hypertonic solution increased THP polymerization, leading to larger THP aggregates that may have also captured EVs. Conversely, our electron microscopy data indicate that uEV size truly increases in dilute urine, confirming a previous study.30 The increase in uEV size causes more uEVs to reach the NTA size-detection limit, and provides a second explanation for why NTA detected more particles after water loading. Because previous studies have shown NTA also detects more particles in proteinuric samples31,32, it must be concluded that NTA has important caveats when applied to whole urine samples. A previous study showed this interference persists when analyzing particles in the low centrifugation pellet.27 This is relevant because NTA is recommended as the key method for uEV characterization.33 The novel EVQuant method is therefore an attractive alternative for uEV quantification, because it allows fast analysis of multiple proteins at a single-vesicle level, while labeling only lipid particles and not protein aggregates. When using NTA, an overestimation of uEV number in urine with a creatinine concentration below 3 mmol/L or a urine osmolality below 337 mOsm/kg should be anticipated.
TR-FIA facilitates signal amplification, making it suitable for low-abundant proteins. However, our study also revealed an important caveat when using this approach with the commonly used uEV markers CD9 and CD63. Depending on the antibody used, CD9 and CD63 colocalized only with distal convoluted tubules and collecting duct markers, whereas the predicted expression in rat kidney is more general.34 Indeed, immunoprecipitation isolated uEVs only from these tubular segments. CD9 and CD63 are expressed in multiple isoforms and cell-specific expression patterns of these isoforms may cause selective antibody recognition. Therefore, the choice of the capture antibody in TR-FIA likely determines from which tubular segments EVs will be isolated.
In addition to quantification of uEVs, NTA, EVQuant, and TR-FIA can also be used in combination with antibodies targeting extracellular epitopes on uEVs. Plasma membrane permeabilization is required when using antibodies targeting intracellular epitopes. Previously, we used the detergent SDS in a CD9–TR-FIA assay to permeabilize uEVs and gain access to intracellular epitopes.15 In the current study, 0.01% v/v SDS was demonstrated to increase detection of intracellular epitopes with NTA and EVQuant, although left the number and integrity of uEVs largely intact. This is in line with previous data showing SDS does not decrease the CD9 signal, but does increase the NCC and AQP2 signal with CD9–TR-FIA.15 Interestingly, without detergent, the fluorescence particle count was not at control levels. Oosthuyzen et al. 16 also reported that AQP2+ uEVs could be detected without detergent, despite using an AQP2 antibody against an intracellular epitope. This suggests the presence of vesicles with reverse topology, such as endosomes or an inside-out switch of membrane proteins, as was previously found in EVs in cell culture.35 Reverse topology was also supported by our findings using a new extracellular-epitope AQP2 antibody. SDS enhancement was greater with the intracellular-epitope AQP2 antibody, but still significant with the extracellular-epitope antibody, suggesting some of the extracellular domains are present within uEVs. Interestingly, fluorescence AQP2+ particles were smaller than total uEVs as determined by the scatter mode of NTA. The same was observed by Oosthuyzen et al. 16 and implies that uEVs containing AQP2 are smaller than average. Fluorescence signals are stronger than general light scatter, which explains why smaller uEVs can be detected in fluorescence mode, but not in scatter mode.
In this study we have investigated approaches that can quantify and characterize uEVs in whole urine, replacing the need for ultracentrifugation. These approaches are attractive for higher throughput analyses toward clinical application of uEV analysis. Furthermore, ultracentrifugation has a number of limitations.36 Although we showed the uEV yield was similar in the water-deprived and water-loaded urine samples, differences in density and viscosity may influence the sedimentation rate. Some authors have therefore normalized urine composition using dilution37 or dialysis.38
Our study met all of the currently recommended quality controls for EV research.33 However, several methodology and knowledge gaps remain in the evolving field of uEV research. We believe this study addresses some of these technical challenges, but will require further validation and follow-up by future studies.
In conclusion, uEV concentration is highly correlated with urine creatinine, potentially replacing the need for uEV quantification to normalize spot urines. Additional findings are relevant for future uEV studies in whole urine, including the interference of THP with NTA, excretion of larger uEVs in dilute urine, capture of nephron segment-specific EVs with CD9 and C63, and the ability to use detergent to increase intracellular epitope recognition in uEVs.
Disclosures
C.A. Carvajal and E.R. Barros are supported by the Agencia Nacional de Investigación y Desarrollo - Fondo Nacional de Desarrollo Científico y Tecnológico (ANID-FONDECYT) Grants 1160695, 1212006, and ANID-Millennium Science Initiative Program - IMII P09/016-F, ICN09_016 ICM (Iniciativa Científica Milenio), outside the submitted work. T.A. Hartjes and M.E. van Royen are supported by the Dutch Cancer Society, the Innovative Measurements and Markers for PROstate cancer prognosis using extracellular VEsicles (IMMPROVE) Alpe d'HuZes grant (EMCR2015-8022) and Prostate Cancer UK (grant G2012-36), outside the submitted work. E. Hoorn reports receiving honoraria from UpToDate; being a scientific advisor or member of the editorial boards of JASN, Journal of Nephrology, and Frontiers in Physiology, Member of the Scientific Council of the Dutch Kidney Foundation, and being a board member of Dutch Federation of Nephrology. G. Jenster has a license agreement with Cell GS for the CD9 and CD63 TR-FIA (TRIFic). J. Hoenderop reports being a scientific advisor or editorial board member of European Journal of Physiology. M. Clahsen-van Groningen reports receiving research funding from Astellas Pharma B.V. R. Bindels reports being a scientific advisor or member of Regenerative Medicine Crossing Borders and member of the Scientific Council of the Dutch Kidney Foundation. R.A. Fenton reports being a scientific advisor or member as the associate editor for the American Journal of Physiology - Renal Physiology, and as editorial board member of JASN, PLOS One, andNature Scientific Report; and is supported by the Novo Nordisk Foundation and the Leduq Foundation, outside the submitted work. All remaining authors have nothing to disclose.
Funding
This work was supported by the Dutch Kidney Foundation (16OI04 and CP1805).
Supplementary Material
Acknowledgments
We thank the participants in this study.
Footnotes
Published online ahead of print. Publication date available at www.jasn.org.
See related editorial, “Urinary Vesicles: Are They Ready for Real-World Use?,” on pages 1013–1015.
Supplemental Material
This article contains the following supplemental material online at http://jasn.asnjournals.org/lookup/suppl/doi:10.1681/ASN.2020081142/-/DCSupplemental.
Supplemental Table 1. Characteristics of healthy subjects.
Supplemental Table 2. Characteristics of patients.
Supplemental Table 3. Antibodies.
Supplemental Table 4. Differential ultracentrifugation steps.
Supplemental Table 5. Overview of statistical analyses.
Supplemental Table 6. Additional characteristics and urine biochemistries of the water loading experiment.
Supplemental Figure 1. Schematic overview of water loading test.
Supplemental Figure 2. Particle yield of differential ultracentrifugation.
Supplemental Figure 3. Effect of centrifugation on particle size.
Supplemental Figure 4. Correlation CD9+ particles with urine creatinine.
Supplemental Figure 5. Urine characteristics and particle concentrations after water loading or time-control.
Supplemental Figure 6. Particle size distribution per time point in the water loading study.
Supplemental Figure 7. Representative raw image data of NTA, EVQuant, and CD9–TR-FIA.
Supplemental Figure 8. Additional immunoblots of CD9 and CD63 precipitations.
Supplemental Figure 9. Co-localization studies for a second CD9 and CD63 antibody, and for CD81.
Supplemental Figure 10. Additional NTA data.
Supplemental Figure 11. Characteristics of the extracellular-epitope AQP2 antibody.
Supplemental Videos 1 and 2. Representative NTA videos before and after the addition of THP.
References
- 1. Salih M, Zietse R, Hoorn EJ: Urinary extracellular vesicles and the kidney: Biomarkers and beyond. Am J Physiol Renal Physiol 306: F1251–F1259, 2014. [DOI] [PubMed] [Google Scholar]
- 2. Pisitkun T, Shen RF, Knepper MA: Identification and proteomic profiling of exosomes in human urine. Proc Natl Acad Sci U S A 101: 13368–13373, 2004. [DOI] [PMC free article] [PubMed] [Google Scholar]
- 3. Zhou H, Pisitkun T, Aponte A, Yuen PS, Hoffert JD, Yasuda H, et al.: Exosomal fetuin-A identified by proteomics: A novel urinary biomarker for detecting acute kidney injury. Kidney Int 70: 1847–1857, 2006. [DOI] [PMC free article] [PubMed] [Google Scholar]
- 4. Panich T, Chancharoenthana W, Somparn P, Issara-Amphorn J, Hirankarn N, Leelahavanichkul A: Urinary exosomal activating transcriptional factor 3 as the early diagnostic biomarker for sepsis-induced acute kidney injury. BMC Nephrol 18: 10, 2017. [DOI] [PMC free article] [PubMed] [Google Scholar]
- 5. Salih M, Demmers JA, Bezstarosti K, Leonhard WN, Losekoot M, van Kooten C, et al.; DIPAK Consortium: Proteomics of urinary vesicles links plakins and complement to polycystic kidney disease. J Am Soc Nephrol 27: 3079–3092, 2016. [DOI] [PMC free article] [PubMed] [Google Scholar]
- 6. Hogan MC, Bakeberg JL, Gainullin VG, Irazabal MV, Harmon AJ, Lieske JC, et al.: Identification of biomarkers for PKD1 using urinary exosomes. J Am Soc Nephrol 26: 1661–1670, 2015. [DOI] [PMC free article] [PubMed] [Google Scholar]
- 7. Morikawa Y, Takahashi N, Kamiyama K, Nishimori K, Nishikawa Y, Morita S, et al.: Elevated levels of urinary extracellular vesicle fibroblast-specific protein 1 in patients with active crescentic glomerulonephritis. Nephron 141: 177–187, 2019. [DOI] [PubMed] [Google Scholar]
- 8. Corbetta S, Raimondo F, Tedesratio S, Syrèn ML, Rebora P, Savoia A, et al.: Urinary exosomes in the diagnosis of Gitelman and Bartter syndromes. Nephrol Dial Transplant 30: 621–630, 2015. [DOI] [PubMed] [Google Scholar]
- 9. Merchant ML, Rood IM, Deegens JKJ, Klein JB: Isolation and characterization of urinary extracellular vesicles: Implications for biomarker discovery. Nat Rev Nephrol 13: 731–749, 2017. [DOI] [PMC free article] [PubMed] [Google Scholar]
- 10. Fernández-Llama P, Khositseth S, Gonzales PA, Star RA, Pisitkun T, Knepper MA: Tamm-Horsfall protein and urinary exosome isolation. Kidney Int 77: 736–742, 2010. [DOI] [PMC free article] [PubMed] [Google Scholar]
- 11. Ginsberg JM, Chang BS, Matarese RA, Garella S: Use of single voided urine samples to estimate quantitative proteinuria. N Engl J Med 309: 1543–1546, 1983. [DOI] [PubMed] [Google Scholar]
- 12. Damkjaer M, Jensen PH, Schwämmle V, Sprenger RR, Jacobsen IA, Jensen ON, et al.: Selective renal vasoconstriction, exaggerated natriuresis and excretion rates of exosomic proteins in essential hypertension. Acta Physiol (Oxf) 212: 106–118, 2014. [DOI] [PubMed] [Google Scholar]
- 13. Esteva-Font C, Wang X, Ars E, Guillén-Gómez E, Sans L, González Saavedra I, et al.: Are sodium transporters in urinary exosomes reliable markers of tubular sodium reabsorption in hypertensive patients? Nephron, Physiol 114: 25–34, 2010. [DOI] [PMC free article] [PubMed] [Google Scholar]
- 14. Hinrichs GR, Hansen LH, Nielsen MR, Fagerberg C, Dieperink H, Rittig S, et al.: A novel mutation affecting the arginine-137 residue of AVPR2 in dizygous twins leads to nephrogenic diabetes insipidus and attenuated urine exosome aquaporin-2. Physiol Rep 4: e12764, 2016. [DOI] [PMC free article] [PubMed] [Google Scholar]
- 15. Salih M, Fenton RA, Knipscheer J, Janssen JW, Vredenbregt-van den Berg MS, Jenster G, et al.: An immunoassay for urinary extracellular vesicles. Am J Physiol Renal Physiol 310: F796–F801, 2016. [DOI] [PubMed] [Google Scholar]
- 16. Oosthuyzen W, Sime NE, Ivy JR, Turtle EJ, Street JM, Pound J, et al.: Quantification of human urinary exosomes by nanoparticle tracking analysis. J Physiol 591: 5833–5842, 2013. [DOI] [PMC free article] [PubMed] [Google Scholar]
- 17. Coumans FA, van der Pol E, Böing AN, Hajji N, Sturk G, van Leeuwen TG, et al.: Reproducible extracellular vesicle size and concentration determination with tunable resistive pulse sensing. J Extracell Vesicles 3: 25922, 2014. [DOI] [PMC free article] [PubMed] [Google Scholar]
- 18. Svenningsen P, Sabaratnam R, Jensen BL: Urinary extracellular vesicles: Origin, role as intercellular messengers and biomarkers; efficient sorting and potential treatment options. Acta Physiol (Oxf) 228: e13346, 2020. [DOI] [PubMed] [Google Scholar]
- 19. Duijvesz D, Versluis CY, van der Fels CA, Vredenbregt-van den Berg MS, Leivo J, Peltola MT, et al.: Immuno-based detection of extracellular vesicles in urine as diagnostic marker for prostate cancer. Int J Cancer 137: 2869–2878, 2015. [DOI] [PubMed] [Google Scholar]
- 20. Erdbrügger U, Le TH: Extracellular vesicles in renal diseases: More than novel biomarkers? J Am Soc Nephrol 27: 12–26, 2016. [DOI] [PMC free article] [PubMed] [Google Scholar]
- 21. Welsh JA, Van Der Pol E, Arkesteijn GJA, Bremer M, Brisson A, Coumans F, et al.: MIFlowCyt-EV: A framework for standardized reporting of extracellular vesicle flow cytometry experiments. J Extracell Vesicles 9: 1713526, 2020. [DOI] [PMC free article] [PubMed] [Google Scholar]
- 22. Olden M, Corre T, Hayward C, Toniolo D, Ulivi S, Gasparini P, et al.: Common variants in UMOD associate with urinary uromodulin levels: A meta-analysis. J Am Soc Nephrol 25: 1869–1882, 2014. [DOI] [PMC free article] [PubMed] [Google Scholar]
- 23. Musante L, Tataruch-Weinert D, Kerjaschki D, Henry M, Meleady P, Holthofer H: Residual urinary extracellular vesicles in ultracentrifugation supernatants after hydrostatic filtration dialysis enrichment. J Extracell Vesicles 6: 1267896, 2016. [DOI] [PMC free article] [PubMed] [Google Scholar]
- 24. Tutakhel OA, Jeleń S, Valdez-Flores M, Dimke H, Piersma SR, Jimenez CR, et al.: Alternative splice variant of the thiazide-sensitive NaCl cotransporter: A novel player in renal salt handling. Am J Physiol Renal Physiol 310: F204–F216, 2016. [DOI] [PubMed] [Google Scholar]
- 25. van der Lubbe N, Jansen PM, Salih M, Fenton RA, van den Meiracker AH, Danser AH, et al.: The phosphorylated sodium chloride cotransporter in urinary exosomes is superior to prostasin as a marker for aldosteronism. Hypertension 60: 741–748, 2012. [DOI] [PubMed] [Google Scholar]
- 26. Khamis MM, Holt T, Awad H, El-Aneed A, Adamko DJ: Comparative analysis of creatinine and osmolality as urine normalization strategies in targeted metabolomics for the differential diagnosis of asthma and COPD. Metabolomics 14: 115, 2018. [DOI] [PubMed] [Google Scholar]
- 27. Musante L, Bontha SV, La Salvia S, Fernandez-Piñeros A, Lannigan J, Le TH, et al.: Rigorous characterization of urinary extracellular vesicles (uEVs) in the low centrifugation pellet - a neglected source for uEVs. Sci Rep 10: 3701, 2020. [DOI] [PMC free article] [PubMed] [Google Scholar]
- 28. Maurer SE, Nguyen G: Prebiotic vesicle formation and the necessity of salts. Orig Life Evol Biosph 46: 215–222, 2016. [DOI] [PubMed] [Google Scholar]
- 29. Mitchell PJ, Welton J, Staffurth J, Court J, Mason MD, Tabi Z, et al.: Can urinary exosomes act as treatment response markers in prostate cancer? J Transl Med 7: 4, 2009. [DOI] [PMC free article] [PubMed] [Google Scholar]
- 30. Miyazawa Y, Mikami S, Yamamoto K, Sakai M, Saito T, Yamamoto T, et al.: AQP2 in human urine is predominantly localized to exosomes with preserved water channel activities. Clin Exp Nephrol 22: 782–788, 2018. [DOI] [PubMed] [Google Scholar]
- 31. McNicholas K, Li JY, Michael MZ, Gleadle JM: Albuminuria is not associated with elevated urinary vesicle concentration but can confound nanoparticle tracking analysis. Nephrology (Carlton) 22: 854–863, 2017. [DOI] [PubMed] [Google Scholar]
- 32. Gleadle J, McNicholas K, Li J, Michael M, Rojas-Canales D: Nanoparticle tracking analysis of urine to detect exosomes can be confounded by albuminuria. J Am Soc Nephrol 29: 1784, 2018. [DOI] [PMC free article] [PubMed] [Google Scholar]
- 33. Théry C, Witwer KW, Aikawa E, Alcaraz MJ, Anderson JD, Andriantsitohaina R, et al.: Minimal information for studies of extracellular vesicles 2018 (MISEV2018): A position statement of the International Society for Extracellular Vesicles and update of the MISEV2014 guidelines. J Extracell Vesicles 7: 1535750, 2018. [DOI] [PMC free article] [PubMed] [Google Scholar]
- 34. Limbutara K, Chou CL, Knepper MA: Quantitative proteomics of all 14 renal tubule segments in rat. J Am Soc Nephrol 31: 1255–1266, 2020. [DOI] [PMC free article] [PubMed] [Google Scholar]
- 35. Cvjetkovic A, Jang SC, Konečná B, Höög JL, Sihlbom C, Lässer C, et al.: Detailed analysis of protein topology of extracellular vesicles-evidence of unconventional membrane protein orientation. Sci Rep 6: 36338, 2016. [DOI] [PMC free article] [PubMed] [Google Scholar]
- 36. Dhondt B, Geeurickx E, Tulkens J, Van Deun J, Vergauwen G, Lippens L, et al.: Unravelling the proteomic landscape of extracellular vesicles in prostate cancer by density-based fractionation of urine. J Extracell Vesicles 9: 1736935, 2020. [DOI] [PMC free article] [PubMed] [Google Scholar]
- 37. Puhka M, Nordberg ME, Valkonen S, Rannikko A, Kallioniemi O, Siljander P, et al.: KeepEX, a simple dilution protocol for improving extracellular vesicle yields from urine. Eur J Pharm Sci 98: 30–39, 2017. [DOI] [PubMed] [Google Scholar]
- 38. Barreiro K, Huber TB, Holthofer H: Isolating urinary extracellular vesicles as biomarkers for diabetic disease. Methods Mol Biol 2067: 175–188, 2020. [DOI] [PubMed] [Google Scholar]
Associated Data
This section collects any data citations, data availability statements, or supplementary materials included in this article.


