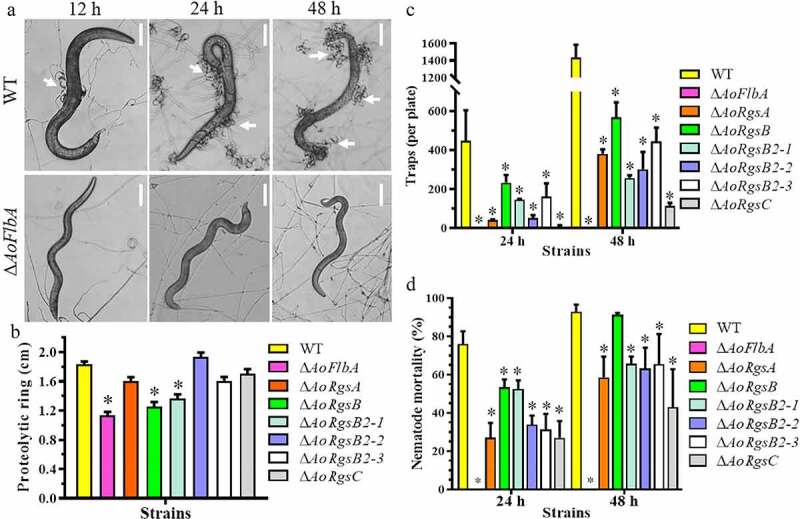
Figure 5.

Comparison of trap formation, nematocidal activity, and proteolytic activity between the WT and ΔAoRgs mutants. A. Nematode-induced trap formation in the WT and ΔAoRgs mutants. The WT and ΔAoFlbA mutant were used as examples. Bar = 10 μm. White arrows indicate the traps. B. Comparison of extracellular proteolytic activity between the WT and ΔAoRgs mutants. The transparent zone produced due to the degradation of protein substrate in the plate. C. The number of traps produced by the WT and ΔAoRgs mutants induced by nematodes at 24 h and 48 h. D. The percentage of nematodes captured by the WT and ΔAoRgs mutants at 24 h and 48 h. Error bars: standard deviation, asterisks: significant differences between the ΔAoRgs mutants and the WT strain (Tukey’s HSD, P < 0.05)
