

Abstract
Gene expression profiles during sex determination and gonadal differentiation were investigated to identify new potential regulatory factors. Embryonic day 13 (E13), E14, and E16 rat testes and ovaries were used for microarray analysis, as well as E13 testis organ cultures that undergo testis morphogenesis and develop seminiferous cords in vitro. A list of 109 genes resulted from a selective analysis for genes present in male gonadal development and with a 1.5-fold change in expression between E13 and E16. Characterization of these 109 genes potentially important for testis development revealed that cytoskeletal-associated proteins, extracellular matrix factors, and signaling factors were highly represented. Throughout the developmental period (E13–E16), sex-enriched transcripts were more prevalent in the male with 34 of the 109 genes having testis-enriched expression during sex determination. In ovaries, the total number of transcripts with a 1.5-fold change in expression between E13 and E16 was similar to the testis, but none of those genes were both ovary enriched and regulated during the developmental period. Genes conserved in sex determination were identified by comparing changing transcripts in the rat analysis herein, to transcripts altered in previously published mouse studies of gonadal sex determination. A comparison of changing mouse and rat transcripts identified 43 genes with species conservation in sex determination and testis development. Profiles of gene expression during E13–E16 rat testis and ovary development are presented and candidate genes for involvement in sex determination and testis differentiation are identified. Analysis of cellular pathways did not reveal any specific pathways involving multiple candidate genes. However, the genes and gene network identified influence numerous cellular processes with cellular differentiation, proliferation, focal contact, RNA localization, and development being predominant.
Introduction
Prior to gonadal sex determination, primordial germ cells migrate from extra-embryonic sites in the yolk sac through the mesentery of the gut and the mesonephros to colonize the genital ridge at embryonic day 10 (E10)–E11 in the rat (Jost et al. 1981, Ginsburg et al. 1990). A bipotential gonad is formed at E12 in the rat and has the potential to develop into either a testis or an ovary (Jost et al. 1981). Sex determination begins at E12.5 in the rat when the sex determining region of the Y chromosome (Sry) gene is expressed in the Sertoli cells of males. Sry is a mammalian sex determining factor leading to male development (Koopman et al. 1990). In the male, Sertoli cells arise from proliferating supportive precursor cells between E12.5 and E13 in the rat and coincides with the onset of Sry expression. Sertoli cell precursors form aggregates with the primordial germ cells (Magre et al. 1980, Karl et al. 1998). Mesenchymal peritubular myoid precursor cells migrate from the mesonephros into the gonad in a male specific manner and surround Sertoli-germ cell aggregates to promote formation of seminiferous cords around E14 in the rat (Magre et al. 1980, Jost et al. 1981, Buehr et al. 1993, Martineau et al. 1997, Levine et al. 2000, Schmahl et al. 2000, Cupp et al. 2003). Once peritubular myoid cells and Sertoli cells are in contact, an extracellular matrix is secreted and separates the testis cords from the interstitial tissue (Tung et al. 1984, Kanai et al. 1992). This cord formation is the first morphological event in sex determination and is imperative for proper testis development.
Vasculature development and coelomic vessel formation is also characteristic in testis development (Yao et al. 2006). During this embryonic period Leydig cells, which are later responsible for testosterone production, arise from the mesenchymal interstitial cells (Merchant-Larios & Moreno-Mendoza 1998, Capel 2000, Nishino et al. 2001). After seminiferous cord formation, there is sex-specific growth in the male gonad that includes proliferation of Sertoli, germ, peritubular, and interstitial cells (Mittwoch et al. 1969, Chubb 1992, Levine et al. 2000).
A number of genes have previously been shown to be critical for sex determination and testis development (Morrish & Sinclair 2002, Yao et al. 2002, Jameson et al. 2003). Sry was determined to be an essential factor for sex determination in the early 1990s (Berta et al. 1990, Koopman et al. 1990, Sinclair et al. 1990), however, it is presently unknown how Sry directs sexual differentiation. Sox9, a high mobility group (HMG) domain transcription factor closely related to Sry, causes sex reversal when over-expressed in the female or when inactivated in the male (Jost et al. 1981, Ginsburg et al. 1990, Wagner et al. 1994, Vidal et al. 2001). Doublesex and mab3 related in testis 1 (Dmrt1) is turned off in the developing ovary and is expressed in the developing testis of a number of species. Male Dmrt1 mutants are sex reversed or infertile, while females appear normal (Raymond et al. 1999, 2000). The dosage-sensitive sex reversal – adrenal hypoplasia congenita gene on the X chromosome gene 1 (Dax1) is an orphan nuclear receptor thought to be an SRY antagonist since Dax1 over-expression masks the effects of Sry in sex reversal (Swain et al. 1998). Dax1 is expressed prior to sex determination in the bipotential gonad, then is repressed in the male during sexual differentiation, while persisting in the ovary (Swain et al. 1996). Anti-Müllerian hormone (AMH) is a secreted factor produced by Sertoli cells responsible for the regression of the Müllerian ducts in the mesonephros leaving the Wolffian ducts to develop a subsequent male reproductive tract (Munsterberg & Lovell-Badge 1991, De Santa Barbara et al. 1998). SOX9, in conjunction with steroidogenic factor 1, is thought to regulate the Amh/Müllerian inhibiting substance expression (De Santa Barbara et al. 1998, Jamin et al. 2002). Fibroblast growth factor 9 (Fgf9) is expressed in male gonads early in testis development and Fgf9 null mutants show some sex reversal (Colvin et al. 2001). In addition, the neurotropic growth factor NT3 has been shown to be important for testis cord formation (Levine et al. 2000, Cupp et al. 2003). NT3 is a Sertoli cell product that acts as a chemotactic agent (Cupp et al. 2003) to promote cell migration of peritubular cell precursors from the mesonephros by binding its receptor TRKC (Levine et al. 2000, Cupp et al. 2002, Cupp et al. 2003). The insulin family of receptors is also involved in testis development. Male XY mice with all three insulin receptors knocked out are sex reversed (Nef et al. 2003). Although several growth factors and transcription factors have been shown to be involved in sex determination and testis cord formation, the present study uses a genomic approach to identify novel factors and signal transduction events. Further identification of factors involved in gonadal development will help elucidate the genomic control of sex determination and differentiation.
Sexual differentiation is required to produce the dimorphic sexes, essential for mammalian reproduction. A delay in sexual differentiation and testis cord formation can lead to sex reversal, infertility, or gonadal dysgenesis. A better understanding of embryonic testis development will help determine how these abnormalities arise. Numerous factors are anticipated to be involved in the key events of embryonic testis development including cellular proliferation, cell migration, cell associations, extracellular matrix remodeling, and vascularization that leads to testis morphogenesis. The present study was designed to identify new candidate genes involved in sex determination and testis development using a genomic approach involving a microarray analysis of gene expression during embryonic gonadal differentiation. The gene expression in E13, E14, and E16 male and female gonads were compared in order to identify sex differences during this developmental period. In addition, rat E13 testis organ cultures, which develop seminiferous cords in vitro, were used and compared with in vivo testis development (Martineau et al. 1997, Cupp et al. 2000, 2003, Levine et al. 2000, Uzumcu et al. 2002). Comparative microarray analysis was also used to narrow the candidate list of potential regulatory factors for testis development. The rat microarray data obtained herein were compared with data produced for gonadal differentiation in mouse (Nef et al. 2005, Small et al. 2005, Beverdam & Koopman 2006). Gene lists resulting from these comparative microarray analyses will assist in identifying potential candidate genes in gonadal sex determination.
Materials and Methods
Animals
Sprague–Dawley rats were kept in a temperature controlled environment and given food and water ad libitum. Estrous cycles of female rats were monitored by cellular morphology from vaginal smears (Uzumcu et al. 2002). Rats in early estrus were bred overnight and matings confirmed by sperm positive smears, denoted day 0 of pregnancy. Animals were euthanized at E13, E14, and E16 of pregnancy, and gonads were collected for RNA isolation and histology. Sex was determined by PCR using primers specific for Sry on genomic DNA isolated from embryo tails as previously described (Levine et al. 2000). All procedures were approved by the Washington State University Animal Care and Use Committee.
Organ cultures
Rat gonads from E13 embryos were dissected with mesonephros intact and cultured 3 days as previously described (Cupp et al. 2000). Briefly, gonads were placed in drops of medium on Millicell CM filters (Millipore, Bedford, MA, USA) floating on 0.4 ml of CMRL 1066 medium (Gibco BRL) supplemented with penicillin–streptomycin, insulin (10 μg/ml), l-glutamine (350 μM), transferrin (10 μg/ml), and BSA (0.01%). Media were changed on the second day of culture. Gonads were maintained in culture for 3 days at which time testis cords formed and testes were used for histological analysis or separated from mesonephros and used for RNA collection. Embryonic cultures undergo similar testis morphogenesis after 3 days of culture as that seen in vivo (Levine et al. 2000, Cupp et al. 2003). Analysis of E13 testis viability in culture demonstrated no abnormal histology, with similar morphology as observed in vivo (Levine et al. 2000, Cupp et al. 2003).
Histology
Tissue specimens were fixed in Bouin’s solution for 1 h and embedded in paraffin using standard procedures. Serial sections of 5 μm were stained with hematoxylin and eosin (H&E) using standard procedures by the Histology Core Laboratory of the Center for Reproductive Biology, Washington State University. Sections were visualized by light microscopy.
RNA preparation
Gonads without mesonephros were collected from female and male Sprague–Dawley rat E13, E14, and E16 embryos. Stage of development was confirmed by counting tail somites of each embryo. Gonad samples were stored in TRIZOL at −20 °C (Invitrogen) until extraction following the manufacturer’s protocol. Two separate gonadal sample sets were collected for each E13, E14, and E16 testis and ovary, and E13 cultured testis for replicate analysis. Generally 20–30 gonads were combined for an individual sample. Each separate RNA sample was used for a single microarray chip, such that two separate experiments involving two separate sets of animals and RNA isolations were performed.
Microarray analysis
High quality RNA samples were assessed with gel electrophoresis and required a minimum OD260/280 ratio of 1.8. At least 5 μg RNA per sample was delivered to the Center for Reproductive Biology, Genomics Core Laboratory, Washington State University for processing as previously described (McLean et al. 2002, Small et al. 2005). RNA was transcribed into cDNA, and cDNA transcribed into biotin-labeled RNA. Biotin-labeled RNA was then hybridized to the rat RAE230A arrays containing ~16 000 transcripts (Affymetrix, Santa Clara, CA, USA) and labeled with phycoerythrin-coupled avidin. Hybridized chips were visualized on an Affymetrix Scanner 3000 (Affymetrix). Once raw data were obtained, they were processed using GeneChip Operating Software (GCOS) version 1.1 (Affymetrix) and analyzed by Genespring version 7.2 (Silicon Genetics, Redwood City, CA, USA), and Pathway Assist software (Stratagene, La Jolla, CA, USA).
Bioinformatics and statistical analysis
Initial analysis of microarray data was completed as previously described (Small et al. 2005). Microarray hybridization data were examined for physical anomalies on the chip and background noise above a value of 3. Default GCOS statistical values were used for the analysis. All probe sets were scaled to a mean of 125, where signal correlates to the amount of transcript in the sample. An absolute analysis was performed with GCOS to assess the relative abundance of the transcripts on the RAE230A chip based on signal and detection calls (present, absent, or marginal). This information was imported into GeneSpring 7.2 (Silicon Genetics) and normalized using the recommended default normalization methods. This includes setting signal values below 0.01, total chip normalization to the 50th percentile, and normalization of each gene to the median, which allows visualization of data based on relative abundance for a given sample, rather than by comparison with a specific control value (Small et al. 2005). The reproducibility between replicate chips was determined and an R2>0.95 was judged sufficient to allow two chips to be used per data point, with a P<0.05 confidence. The criteria to consider chip number has been previously described (Chen et al. 2004).
Gene expression during sexual differentiation was determined using data restriction and analytical tools within the GeneSpring software. Transcripts with raw signal values above 75 were selected. Previously a raw signal of 50 has been determined to be near background for an absent/present call for expression of most genes. Therefore, a signal of 75 was selected to minimize the inclusion of false positive calls in the analysis. In contrast, a signal of >100 does not include low expressing genes and excludes positive signals. Therefore, a signal of 75 was selected as the optimal cut-off. Transcripts with an average fold change of 1.5 or greater in signal intensity between the developmental stages were also selected. Transcripts expressed differentially in a statistically significant manner were determined using a one-way ANOVA parametric test with variances not assumed equal and P<0.05. Statistics were applied to all time points for both testis and ovary samples to determine when statistically relevant changes occurred. Two replicates for each sample were prepared and this allowed a 2×2 factorial comparison in the experiment. Unsupervised cluster analysis within the set of transcripts expressed above a signal of 75 allowed for organization of samples by relatedness based on similarity of the expression profiles between different genes and samples (Eisen et al. 1998). Gene expression data from mouse embryonic gonads at the time of sex determination produced by Small et al. (2005) were obtained from the gene expression omnibus available through NCBI. This data came from E11.5, E12.5, E14.5, and E16.5 mouse embryonic gonadal RNA hybridized to MGU74v2 arrays (Small et al. 2005). The raw data were analyzed by GCOS and GeneSpring 7.2 in the same manner as the rat chips above. The finalized mouse list comprised transcripts with a signal above 75, and statistically significant change in expression of 1.5-fold or more. A comparison of mouse genes present with those in the analogous rat list was made.
The rat genome 9999 program included in the GeneSpring software was used to search available promoters in finalized gene lists up to 2500 bases (Chaudhary et al. 2005) for the putative SRY binding element (A/T)AACAA(A/T) which would be expected to appear at a frequency of 4096 bps at random. Pathway Assist software (Stratagene) was used to further analyze lists of genes produced in GeneSpring as described previously (Asirvatham et al. 2006). The software excludes redundant and non-annotated genes. The final list is then used to produce shortest pathways for identification of cell processes affected and connections between genes of interest. Each connection was then verified using the PubMed/Medline hyperlink given for each node.
Results
The Affymetrix RAE230A chip represents ~16 000 transcripts of the rat genome and allows for a large portion of the rat transcriptome to be evaluated. In the present study, male and female developmental periods E13, E14, and E16 were evaluated to examine gonadal development during sex determination and gonadal differentiation. E13 testes cultured for 3 days form testis cords and were then used to elucidate transcripts consistently involved in testis development and cord formation in vivo and in vitro. Histological analysis of the testis from E13, E14, E16, and cultured E13 testis verified the progress of testis cord formation at each stage of development (Fig. 1). No cords were observed at E13 in the male or in the female samples. No significant morphology was observed in the ovary except for the development of oocyte nests at E16 (Fig. 1C). Testis cords with aggregated germ cells and Sertoli cells were seen in both E14 and E16 testis and in cultured E13 testis (Fig. 1E–G).
Figure 1.
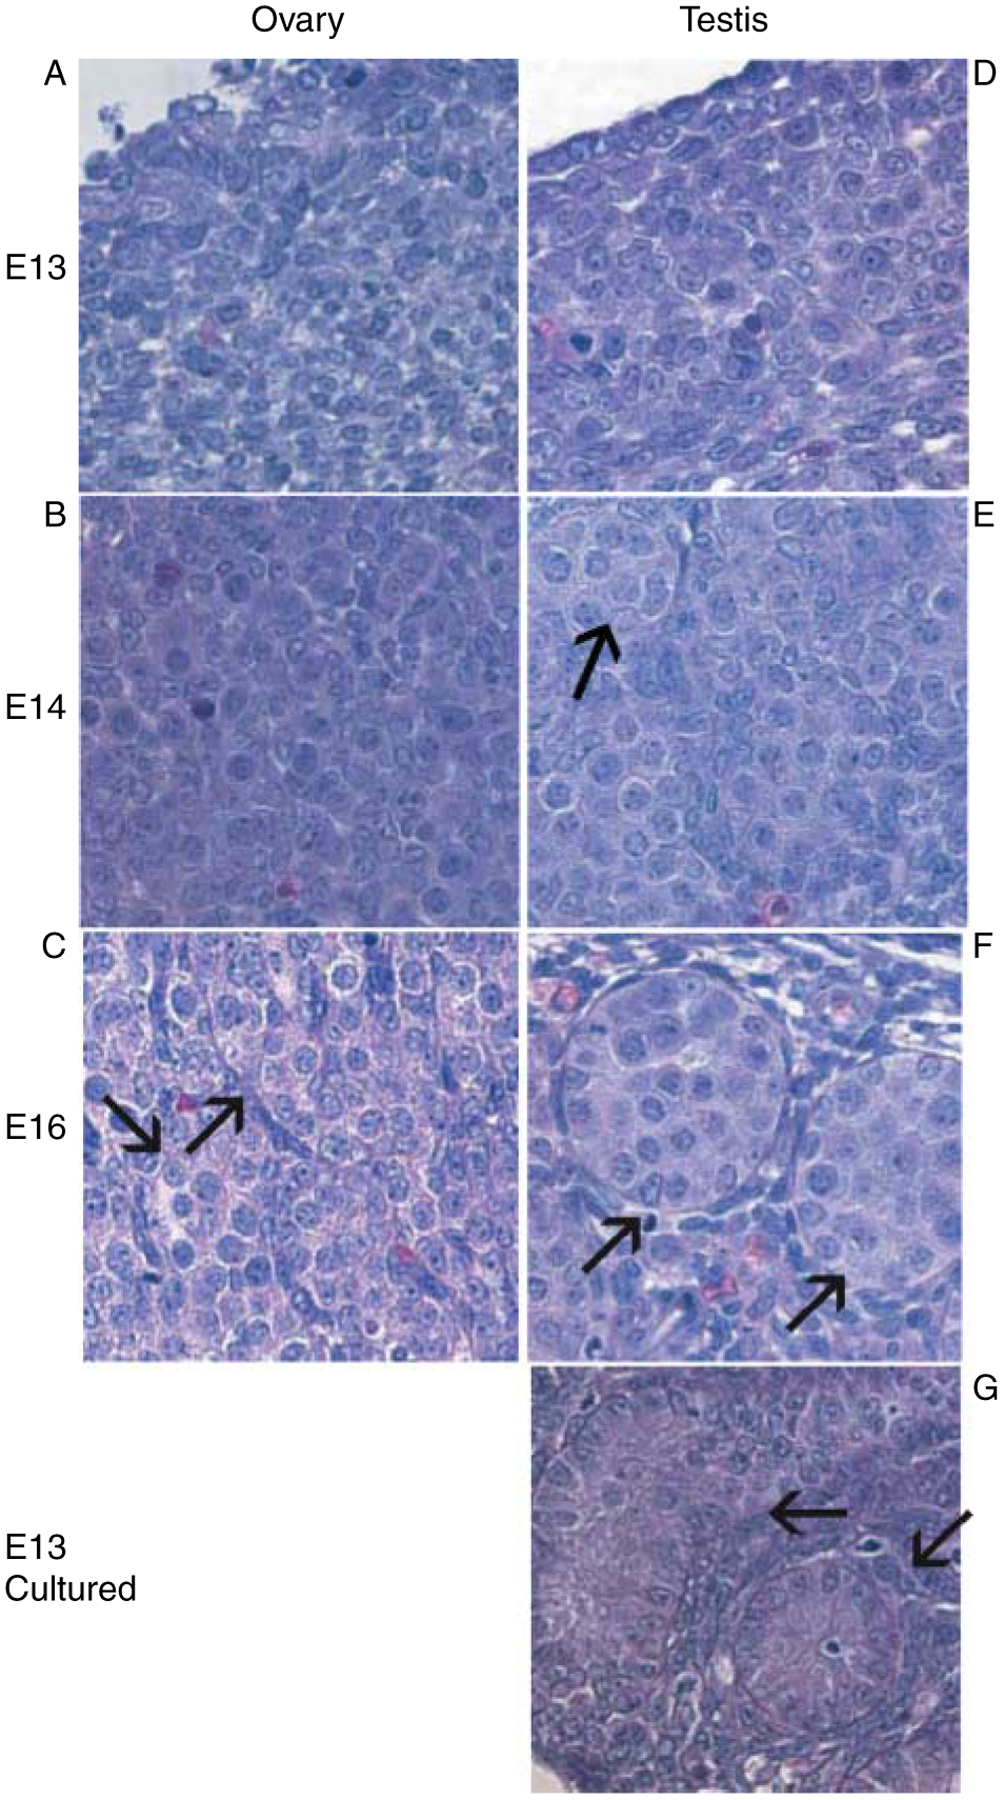
Histology of embryonic rat testis and ovary. Tissue sections from E13 (A), E14 (B), and E16 (C) ovary were analyzed. Tissue sections from E13 (D), E14 (E), and E16 (F) testis, as well as from E13 testis cultured for 3 days (G) were fixed and stained for morphological analysis. Serial sections were stained. Black arrows indicate testis cords in testes or oocyte nests in ovaries.
The transcripts expressed in the E13, E14, and E16 testis and ovary samples and the relationships of the transcriptomes were investigated. A comparison of the duplicate chips for each developmental time point had an R2>0.96 demonstrating that the animal, sample, and microarray chip variability was negligible suggesting two chips are adequate. Expression profiles obtained for each sample were analyzed by determining the number of genes present above a raw signal value of 75 in at least one time point of the male or female developmental periods (i.e. E13, E14, or E16). A dendrogram and hierarchical clustering analysis of E13, E14, and E16 samples using genes with a signal above 75 separately in male and female gonadal development are shown for male and female sample sets (Fig. 2). The cluster analysis using GeneSpring software (i.e. link relationships shown on the left side of each dendrogram set) revealed that expression was similar between the E13 and E14 testis (Fig. 2A). The E13 and E14 ovary were also similar (Fig. 2B). The E13 testis and E13 ovary were also found to be similar (data not shown). E16 ovary clustered distally to E13 and E14 ovary transcriptomes. E16 testis also clustered distally to E13 and E14 testis transcriptomes. This suggests that the later E16 time points are more divergent. A second set of dendrograms were produced for male and female transcriptomes using genes present above 75 with a minimum of a 1.5-fold significant change in the developmental period studied. This analysis was done separately for male (Fig. 2C) and female (Fig. 2D) gonadal development. The E13 cultured testis was included in analysis of the male samples. Although the E13 culture testis and E16 testis transcriptomes appear similar (Fig. 2C), the E13 cultured testis clustered distally to the freshly isolated E13, E14, and E16 testis samples (Fig. 2C). A comparative analysis of transcripts expressed in the E13 cultured testis that have formed testis cords to those expressed in vivo at E16 in the testis was performed. Regulated genes with similar expression changes in vivo and in vitro are more likely to be important candidates in testis development and cord formation, while those not similar may not be essential for these processes. Subtracting those transcripts not consistently regulated in vivo and in vitro allowed the candidate regulatory gene list for involvement in testis cord formation and development to be reduced. The pattern of expression changes was identified by selecting genes that changed over the entire developmental period (E13, E14, and E16). Genes increasing in expression are represented by a color change from blue to red, and genes decreasing in expression are represented by a color change from red to blue. Examples of genes with both increasing and decreasing expression are prevalent in the differentiating testis (Fig. 2C) and ovary (Fig. 2D).
Figure 2.
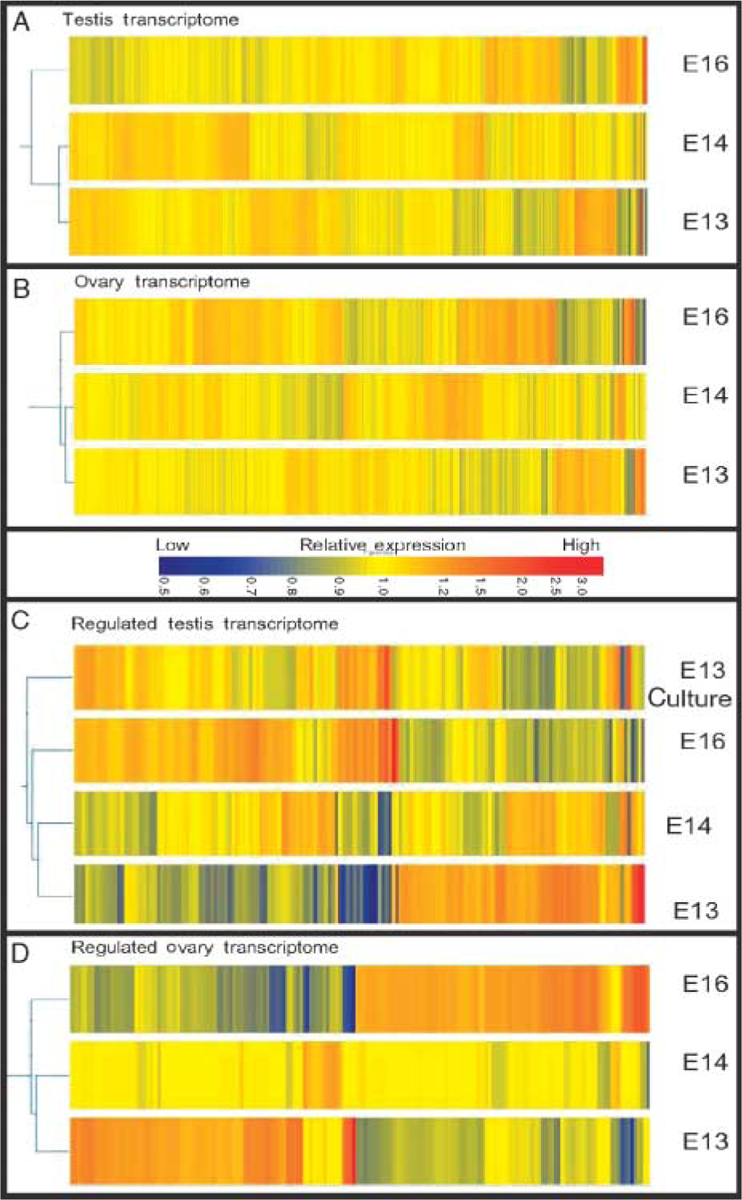
Dendrogram analysis of microarray data reveals the relative relatedness of gonadal transcriptomes. Dendrograms were produced in GeneSpring 7.2 using an unsupervised cluster analysis. Genes are clustered by pattern of expression. Sample sets or time points are clustered by relatedness of gene expression patterns as indicated by the left margin connective illustrations (i.e. links). (A) Dendrogram of male E13, E14, and E16 testis gene expression above a signal value of 75. (B) Dendrogram of female ovary gene expression above a signal of 75 at E13, E14, and E16. (C) Male gonadal genes for E13, E14, E16, and E13 cultured testis expressed above a signal of 75 and with a 1.5-fold significant change during the developmental period. (D) Female gonadal genes for E13, E14, and E16 expressed above a signal of 75 and with a 1.5-fold significant change.
The number of genes expressed above a raw signal of 75 was determined individually for male and female E13, E14, and E16 samples. Genes expressed at each time point were organized in a Venn diagram (Fig. 3). From the 16 000 genes on the chip, 7740 transcripts were expressed in the male gonad in at least one time point. There were 6560 genes with a signal above 75 in all the three (E13, E14, and E16) testis samples. The remaining 1180 genes were expressed in only one or two of the time points analyzed (Fig. 3A). In the female gonad, 7489 transcripts had a raw signal over 75 in at least one time point. Expression similar to the male was seen with 6472 genes above a signal of 75 in all the three E13, E14, and E16 ovary samples. The remaining 1017 ovary transcripts had a signal above 75 in only one or two time points (Fig. 3B). The similar numbers of expressed genes in the male and female developmental periods suggest that the male and female transcriptional controls of gonad development are equally active.
Figure 3.
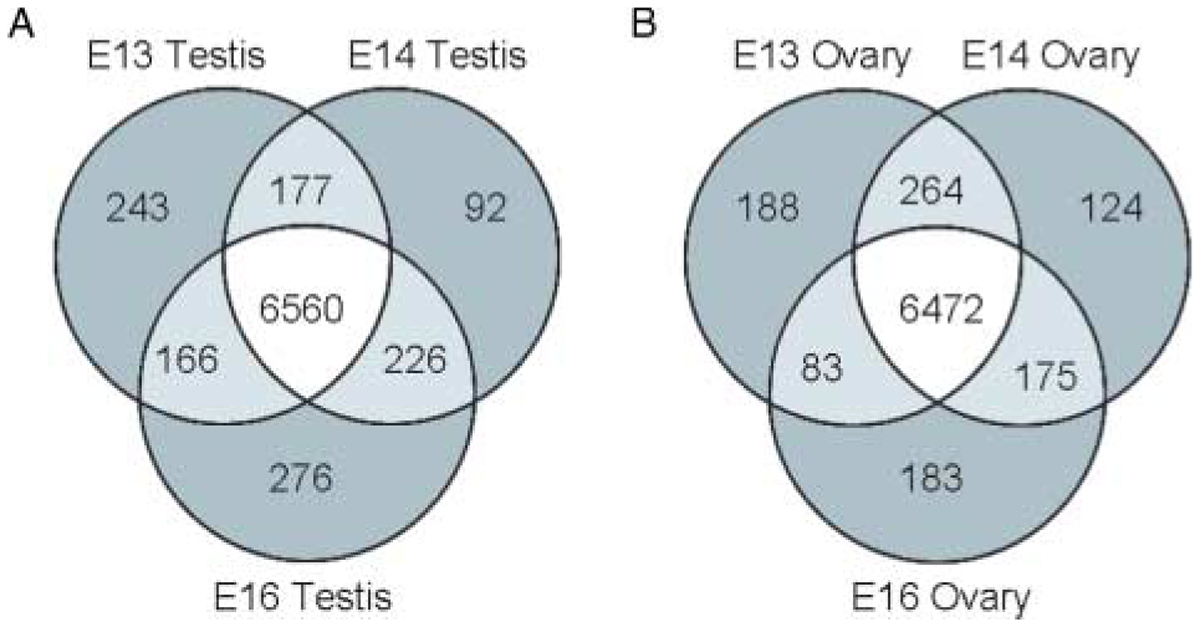
Expressed gene numbers in male and female gonadal development during sexual differentiation. Venn diagrams comparing numbers of genes expressed above a raw signal of 75 were produced in Genespring 7.2. Genes expressed over 75 in E13, E14, and E16 in the rat testis (A) and ovary (B) are compared.
Genes known to be involved in sex determination and gonadal development; (Sry, Dax1, Wnt4, Amh, Vanin, Fgf, and Wt1) were used to determine whether expression in the microarray was comparable with that demonstrated in previous studies (Table 1). Expression trends throughout the developmental period matched previously published expression trends for these genes. The Sry, Vanin, Fgf9, and Amh genes all were expressed in the testis with negligible expression found in the ovary during this developmental period. Dax1 was initially present in both sexes and then downregulated in the testis as previously described (Swain et al. 1996). As expected, the Wnt4 gene was predominantly expressed in the ovary.The Wt1 gene is required for gonadal development, hence is expressed in both sexes. Unfortunately, Sox9 is not in the list as it is not on the RAE230A rat chip. This short list of sex determination genes was selected to validate the microarray and experimental approach.
Table 1.
List of genes known to be involved in sex determination. The highest and lowest expression (Exp.) values detected in the microarray analysis for each of these genes are given. Signals denoted non-detectable (ND) were considered absent for the microarray analysis and generally have an expression <50 unless indicated.
| Name | High exp. | Signal | Low exp. | Signal | GenBank | Description |
|---|---|---|---|---|---|---|
| Sry | E13 testis | 174 | E14 ovary | ND | AF275682 | Rattus norvegicus sex-determining region Y protein |
| Vanin | E16 testis | 169 | E13 ovary | 31 | BI289085 | Vanin 1 |
| Fgf9 | E14 testis | 80 | E13 ovary | ND | D14839 | Fibroblast growth factor 9 |
| Dax1 | E13 testis | 175 | E16 testis | 66.4 | NM_053317 | Nuclear receptor subfamily 0, group B, member 1 |
| Amh | E16 testis | 953 | E16 ovary | ND | AI059285 | UI-R-C1-lb-f-01–0-UI.s1 UI-R-C1 Rattus norvegicus |
| Wt1 | E14 ovary | 234 | E16 ovary | 125 | NM_031534 | Wilms tumor 1 |
| Wnt4 | E16 ovary | 249 | E16 testis | 63 | NM_053402 | Wingless-type MMTV integration site family, member 4 |
To identify novel genes that were differentially regulated between E13, E14, and E16 testis or ovary samples, genes with a statistically significant 1.5-fold increase or decrease between time points were determined separately for male (Fig. 4A) and female samples (Fig. 4B). Male and female developmental periods had approximately the same number of statistically significant changes in gene expression between E13, E14, and E16. There were 160 genes with at least a 1.5-fold change in expression in the testis and 175 changing in the ovary between E13, E14, and E16 samples. In the male, the majority of changes occurred between E13 and E14 with 46 genes increasing and 36 genes decreasing in expression (Fig. 4A). Between E14 and E16, the male had 40 genes increase and 16 genes decrease. In the female (Fig. 4B), the majority of gene expression changes occurred between E14 and E16 where there were 43 genes with increased expression and 37 with decreased expression. Between E13 and E14 in the ovary, 36 genes had decreased expression and only 18 increased. The similar number of regulated genes during E13–E16 development in male and female suggests that both have active transcriptional regulation during this development period. Interestingly, the majority of changes in the female occurred later than in the male suggesting that there is a delay in transcriptional activation in gonadal differentiation of the female as compared with the male.
Figure 4.
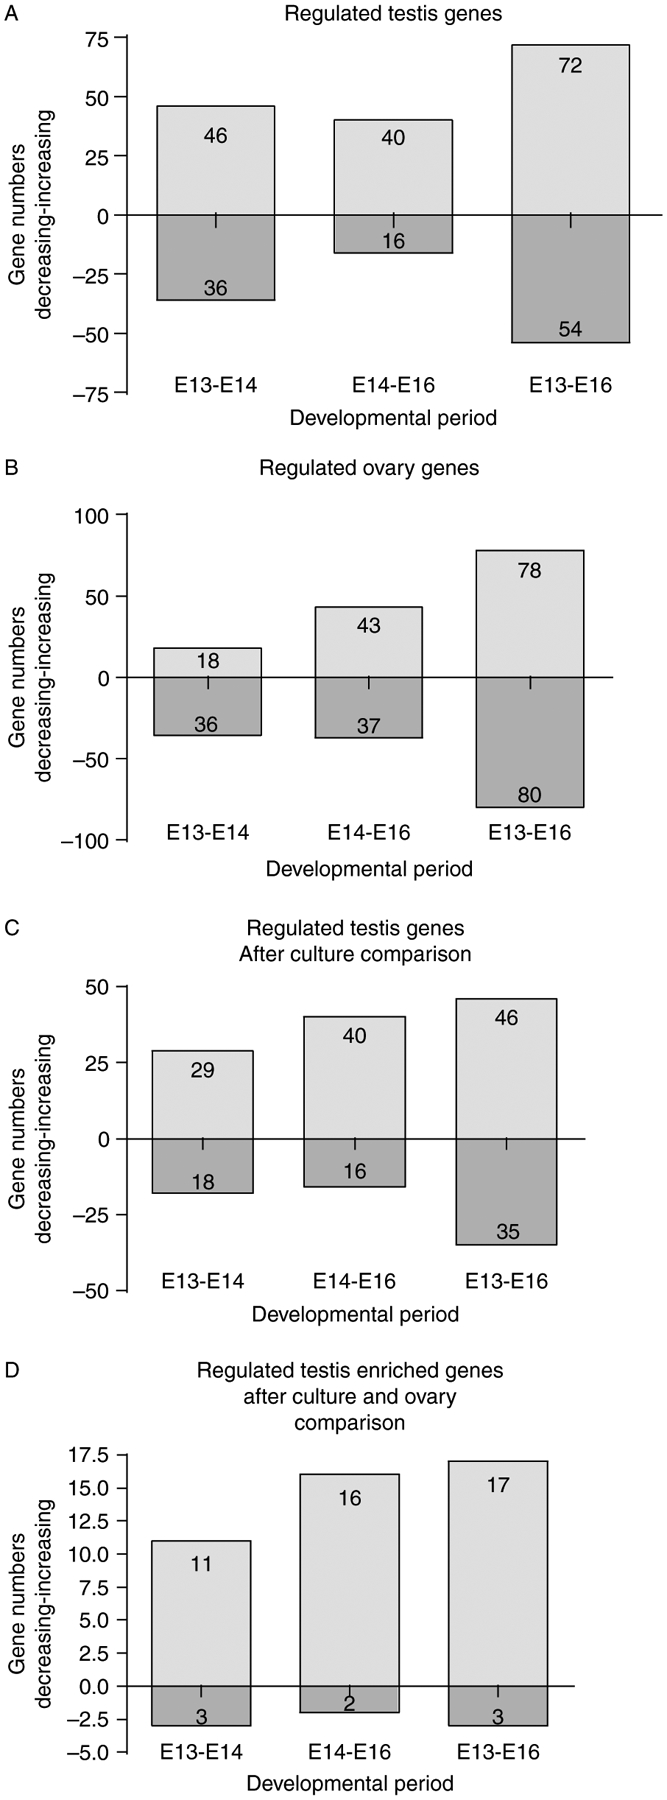
Numbers of regulated genes from testis and ovary developmental periods. (A) Numbers of genes expressed during testis development that have an expression signal of at least 75 and a statistically significant increase or decrease of 1.5-fold between each time interval are represented in a bar graph. (B) Numbers of ovary development genes with a signal of at least 75 and a statistically significant 1.5-fold increase or decrease. (C) The number of candidate genes for involvement in testis development and cord formation was reduced by comparison with E13 testis culture. Genes that are expressed above a raw signal of 75, have a 1.5-fold increase or decrease in the male time course and have similar patterns of expression changes from E13 to cultured testis as from E13 to E14 or E13 to E16. (D) Candidate testis development genes after subtraction of ovary expressed genes and comparison of testis organ cultures.
A comparative and subtractive analysis between genes in the in vivo E13, E14, and E16 testis developmental period and genes expressed in the E13-cultured testis was performed to narrow the list of potential candidate genes for involvement in testis cord formation and morphogenesis (Fig. 4C). This allowed elimination of genes not essential for seminiferous cord development, as required genes would need to be expressed both in vivo and in vitro for gonadal and cord development. The testis culture comparison reduced the number of genes regulated in the E13–E14 period to 29 increasing and 18 decreasing, and in the E13–E16 period to 46 increasing and 35 decreasing. Comparative and subtractive analyses lead to a reduction in the list of overall candidate genes from 160 (Fig. 4A) to 109 (Fig. 4C and Table 2). The 51 genes subtracted in this analysis are presented in Supplementary Table 1, which can be viewed online at www.reproduction-online.org/supplemental/. The 109 gene list represents genes regulated during embryonic E13–E16 testis development and contains potential candidate genes associated with male gonadal sex determination and testis morphogenesis. As discussed below, further subtraction of the female expressed genes provides a male enhanced and regulated list (Fig. 4D).
Table 2.
List of 109 genes expressed in the rat testis from E13 to E16 with a signal of at least 75, a 1.5-fold or greater significant change, and with similar expression in E13 testis cultured for 3 days. Genes in bold are not in the ovary above a signal of 75 at E13, E14, or E16. Underlined genes were also differentially expressed between the sexes in at least one time point. An ‘*’ denotes genes found to contain a potential SRY binding element in there promoter. An ‘S’ denotes genes identified in analysis of mouse data from Small et al. (2005).
| Gene symbol | High exp. | Signal | GenBank | Description | |
|---|---|---|---|---|---|
| Cytoskeletal and extracellular matrix | |||||
| Tgfbi | E13 | 1359 | BG379319 | Transforming growth factor β induced | |
| Podxl | E13 | 468 | AF109393 | Podocalyxin-like | |
| Tpm1 | E13 | 223 | AF370889 | Tropomyosin-α | |
| Epb4.1l3 | E13 | 142 | NM_053927 | Erythrocyte protein band 4.1-like 3 | |
| Crtl1 | E13 | 125 | NM_019189 | Cartilage link protein 1 | |
| Mmp16 | E13 | 102 | * | NM_080776 | Matrix metalloproteinase 16 |
| Sponf | E14 | 112 | * | M88469 | F-spondin |
| Col1a1 | E16 | 1646 | BBI285575 | Collagen, type 1, α1 | |
| E16 | 771 | BI296340 | Similar to cadherin 11 | ||
| E16 | 530 | BM389149 | Immunoglobulin superfamily/RNase inhibitor | ||
| E16 | 505 | S | AI177055 | Similar to myosin, light polypeptide kinase | |
| Bgn | E16 | 477 | NM_017087 | Biglycan | |
| E16 | 302 | S | AI176126 | Similar to procollagen, type VI, α 3 | |
| E16 | 292 | BM384071 | Tubulin, β2 | ||
| E16 | 252 | BG672591 | Plastin 3 (T-isoform) | ||
| E16 | 237 | BM391858 | Similar to dynein, axonemal, heavy polypeptide 11 | ||
| E16 | 203 | BF406693 | Similar to Laminin α-4 chain precursor | ||
| E16 | 183 | AI008689 | Similar to transforming acidic coiled-coil containing protein | ||
| E16 | 170 | BE110691 | Similar to EH-domain containing 2 | ||
| Tagln | E16 | 148 | S | NM_031549 | Transgelin |
| E16 | 123 | S | BI296640 | Similar to Epsin 2 | |
| E16 | 108 | BI287851 | Similar to procollagen, type VI, α 2 | ||
| Ril | E16 | 103 | NM_017062 | Reversion-induced LIM gene | |
| Signaling | |||||
| Bambi | E13 | 512 | AF387513 | BMP and activin membrane-bound inhibitor | |
| Gucy1b3 | E13 | 237 | * | NM_012769 | Guanylate cyclase 1, β3 |
| Gucy1b3 | E13 | 232 | * | BF399387 | Guanylate cyclase 1, soluble, β 3 |
| Ren1 | E13 | 183 | * | J02941 | Renin 1 |
| E14 | 88 | BG371889 | Similar to phosphodiesterase 6G, cGMP-specific | ||
| E16 | 502 | AI639128 | Similar to wingless-type MMTV integration site 5A | ||
| Sfrp4 | E16 | 241 | * | AF140346 | Secreted frizzled-related protein 4 |
| E16 | 237 | BF287964 | Similar to annexin A11 | ||
| Socs2 | E16 | 224 | BM384088 | Similar to suppressor of cytokine signaling 2 | |
| E16 | 151 | S | AI408442 | Similar to deltex 4 homolog | |
| E16 | 142 | BI296275 | Similar to monocyte to macrophage differentiation-associated 2 | ||
| Pawr | E16 | 136 | * | U05989 | PRKC, apoptosis, WT1, regulator |
| Wnt5a | E16 | 134 | * | NM_022631 | Wingless-type MMTV integration site 5A |
| E16 | 129 | AI406490 | Similar to tyrosine kinase, non-receptor, 2 | ||
| E16 | 126 | BF283621 | Similar to Ras GTPase-activating-like protein | ||
| Sh3kbp1 | E16 | 118 | AF230520 | SH3-domain kinase-binding protein 1 | |
| E16 | 108 | AI178741 | Similar to PRA1 family 2 (mouse) | ||
| E16 | 101 | S | AI071649 | Similar to adenylate cyclase 7 | |
| E16 | 91 | BE112895 | Similar to phosphoprotein enriched in astrocytes 15 | ||
| Dusp6 | E16 | 85 | AA957292 | Dual specificity phosphatase 8 | |
| E16 | 85 | BI277482 | Similar to MAP kinase interacting kinase | ||
| Metabolism | |||||
| E13 | 286 | BI284270 | Similar to glucan (1,4-α-), branching enzyme 1 | ||
| E13 | 228 | AA799700 | Similar to selenophosphate synthetase 2 | ||
| E13 | 221 | BI289467 | Similar to expressed in non-metastatic cells 4, protein | ||
| E13 | 170 | BF420664 | Similar to ubiquitin-specific protease 29 | ||
| Pppr2b2 | E13 | 141 | S | NM_022209 | Protein phosphatase 2 (formerly 2A) |
| Slc2a3 | E13 | 93 | AA901341 | Solute carrier family 2, member 2 | |
| Nedd4a | E14 | 873 | BG379338 | Similar to ribonucleotide reductase M2 | |
| E16 | 468 | AI411530 | Similar to aminoacylase 1 | ||
| E16 | 414 | AI227941 | Similar to tumor-related protein | ||
| E16 | 232 | BG673187 | Similar to four and a half LIM domains 1 | ||
| E16 | 169 | S | BI289085 | Similar to vanin 1 | |
| Enpep | E16 | 157 | AF214568 | Aminopeptidase A | |
| Gatm | E16 | 134 | S | NM_031031 | Glycine amidinotransferase |
| E16 | 128 | BF406832 | Similar to leprecan-like 2 | ||
| Tm6p1 | E16 | 119 | NM_139107 | Fasting-inducible integral membrane protein | |
| E16 | 100 | AI412948 | Similar to ataxin 7-like 3 | ||
| Growth factor | |||||
| Bmp4 | E13 | 137 | * | NM_012827 | Bone morphogenetic protein 4 |
| E13 | 115 | S | BG671943 | Similar to ephrin A5 | |
| E16 | 647 | BG375362 | Similar to latent transforming growth factor β-binding protein 4 | ||
| E16 | 239 | AI170324 | Similar to C-fos-induced growth factor (Figf) | ||
| Nppc | E16 | 184 | * | NM_053750 | Natriuretic peptide precursor C |
| Jag1 | E16 | 118 | * | NM_019147 | Jagged 1 |
| E16 | 117 | S | BG664221 | Similar to osteoglycin | |
| Tgfb3 | E16 | 102 | * | NM_013174 | Transforming growth factor, β 3 |
| Nrg1 | E13 | 78 | U02319 | Neuregulin 1 | |
| Receptor | |||||
| Grinl1a | E13 | 300 | BG664035 | Glutamate receptor, ionotropic | |
| Gpr48 | E13 | 285 | S | BI300274 | G-protein-coupled receptor 48 |
| E13 | 196 | AI072459 | Similar to Eph receptor A4 | ||
| Itpr1 | E13 | 185 | S | J05510 | Similar to inositol 1,4,5-triphosphate receptor 1 |
| Cxcr4 | E13 | 128 | AA945737 | Chemokine receptor (LCR1) | |
| Lrp4 | E13 | 85 | AI070976 | Low-density lipoprotein receptor-related protein 4 | |
| E14 | 123 | BI275605 | Similar to unc-5 homolog B | ||
| Transcription and translation | |||||
| Egr1 | E13 | 171 | NM_012551 | Early growth response 1 | |
| Hoxa5 | E13 | 163 | BE107303 | Similar to Homeo box A5 | |
| E14 | 147 | BE107296 | Ribosomal protein S6 kinase polypeptide 6 | ||
| E16 | 319 | AW253720 | Nuclear factor I/B | ||
| E16 | 135 | AI409308 | Max interacting protein 1-negative reg. of cell proliferation | ||
| Nupr1 | E16 | 91 | * | NM_053611 | Nuclear protein 1 |
| Ion transport | |||||
| Scn4b | E13 | 313 | AI137995 | Sodium channel, voltage-gated, type IV, β | |
| Lgals9 | E13 | 107 | U72741 | Lectin | |
| Nme7 | E16 | 345 | AI232036 | NME7 | |
| Other/unknown | |||||
| E13 | 851 | AI599621 | EST251324 cDNA clone REMEH36 | ||
| E13 | 566 | AA956417 | Rattus norvegicus transcribed sequences | ||
| E13 | 246 | AI175861 | Rattus norvegicus transcribed sequences | ||
| E13 | 222 | S | AA924756 | Similar to ES neuronal differentiation 2 | |
| E13 | 167 | BI294768 | Hypothetic protein-DNA-binding domain | ||
| E13 | 143 | AW529759 | Rattus norvegicus transcribed sequences | ||
| E13 | 104 | AA799470 | Rattus norvegicus transcribed sequences | ||
| E13 | 88 | AI236229 | Similar to RNA binding motif protein 24 | ||
| E13 | 77 | S | AI178384 | Similar to kelch-like 6 | |
| E14 | 172 | AA860014 | Similar to hemoglobin: SUBUNIT = ζ | ||
| E14 | 92 | AI410969 | Hypothetical protein MGC27854 | ||
| E14 | 76 | AI101385 | Rattus norvegicus transcribed sequences | ||
| A5D3 | E16 | 1514 | AY007690 | A5D3 protein | |
| E16 | 203 | AI102758 | Transcribed sequence-similarity to ref:NP_080909.1 | ||
| E16 | 183 | BE103235 | Rattus norvegicus transcribed sequences | ||
| E16 | 178 | AI009714 | Similar to serum deprivation response | ||
| E16 | 157 | AA891255 | Hypothetic protein | ||
| E16 | 147 | BM388789 | Rattus norvegicus transcribed sequence | ||
| E16 | 147 | BI281129 | Unknown | ||
| E16 | 138 | BI274243 | Transcribed sequence-similarity | ||
| E16 | 112 | AI410305 | Rattus norvegicus transcribed sequences | ||
| E16 | 111 | AI716904 | Predicted hypothetical protein | ||
| E16 | 79 | BE099060 | Hypothetical protein LOC311430 | ||
| Pak3 | E16 | 75 | NM_019210 | P21 (CDKN1A)-activated kinase 3 | |
Functional categorization of the 109 gene list (Table 2) revealed that 23 of the genes are cytoskeletal and extracellular matrix factors and 21 are signaling factors (Fig. 5). Other represented categories include 16 metabolism genes, 9 growth factors, 7 receptors, and 6 transcription/translation factors (Fig. 5). The categorizations were made based on the major cellular function of the gene. The 109 gene list was imported into Pathway Assist (Stratagene) to evaluate cell processes and signaling pathways affected by the 109 genes (Fig. 6). The number of arrows pointing to or from each cellular function box for this gene network indicates the connectivity (Asirvatham et al. 2006) and was used to determine major cell processes affected by the gene set. The resulting gene network indicated that proliferation, differentiation, and maturation (i.e. development) are all affected. Focal contact, RNA localization, and pathogenesis are also connected to the gene network (Fig. 6). A further analysis of 130 different known cellular and signaling pathways using GeneSpring KEGG pathways did not identify any specific pathways where multiple genes (>2) from the 109 list were involved (data not shown). Therefore, no specific pathways were identified to be influenced by multiple genes in the 109 list. In contrast, major cellular processes were influenced by the 109 list of genes, Fig. 6.
Figure 5.
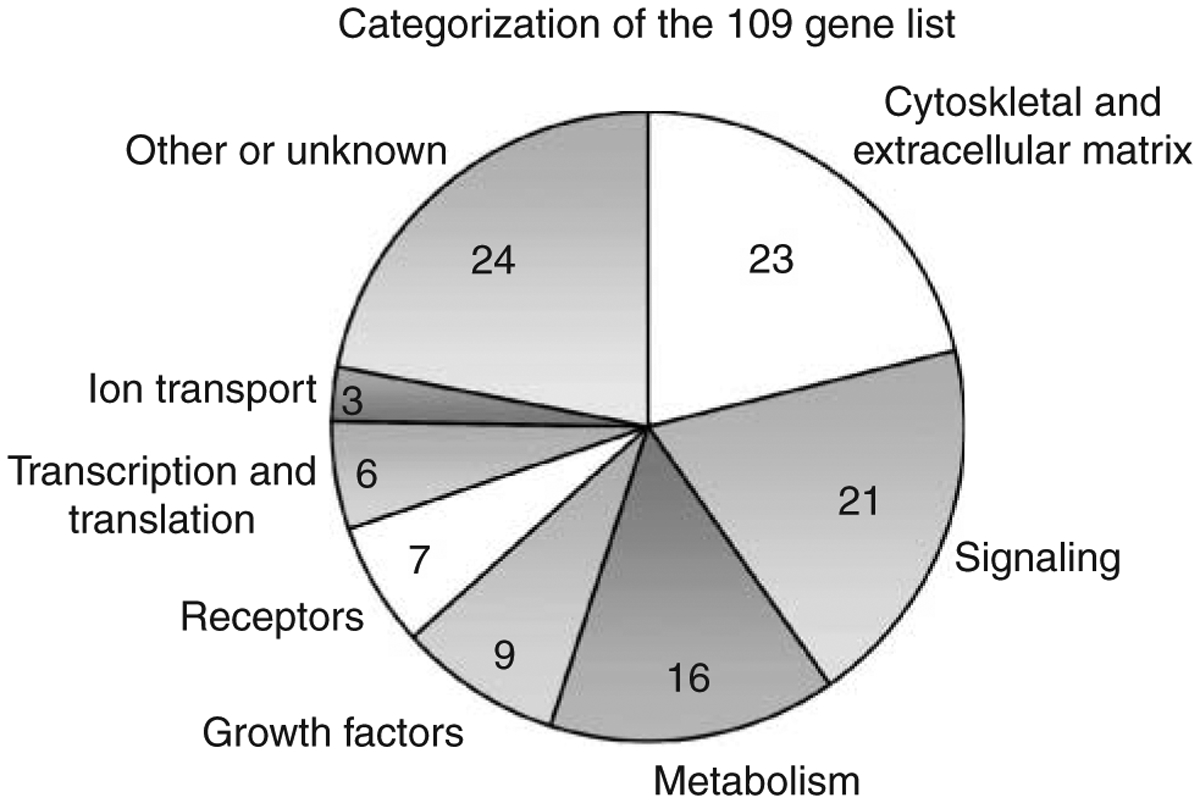
Functional categorization of the 109 gene list. The number of genes in each functional category of the 109 gene list of male-enhanced transcripts regulated in testis development.
Figure 6.
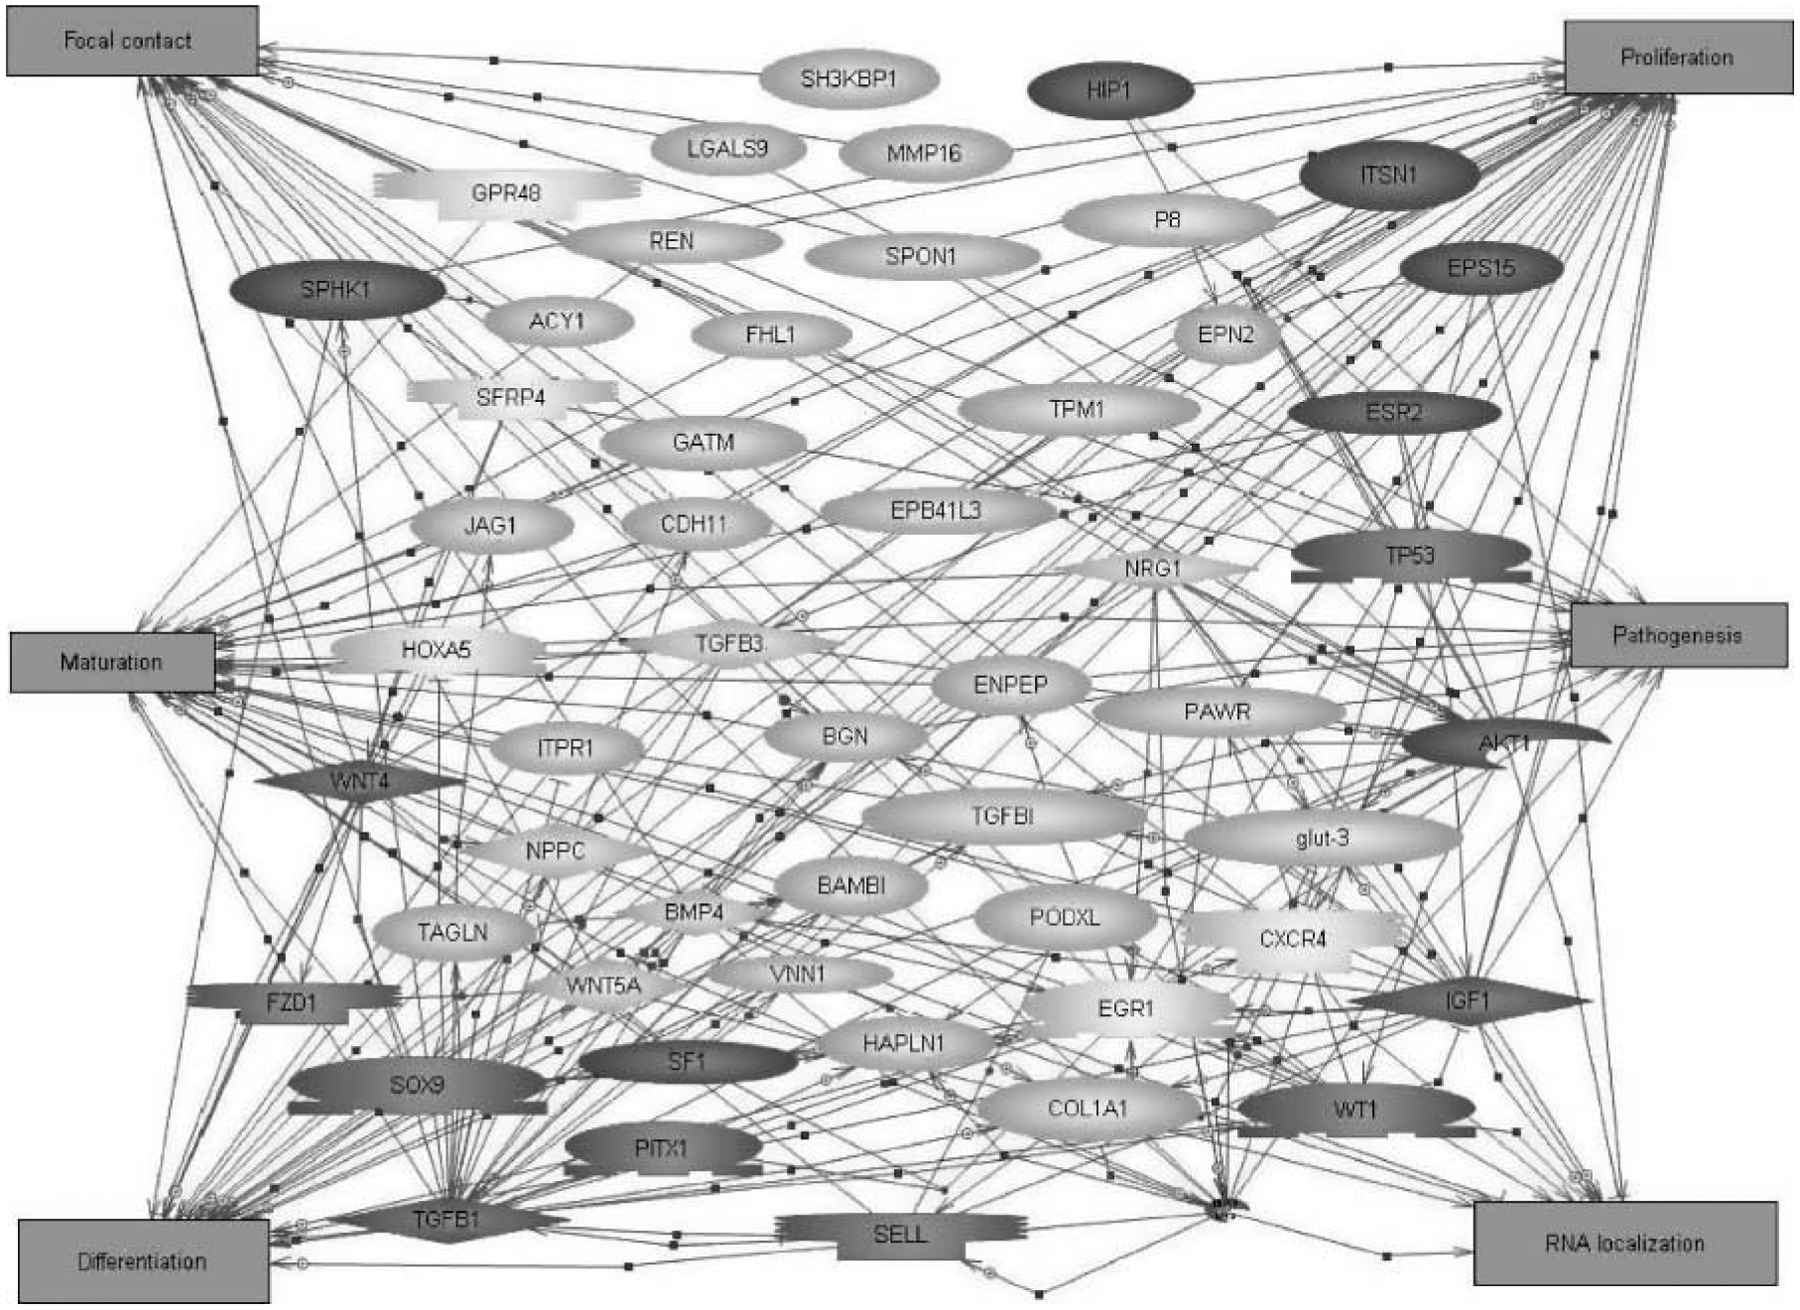
Functional gene network analysis of testis development genes. The 109 gene list was analyzed by Pathway Assist. Cell processes involved in testis development were determined based on the number of arrows connected to each box (connectivity). Rectangles are the cellular processes, light shaded shapes are a subset of the 109 list, and dark circles represent interconnecting proteins not on the 109 list.
The list of 109 rat genes was compared with mouse genes regulated during E11.5, E12.5, and E14.5 of mouse gonadal development from a previously generated microarray database (Small et al. 2005; available at www.ncbi.nlm.nih.gov/geo). The 15 genes found in both the 109 rat list and identified in the mouse are noted with an ‘S’ in Table 2. The lack of some homologous transcripts on the mouse and rat chips limits the number of genes in both analyses. From the 109 rat gene list, 68 genes were present on the mouse microarray chip. A calculation of the random chance genes would overlap between the rat and mouse chips indicated that 0.75 transcripts may potentially randomly overlap. Therefore, the 15 genes identified significantly exceed any random overlap expected. Genes appearing in both the rat and mouse analyses can be considered good candidates for involvement in sex determination and testis development.
The 109 genes differentially regulated in the male throughout the developmental period were screened for potential SRY binding elements in promoters. The frequency of the SRY element to randomly appear is every 4096 bp. From the 109 gene list, 21 genes had searchable promoters. From these 21 genes, 13 promoters were found to contain putative SRY binding elements and are marked with an asterisk in Table 2. Although the number of genes identified with potential SRY elements is in part due to random appearance of the SRY element, the lack of an element likely precludes direct binding and regulation by an HMG box protein such as SRY. Therefore, the presence of an SRY element simply indicates the potential for regulation, but does not indicate functional relevance.
Genes with a raw signal above 75 in any female samples (E13, E14, or E16) were removed from the list of the 109 genes to reveal regulated transcripts with enriched expression in the testis versus the ovary. This resulted in 34 genes that were differentially regulated between E13, E14, and E16 in the testis and enriched in the male rat gonad (Fig. 4D). These 34 genes are indicated in bold in Table 2. A similar reduction of the 175 genes expressed above a signal of 75 and with a 1.5-fold change in the ovary resulted in no gene candidates that were both differentially regulated between E13, E14, and E16 in the ovary and female enriched.
To determine whether any expressed genes were female enriched, genes expressed in male and female gonads above a given microarray signal at any time point were determined. This was done for raw microarray signal cut-off values of 75, 100, 150, 200, 250, and 500 (Fig. 7A). Genes expressed above a signal of 75 in the opposite sex were then subtracted to find the number of gender-enriched genes at each raw signal cut-off value (Fig. 7A). The numbers of genes that are female enriched at any cut-off value during this developmental period are fewer than those that are male enriched. Genes enriched above a signal value of 75 represent the portion of genes form the Venn diagrams in Fig. 3 that are gender-enriched. Genes enriched in the male and female above 100 are listed in Supplementary Table 2, which can be viewed online at www.reproduction-online.org/supplemental/. A cut-off of 100 was used for Table S2 due to the large number of genes present above 75, which would make a prohibitively lengthy list.
Figure 7.
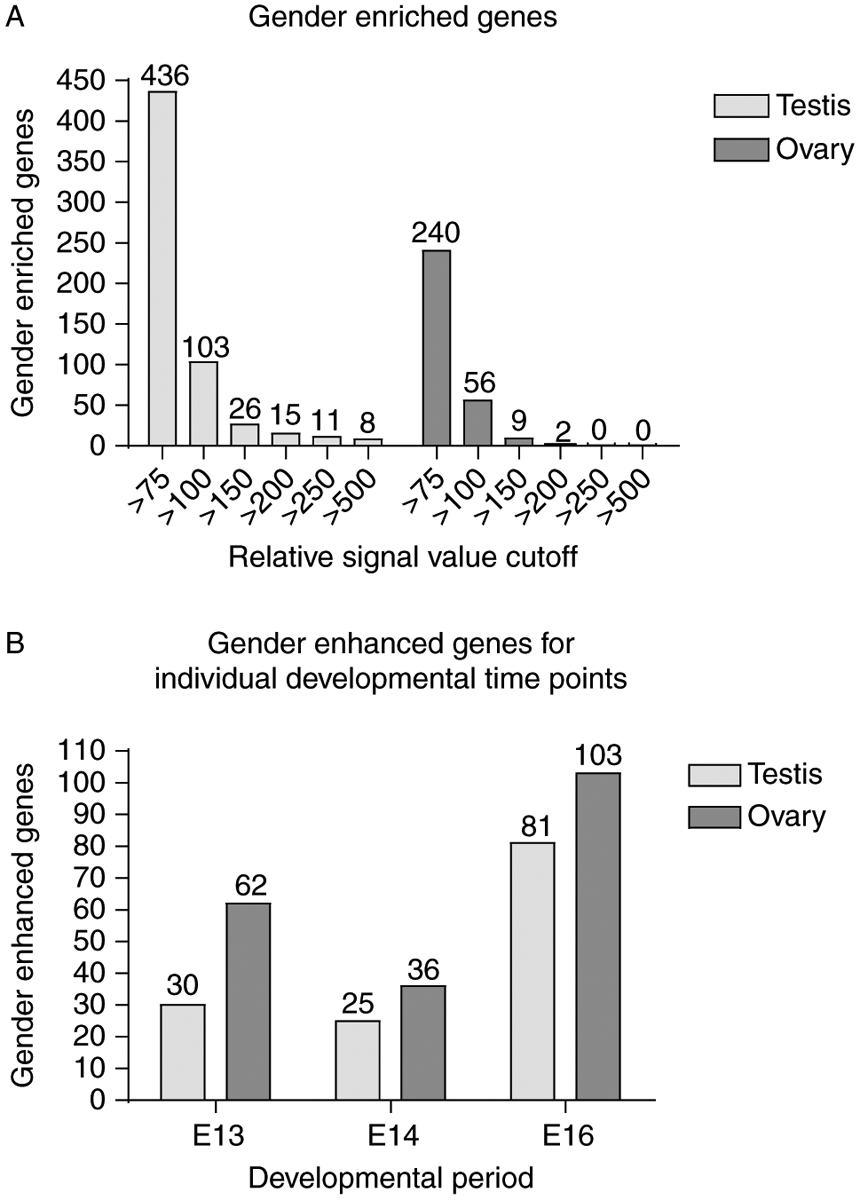
The number of gender-enriched (A) enhanced (B) transcripts between E13 and E16 in the testis and ovary. (A) All genes gender-enriched in the male and female time courses with given signal cut off values. Genes expressed above a signal of 75 in any time point of one sex were removed from lists of genes above a specified signal cut-off in at least one time point of the other sex to obtain the number of gender-enriched genes for a given signal cut off. (B) Numbers of gender-enhanced genes at a single given time point with at least a 1.5-fold change between the sexes were determined.
Genes that are differently regulated between the sexes at a single time point were identified (Fig. 7B) to allow comparison with previously reported mouse studies (Nef et al. 2005, Beverdam & Koopman 2006). Genes with a raw microarray signal of at least 75 and a statistically significant 1.5-fold increase between testis and ovary were identified at each time point individually (Fig. 7B). Genes identified in this analysis will be referred to as gender-enhanced to distinguish them in the discussion herein from the enriched genes represented in Fig. 7A. For each time point, more genes were over-expressed in the female than in the male. There were 62 transcripts found with an expression 1.5-fold higher in the female than in the male at E13, and 30 transcripts with 1.5-fold higher expression in the male at E13. At E14, 36 transcripts had enhanced expression in the female and 25 in the male. At E16, 103 transcripts had enhanced (>1.5-fold increase) expression in the female and 81 had enhanced expression in the male. A combined total of 316 genes were differentially regulated between the sexes at a given time point (E13, E14, or E16; Supplementary Table 3, which can be viewed online at www.reproduction-online.org/supplemental/). The list of 109 genes regulated in the male between E13, E14, and E16 (Table 2) was then compared with the 316 genes differentially regulated between the sexes at a single time point (Supplementary Table 3). The 33 genes in both lists are underlined in Table 2 and indicate genes regulated between the sexes and regulated over the developmental period of E13, E14, and E16 in the testis.
Comparison of differentially regulated genes for individual developmental time points between the sexes identified 316 total genes (Fig. 7B and Supplementary Table 3). A direct comparison of genes differentially regulated between the sexes in the rat at E13, E14, and E16 was made to lists of genes differentially regulated between sexes in the mouse at E10.5, E11.5, and E12.5. A list of genes generated in a similar manner for the mouse at individual developmental time points (Nef et al. 2005) was used for comparison, revealing 19 genes differentially regulated between the sexes in both the mouse data and rat data marked with an ‘N’ (Table 3). A similar comparison was made between the rat and the mouse data generated by Beverdam & Koopman (2006). Genes found to be differentially expressed in the rat between the sexes, as shown in Fig. 7B, or changing throughout the developmental period for testis or ovary, as shown in Fig. 4C and B respectively, were compared with published lists of genes regulated in mouse gonadal sex determination (Beverdam & Koopman 2006). This revealed 17 conserved genes between the Beverdam & Koopman mouse data and the rat data from the present study marked with a ‘B’ (Table 3). Previous comparison of the rat 109 list to mouse data by Small et al. (2005) revealed a total of 15 genes conserved and marked with an ‘S’ in Table 2. Three of these genes from the Small et al. (2005) mouse comparison also appear in the comparisons with the Nef et al. (2005) or Beverdam & Koopman (2006) mouse data and are also marked with an ‘S’ in Table 3. Genes identified as being regulated in the mouse and rat during this developmental period of sex determination and gonadal development appear to be conserved in sex determination and are potential candidates for further consideration. A complete list of candidate genes was compiled and is shown in Table 4. Genes included in the list had to appear in at least two of the comparative analysis lists, one of which had to be the novel rat list from the present study. The rat and mouse lists in which each gene appeared are indicated in Table 4. The candidate regulatory gene list contains 36 candidate genes including 25 potentially conserved between rat and mouse, and 23 genes in three or more lists (Table 4). In addition, 11 novel genes were identified in the present study and are also listed. The present study presents this list of candidate genes in gonadal sex determination for both testis and ovary development that are conserved between rodent species.
Table 3.
List of genes conserved in the rat and mouse. Genes present in the Nef et al. 2005 (N) or Beverdam & Koopman (2006) (B) or Small et al. (2005) (S) studies are indicated. The time in the mouse and rat that the gene is expressed (Exp) differently between the sexes is indicated for mouse and rat. Genes in bold also appear in the 109 list.
| Study pools | Mouse exp. | Rat exp. | Name | GenBank | Description |
|---|---|---|---|---|---|
| Testis | |||||
| N, B | E11.5 | E16 | A5D3 | AY007690 | A5D3 protein |
| N, B | E11.5 | E16 | BI296275 | Monocyte-macrophage differentiation | |
| N | E12.5 | E16 | Tcf21 | BE113336 | Transcription factor 21 |
| N | E12.5 | E16 | AI227742 | Bcl-2-related ovarian killer protein | |
| N | E12.5 | E16 | AI179988 | Ectodermal-neural cortex 1 | |
| N, B | E12.5/11.5 | E14, E16 | Gatm | NM_031031 | Glycine amidinotransferase |
| N | E12.5 | E16, E13 | Ednra | NM_012550 | Endothelin receptor type A |
| N, S | E12.5 | E16 | Jag1 | NM_019147 | Jagged 1 |
| N, S | E12.5 | E14 | Gatm | NM_031031 | Glycine amidinotransferase |
| N | E12.5 | E13 | AI233246 | Insulin-like growth factor binding protein 7 | |
| B | E10.5 | E13, E16 | AI410924 | Rattus norvegicus transcribed sequences | |
| B | E11.5 | E14 | B1296340 | Rattus norvegicus transcribed sequences | |
| B | E11.5 | E13–E16 | BG664221 | Transcribed sequence similar to osteoin-ductive factor | |
| B | E11.5 | E13–E16 | AI103641 | Rattus norvegicus transcribed sequences | |
| B | E11.5 | E13–E16 | BM384088 | Transcribed sequence similar to β | |
| Ovary | |||||
| NSB | E11.5 | E13 | Fst | NM_012561 | Follistatin |
| N | E12.5 | E16 | Amhr2 | NM_030998 | Anti-Müllerian hormone type 2 receptor |
| N | E12.5 | E16 | Axin2 | BF398114 | Axin2 |
| N | E12.5 | E16 | AI172116 | Zinc finger protein 672 | |
| N | E12.5 | E14 | Igfbp2 | NM_013122 | Insulin-like growth factor binding protein 2 |
| N | E12.5 | E14 | Enpp2 | NM_057104 | Ectonucleotide pyrophosphatase/phosphodiesterase 2 |
| N | E12.5 | E14 | BI291872 | Solute carrier family 37 member 2 | |
| N | E12.5 | E13 | AI412658 | Fibroblast growth factor receptor 2 | |
| N | E12.5 | E13 | Wnt4 | NM_053402 | Wingless-type MMTV integration site family, member 4 |
| B | E11.5 | E13, E14 | Klk1 | NM_012593 | Kallikrein 1 |
| B | E11.5 | E14, E16 | Cxcr4 | AA945737 | Chemokine receptor (LCR1) |
| B | E11.5 | E16 | AI102517 | Rattus norvegicus transcribed sequences | |
| B | E11.5 | E16 | Msx1 | NM_031059 | Homeo box, msh-like 1 |
| B | E11.5 | E16 | BG374285 | Rattus norvegicus transcribed sequences | |
| B | E11.5 | E13–E16 | Ifi27I | NM_130743 | Interferon, α-inducible protein 27-like |
| B | E11.5 | E13–E16 | AI172218 | Simlar to RIKEN Cdna 2810002N01 | |
| B | E11.5 | E13–E15 | Bzrp | AI008680 | Benzodiazepin receptor |
Table 4.
Final compiled candidate list of genes for involvement in sex determination and gonadal development. Genes were selected based on the number of rat analysis (rat lists) and mouse lists they appeared in and potential function. 109 and 316 refer to gene lists in Table 2 and Supplementary Table 2 respectively.
| Name | High exp. | Signal | Rat lists | Mouse lists | GenBank | Description |
|---|---|---|---|---|---|---|
| Testis development candidates | ||||||
| A5D3 | E16 | 1514 | 109,316 | NB | AY007690 | A5D3 protein |
| E16 | 840 | 316 | N | AI233246 | Insulin-like growth factor binding protein 7 | |
| Sfrp4 | E16 | 241 | 109,316,M,* | B | AF140346 | Secreted frizzled-related protein 4 |
| Socs2 | E16 | 224 | 109, M | N | BM384088 | Similar to suppressor of cytokine signaling 2 |
| E13 | 222 | 109,316 | S | AA924756 | Similar to ES neuronal differentiation 2 | |
| Itpr1 | E13 | 185 | 109,316 | S | J05510 | Inositol 1,4,5-triphosphate receptor 1 |
| Cxcr4 | E16 | 178 | 109,316 | B | AA945737 | Similar to chemokine receptor (LCR1) |
| E16 | 169 | 109,M | S | BI289085 | Similar to vanin 1 | |
| E16 | 151 | 109,316 | S | AI408442 | Similar to deltex 4 homolog | |
| E16 | 142 | 109,316,M | NB | BI296275 | Similar to monocyte to macrophage differentiation- | |
| Ednra | E16 | 126 | 316 | NS | NM_012550 | Endothelin receptor type A |
| Jag1 | E16 | 118 | 109,316,M,* | N | NM_019147 | Jagged 1 |
| E16 | 117 | 109,M | SB | BG664221 | Similar to osteoglycin | |
| E16 | 106 | 316 | B | AI410924 | Rattus norvegicus transcribed sequences | |
| E16 | 101 | 109,316,M | NS | AI071649 | Similar to adenylate cyclase 7 | |
| E16 | 239 | 109,316,M | AI170324 | Similar to C-fos induced growth factor (Figf) | ||
| Nppc | E16 | 184 | 109,316,M,* | NM_053750 | Natriuretic peptide precursor C | |
| Pawr | E16 | 136 | 109,316,M,* | U05989 | PRKC, apoptosis, WT1, regulator | |
| Wnt5a | E16 | 134 | 109,316,M,* | NM_022631 | Wingless-type MMTV integration site 5A | |
| E14 | 123 | 109,316 | BI275605 | Similar to unc-5 homolog B | ||
| Tgfb3 | E16 | 120 | 109,M,* | NM_013174 | Transforming growth factor, β 3 | |
| E16 | 91 | 109,316,M | BE112895 | Similar to phosphoprotein enriched in astrocytes 15 | ||
| Nupr1 | E16 | 91 | 109,M,* | NM_053611 | Nuclear protein 1 | |
| Dusp6 | E16 | 85 | 109,316,M | AA957292 | Dual specificity phosphatase 8 | |
| Nrg1 | E13 | 78 | 109,316,M | U02319 | Similar to neuregulin 1 | |
| Pak3 | E16 | 75 | 109,M | NM_019210 | p21 (CDKN1A)-activated kinase 3 | |
| Ovary development candidates | ||||||
| Igfbp2 | E16 | 1478 | 316 | N | NM_013122 | Insulin-like growth factor binding protein 2 |
| Amhr2 | E14 | 964 | 316 | N | NM_030998 | Anti-Müllerian hormone type 2 receptor |
| Fst | E16 | 406 | 316 | NSB | NM_012561 | Follistatin |
| E14 | 332 | 316 | N | AI412658 | Similar to fibroblast growth factor receptor 2 | |
| Wnt4 | E16 | 249 | 316 | N | NM_053402 | Wingless-type MMTV integration site family, member 4 |
| Enpp2 | E16 | 233 | 316 | N | NM_057104 | Ectonucleotide pyrophosphatase/phosphodiesterase 2 |
| Klk1 | E13 | 219 | 316 | B | NM_012593 | Kallikrein 1 |
| E14 | 135 | 316 | N | BI291872 | Similar to solute carrier family 37 member 2 | |
| Msx1 | E16 | 130 | 316 | B | NM_031059 | Homeo box, msh-like 1 |
| E16 | 128 | 316 | B | BG374285 | Rattus norvegicus transcribed sequences | |
M indicates male-enhanced genes from Table 2. An asterisk indicates genes with an SRYelement in the promoter. S, Small et al. (2005) data; N, Nef et al. (2005) data; B, Beverdam & Koopman 2006 data.
Discussion
The present study used a microarray analysis to identify new potential candidate genes for rat sex determination and differentiation. Whole gonads were used such that all the different somatic cells and germ cells are present. Clearly, changes in the individual cell type transcriptomes will contribute to the total gonadal transcriptome and, as such, correlations of the present data to individual cell types must be made with caution. The present analysis used two different samples and two different microarray chips to obtain the individual data points. Criteria to assess chip number has been previously described (Chen et al. 2004). Previous studies have demonstrated two chips for each data point, assuming an R2>0.95 and confident P<0.05, provide a critical and statistically relevant analysis (McLean et al. 2002, Kezele et al. 2005, Small et al. 2005). The reproducibility of the different microarrray chips used in this study was assessed as variance between samples and had an R2>0.96 for each dataset.
Genes known to be involved in sex determination had patterns of expression that match what is known from previous literature (Table 1). Some of these genes were eliminated from the candidate male development lists due to the stringency of the analyses. For example, FGF9 and WT1 do not exhibit the 1.5-fold statistically significant change in expression parameter used in the study. The elimination of some potentially important genes allowed for a stringent selection of candidate genes. Analysis of genes expressed with a raw signal of at least 75 revealed that approximately half the genes on the rat RAE230A chip were considered present in the embryonic testis and ovary. Approximately 2% had a 1.5-fold statistically significant change in the male and female E13, E14, and E16 developmental periods. The list of 160 genes with a 1.5-fold change in the male was reduced to 109 genes by comparison with the gene expression levels from the 3-day cultured embryonic testis. This narrowed the list of genes to be considered as candidates critical for testis development and cord formation by ~32%. The list of subtracted genes is presented in Supplementary Table 1. Since the cultured embryonic E13 testis undergoes cord formation and testis differentiation similar to in vivo, those genes regulated both in vitro and in vivo are assumed to be important. Although potential subtraction of important genes is a limitation, selection of regulated genes present from the in vivo and in vitro studies is likely to identify candidate genes for cord formation. The subtraction of genes expressed in the ovary above a raw signal of 75 from the 109 gene list revealed 34 male-enriched genes. In contrast, the subtraction of genes expressed above a signal of 75 in the male from the 175 ovary gene list yields no female-enriched genes. Therefore, the stringent subtraction analysis used revealed no ovary-enriched genes that were regulated during the E13–E16 developmental period.
Increased transcriptional changes occur in the male between E13 and E14, while major changes in the female were delayed and occur between E14 and E16. When considering genes enriched in each sex for a given signal cut off, Fig. 7A, more genes appear to be enriched in the testis. The increased number of male-enriched genes suggests that there is an active female developmental process, but a reduced number of unique transcripts at this point in female development. These observations support the concept that it is the male process of development which requires expression of unique transcripts for testis determination. In contrast, when looking at the number of transcripts differentially regulated between the sexes at a single time point, as was done in a previous mouse analysis (Nef et al. 2005) and shown in Fig. 7B, there appear to be more female-enhanced genes than male. At only a single time point, a sex-enhanced gene may be present due to up- or downregulation in that sex. Therefore, it is not until gene expression is considered in the context of the developmental time course that it can be determined in which sex it is regulated and enhanced. The 33 genes identified in the 109 list of genes and in the 316 list of genes gender enhanced are particularly interesting candidates for further consideration in male sex differentiation and development. The 33 gene list includes 10 out of the 21 signaling factors, 4 out of the 9 growth factors, and 3 out of the 7 receptors in Table 2. These genes are interesting because they are potential regulatory gene candidates and warrant further investigation. The 33 gene list does not include many cytoskeletal and extracellular matrix factors despite the fact that this is the largest category in the 109 list. Signaling is the second largest represented functional gene category in the 109 gene list and the largest category represented by genes also testis-enriched or -enhanced. Genes appearing in this category such as Tgfb3, Sfrp4, and Jag1 suggest involvement of specific signaling pathways in testis development. There appears a high level of connectivity of these genes with other genes of interest in a gene network built from the 109 list (Fig. 6). These pathways have the potential to influence gonadal differentiation. A thorough pathway analysis of over 130 different cellular and signaling pathways revealed no specific pathways where multiple (>2) genes within the 109 list are present. Clearly, a large number of critical cellular processes are influenced (Fig. 6); however, subsets of grouped genes involved in specific pathways were not identified. The assumption that defined specific pathways involving multiple-regulated genes are needed for male sex determination is questioned and instead observations suggest that a larger number of cellular processes influenced by a smaller number of different genes are likely. The concept that a smaller group of genes that influence larger gene networks is critical for development and disease etiology has been suggested (Schadt et al. 2005).
Recently, three studies have investigated genome wide transcriptional regulation of sex determination in the mouse using multiple time points (Nef et al. 2005, Small et al. 2005, Beverdam & Koopman 2006). Several others have also been done for selected genes and developmental periods (Koopman & Koopman 2002, Smith et al. 2003). The study by Small et al. (2005) focused on transcriptional changes throughout the gonadal developmental period, while the study by Nef et al. (2005) focused on changes between the sexes at E10.5, 11.5, 12.5, and 13.5 separately. The Beverdam study (Beverdam & Koopman 2006) examined changes between the sexes and between E10.5 and E11.5 in mouse. These studies were able to identify genes that were regulated early in gonadal differentiation in a sex-enhanced manner. The gonadal development and transcriptional processes in mouse and rat are similar. Investigation of the gonadal transcription during sex determination in the rat and comparison with the mouse allowed identification of genes conserved in mammalian gonadal sex determination.
The list of candidate genes involved in sex determination and gonadal development was compiled from genes identified in the present rat study (Table 4). The majority of the genes in this list also appeared in one of the mouse studies used for comparison. There was a subset of 11 genes that appear in several of the analyses performed on the rat data and did not appear in the mouse analyses. These genes may be novel in rat gonadal development, but the absence of some on the mouse microarray chips must be considered. The 36 genes in this candidate list (Table 4) had 15 genes conserved in mouse and rat testis development. To confirm the validity of the approach used in the present study, several genes known to be essential for testis development were also identified. VANIN1, A5D3, and IGFBP7 were all identified as significant candidate genes using this genomic approach. VANIN1 is a membrane-linked protein that has been shown to be expressed in a sex-specific manner in the developing testis (Wilson et al. 2005). A5D3 is highly expressed in the testis and contains potential leucine zipper and phosphorylation sites (Blomberg et al. 2002). A5D3 has also been found in a study of vitamin A deficient synchronized testis where it was called VAD4 (Luk et al. 2003). Insulin-like growth factor binding protein 7 (IGFBP7) belongs to a family of proteins that regulates IGF function. Interestingly, it has been shown that IGF receptors are required for testis development (Zhou & Bondy 1993, Nef et al. 2003).
A developmental signaling pathway suggested to have a role in sex determination is the WNT signaling pathway (Kim et al. 2006). WNTs are secreted proteins implicated in cell growth, migration, and differentiation. Secreted frizzled related protein 4 (SFRP4) is a secreted lipoprotein receptor complex similar to the frizzled receptors in the WNT signaling cascade, but without the transmembrane activation domain (Hewitt et al. 2006). SFRP4 is thought to antagonize cell survival and inhibit WNT signaling by binding WNT without activating its signaling cascade. SFRP4 has been implicated in placental growth and ovulation (Drake et al. 2003, Hewitt et al. 2006). Wnt5a also appears on the candidate gene list. WNT5A has been shown to activate signaling cascades in a manner dependant on the receptor to which it binds (Mikels & Nusse 2006). A potential role for WNT5A and SFRP4 in gonadal development is yet to be determined and the present observations support a role of the WNT signaling pathway in sex determination.
Another developmental signaling pathway potentially involved in sex determination involves the notch pathway. JAGGED1 is a notch signaling ligand involved in cell fate decisions (de La Coste & Freitas, 2006), and has been found in mouse testis where it may function in cell fate decisions during spermatogenesis (Dirami et al. 2001). DELTEX4 homolog belongs to a family of proteins originally identified in Drosophila able to interact with the ankrin repeats in notch to mediate notch signaling (Ordentlich et al. 1998, Kishi et al. 2001). Identification of these transcripts in the present study suggests that the notch pathway may be involved in male sex determination.
A number of other signal transduction-related genes were present in the candidate list, but did not group to specific pathways. Suppressor of cytokine signaling 2 is an inhibitor of JAK/STAT signaling (Leung et al. 2003, Leroith & Nissley 2005). Inositol 1,4,5-triphosphate receptor 1 has an intrinsic calcium ion channel opened in response to InsP3 (Mignery et al. 1990). CXCR4 is a G-protein-coupled chemokine receptor with a c-x-c motif (Habasque et al. 2002, Khan et al. 2005, Smith et al. 2005). Endothelin receptor type A is also a G-protein-coupled receptor expressed in Sertoli and peritubular myoid cells (Ergun et al. 1999). Osteoglycin is a keratan sulfate proteoglycan (Iozzo & Murdoch 1996, Osawa et al. 2006). Adenylate cyclase 7 catalyzes conversion of ATP to cAMP (Suzuki et al. 1998). These genes affect a number of different signal transduction pathways and are likely important for sex determination.
There are 11 genes proposed as testis development candidates that were not found in the mouse studies. Although these 11 genes did not cross rodent species analysis, they display a high probability of significant impact on sex determination in the rat, and hence require further scrutiny. This includes the c-fos-induced growth factor, a secreted factor involved in cell growth and morphogenesis (Orlandini et al. 1996). NPPC is the precursor protein for CNP, which activates a Gi signal cascade (Hobbs et al. 2004, Anand-Srivastava 2005). Unc-5 homolog B is a netrin receptor that plays a role in morphogenesis of the vascular system (Lu et al. 2004) and oligodendrocyte precursor motility (Jarjour et al. 2003). PAWR is a pro-apoptotic protein containing a leucine zipper and death domain, and is important for cell sensitization to apoptotic stimuli (Boosen et al. 2005). Transforming growth factor (TGF)β3 is a growth factor that is a growth inhibitor and present in the testis and involved in spermatogenesis (Jarjour et al. 2003, Lui et al. 2003). Nuclear protein 1 (NUPR1 or p8) is an HMG-I/Y like protein that functions as a transcriptional regulator (Hoffmeister et al. 2002). Neuregulin 1 is a critical signaling factor in cell–cell interactions (Falls 2003). The p21 activated kinase (PAK3) is a serine–threonine kinase involved in apoptosis (McPhie et al. 2003, Boda et al. 2004). A phosphoprotein enriched in astrocytes and a dual specificity phosphatase are also included in the testis development candidate list. Although these 11 candidate rat genes did not appear on the mouse lists, individually they are viable candidates for roles in sex determination due to the correlations observed in the rat data provided.
There are ten candidate genes listed for ovarian development in Table 4. Follistatin and WNT4, known to be involved in ovarian development (Schneyer et al. 2004, Yao et al. 2004, Yao 2005), appear on the ovary development candidate list. These observations help validate the experimental approach and this ovary list. IGFBP2 is involved in growth inhibition in fetal development, and is abundant in Leydig cells (Wang et al. 1994, Schneyer et al. 2004, Terrien et al. 2005, Yao 2005). AMH receptor 2 (AMHR2) is known to bind AMH to promote Müllerian duct regression in the developing male, and to negatively regulate postnatal Leydig cell differentiation (Jamin et al. 2002, Mendis-Handagama et al. 2006). A role in the fetal ovary has not been identified. FGF receptor 2 is a receptor tyrosine kinase. A role for FGFR2 in male sex determination has been identified (Schmahl et al. 2004), however, a role in female development has not. ENPP2 (also known as autotaxin) promotes cell motility, angiogenesis, and myelination (Moolenaar 2002). Kallikrein 1 is a secretory serine protease (Clements et al. 1994). Solute carrier family 37 member 2 is homologous to the GlpT antiport sn-glycerol 3-phosphate transporter family in bacteria (Bartoloni et al. 2000). Msx1 is a homeobox gene (Blin-Wakkach et al. 2001, Ramos & Robert 2005). The genes identified in Table 4 are candidates for involvement in female sex determination and early gonadal development and should be considered for further investigation.
This study characterizes transcriptional regulation of sex determination in the rat on a genomic scale and compares regulated genes in the mouse and rat. It has provided a resource for identifying candidate genes in mammalian sex determination. Profiles of expression of over 8000 genes present between E13 and E16 in the rat testis and ovary and transcripts expressed in cultured E13 testis are available (www.skinner.wsu.edu). These expression profiles provide information on genes regulated during the time of gonadal sex determination and testis development in the rat and can be used in comparative studies with the mouse and other organisms to gain insight into potentially conserved regulatory mechanisms. A functional analysis of the identified candidate genes is now required to help elucidate their potential significance in gonadal sex determination and differentiation process. Observations from the present study suggest that a smaller group of genes regulated during sex determination may have a role in influencing a large number of different cellular processes (i.e. gene networks), rather than larger groups of genes specific to selected pathways. This genomic analysis of the gonadal transcriptome during sex determination has provided a global assessment of genes and pathways potentially involved in sex determination and gonad development.
Supplementary Material
Acknowledgements
We acknowledge the expert technical assistance of Mrs Michelle Schmidt and Dr Marina Savenkova, as well as the assistance of the Center for Reproductive Biology Genomics and Bioinformatics Core Laboratories and the expert assistance of Mr Derek Pouchnik. We thank Ms Jill Griffin and Ms Rochelle Pedersen for the assistance in preparation of the manuscript. The present address of Dr Mehmet Uzumcu, Department of Animal Science, Rutgers University, 84 Lipman Drive, New Brunswick, NJ 08901. This research was supported by a grant from NIH, NICHD to MKS. The authors declare that there is no conflict of interest that would prejudice the impartiality of this scientific work.
References
- Anand-Srivastava MB 2005. Natriuretic peptide receptor-C signaling and regulation. Peptides 26 1044–1059. [DOI] [PubMed] [Google Scholar]
- Asirvatham AJ, Schmidt M, Gao B & Chaudhary J 2006. Androgens regulate the immune/inflammatory response and cell survival pathways in rat ventral prostate epithelial cells. Endocrinology 147 257–271. [DOI] [PubMed] [Google Scholar]
- Bartoloni L, Wattenhofer M, Kudoh J, Berry A, Shibuya K, Kawasaki K, Wang J, Asakawa S, Talior T, Bonne-Tamir B, Rossier C, Michaud J, McCabe ERB, Minoshima S, Shimizu N, Scott HS & Antonarakis SE 2000. Cloning and characterization of a putative human glycerol 3-phosphate permease gene (SLC37A1 or G3PP) on 21q22.3: mutation analysis in two candidate phenotypes, DFNB10 and a glycerol kinase deficiency. Genomics 70 190–200. [DOI] [PubMed] [Google Scholar]
- Berta P, Hawkins JR, Sinclair AH, Taylor A, Griffiths BL, Goodfellow PN & Fellous M 1990. Genetic evidence equating SRYand the testis-determining factor. Nature 348 448–450. [DOI] [PubMed] [Google Scholar]
- Beverdam A & Koopman P 2006. Expression profiling of purified mouse gonadal somatic cells during the critical time window of sex determination reveals novel candidate genes for human sexual dysgenesis syndromes. Human Molecular Genetics 15 417–431. [DOI] [PubMed] [Google Scholar]
- Blin-Wakkach C, Lezot F, Ghoul-Mazgar S, Hotton D, Monteiro S,Teillaud C, Pibouin L, Orestes-Cardoso S, Papagerakis P, Macdougall M, Robert B & Berdal A 2001. Endogenous Msx1 antisense transcript: in vivo and in vitro evidences, structure, and potential involvement in skeleton development in mammals. PNAS 98 7336–7341. [DOI] [PMC free article] [PubMed] [Google Scholar]
- Blomberg LA, Chan WY, Clerch LB & Massaro D 2002. Molecular cloning and characterization of a novel gene upregulated early during postnatal rat lung development. Biochimica et Biophysica Acta 1574 391–398. [DOI] [PubMed] [Google Scholar]
- Boda B, Alberi S, Nikonenko I, Node-Langlois R, Jourdain P, Moosmayer M, Parisi-Jourdain L & Muller D 2004. The mental retardation protein PAK3 contributes to synapse formation and plasticity in hippocampus. Journal of Neuroscience 24 10816–10825. [DOI] [PMC free article] [PubMed] [Google Scholar]
- Boosen M, Vetterkind S, Koplin A, Illenberger S & Preuss U 2005. Par-4-mediated recruitment of Amida to the actin cytoskeleton leads to the induction of apoptosis. Experimental Cell Research 311 177–191. [DOI] [PubMed] [Google Scholar]
- Buehr M, Gu S & McLaren A 1993. Mesonephric contribution to testis differentiation in the fetal mouse. Development 117 273–281. [DOI] [PubMed] [Google Scholar]
- Capel B 2000. The battle of the sexes. Mechanisms of Development 92 89–103. [DOI] [PubMed] [Google Scholar]
- Chaudhary J, Sadler-Riggleman I, Ague JM & Skinner MK 2005. The helix-loop-helix inhibitor of differentiation (ID) proteins induce post-mitotic terminally differentiated Sertoli cells to re-enter the cell cycle and proliferate. Biology of Reproduction 72 1205–1217. [DOI] [PubMed] [Google Scholar]
- Chen JJ, Delongchamp RR, Tsai CA, Hsueh HM, Sistare F, Thompson KL, Desai VG & Fuscoe JC 2004. Analysis of variance components in gene expression data. Bioinformatics 20 1436–1446. [DOI] [PubMed] [Google Scholar]
- Chubb C 1992. Genes regulating testis size. Biology of Reproduction 47 29–36. [DOI] [PubMed] [Google Scholar]
- Clements J, Mukhtar A, Ehrlich A & Yap B 1994. Glandular kallikrein gene expression in the human uterus. Brazilian Journal of Medical and Biological Research 27 1855–1863. [PubMed] [Google Scholar]
- Colvin JS, Green RP, Schmahl J, Capel B & Ornitz DM 2001. Male-to-female sex reversal in mice lacking fibroblast growth factor 9. Cell 104 875–889. [DOI] [PubMed] [Google Scholar]
- Cupp AS, Kim GH & Skinner MK 2000. Expression and action of neurotropin-3 and nerve growth factor in embryonic and early postnatal rat testis development. Biology of Reproduction 63 1617–1628. [DOI] [PubMed] [Google Scholar]
- Cupp AS, Tessarollo L & Skinner MK 2002. Testis developmental phenotypes in neurotropin receptor trkA and trkC null mutations: role in formation of seminiferous cords and germ cell survival. Biology of Reproduction 66 1838–1845. [DOI] [PubMed] [Google Scholar]
- Cupp AS, Uzumcu M & Skinner MK 2003. Chemotactic role of neurotropin 3 in the embryonic testis that facilitates male sex determination. Biology of Reproduction 68 2033–2037. [DOI] [PubMed] [Google Scholar]
- de La Coste A & Freitas AA 2006. Notch signaling: distinct ligands induce specific signals during lymphocyte development and maturation. Immunology Letters 102 1–9. [DOI] [PubMed] [Google Scholar]
- Dirami G, Ravindranath N, Achi MV & Dym M 2001. Expression of Notch pathway components in spermatogonia and Sertoli cells of neonatal mice. Journal of Andrology 22 944–952. [DOI] [PubMed] [Google Scholar]
- Drake JM, Friis RR & Dharmarajan AM 2003. The role of sFRP4, a secreted frizzled-related protein, in ovulation. Apoptosis 8 389–397. [DOI] [PubMed] [Google Scholar]
- Eisen MB, Spellman PT, Brown PO & Botstein D 1998. Cluster analysis and display of genome-wide expression patterns. PNAS 95 14863–14868. [DOI] [PMC free article] [PubMed] [Google Scholar]
- Ergun S, Harneit S, Paust HJ, Mukhopadhyay AK & Holstein AF 1999. Endothelin and endothelin receptors A and B in the human testis. Anatomy and Embryology 199 207–214. [DOI] [PubMed] [Google Scholar]
- Falls DL 2003. Neuregulins and the neuromuscular system: 10 years of answers and questions. Journal of Neurocytology 32 619–647. [DOI] [PubMed] [Google Scholar]
- Ginsburg M, Snow MH & McLaren A 1990. Primordial germ cells in the mouse embryo during gastrulation. Development 110 521–528. [DOI] [PubMed] [Google Scholar]
- Habasque C, Aubry F, Jegou B & Samson M 2002. Study of the HIV-1 receptors CD4, CXCR4, CCR5 and CCR3 in the human and rat testis. Molecular Human Reproduction 8 419–425. [DOI] [PubMed] [Google Scholar]
- Hewitt DP, Mark PJ, Dharmarajan AM & Waddell BJ 2006. Placental Expression of Secreted Frizzled Related Protein-4 in the Rat and the Impact of Glucocorticoid-Induced Fetal and Placental Growth Restriction. Biology of Reproduction 75 75–81. [DOI] [PubMed] [Google Scholar]
- Hobbs A, Foster P, Prescott C, Scotland R & Ahluwalia A 2004. Natriuretic peptide receptor-C regulates coronary blood flow and prevents myocardial ischemia/reperfusion injury: novel cardio-protective role for endothelium-derived C-type natriuretic peptide. Circulation 110 1231–1235. [DOI] [PubMed] [Google Scholar]
- Hoffmeister A, Ropolo A, Vasseur S, Mallo GV, Bodeker H, Ritz-Laser B, Dressler GR, Vaccaro MI, Dagorn JC, Moreno S & Iovanna JL 2002. The HMG-I/Y-related protein p8 binds to p300 and Pax2 trans-activation domain-interacting protein to regulate the trans-activation activity of the Pax2A and Pax2B transcription factors on the glucagon gene promoter. Journal of Biological Chemistry 277 22314–22319. [DOI] [PubMed] [Google Scholar]
- Iozzo RV & Murdoch AD 1996. Proteoglycans of the extracellular environment: clues from the gene and protein side offer novel perspectives in molecular diversity and function. FASEB Journal 10 598–614. [PubMed] [Google Scholar]
- Jameson JL, Achermann JC, Ozisik G & Meeks JJ 2003. Battle of the sexes: new insights into genetic pathways of gonadal development. Transactions of the American Clinical and Climatological Association 114 51–63 (discussion 64–65). [PMC free article] [PubMed] [Google Scholar]
- Jamin SP, Arango NA, Mishina Y, Hanks MC & Behringer RR 2002. Requirement of Bmpr1a for Mullerian duct regression during male sexual development. Nature Genetics 32 408–410. [DOI] [PubMed] [Google Scholar]
- Jarjour AA, Manitt C, Moore SW, Thompson KM, Yuh SJ & Kennedy TE 2003. Netrin-1 is a chemorepellent for oligodendrocyte precursor cells in the embryonic spinal cord. Journal of Neuroscience 23 3735–3744. [DOI] [PMC free article] [PubMed] [Google Scholar]
- Jost A, Magre S & Agelopoulou R 1981. Early stages of testicular differentiation in the rat. Human Genetics 58 59–63. [DOI] [PubMed] [Google Scholar]
- Kanai Y, Kawakami H, Takata K, Kurohmaru M, Hirano H & Hayashi Y 1992. Involvement of actin filaments in mouse testicular cord organization in vivo and in vitro. Biology of Reproduction 46 233–245. [DOI] [PubMed] [Google Scholar]
- Karl J & Capel B 1998. Sertoli cells of the mouse testis originate from the coelomic epithelium. Developmental Biology 203 323–333. [DOI] [PubMed] [Google Scholar]
- Kezele PR, Ague JM, Nilsson E & Skinner MK 2005. Alterations in the ovarian transcriptome during primordial follicle assembly and development. Biology of Reproduction 72 241–255. [DOI] [PubMed] [Google Scholar]
- Khan MZ, Shimizu S, Patel JP, Nelson A, Le MT, Mullen-Przeworski A, Brandimarti R, Fatatis A & Meucci O 2005. Regulation of neuronal P53 activity by CXCR 4. Molecular and Cellular Neurosciences 30 58–66. [DOI] [PMC free article] [PubMed] [Google Scholar]
- Kim Y & Capel B 2006. Balancing the bipotential gonad between alternative organ fates: a new perspective on an old problem. Developmental Dynamics 235 2292–2300. [DOI] [PubMed] [Google Scholar]
- Kim Y, Kobayashi A, Sekido R, DiNapoli L, Brennan J, Chaboissier MC, Poulat F, Behringer RR, Lovell-Badge R & Capel B 2006. Fgf9 and Wnt4 act as antagonistic signals to regulate mammalian sex determination. PLoS Biology 4 e187. [DOI] [PMC free article] [PubMed] [Google Scholar]
- Kishi N, Tang Z, Maeda Y, Hirai A, Mo R, Ito M, Suzuki S, Nakao K,Kinoshita T, Kadesch T, Hui C, Artavanis-Tsakonas S, Okana H & Matsuno K 2001. Murine homologs of deltex define a novel gene family involved in vertebrate Notch signaling and neurogenesis. International Journal of Developmental Biology 19 21–35. [DOI] [PubMed] [Google Scholar]
- Koopman P, Munsterberg A, Capel B, Vivian N & Lovell-Badge R 1990. Expression of a candidate sex-determining gene during mouse testis differentiation. Nature 348 450–452. [DOI] [PubMed] [Google Scholar]
- Koopman P, Bullejos M, Loffler K & Bowles J 2002. Expression-based strategies for discovery of genes involved in testis and ovary development. Novartis Foundation Symposium 244 240–249 (discussion 249–257). [PubMed] [Google Scholar]
- Leroith D & Nissley P 2005. Knock your SOCS off!. Journal of ClinicalInvesigation 115 233–236. [DOI] [PMC free article] [PubMed] [Google Scholar]
- Leung KC, Doyle N, Ballesteros M, Sjogren K, Watts CK, Low TH, Leong GM, Ross RJ & Ho KK 2003. Estrogen inhibits GH signaling by suppressing GH-induced JAK2 phosphorylation, an effect mediated by SOCS-2. PNAS 100 1016–1021. [DOI] [PMC free article] [PubMed] [Google Scholar]
- Levine E, Cupp AS & Skinner MK 2000. Role of neurotropins in rat embryonic testis morphogenesis (cord formation). Biology of Reproduction 62 132–142. [DOI] [PubMed] [Google Scholar]
- Lu X, Le Noble F, Yuan L, Jiang Q, De Lafarge B, Sugiyama D, Breant C, Claes F, De Smet F, Thomas JL, Autiero M, Carmeliet P, Tessier-Lavigne M & Eichmann A 2004. The netrin receptor UNC5B mediates guidance events controlling morphogenesis of the vascular system. Nature 432 179–186. [DOI] [PubMed] [Google Scholar]
- Lui WY, Lee WM & Cheng CY 2003. TGF-betas: their role in testicular function and Sertoli cell tight junction dynamics. International Journal of Andrology 26 147–160. [DOI] [PubMed] [Google Scholar]
- Luk JM, Mok BW, Shum CK, Yeung WS, Tam PC, Tse JY, Chow JF, Woo J, Kam K & Lee LF 2003. Identification of novel genes expressed during spermatogenesis in stage-synchronized rat testes by differential display. Biochemical and Biophysical Research Communications 307 782–790. [DOI] [PubMed] [Google Scholar]
- Magre S & Jost A 1980. The initial phases of testicular organogenesis in the rat. An electron microscopy study. Archives d’anatomie Microscopique et de Morphologie Exprimentale 69 297–318. [PubMed] [Google Scholar]
- Magre S, Agelopoulou R & Jost A 1980. Sertoli cells and organogenesis of the fetal testis (author’s translation). Annales d’Endocrinologie 41 531–537. [PubMed] [Google Scholar]
- Martineau J, Nordqvist K, Tilmann C, Lovell-Badge R & Capel B 1997. Male-specific cell migration into the developing gonad. Current Biology 7 958–968. [DOI] [PubMed] [Google Scholar]
- McLean DJ, Friel PJ, Pouchnik D & Griswold MD 2002. Oligonucleo-tide microarray analysis of gene expression in follicle-stimulating hormone-treated rat Sertoli cells. Molecular Endocrinology 16 2780–2792. [DOI] [PubMed] [Google Scholar]
- McPhie DL, Coopersmith R, Hines-Peralta A, Chen Y, Ivins KJ, Manly SP, Kozlowski MR, Neve KA & Neve RL 2003. DNA synthesis and neuronal apoptosis caused by familial Alzheimer disease mutants of the amyloid precursor protein are mediated by the p21 activated kinase PAK3. Journal of Neuroscience 23 6914–6927. [DOI] [PMC free article] [PubMed] [Google Scholar]
- Mendis-Handagama SM, Di Clementi N, Ariyaratne HB & Mrkonjich L 2006. Detection of anti-Mullerian hormone receptor II protein in the postnatal rat testis from birth to sexual maturity. Histology and Histopathology 21 125–130. [DOI] [PubMed] [Google Scholar]
- Merchant-Larios H & Moreno-Mendoza N 1998. Mesonephric stromal cells differentiate into Leydig cells in the mouse fetal testis. Experimental Cell Research 244 230–238. [DOI] [PubMed] [Google Scholar]
- Mignery GA, Newton CL, Archer BT III & Sudhof TC 1990. Structure and expression of the rat inositol 1,4,5-trisphosphate receptor. Journal of Biological Chemistry 265 12679–12685. [PubMed] [Google Scholar]
- Mikels AJ & Nusse R 2006. Purified Wnt5a protein activates or inhibits beta-catenin-TCF signaling depending on receptor context. PLoS Biology 4 e115. [DOI] [PMC free article] [PubMed] [Google Scholar]
- Mittwoch U, Delhanty JD & Beck F 1969. Growth of differentiating testes and ovaries. Nature 224 1323–1325. [DOI] [PubMed] [Google Scholar]
- Moolenaar WH 2002. Lysophospholipids in the limelight: autotaxin takes center stage. Journal of Cell Biology 158 197–199. [DOI] [PMC free article] [PubMed] [Google Scholar]
- Morrish BC & Sinclair AH 2002. Vertebrate sex determination: many means to an end. Reproduction 124 447–457. [DOI] [PubMed] [Google Scholar]
- Munsterberg A & Lovell-Badge R 1991. Expression of the mouse anti-mullerian hormone gene suggests a role in both male and female sexual differentiation. Development 113 613–624. [DOI] [PubMed] [Google Scholar]
- Nef S, Verma-Kurvari S, Merenmies J, Vassalli JD, Efstratiadis A, Accili D & Parada LF 2003. Testis determination requires insulin receptor family function in mice. Nature 426 291–295. [DOI] [PubMed] [Google Scholar]
- Nef S, Schaad O, Stallings NR, Cederroth CR, Pitetti JL, Schaer G, Malki S, Doubois-Dauphin M, Boizet-Bonhoure B, Descombes P, Parker KL & Vassalli JD 2005. Gene expression during sex determination reveals a robust female genetic program at the onset of ovarian development. Developmental Biology 287 361–377. [DOI] [PubMed] [Google Scholar]
- Nishino K, Yamanouchi K, Naito K & Tojo H 2001. Characterization of mesonephric cells that migrate into the XY gonad during testis differentiation. Experimental Cell Research 267 225–232. [DOI] [PubMed] [Google Scholar]
- Ordentlich P, Lin A, Shen CP, Blaumueller C, Matsuno K, Artavanis-Tsakonas S & Kadesch T 1998. Notch inhibition of E47 supports the existence of a novel signaling pathway. Molecular and Cellular Biology 18 2230–2239. [DOI] [PMC free article] [PubMed] [Google Scholar]
- Orlandini M, Marconcini L, Ferruzzi R & Oliviero S 1996. Identification of a c-fos-induced gene that is related to the platelet-derived growth factor/vascular endothelial growth factor family. PNAS 93 11675–11680. [DOI] [PMC free article] [PubMed] [Google Scholar]
- Osawa A, Kato M, Matsumoto E, Iwase K, Sugimoto T, Matsui T, Ishikura H, Sugano S, Kurosawa H, Takiguchi M & Seki N 2006. Activation of genes for growth factor and cytokine pathways late in chondrogenic differentiation of ATDC5 cells. Genomics 88 52–64. [DOI] [PubMed] [Google Scholar]
- Ramos C & Robert B 2005. Msh/msx gene family in neural development. Trends in Genetics 21 624–632. [DOI] [PubMed] [Google Scholar]
- Raymond CS, Kettlewell JR, Hirsch B, Bardwell VJ & Zarkower D 1999. Expression of Dmrt1 in the genital ridge of mouse and chicken embryos suggests a role in vertebrate sexual development. Developmental Biology 215 208–220. [DOI] [PubMed] [Google Scholar]
- Raymond CS, Murphy MW, O’Sullivan MG, Bardwell VJ & Zarkower D 2000. Dmrt1, a gene related to worm and fly sexual regulators, is required for mammalian testis differentiation. Genes and Development 14 2587–2595. [DOI] [PMC free article] [PubMed] [Google Scholar]
- De Santa Barbara P, Bonneaud N, Boizet B, Desclozeaux M, Moniot B, Sudbeck P, Scherer G, Poulat F & Berta P 1998. Direct interaction of SRY-related protein SOX9 and steroidogenic factor 1 regulates transcription of the human anti-Mullerian hormone gene. Molecular and Cellular Biology 18 6653–6665. [DOI] [PMC free article] [PubMed] [Google Scholar]
- Schadt EE, Lamb J, Yang X, Zhu J, Edwards S, Guhathakurta D, Sieberts SK, Monks S, Reitman M, Zhang C, Lum PY, Leonardson A, Thieringer R, Metzger JM, Yang L, Castle J, Zhu H, Kash SF, Drake TA, Sachs A & Lusis AJ 2005. An integrative genomics approach to infer causal associations between gene expression and disease. Nature Genetics 37 710–717. [DOI] [PMC free article] [PubMed] [Google Scholar]
- Schmahl J, Eicher EM, Washburn LL & Capel B 2000. Sry induces cell proliferation in the mouse gonad. Development 127 65–73. [DOI] [PubMed] [Google Scholar]
- Schmahl J, Kim Y, Colvin JS, Ornitz DM & Capel B 2004. Fgf9 induces proliferation and nuclear localization of FGFR2 in Sertoli precursors during male sex determination. Development 131 3627–3636. [DOI] [PubMed] [Google Scholar]
- Schneyer A, Sidis Y, Xia Y, Saito S, del Re E, Lin HY & Keutmann H 2004. Differential actions of follistatin and follistatin-like 3. Molecular and Cellular Endocrinology 225 25–28. [DOI] [PubMed] [Google Scholar]
- Sinclair AH, Berta P, Palmer MS, Hawkins JR, Griffiths BL, Smith MJ,Foster JW, Frischauf AM, Lovell-Badge R & Goodfellow PN 1990. A gene from the human sex-determining region encodes a protein with homology to a conserved DNA-binding motif. Nature 346 240–244. [DOI] [PubMed] [Google Scholar]
- Small CL, Shima JE, Uzumcu M, Skinner MK & Griswold MD 2005. Profiling gene expression during the differentiation and development of the murine embryonic gonad. Biology of Reproduction 72 492–501. [DOI] [PMC free article] [PubMed] [Google Scholar]
- Smith L, Van Hateren N, Willan J, Romero R, Blanco G, Siggers P, Walsh J, Banerjee R, Denny P, Ponting C & Greenfield A 2003. Candidate testis-determining gene. Maestro (Mro), encodes a novel HEAT repeat protein. Developmental Dynamics 227 600–607. [DOI] [PubMed] [Google Scholar]
- Smith JM, Johanesen PA, Wendt MK, Binion DG & Dwinell MB 2005. CXCL12 activation of CXCR4 regulates mucosal host defense through stimulation of epithelial cell migration and promotion of intestinal barrier integrity. American Journal of Physiology. Gastrointestinal and Liver Physiology 288 G316–G326. [DOI] [PubMed] [Google Scholar]
- Suzuki Y, Shen T, Poyard M, Best-Belpomme M, Hanoune J & Defer N 1998. Expression of adenylyl cyclase mRNAs in the denervated and in the developing mouse skeletal muscle. American Journal of Physiology 274 C1674–C1685. [DOI] [PubMed] [Google Scholar]
- Swain A, Zanaria E, Hacker A, Lovell-Badge R & Camerino G 1996. Mouse Dax1 expression is consistent with a role in sex determination as well as in adrenal and hypothalamus function. Nature Genetics 12 404–409. [DOI] [PubMed] [Google Scholar]
- Swain A, Narvaez V, Burgoyne P, Camerino G & Lovell-Badge R 1998. Dax1 antagonizes Sry action in mammalian sex determination. Nature 391 761–767. [DOI] [PubMed] [Google Scholar]
- Terrien X, Bonvin E, Corroyer S, Tabary O & Clement A 2005. Henrion Caude. A, Intracellular colocalization and interaction of IGF-binding protein-2 with the cyclin-dependent kinase inhibitor p21CIP1/WAF1 during growth inhibition. Biochemical Journal 392 457–465. [DOI] [PMC free article] [PubMed] [Google Scholar]
- Tung PS, Skinner MK & Fritz IB 1984. Cooperativity between Sertoli cells and peritubular myoid cells in the formation of the basal lamina in the seminiferous tubule. Annals of the New York Academy of Sciences 438 435–446. [DOI] [PubMed] [Google Scholar]
- Uzumcu M, Westfall SD, Dirks KA & Skinner MK 2002. Embryonic testis cord formation and mesonephric cell migration requires the phosphotidylinositol 3-kinase signaling pathway. Biology of Reproduction 67 1927–1935. [DOI] [PubMed] [Google Scholar]
- Vidal VP, Chaboissier MC, de Rooij DG & Schedl A 2001. Sox9 induces testis development in XX transgenic mice. Nature Genetics 28 216–217. [DOI] [PubMed] [Google Scholar]
- Wagner T, Wirth J, Meyer J, Zabel B, Held M, Zimmer J, Pasantes J, Bricarelli FD, Keutel J & Hustert E 1994. Autosomal sex reversal and campomelic dysplasia are caused by mutations in and around the SRY-related gene SOX9. Cell 79 1111–1120. [DOI] [PubMed] [Google Scholar]
- Wang D, Nagpal ML, Lin T, Shimasaki S & Ling N 1994. Insulin-like growth factor-binding protein-2: the effect of human chorionic gonadotropin on its gene regulation and protein secretion and its biological effects in rat Leydig cells. Molecular Endocrinology 8 69–76. [DOI] [PubMed] [Google Scholar]
- Wilson MJ, Jeyasuria P, Parker KL & Koopman P 2005. The transcription factors steroidogenic factor-1 and SOX9 regulate expression of Vanin-1 during mouse testis development. Journal of Biological Chemistry 280 5917–5923. [DOI] [PubMed] [Google Scholar]
- Yao HH 2005. The pathway to femaleness: current knowledge on embryonic development of the ovary. Molecular and Cellular Endocrinology 230 87–93. [DOI] [PMC free article] [PubMed] [Google Scholar]
- Yao HH, Tilmann C, Zhao GQ & Capel B 2002. The battle of the sexes: opposing pathways in sex determination. Novartis Foundation Symposium 244 187–198 (discussion 198–206, 253–257). [PubMed] [Google Scholar]
- Yao HH, Matzuk MM, Jorgez CJ, Menke DB, Page DC, Swain A & Capel B 2004. Follistatin operates downstream of Wnt4 in mammalian ovary organogenesis. Developmental Dynamics 230 210–215. [DOI] [PMC free article] [PubMed] [Google Scholar]
- Yao HH, Aardema J & Holthusen K 2006. Sexually dimorphic regulation of inhibin beta B in establishing gonadal vasculature in mice. Biology of Reproduction 74 978–983. [DOI] [PMC free article] [PubMed] [Google Scholar]
- Zhou J & Bondy C 1993. Anatomy of the insulin-like growth factor system in the human testis. Fertility and Sterility 60 897–904. [DOI] [PubMed] [Google Scholar]
Associated Data
This section collects any data citations, data availability statements, or supplementary materials included in this article.