

Abstract
We would like to report the eco-friendly synthesis of reduced graphene oxide using aqueous extract of Acorus calamus (rhizome), dried fruit and seed parts of Terminalia bellirica, Helicteres isora and Quercus infectoria and the whole shell part of Turbinella pyrum by simple steam bath technique. The structural and morphological characteristics of prepared reduced graphene oxides were determined by UV–Visible spectroscopy, Fourier Transform Infra-Red spectroscopy (FTIR), Field Emission Scanning Electron Microscopy (FESEM) and Raman spectroscopy. The Surface Plasmon Resonance at 260–280 nm ensured the reduced graphene oxide formation. The antibacterial efficacy of synthesized reduced graphene oxide was evaluated against both gram-positive and gram-negative pathogens such as Staphylococcus aureus, Bacillus subtilis, Salmonella paratyphi and Escherichia coli. Among the selected samples Quercus infectoria mediated reduced graphene oxide showed excellent inhibition efficiency (27 and 28 mm) against Escherichia coli and Staphylococcus aureus, respectively as compared to the standard Gentamycin (29 mm). Quercus infectoria showed significant inhibition of 22 mm and moderate inhibition of 18 mm against Bacillus subtilis and Salmonella paratyphi, respectively. The results suggest selected plants and chank shell-mediated reduced graphene oxide as potential antibacterial agents for various therapeutic applications.
Keywords: Quercus infectoria, Acorus calamus, Turbinella pyrum, Reduced graphene oxide, Antibacterial activity
Introduction
Nature has profuse resources in terms of various flora and fauna. In recent days these resources are utilized for the green perspective nano synthesis. Mainly plants are chosen as the ideal green representative as they act as eco-friendly agents (reducing, capping and stabilizing agents) for nano synthesis. The biosynthesis of the nanoparticles helps to reduce the toxicity of nanoparticles which is a major concern nowadays which has to be addressed. The unique properties of the nanoparticles compared to bulk counterparts have significant advantages [1].
Nanomaterials can be synthesized using physical, chemical, and biological processes. Physical techniques are used to produce a low yield at first. To convert metallic ions to nanoparticles, chemical methods are used. There will be harmful chemicals used, and dangerous byproducts will be produced. Only as the biological approach to nanoparticle synthesis came into view did nanoparticle applications accelerate throughout the medical field [2]. When used as drug delivery device, nanoparticles have many benefits. Drug delivery through NPs, for example, increases the drug's water solubility in cancer cells. Furthermore, drug delivery through NPs improves the drug's intracellular absorption and helps to maintain its metabolic stability. The drug's circulation cycle is also extended. The NPs allows for selective drug distribution, sparing normal cells from the drug's cytotoxic effects [3, 4]. Inorganic nanoparticles such as Gold, Silver, and Platinum are efficient anti-parasites against T. brucei, T. congolense and T. evansi [5]. On the other hand, inorganic nanomaterials have certain disadvantages such as high cellular toxicity, low biocompatibility and lack of biodegradability [6].
Synthesis of nanoparticles using plant parts is a recent trend of a green method of synthesis. For graphitic materials; graphene is considered as their ‘mother’. Arrangement of sp2 hybridized Carbon modulated with hexagonal structure is observed. Also, it is the primary building block for carbon nanotubes [7, 8]. Due to the potential biocidal property, graphene-based materials are one of the prime promising nanomaterials for antibacterial applications. Yet the physicochemical features of these materials which are responsible for their antibacterial activity have to be explored. Graphene-based nanoparticles are capable enough to interact with cellular components. Evaluation of this particular interaction will possibly help to determine benign applications [9].
Antibiotics in large quantities are used in human medicine. Antibiotics are produced on a global scale of about 100,000 tons per year, and their use has had a significant effect on bacterial life on the planet. Antibiotic resistance has increased, and certain bacteria have developed resistance to several antibiotics and chemotherapeutic agents, a condition known as multidrug resistance [10]. Multidrug-resistant bacteria (MDR bacteria) are one of the most serious risks to public health today. MDR bacteria are often linked to nosocomial infections. Some MDR bacteria, on the other hand, have been common sources of community-acquired infections. MDR bacteria's expansion into the population is a critical trend, as it is linked to higher morbidity, death, medical expenses, and antibiotic use [11]. There are numerous researches ongoing for an efficient broad-spectrum antibiotic drug as the pathogens are viable enough to possess resistance against the drugs. Thus the urge to address this problem is essential. Recent COVID-19 also necessitates the need for antimicrobial research as still, researchers are fighting the belligerent Coronavirus. Hence the present study aims at exploring the antibacterial efficiency of the bio-templated reduced graphene oxide.
There are numerous reports on the bioactivity of nanoparticles; particularly reduced graphene oxide has numerous applications in several fields. Researches on graphene oxide aided antibacterial agent are in progress due to their unique properties. Some of the properties include biocompatibility, wider surface area, and thermo-electric conductivity. Possible surface modification and functionalization with inorganic nanostructures, biomolecules and polymers could reduce the toxicity of the graphene oxide and increases the efficacy as an antimicrobial agent [12]. The reports show that nano-SiO2/GO were efficient antibacterial agents compared to the nano-SiO2 coated and uncoated samples [13]. Whereas nanohybrids show excellent antibacterial property which is determined by their minimum inhibitory and bactericidal concentrations (MIC and MBC), using a broth microdilution assay for Escherichia coli bacteria [14]. Silver nanoparticle decorated magnetic graphene oxide (MGO-Ag) shows antibacterial activity against Escherichia coli and Staphylococcus aureus [15]. These reports inspired us to investigate more on the antibacterial efficacy of plant-mediated reduced graphene oxides.
The reason to choose these particular samples for the bio-template synthesis of reduced graphene oxide is that, in South India, there is a traditional medicinal practice in administering these selected samples to the infants after 28 days of birth till 3–6 months along with honey, gold and mother’s breast milk in the form of a paste. Preliminary experiments have been conducted in our laboratory with these selected sample extracts for gold nanoparticle synthesis. The biosynthesized gold nanoparticles were found to possess good antibacterial, anti-diabetic and anticancer activities. There is no research work related to RGO work with these extracts. In continuation to our recent endeavor in the biogenic synthesis of gold nanoparticles, herein we synthesize selected samples-mediated reduced graphene oxide and their antibacterial efficacy.
Acorus calamus aided gold nanoparticle coating on cotton fabric showed antibacterial and UV blocking applications [16], Acorus calamus mediated silver nanoparticles show potent antimicrobial activity [17]. RGO/AgNP nanocomposites prepared from Terminalia bellirica fruit extract have an appreciable catalytic application [18]. Helicteres isora fruit extract-mediated silver nanoparticles fight against clinically isolated human pathogens [19]. Green synthesized silver nanoparticles using Quercus infectoria showed effective antibacterial activity towards plant pathogenic bacteria [20].
Turbinella pyrum, commonly known as Chank shells or as conch shells are marine gastropod that belongs to the phylum Mollusca. Marine resources are a potential source of medicines [21–25]. Marine products are known to be used as folk medicine all around the globe. Skin diseases are traditionally treated using sea salt, and parasitic worms using algae [21, 26].
Graphene nanoparticle synthesis using these selected samples is least reported and also due to the abundance of graphene exploitation in various fields, present work targets at the synthesis of nanographene by consuming plant extracts and chank shell followed by its antimicrobial assay against E. coli, S. aureus, S. paratyphi and B. subtilis.
Materials and Methods
Graphite powder (Hi-Media India) was purchased. Doubly distilled water was used throughout the study. All chemicals used in the study are of AR grade. The selected plant parts for the biosynthesis of graphene nanoparticles are given in Table 1. They were purchased from an Ayurvedic medical shop at Ottappalam Village, Kerala, India.
Table 1.
Selected samples and its parts used for reduced graphene oxide synthesis
| S. no. | The binomial name of the plant | Plant part used | Sample code |
|---|---|---|---|
| 1 | Acorus calamus | Rhizome | ACCA |
| 2 | Terminalia bellirica | Dried fruit and seed | TB |
| 3 | Helicteres isora | Dried fruit and seed | HI |
| 4 | Quercus infectoria | Dried fruit and seed | QI |
| Sample from Animal kingdom | |||
| 5 | Turbinella pyrum | Whole chank shell | TP |
Preparation of Plant Extract
The selected plant parts were subjected to extraction at 80 °C by steam bath method. For the extraction at 80 °C, 4 g of the dried rhizome, dried fruit and seed parts and chank shell were finely grounded and added 40 ml doubly distilled water and treated under steam bath for 40 min. The solution was filtered using Whatmann No. 42 filter paper and allowed to cool. The filtrates thus obtained were used as bio-reducing agents to synthesize reduced graphene oxide. This solution was preserved and refrigerated at − 4 °C for further studies.
Graphene Oxide Preparation
Synthesis of graphene oxide was carried out with the modified procedure of Hummer’s method [27]. In ice-cold condition, graphite powder was treated with conc.H2SO4 followed by stirring for 2 h. For every 30 min, Potassium permanganate was added at 35 °C. Continuous stirring in an oil bath for 2 h at 50 °C was done for the mixture. This was then followed by adding doubly distilled water, for 30 min vigorous stirring was continued until the formation of dark brown suspension. H2O2 (30%) was added until the solution turned pale yellow. The obtained solution was filtered (with 10% HCl) and then with doubly distilled H2O to obtain uncontaminated graphene oxide. The graphene oxide obtained was then taken up for homogenization using an Ultrasonic homogenizer and dried in a vacuum.
Graphene Nanoparticles Synthesis by Sonication Method
Graphene oxide (1000 µg) was taken and treated with 25 ml doubly distilled water and sonicated for 1 h. All aqueous sample extracts prepared by steam bath method were added to the prepared graphene oxide solution (stable) and sonicated for 1–2 h until the colour change from brown colour to black.
Characterization Studies
The preliminary characterization of synthesized graphene nanoparticles were determined using UV–Vis spectroscopy. The UV–Vis absorption spectra of reduced graphene oxide were monitored using UV Bio Spec nano instrument, Shimadzu corporation-230 V. The absorption range was set to 220–600 nm. FT-IR analysis was done for the synthesized graphene nanoparticles to check the capping of biomolecules onto the surface of graphene nanoparticles. FT-IR analysis was done using instrument model FTIR SHIMADZU 2808, JAPAN. FESEM analysis helps in scanning the surface of the graphene nanoparticles to determine the surface topography and composition. Thus surface topography of synthesized graphene nanoparticles was confirmed using FE-SEM system(MIRA3), TESCAN, CZECH REPUBLIC; SEM through SE imaging, BSE imaging, In-beam SE imaging and EDX analysis (Oxford X-max 150). If the samples are not very conductive it may cause image distortion or drift. Hence all samples were gold-sputtered and made conducting.
X-ray diffraction study was carried out using X' Pert Pro system. Cu K radiation (λ = 1.54060 Å) operated at 45 kV and 30 mA over the range 2θ = 2°–70° with scanning rate 2°/min is followed. Raman spectroscopy was used to analyze the quality of synthesized graphene and thus provides a fingerprint of the molecule that helps in quick inspection of multiple layers of graphene. The Raman spectrum was obtained using R-3000 QE having an optical resolution of 6 cm−1.
Microorganisms Selected for the Study
Selected bacteria: four different bacteria S. aureus, B. subtilis, E. coli and S. paratyphi were selected for the present study. Positive control: Gentamycin (250 g/ml) was prepared using doubly distilled water and was taken as the positive standard.
Agar Well Diffusion Method
The studies were carried out by following standard procedures [28, 29]. Two types of agar, Agar Agar type1 (4 g) was mixed with Muller Hinton Agar (8 g) using 25 ml doubly distilled water and stirred well, placed in a microwave oven for 5 min. The mixture was turned to be viscous. It was transferred into petri dishes. After the plate gets cooled, each petri plate was divided into six parts. Wells (5 mm) were made on the agar plate using a cork borer under sterile conditions. The selected bacteria were swabbed on to the agar plate and the samples (20 µl) were injected into the specific wells using micropipette under sterile conditions.
The bacterial suspension (100 µL) (~ 104 and ~ 10 colony-forming unit (CFU/mL) of selected pathogenic bacteria, respectively) was spread in the agar plates. They were cultured in LB (Luria Bertani). Sterile paper disks (5 mm) were filled into the colloidal samples and kept on the agar plates. Disks were impregnated with gentamycin was also placed on nutrient agar, for positive controls also disk’s were impregnated. The incubation period of 24 h (at 37 °C) were observed for the plates. Zone of inhibition around the disks were then recorded.
Results
The aqueous sample extracts prepared by steam bath method when mixed with stable graphene oxide solution was then sonicated for 1–2 h gave graphene nanoparticles. The formation of biosynthesized graphene nanoparticles was confirmed by the colour change from brown colour solution to black (Fig. 1).
Fig. 1.
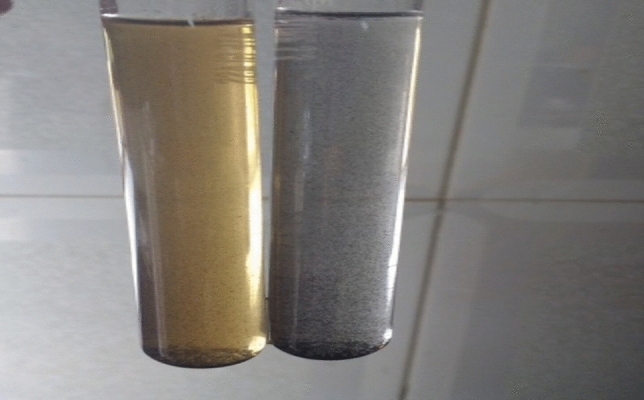
Brown coloured solution (plant extract) changes to black (reduced graphene oxide nanoparticles) confirms the formation of graphene nanoparticle
UV–Visible Spectral Analysis
The absorption peak was observed at 234 nm range for graphene oxide (Fig. 2a). This is due to the π–π* transition of the aromatic C–C bond. The absorption peaks of reduced graphene oxide were obtained at 278 nm for ACCARGO, 262 nm for TBRGO, 268 nm for HIRGO, 263 nm for QIRGO and 264 for TPRGO (Fig. 2b–f). The peaks at 278, 262, 268, 263 and 264 were red-shifted to 280, 269, 270 264 and 265 nm after 48 h reduction time. The weak shoulder at 300 nm is due to n–π* transitions (C = O bonds). The peak at 265 nm is considered to be a characteristic peak for S-rGO confirming the restoration of electronic conjugation.
Fig. 2.

UV–Visible spectra of a GO, b ACCA, c TB, d QI, e HI and f TP mediated reduced graphene oxide nanoparticles
Infrared Spectroscopy
The FTIR spectroscopic analysis showed bands at 1624.12 cm−1 due to the skeletal vibration of the un-oxidized graphitic domain. The peak at 1057.03 cm−1 is assigned to C-O (epoxy) groups. The peak at 1224.84 cm−1 and 3433.41 cm−1 are assigned to C–OH stretching vibration and O–H stretching vibration, respectively. The strong band at 1728.28 cm−1 is assigned to stretching vibration modes of C = O in carboxylic acid and a carbonyl group [30–35].
The IR spectral values of RGO samples are given in Table 2.
Table 2.
IR spectral values of Bio-templated RGO samples and their shape from FE-SEM monograph
| Sample code | IR spectral values (cm−1) | Figure | Shape of the RGO from FE-SEM (Fig. 6) |
|---|---|---|---|
| ACCARGO | 3325.28 | 3a | Dense, compact structure |
| 2125.56 | |||
| 1639.49 | |||
| TBRGO | 3336.85 | 3b | Layered structure |
| 2981.95 | |||
| 2310.72 | |||
| 1639.49 | |||
| HIRGO | 3834.49 | 3c | Layered structure |
| 3336.85 | |||
| 2310.72 | |||
| 1639.49 | |||
| QIRGO | 3336.85 | 3d | Staked, crumpled, flaky, scale-like layered structure |
| 2310.72 | |||
| 1631.78 | |||
| TPRGO | 3344.57 | 3e | Layered structure |
| 2310.72 | |||
| 1631.78 | |||
| 478.35 |
The bands at 3834.49, 2310.72, 2125.56 and 1639.49 cm−1 correspond to N–H stretching (presence of primary and secondary amides), C ≡ N stretching (nitriles), C ≡ C stretching, and C = C vibration (symmetry reduces intensity), respectively (Fig. 3a–e). The peaks at 1720 and 1610 cm−1 correspond to carbonyl and aromatic region, respectively, for graphene oxide. The absence of carbonyl group at 1670 cm−1 peak in the FTIR of reduced graphene specifies the formation of reduced graphene oxide. Also in Fig. 3e the band at 478.35 cm−1 is an evidence for the binding of the Calcium in TP to GO sheets [36].
Fig. 3.

FTIR spectra of reduced graphene oxide nanoparticles ACCARGO, TBRGO, QIRGO, HIRGO and TPRGO
X-ray Diffraction Analysis
XRD helps in investigating the crystalline nature and the interlayer changes of the synthesized graphene nanomaterial. XRD patterns of ACCARGO, TBRGO, HIRGO and QIRGO are shown in Fig. 4a–d. In contrast with ACCARGO, HIRGO and QIRGO the TBRGO shows a restacking of graphene layers which is evident from the broad peak which is centered at 2θ = 26.4°. This corresponds to a d spacing of 0.36 nm. ACCARGO, TBRGO, HIRGO, QIRGO and TPRGO X-Ray diffraction images reveal that they are amorphous.
Fig. 4.

XRD patterns of bio-templated reduced graphene oxides ACCARGO, HIRGO, TBRGO, QIRGO and TPRGO
Raman Spectroscopy
The two characteristic peaks of graphene are the D band at 1350 cm−1 and G band at 1575 cm−1. In the present study, the synthesized RGO shows the corresponding bands of D and G band appearing at 1354 and 1594.9 cm−1, respectively. Figure 5 shows the Raman spectrum of TBRGO. The characteristic 2D band can be attributed to the graphene sheets staking and one can differentiate single layer and multilayer graphene. In the present study disappearance of 2D bands was noted which confirms the absence of single-layer graphene.
Fig. 5.

Raman spectrum of TB-mediated graphene nanoparticles (TBRGO)
Scanning Electron Microscopy
Field Emission Scanning Electron Microscopy (FESEM) was employed to analyze the morphology of RGO. FESEM images of ACCARGO, TBRGO, HIRGO and QIRGO are presented in figures (Fig. 6) The FESEM images of ACCARGO at 1 µm (Fig. 6a) seem to form a dense, compact structure. The surface morphology looks like a strongly folded curtain which indicates that RGO flakes are overlapped and not aggregated. The FESEM image of TBRGO was taken at 2 µm range. The TBRGO are composed of layered structures. The HIRGO is composed of layered structures, which is part of the intrinsic nature of graphene. The thickness of TBRGO was 5 nm. The micrograph of RGO thin-film displayed evenly distributed indicating that graphene sheets in TBRGO overlapped each other (Fig. 6b). In QIRGO fold structure can be found on both the surface and the edge. QIRGO exhibit staked, crumpled, flaky, scale-like layered structure. FESEM image shows the exfoliated but wrinkled and merely aggregated RGO sheets (Fig. 6a), which is commonly seen in oxidation/reduction based methods [37, 38].
Fig. 6.

FESEM images of graphene nanoparticles a ACCARGO, b TBRGO, c HIRGO and d QIRGO
Antibacterial Assay of Aqueous Plant Extracts
The aqueous plant extracts show better and moderate inhibitory activity against the pathogenic bacteria when compared to the standard (Table 3). All extracts showed specific inhibitory activities against the pathogenic bacteria.
Table 3.
Anti-bacterial assay of aqueous plant extracts
| Selected samples (150 µl) | Pathogenic bacteria (inhibition zone, mm) | |||
|---|---|---|---|---|
| E. coli | S. aureus | S. paratyphi | B. subtilis | |
| Acorus calamus (STD-15) | 12 | 11 | 8 | 10 |
| Terminalia bellirica (STD-16) | 13 | 8 | 10 | 7 |
| Helicteres isora (STD-20) | 15 | 10 | 11 | 8 |
| Quercus infectoria (STD-17) | 12 | 11 | 14 | 8 |
| Turbinella pyrum (STD-18) | 15 | 4 | 11 | 7 |
Anti-bacterial Assay of Biosynthesized Reduced Graphene Oxide
The antibacterial efficacy of prepared reduced graphene oxide against Gram-positive and Gram-negative bacterial strains; S. aureus, B. subtilis, S. paratyphi and E. coli were evaluated by Agar well diffusion method.
The inhibition zone calculated for standard gentamycin was 29 mm. Acorus calamus reduced graphene nanoparticles ACCARGO showed moderate inhibition zone 18 mm (150 µl) against E. coli bacteria and significant inhibition zone 21, 22 and 20 mm (150 µl) against S. aureus, S. paratyphi and B. subtilis, respectively (Fig. 7). T. bellirica reduced graphene nanoparticles showed good inhibition zone 20 mm (150 µl) against S. aureus and moderate zone 16, 19 and 18.5 mm against E. coli, S. paratyphi and B. subtilis (Table 4).
Fig. 7.

Images revealing zone of inhibition of biosynthesized reduced graphene oxide against a S. aureus, b B. subtilis, c E. coli and d S. paratyphi
Table 4.
ZOI obtained for synthesized reduced graphene oxide against pathogens
| S. no. | Sample code | Concentration (µl) | E. coli | S. aureus | S. paratyphi | B. subtilis |
|---|---|---|---|---|---|---|
| Inhibition zone (mm) | ||||||
| 1 | ACCARGO | 50 | 16 | 19 | 19 | 18 |
| 2 | ACCARGO | 100 | 18 | 20 | 20 | 19 |
| 3 | ACCARGO | 150 | 18 | 21 | 22 | 20 |
| 4 | TBRGO | 50 | 15 | 18 | 18 | 16 |
| 5 | TBRGO | 100 | 16 | 19 | 18 | 16 |
| 6 | TBRGO | 150 | 16 | 20 | 19 | 18.5 |
| 7 | HIRGO | 50 | 16 | 21 | 20 | 16 |
| 8 | HIRGO | 100 | 18 | 23 | 20 | 16.5 |
| 9 | HIRGO | 150 | 19 | 23.5 | 23 | 17.5 |
| 10 | QIRGO | 50 | 17 | 18 | 14 | 16 |
| 11 | QIRGO | 100 | 19 | 20 | 15 | 18 |
| 12 | QIRGO | 150 | 27 | 28 | 18 | 22 |
| 13 | TPRGO | 50 | 12 | 13 | 12 | 10 |
| 14 | TPRGO | 100 | 12 | 14 | 12 | 11 |
| 15 | TPRGO | 150 | 13 | 15 | 15 | 11 |
| 16 | Positive control | 29 | ||||
Helicteres isora reduced graphene oxide showed significant inhibition zone 23.5 and 23 mm against S. aureus and S. paratyphi and moderate zone 19 and 17.5 mm against E. coli and B. subtilis. It was observed that Quercus infectoria reduced graphene oxide showed excellent inhibition efficiency against E. coli and S. aureus. It also showed significant and moderate inhibition against B. subtilis and S. paratyphi, respectively. Turbinella pyrum reduced graphene oxide always exhibited less inhibition efficiency against the aforesaid bacteria when compared to the other plant-mediated samples (Table 3) which may be due to the absence of active constituents or more Calcium presence in it [39].
Discussion
From UV–visible spectroscopy, the peaks for π–π* transition of the aromatic C–C bond is present. The optical absorption of all S-reduced GO was higher than that of GO as confirmed by the colour change of GO from brownish colour to black colour [40]. In agreement with Gurunathan et al. results, Thakur and Karak observed a characteristics peak value at 268 nm using phytoextracts for both Camellia sinensis peel aqueous extract-reduced GO and Mesua ferrea leaf aqueous extract-reduced GO [41]. These observations go in par with our observation from the UV–Visible spectra and can confirm the formation of reduced graphene oxide.
The peaks obtained from FT-IR ensure the formation of reduced graphene oxide in each sample. The synergistic effects of sound waves (sonication method) have altered the reaction behaviour of the phytoconstituents in the plant parts. This must be the possible reason for the reduction of GO. Studies reveal that the naturally occurring polyphenols present in T. bellirica extract were responsible for the reduction of GO to T. bellirica mediated synthesized RGO. It was also reported that polyphenols in T. bellirica stabilized the formed reduced graphene oxide nanosheets by preventing their aggregation [42]. Similarly the secondary metabolites might be the reason for the reduction of GO to reduced graphene oxide. The XRD pattern reveals that Terminalia bellirica extracts as suitable reducing agents capable of reducing GO. The possible mechanism may be removing intercalated water molecules and oxide groups in GO by the plant metabolites. The peaks obtained in Raman spectra of TBRGO might be due to the decrease in size of the in-plane sp2 domains due to oxidation and ultrasonic exfoliation and partially ordered graphite crystal structure of graphene nanosheets [43]. From FE-SEM monographs the surface and morphological characteristics of the reduce graphene oxides were obtained. The synthesized nano materials withstand the kV applied while recording the FE-SEM (5–25 kV). This shows the stability of the plant mediated reduced graphene oxides.
The synthesized reduced graphene oxide shows excellent anti-bacterial efficacy. The bacterial efficacy of Turbinella pyrum mediated reduced graphene oxide is commendable as Turbinella pyrum belongs to animal kingdom. CaCO3 is the major constituent in chank shell. CaCO3 mediated nanoparticles were found to be an efficient anti-bacterial agent against Agrobacterium tumefaciens [44]. Also Ca2+ doped graphene oxides were found to be multi-functional [45]. Among the selected samples Quercus infectoria reduced graphene oxide showed excellent inhibition efficiency. It was also observed that plant-mediated nanoparticles and chank shell mediated nanoparticles showed most inhibition against S. aureus when compared to E. coli, S. paratyphi and B. subtilis.
The plant extracts showed better inhibition efficacy and this may be due to the active phytoconstituents present in the extracts. The excellent inhibition efficiency against pathogenic bacteria of Quercus infectoria mediated reduced graphene oxide may be due to the presence of active constituent tannins in it. On a comparison between plant extract and biosynthesized reduced graphene oxide, graphene embedded plant extract showed more bacterial efficacy than plant extracts and may be due to the capping of biomolecules onto the biosynthesized RGO that enhances antibacterial action.
Several factors affect the antibacterial properties of graphene-based materials. Some of them to mention are Lateral size, Particle shape, Surface modifications, agglomeration and dispersion [46]. The lateral size of graphene-based materials prepared by the redox process is usually influenced by the synthesis method, and defects are often present. Meanwhile, a smaller lateral scale of the manufactured substance is correlated with more defects [47]. More number of defects in the GO nano sheets will possess higher antimicrobial activity against E. coli [48]. The shape of nanoparticles has a big impact on their antimicrobial activity. The sharp edges of GO nanowalls (GONWs) and rGO nanowalls (RGNWs) have been shown to greatly reduce the rate of survival of both S. aureus and E. coli. Similarly RGO prevented E. coli proliferation, but no cytotoxicity was found in combination with GO. [49]. RGO particles are prone to agglomeration due to their high surface energies. This property changes the nanoparticles' edge and surface properties, affecting their antimicrobial activity [50]. Akhavan et al. reported that RGO is more effective than GO at inactivating bacteria, which is due to E. coli trapping and the tendency of RGO aggregates in suspension to eventually wrap bacteria [51]. Oxidative stress and membrane stress are the major reason for anti-bacterial activities of RGO’s. There are reports on cell viability, DNA fragmentation, and ROS production assays used to assess the antibacterial function of synthesized RGO. Raman spectroscopy and X-ray diffraction were used to describe RGO, which was made by reducing GO with dithiothreitol. The findings showed that RGO had antimicrobial activity against E. coli that was time and concentration dependent [52]. Similarly the antibacterial action of RGO and GO nanosheets accumulated on stainless steel as nanowalls against E. coli and S. aureus showed that E. coli was more resistant to cell membrane damage caused by nanowalls than S. aureus. Furthermore, RGO nanowalls were found to be more bacterially toxic than GO nanowalls. The explanation for the disparity in operation between the two nanowalls was proposed to be due to RGO nanowalls' sharper edges and smoother charge transfer [49]. Another research looked at the effects of GO and RGO on S. aureus and P. aeruginosa growth, and found that GO inhibited S. aureus and P. aeruginosa growth by 93.7% and 48.6%, respectively, while RGO inhibited growth by 67.7% and 93.3%, respectively. The antibacterial function was attributed to GO disrupting the bacteria's cell membrane via a chemical reaction, while RGO mediated mechanical tension, piercing the cell membrane. The shape and variety of bacteria were the deciding factors in graphene's bactericidal effectiveness [53, 54].
Several physical–chemical properties also depend on the antibacterial activities of the RGO’s. Among them the number of layers of RGO plays a pivotal role in the bactericidal activity. Increased layers cause a diminished "nano knife" effect, decreased dispersibility, and increased aggregation propensity, resulting in less interaction between RGO and microorganisms. Both the edges and the surface of RGO play important roles in antimicrobial action, and the number of layers determines the surface properties that cause basal plane antimicrobial activity. It can be summarized that the few layer graphene acts as a better anti-bacterial agent than single layer graphene [47]. In the present study, from the FE-SEM monographs it is clear that the synthesized RGO are of few layers which have arranged as sheets. This might be the reason for the enhanced bactericidal activities of the synthesized bio-templated RGO’s.
In this study the plant mediated RGO shows antibacterial activity, the quantity required for oral consumption and related toxicity and in vivo anti-bacterial activity of the synthesized reduced graphene oxides are warranted. To fully comprehend and develop synthesized RGO’s antibacterial activity, as well as to compare this activity with the innate immune system as promising future relevant biomaterials for simultaneous tissue regeneration and possible antibiotic substitution a substantial amount of evidence is further needed.
Conclusion
The present research work results are the quite promising basis for the advancement of anti-bactericidal activity of plant-mediated graphene nanoparticles and chank shell mediated graphene nanoparticles. To the best of our knowledge, no other bactericidal activity or green synthesis of T. pyrum graphene nanoparticles has been reported to date. The simple, stable and eco-friendly method of biosynthesizing graphene nanoparticles was effectively developed using A. calamus (rhizome), dried fruit and seed parts of T. bellirica, H. isora, Q. infectoria and T. pyrum (chank shell) extracts. The extract acts as both reducing and stabilizing agent which was confirmed by both UV–Visible, FT-IR and XRD studies. FESEM reports revealed that synthesized graphene nanoparticles exhibited good surface topography with different shapes. These biosynthesized RGO was found to have significant antibacterial properties against selected bacteria. Among the selected samples Quercus infectoria RGO showed excellent inhibition efficiency 27 and 28 mm against E. coli and S. aureus.
Acknowledgements
The authors wholeheartedly acknowledge Bharat Ratna Prof. C.N.R Rao Research Centre, Avinashilingam Institute for Home Science and Higher Education for Women for the instrumental facility and infrastructural facilities and to DST for providing Chemicals under DST-CURIE phase II grant.
Declarations
Conflict of interest
On behalf of all authors, the corresponding author states that there is no conflict of interest.
Footnotes
Publisher's Note
Springer Nature remains neutral with regard to jurisdictional claims in published maps and institutional affiliations.
References
- 1.Shamaila S, Leghari Sajjad AK, Ryma N, Farooqi SA, Jabeen N, Majeed S, Farooq I. Appl. Mater. Today. 2016 doi: 10.1016/j.apmt.2016.09.009. [DOI] [Google Scholar]
- 2.Pandey P, Dahiya M. J. Crit. Rev. 2016;3:18. [Google Scholar]
- 3.Vauthier C, Dubernet C, Chauvierre C, Brigger I, Couvreur P. J. Control Release. 2003;93:151. doi: 10.1016/j.jconrel.2003.08.005. [DOI] [PubMed] [Google Scholar]
- 4.Xu P, Van Kirk EA, Zhan Y, Murdoch WJ, Radosz M, Shen Y. Angew. Chem. Int. Ed. Engl. 2007 doi: 10.1002/anie.200605254. [DOI] [PubMed] [Google Scholar]
- 5.Adeyemi OS, Molefe NI, Awakan OJ, Nwonuma CO, Alejolowo OO, Kato K. Artif. Cells Nanomed. Biotechnol. 2018 doi: 10.1080/21691401.2018.1489267. [DOI] [PubMed] [Google Scholar]
- 6.Christopher P, Patel AA. Nano Express. 2020;1:012001. doi: 10.1088/2632-959X/ab8075. [DOI] [Google Scholar]
- 7.Randviir EP, Brownson DAC, Banks CE. Mater. Today. 2014 doi: 10.1016/j.mattod.2014.06.001. [DOI] [Google Scholar]
- 8.Chen X, Xin H, Wang XHJ. Anal. Chim. Acta. 2016 doi: 10.1016/j.aca.2016.03.050. [DOI] [PubMed] [Google Scholar]
- 9.Hanaa MH, Ahmed E, Linda Z, Dennis M, Christopher PS, Milena G. Carbon. 2016 doi: 10.1016/j.carbon.2016.04.046. [DOI] [Google Scholar]
- 10.Nikaido H. Annu. Rev. Biochem. 2009 doi: 10.1146/annurev.biochem.78.082907.145923. [DOI] [PMC free article] [PubMed] [Google Scholar]
- 11.Van Duin D, Paterson DL. Infect. Dis. Clin. N. Am. 2016 doi: 10.1016/j.idc.2016.02.004. [DOI] [PMC free article] [PubMed] [Google Scholar]
- 12.Yousefi M, Dadashpour M, Hejazi M, Hasanzadeh M, Behnam B, et al. Mater. Sci. Eng. C Mater. Biol. Appl. 2016 doi: 10.1016/j.msec.2016.12.125. [DOI] [PubMed] [Google Scholar]
- 13.Bakhsheshi-Rad HR, Hamzah E, Kasiri-Asgarani M, Saud SN, Yaghoubidoust F, Akbari E. Vacuum. 2016 doi: 10.1016/j.vacuum.2016.05.021. [DOI] [Google Scholar]
- 14.Fakhri A, Kahi DS. J. Photochem. Photobiol. B Biol. 2017 doi: 10.1016/j.jphotobiol.2016.12.017. [DOI] [PubMed] [Google Scholar]
- 15.Zhanga H, Zhanga C, Zenga GM, Gonga JL, Oub XM, Huanc SY. J. Colloid Interface Sci. 2016 doi: 10.1016/j.jcis.2016.03.015. [DOI] [Google Scholar]
- 16.Chawla V, Sathaye S. J. Med. Plants Stud. 2017;5:358–363. [Google Scholar]
- 17.Ganesan RM, Prabu HG. Arab. J. Chem. 2015 doi: 10.1016/j.arabjc.2014.12.017. [DOI] [Google Scholar]
- 18.Kadiyala NK, Mandal BK. J. Indian Chem. Soc. 2016;93:1–9. [Google Scholar]
- 19.Annavaram V, Jorepalli S, Babu YNR, Posa VRP, Reddy SA. Int. J. Adv. Res. Phys. Sci. 2015;2:34–42. [Google Scholar]
- 20.Chahardooli M, Khodadadi E. Int. J. Biosci. 2014 doi: 10.12692/ijb/4.3.97-103. [DOI] [Google Scholar]
- 21.R.R.N Alves, T.P.R Oliveira, I.L Rosa and A.B.Cunningham (2012). Animals in Traditional Folk Medicine. 263–287. 10.1007/978-3-642-29026-8_12
- 22.Alino PM, Cajipe GJB, Ganzon-Fortes ET, Licuanan WRY, Montano NE, Tupas LM. Supplement of SICEN Newsletter. Quezon City: Seaweed Information Center (SICEN); 1990. [Google Scholar]
- 23.Alves RRN, Alves HN. J. Ethnobiol. Ethnomed. 2011;7:1. doi: 10.1186/1746-4269-7-1. [DOI] [PMC free article] [PubMed] [Google Scholar]
- 24.Alves RRN, Rosa IL, Santana GG. Bioscience. 2007;57:949–955. doi: 10.1641/0006-3568(2008)58[7:C]2.0.CO;2. [DOI] [Google Scholar]
- 25.A. Perry, Global survey of marine medicinals, in M.-A. Moreau, H. J. Hall, A. C. J. Vincent (eds.), Proceedings of the First International Workshop on the Management and Culture of Marine Species used in Traditional Medicines (Project Seahorse, Montreal, 2000), pp. 35–43.
- 26.Schröder T. World Ocean Review. Hamburg: Maribus; 2010. [Google Scholar]
- 27.Firdhouse MJ, Lalitha P. Int. Nano Lett. 2014 doi: 10.1007/s40089-014-01254. [DOI] [Google Scholar]
- 28.Sasidharan S, Pottail L. J. Plant Biochem. Biotechnol. 2020 doi: 10.1007/s13562-019-00523-1. [DOI] [PubMed] [Google Scholar]
- 29.Chithambharan A, Pottail L, Mirle RM, et al. Indian J. Microbiol. 2021 doi: 10.1007/s12088-021-00937-3. [DOI] [PMC free article] [PubMed] [Google Scholar]
- 30.Yoo D, Kim J, Kim JH. Nano Res. 2014 doi: 10.1007/s12274-014-0433-z. [DOI] [Google Scholar]
- 31.Yang B, Liu Z, Guo Z, Zhang W, Wan M, Qin X, Zhong H. Appl. Surf. Sci. 2014 doi: 10.1016/j.apsusc.2014.07.084. [DOI] [Google Scholar]
- 32.Nyangiwe NN, Khenfouch M, Thema FT, Nukwa K, Kotsedi L, Maaza M. Graphene. 2015 doi: 10.4236/graphene.2015.43006. [DOI] [Google Scholar]
- 33.Somanathan T, Prasad K, Ostrikov KK, Saravanan A, Krishna VM. Nanomaterials. 2015 doi: 10.3390/nano5020826. [DOI] [PMC free article] [PubMed] [Google Scholar]
- 34.Wojtoniszak ME. J. Nanopart. Res. 2012 doi: 10.1007/s11051-012-1248-z. [DOI] [PMC free article] [PubMed] [Google Scholar]
- 35.Liu F, Cao Y, Yi M, Xie L, Huang W, Tang N, Zhong W, Du Y. Crystals. 2013 doi: 10.3390/cryst3010028. [DOI] [Google Scholar]
- 36.Castro KLS, Curti RV, Araujo JR, Landi SM, et al. Thin Solid Films. 2020 doi: 10.1016/j.tsf.2016.04.042. [DOI] [Google Scholar]
- 37.Marcano DC, Kosynkin DV, Berlin JM, Sinitskii A, et al. ACS Nano. 2010 doi: 10.1021/nn1006368. [DOI] [PubMed] [Google Scholar]
- 38.Gao W, Alemany LB, Ci L, Ajayan PM. Nat. Chem. 2009 doi: 10.1038/nchem.281. [DOI] [PubMed] [Google Scholar]
- 39.ChandraShekar M, Arularasan S, Nathani NM, Zaman GU, Joshi CG. Mar. Ecol. 2016 doi: 10.1111/maec.12312. [DOI] [Google Scholar]
- 40.Gurunathan S, Han J, Eppakayala V, Dayem A, Kwon DN, Kim JH. Nanoscale Res. Lett. 2013 doi: 10.1186/1556-276X-8-393. [DOI] [PMC free article] [PubMed] [Google Scholar]
- 41.Thakur S, Karak N. Carbon. 2012 doi: 10.1016/j.carbon.2012.07.023. [DOI] [Google Scholar]
- 42.Sireesh M, Mandal BK. Curr. Nano Sci. 2015 doi: 10.2174/1573413711666150520224358. [DOI] [Google Scholar]
- 43.Wang G, Yang J, Park J, Gou X, Wang B, Liu H, Yao J. J. Phys. Chem. C. 2008 doi: 10.1021/jp710931h. [DOI] [Google Scholar]
- 44.Ataee RA, Derakhshanpour J, Mehrabi Tavana A, Eydi A. Iran. J. Mil. Med. Summer. 2011;13:65. [Google Scholar]
- 45.Tadyszak K, Wychowaniec JK, Załeski K, Coy E, Majchrzycki L, Carmieli R. Nanomaterials. 2020 doi: 10.3390/nano10050957. [DOI] [PMC free article] [PubMed] [Google Scholar]
- 46.Mohammed H, Kumar A, Bekyarova E, Al-Hadeethi Y, Zhang X, Chen M, Ansari MS, Cochis A, Rimondini L. Front. Bioeng. Biotechnol. 2020 doi: 10.3389/fbioe.2020.00465. [DOI] [PMC free article] [PubMed] [Google Scholar]
- 47.Zou X, Zhang L, Wang Z, Luo Y. J. Am. Chem. Soc. 2016 doi: 10.1021/jacs.5b11411. [DOI] [PubMed] [Google Scholar]
- 48.Perreault F, de Faria AF, Nejati S, Elimelech M. ACS Nano. 2015 doi: 10.1021/acsnano.5b02067. [DOI] [PubMed] [Google Scholar]
- 49.Akhavan O, Ghaderi E. ACS Nano. 2010 doi: 10.1021/nn101390x. [DOI] [PubMed] [Google Scholar]
- 50.Wick P, Manser P, Limbach L, Dettlaffweglikowska U, Krumeich F, Roth S, et al. Toxicol. Lett. 2007 doi: 10.1016/j.toxlet.2006.08.019. [DOI] [PubMed] [Google Scholar]
- 51.Akhavan O, Ghaderi E, Esfandiar A. J. Phys. Chem. B. 2011 doi: 10.1021/jp200686k. [DOI] [PubMed] [Google Scholar]
- 52.Gurunathan S, Han JW, Dayem AA, Eppakayala V, Park MR, Kwon DN, Kim JH. J. Ind. Eng. Chem. 2013 doi: 10.1016/j.jiec.2012.12.029. [DOI] [Google Scholar]
- 53.Sengupta I, Bhattacharya P, Talukdar M, Neogi S, Pal SK, Chakraborty S. Colloid Interface Sci. Commun. 2019 doi: 10.1016/j.colcom.2018.12.001. [DOI] [Google Scholar]
- 54.Kumar P, Huo P, Zhang R, Liu B. Antibacterial properties of graphene-based nanomaterials. Nanomaterials (Basel). 2019 doi: 10.3390/nano9050737. [DOI] [PMC free article] [PubMed] [Google Scholar]