Abstract
The ability to calculate whether small molecules will cross the blood brain barrier (BBB) is an important task for companies working in neuroscience drug discovery. For a decade, scientists have relied on relatively simplistic rules such as Pfizer’s central nervous system multiparameter optimization models (CNS-MPO) for guidance during the drug selection process. In parallel, there has been a continued development of more sophisticated machine learning models that utilize different molecular descriptors and algorithms; however, these models represent a “black box” and are generally less interpretable. In both cases these methods predict the ability of small molecules to cross the BBB using the molecular structure information on its own without in vitro or in vivo data. We describe here the implementation of two versions of Pfizer’s algorithm (Pf-MPO.v1 and Pf-MPO.v2) and compare it with a Bayesian machine learning model of BBB penetration trained on a dataset of 2296 active and inactive compounds using extended connectivity fingerprint descriptors. The predictive ability of these approaches was compared with 40 known CNS active drugs initially used by Pfizer as their positive set for validation of the Pf-MPO.v1 score. 37/40 (92.5%) compounds were predicted as active by the Bayesian model while only 30/40 (75%) received a desirable Pf-MPO.v1 score ≥ 4 and 33/40 (82.5%) received a desirable Pf-MPO.v2 score ≥ 4, suggesting the Bayesian model is more accurate than MPO algorithms. This also indicates machine learning models are more flexible and have better predictive power for BBB penetration than simple rulesets that require multiple, accurate descriptor calculations. Our machine learning model statistics are comparable to recent published studies. We describe the implications of these findings and how machine learning may have a role alongside more interpretable methods.
Keywords: Bayesian, Blood brain barrier, central nervous system multiparameter optimization models
Graphical Abstract
INTRODUCTION
Over the past few decades there have been considerable efforts to identify rules to describe compounds that have the ideal molecular properties to cross the blood brain barrier (BBB) or become successful central nervous system (CNS) targeting drugs 1, 2. The many approaches to understand the property space for drugs with exposure in the mouse brain have been briefly summarized in previous work 1, 2. In addition, there have been many publications describing computational models such as quantitative structure property relationships (QSPR) 3 or machine learning models that were used to predict CNS activity or BBB penetration. In just the last few years we have seen the application of support vector machines (SVM) 4, 5, genetic algorithms 4, random forest, gradient boosting, logistic regression 6, deep learning 7, recurrent neural networks 8 and light gradient boosting machine 9 using structural descriptor-based approaches 10.
Some of the simplest but most widely used computational approaches are relatively simple and interpretable rules. Most notably, in 2010, Wager et al. published their analysis of 119 CNS drugs and method development to score 108 CNS candidates from Pfizer programs using a multiparameter optimization (MPO) algorithm 11. They built this MPO (referred to throughout as Pf-MPO.v1) algorithm using six molecular properties (ClogP, ClogD, MW, TPSA, HBD and pKa) resulting in a 6-point scale. When applied to the analyzed set of 119 marketed drugs, 74% scored favorably (using a 4 threshold); in comparison, only 60% of Pfizer’s own candidates scored favorably. Subsequently this algorithm was further tuned towards BBB penetration (referred to throughout as Pf-MPO.v2) and applied to 21 new CNS candidates, of which 77% were found to score ≥ 4 12. This prediction tool was also proposed to help reduce the number of candidates requiring exploratory toxicity studies and ensure they cross the BBB 12. This MPO approach has subsequently been widely implemented or improved upon in pharmaceutical companies 1, 2. Interestingly, the algorithm has not been made commercially available or benchmarked against other methods or machine learning models to our knowledge.
We now describe the development of a script to replicate the original 11 and more recently updated Pfizer MPO algorithms 1, 2, referred throughout this study as CPI-MPO.v1 and CPI-MPO.v2, respectively. Additionally, we present a comparison of molecular descriptors necessary for the MPO algorithms produced by ChemAxon (Budapest, Hungary), Advanced Chemistry Development, Inc. (ACD) used in Wager et al., 2010 11, and Discovery Studio (Biovia, San Diego, CA) and show that discrepancies between descriptors can lead to different MPO scores and ultimate different decisions made for a potential drug. Furthermore, we describe the development of a novel Bayesian BBB machine learning model based on published data, and the subsequent comparison of its predictive ability against the MPO scores on a set of compounds. This study illustrates the steps required to implement an MPO calculator that is comparable to that initially described by Pfizer and others 1, 2, 11 in the absence of a standalone commercial product. It also illustrates the considerable variability that can be obtained when using simple descriptors calculated by different commercial software.
RESULTS AND DISCUSSION
We have created an in-house script to implement the three functions (i.e. monotonic decreasing, hump and desirability) utilized to calculate the original MPO score previously described by Pfizer in Wager et al., 2010 11. We validated this CPI-MPO.v1 algorithm with the same 119 compounds evaluated in the supplementary data table provided in Wager et al., 2010, which provided the six molecular descriptors necessary to calculate the MPO score as well as the Pf-MPO.v1 score itself which we can compare against. The Pf-MPO.v1 score is defined as: Pf-MPO.v1 = ∑ (t0_cLogP, t0_cLogD, t0_MW, t0_TPSA, t0_pKa, t0_HBD). The CPI-MPO.v1 scores using the provided supplementary descriptors are similar, but do not exactly match the Pf-MPO.v1 scores provided by Wager et al., 2010 11 (Figure 1).
Figure 1.
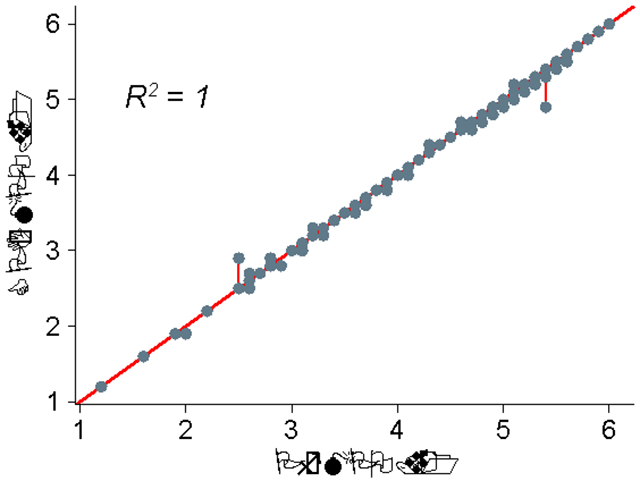
Comparison of CPI-MPO.v1 score and Pf-MPO.v1. Scores that perfectly align appear on the diagonal red line (P << 0.005).
This difference is most likely due to the ClogP values in the Wager et al., 2010 supplemental table having been rounded to the second significant digit, while the CPI-MPO.v1 values provided were calculated from the raw, non-rounded data provided. This is obvious if we compare the results of the monotonic decreasing function applied to the supplementary data given against what the actual results of their function are 11. The linear decreasing segment of the monotonic function should display an exact straight line with no deviations; our function provides that linear decrease with no deviations, while the values from Wager et al., 2010 show stepwise changes in the T0 ClogP values (Figure 2) due to the rounding procedure.
Figure 2.
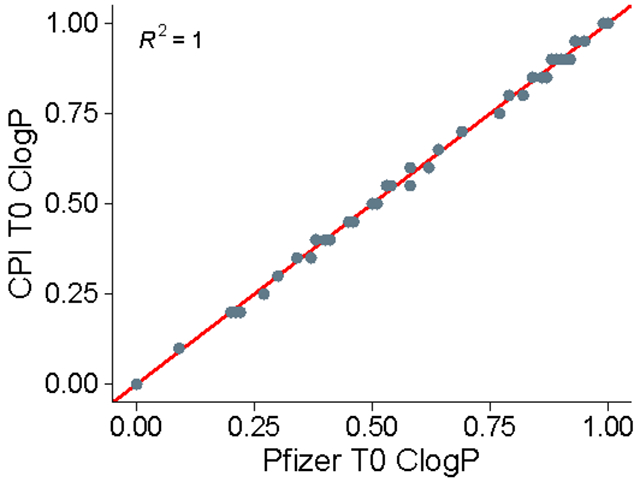
Correlation between our T0 ClogP calculation and Pfizer T0 ClogP (P << 0.005).
If the linear transform is the same, clearly the original ClogP values graphed in Wager et al., 2010 are different from the ClogP values given. If we look at the supplementary table from their publication of ClogP values and their transformed T0 ClogP values, we see that the same ClogP values are given different transformed T0 ClogP values (Table S1). Finally, we can convince ourselves by calculating the actual values expected. Using the equation for the monotonic decreasing function:
and input the correct values to generate the Pf-MPO.v1 scores from the supplementary table of Wager et al., 2010 11. For example, a ClogP value of 3.1 results in a T0 ClogP of 0.95, the exact result produced from three drugs/candidates analyzed in Wager et al., 2010 11 (Table S1) as well as the CPI-MPO.v1 function. Therefore, the CPI-MPO.v1 script is correct and can be used to accurately calculate a MPO score from ChemAxon molecular descriptors.
After verification of the CPI-MPO.v1 function, we next turned to generating the six molecular descriptors upstream of the MPO calculation and implementing them into a pipeline. Using the full list of public compounds from Wager et al., 12, we compared the six descriptors generated from ChemAxon software against the ACD descriptors used by Pfizer (Figure 3). The majority of descriptors match up well with little bias, with variance contributing to most of the difference between clogP, clogD, and pKa due to variability in the calculation of these properties. Of note, MW and TPSA are almost identical between ChemAxon and ACD. pKa values below 1 were all set to 1 (black dotted line) in the Pfizer dataset. This makes no difference in the overall MPO score, as values below 1 fall well within the “acceptable” range according to the monotonic transformation, and, thus, their transformed values are exactly the same. Since such rounding up transformation does not affect the final calculated score, we elected to retain the raw pKa values in the CPI-MPO.v1 function. HBD values are discrete integers. Of note, the Pfizer calculations show a positive bias compared to the ChemAxon calculations (Figure 3).
Figure 3.
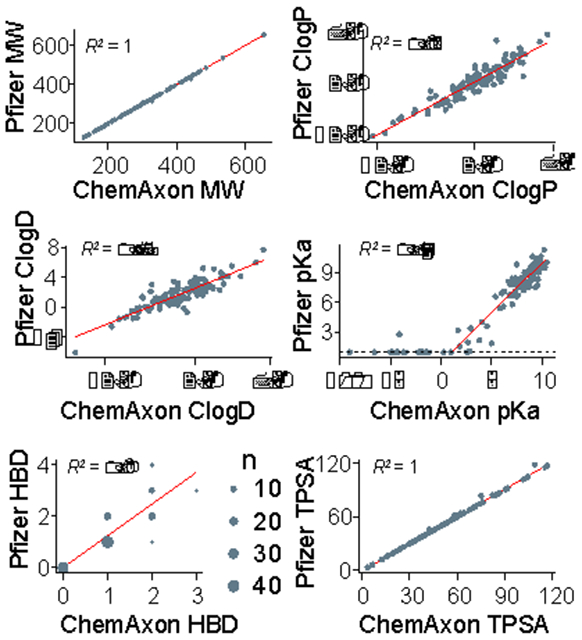
Set of molecular descriptors generated from ChemAxon vs. ACD, using the same chemical structures. Black line in D) indicates “1” on the y-axis (P << 0.005 for all).
Although the correlation between the CPI-MPO.v1 and the Pf-MPO.v1 scores for the same compounds is acceptable, with an R2 of 0.81 (Figure 4), there are marked differences. All scores fall along the identity line with little bias, but still with clear variability (Figure 4). As described above, the CPI-MPO.v1 calculation is an exact mathematical match of the Pfizer calculation (i.e., Pf-MPO.v1), so the differences lie solely in the descriptors generated from ChemAxon and ACD labs.
Figure 4.
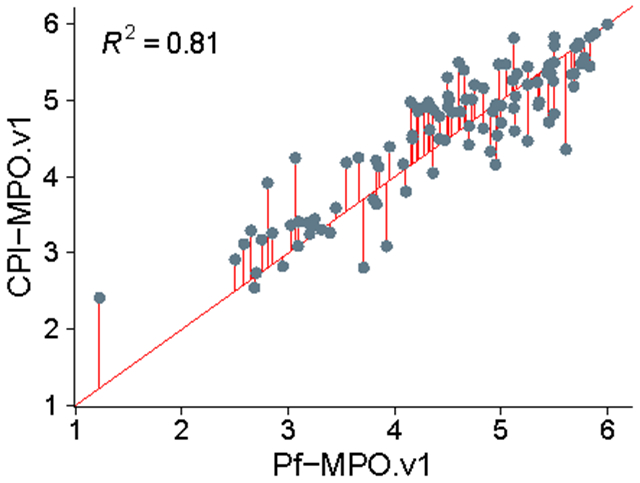
Correlation between resulting CPI-MPO.v1 score calculated with ChemAxon descriptors and Pf-MPO.v1 score calculated with ACD descriptors (P << 0.005).
If we next subtract the two calculated MPO scores (Pf-MPO.v1 and CPI-MPO.v1) element-wise for each compound, we see that the majority of CNS-MPO scores are less than 1 point from each other (Figure 5, ~95% highest density interval falls between −0.832 and 0.9). There is a slight bias between the two MPO scores (mean of MPO-difference= −0.11), with the Pf-MPO.v1 exhibiting a slightly lower MPO score overall. The majority of compounds fall within the same “range” of MPO scores, and only scores around the threshold MPO score of 4 may be scored differently due to differences in descriptor values. For example, we did not observe a compound that produced a Pf-MPO.v1 score of 5 and a CPI-MPO.v1 score of 1-3.
Figure 5.
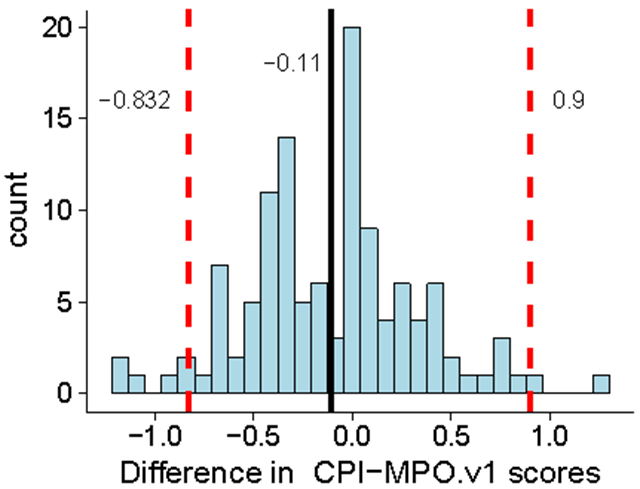
Difference in MPO.v1 scores. Red lines indicate highest density interval (~95% of data). Black line indicates mean difference.
As a further comparison we used another commercial product (Discovery Studio) to calculate the descriptors needed for the MPO algorithms (Figure S2). The Discovery Studio ClogP calculator was generally comparable to the ACD-derived values. On the contrary, the logD and pKa from Discovery Studio showed much weaker correlations with ACD descriptors than those from ChemAxon (Figure S2). The Discovery Studio TPSA calculation, while showing a good correlation, often predicted a higher TPSA on average than ChemAxon or Pfizer. Interestingly, the CPI-MPO.v1 scores generated with Discovery Studio descriptors result in a correlation with the Pf-MPO.v1 scores of R2 = 0.69 (Figure S3). This is lower than the R2 = 0.81 observed with CPI-MPO.v1 scores generated with ChemAxon descriptors (Figure 3). Hence, ChemAxon descriptors appear the better option for calculating MPO when the ACD descriptors are unavailable.
In addition to the CPI-MPO.v1 calculation from Wager et al., 2010 11, we also implemented the CPI-MPO.v2 calculation 1, 2. Briefly, Pf-MPO.v2 is a modified MPO algorithm to predict BBB penetration. The authors, using CNS penetration drug datasets, proposed that cLogD is unnecessary as cLogP captures the same information well, and that, instead, the number of HBD is highly critical for CNS penetration. Therefore, the authors proposed the Pf-MPO.v2 to score compounds for CNS penetration, effectively removing the cLogD from the calculation and doubling the weight that the HBD number contributes to the equation. We used the table of compounds provided in the original manuscript along with their provided MPO.v2 scores (Pf-MPO.v2, 1, 2) to compare against our implementation (CPI-MPO.v2). Comparison of CPI-MPO.v2 and Pf-MPO.v2 suggest ChemAxon descriptors are comparable with ACD descriptors for calculating the MPO score (R2 = 0.98, Figure S4). On the other hand, both MPO.v1 and MPO.v2 use the same function and set-points for calculating the T0 of each descriptor.
Comparison of the CPI-MPO.v1 score and CPI-MPO.v2 score for predicting drugs that can penetrate the BBB was performed with a test set from Wang et al., 2018 with binary classifications based on logBB (i.e., values ≥ −1 being active) for 2296 molecules collected from four studies 13. As for CPI-MPO-v1 scores, a compound was classified as active (crossing the BBB) if the CPI-MPO.v2 score was ≥ 4.
Metrics for CPI-MPO.v1 and CPI-MPO.v2 for analyzing the published BBB dataset (Figure 6, Table 1) suggests that neither score does particularly well (balanced accuracies of 0.61-0.67) at predicting BBB penetration on a very large dataset consisting of 1777 BBB penetrating and 519 BBB non-penetrating compounds 13.
Figure 6.
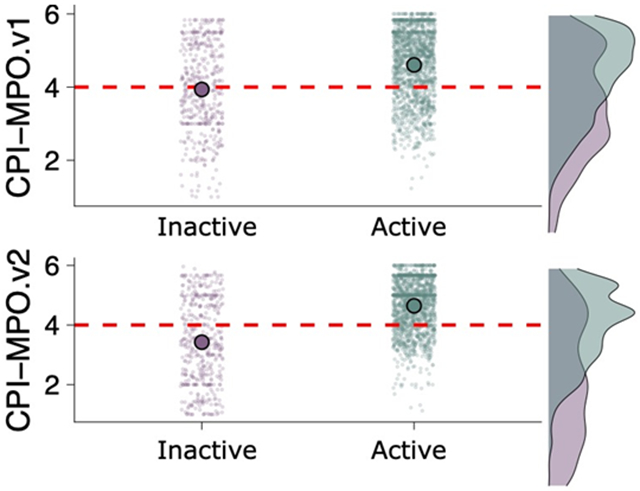
Comparison of CPI-MPO.v1 and CPI-MPO.v2 scores at predicting BBB penetration from a binary dataset 13. Green (x-axis: 1) represents active (BBB penetrating) compounds and purple (x-axis: 0) represents inactive (BBB non-penetrating) compounds from the testing dataset. The red dashed line indicates the activity cutoff (active if ≥ 4), and the large dot represents mean CPI-MPO scores of the entire testing dataset. Normalized density plots to the right of each point-graph.
Table 1.
Comparison of performance metrics for CPI-MPO.v1 and CPI-MPO.v2 scores when predicting 2296 compounds for BBB penetration.
| Metrics | CPI-MPO.v1 Score | CPI-MPO.v2 Score |
|---|---|---|
| Sensitivity | 0.378 | 0.453 |
| Specificity | 0.845 | 0.884 |
| Precision | 0.534 | 0.655 |
| Recall | 0.378 | 0.453 |
| F1 | 0.443 | 0.536 |
| Prevalence | 0.319 | 0.327 |
| Detection Rate | 0.121 | 0.148 |
| Detection Prevalence | 0.226 | 0.226 |
| Balanced Accuracy | 0.612 | 0.669 |
The same dataset of 2296 compounds was also utilized as a training set to generate a Bayesian model with extended connectivity fingerprint 6 (ECFP6) descriptors using our Assay Central® software, as we have previously described 14-18. Five-fold cross-validation statistics are shown in Figure 7; these results would appear to be very similar to those obtained in the original publication using different descriptors, algorithms and 10-fold cross validation 13. Using this Bayesian model, we then predicted the 119 CNS marketed drugs from Wager et al., 2010 11 for BBB penetration. 79 of the 119 drugs were included in the BBB training data and were considered active therein; 60 of these had an CPI-MPO.v1 score >=4. Of the remaining 40 drugs not included in the training set (and thus represent a test set for our machine learning model), 37/40 (92.5%) were predicted as active by the Assay Central® model while only 30/40 (75%) were assigned a desirable CPI-MPO.v1 score ≥ 4 and 33/40 (82.5%) received a desirable CPI-MPO.v2 score ≥ 4. This suggests the machine learning model is more accurate than either the CPI-MPO.v1 or CPI-MPO.v2 scores.
Figure 7.
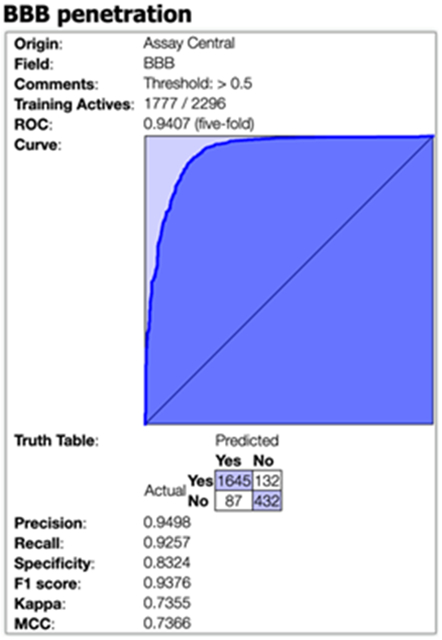
5-fold cross validation statistics for the Assay Central® Bayesian model for BBB penetration using the supplemental data from Wang et al., 2018 13.
CONCLUSIONS
It has been previously reported that the CNS MPO scores developed in 2010 and updated in 2017 have since performed well at Pfizer and Eli Lilly 1, 2, 11 for the design and separation of molecules that penetrate the brain and those that do not. Subsequently, many other companies and academic research groups have likely also tried to implement these algorithms internally with different descriptors. We now demonstrate how these CNS MPO scores can be almost identically replicated with ChemAxon descriptors in place of ACD. In addition, we have demonstrated that these algorithms provide a balanced accuracy between 61-66% with a very large dataset of 2296 BBB datapoints (Table 1). Using this dataset to generate a BBB Bayesian machine learning model with ECFP6 descriptors in Assay Central® to predict 40 of the 119 CNS active drugs used by Wager et al., 10, illustrating how this technology outperforms the Pf-MPO algorithm, correctly predicting > 90%.
Interestingly, recent machine learning models for BBB are achieving accuracies in a similar range to our Bayesian model, for example a Light Gradient Boosting Machine had an accuracy of 90% for a test set of 74 molecules 9 while random forest, gradient boosting and logistic regression had accuracies 78-82% on external testing 6. A consensus QSPR model using SVM, random forest, Naïve Bayes and probabilistic neural network had 81% accuracy for a test set of 32 molecules 3. We have compared our current model and several recently published machine learning models and our model statistics for 5-fold cross validation in this study are also on a par with these earlier models e.g. accuracy of 90% (range of published studies 82-94%, (Table S2)).
While rule-based approaches are clearly more transparent than machine learning models it is apparent they may not have accuracies as high as these more sophisticated methods. Differences in chemical descriptors generated between different proprietary and open-source algorithms may also lead to very different outcomes in MPO score, reducing the ability to consistently apply MPO scores to molecules. Additionally, Assay Central® does not need to calculate these physiochemical properties of molecules to generate predictions; rather it applies a simple probability-like score to the structure, either drawn manually or provided in a compatible file (i.e. .sdf) 14. As the publicly accessible BBB datasets continue to accumulate, these models will likely increase in their utility and applicability domain. The limitations of all MPO calculations are the requirement for descriptors like ClogP, pKa, clogD that are really only accessible in high end commercial software (e.g. ACD labs, ChemAxon, Biovia). Comparison of ChemAxon and ACD labs pKa predictors demonstrated a high correlation R2 = 0.91 and 0.96 for acid and basic predictions, respectively 19 in line with our data herein. When machine learning models were used to calculate these physicochemical properties and then compared with commercial tools the correlation was lower 19, which suggests that the MPO algorithms and machine learning models can capture different types of structural information.
As we have clearly demonstrated, open-source descriptors (such as ECFP6) and machine learning algorithms are better predictors of BBB or CNS activity than closed-source descriptor-based calculators required for MPO scores and the requirement for commercial descriptors may no longer be required for such prediction tasks. These kinds of machine learning models can also be used to visualize the contributions of molecular features by highlighting atoms with a particular bioactivity as we have demonstrated previously 16. The disadvantages of machine learning models are well known, as they generally lack the transparency and interpretability to show what molecules features separate active from inactive drugs, a key inferential tool for chemists to understand and steer future drug development. The two approaches can be combined to provide new guidance for chemists. The intersection of compounds predicted active by machine learning models but which fail the MPO score decision boundary can lead to discovery of new rules and exceptions that were not originally captured by the previous simple rulesets. The future of chemical understanding of BBB penetration can therefore be guided by constructing new simple rulesets based on the predictive power that black-box machine learning algorithms, such as Assay Central® or other published models (Table S2) can offer.
METHODS
MPO calculation
The Collaboration Pharmaceuticals, Inc. MPO pipeline is as follows: Molecular descriptors (MW, clogP, clogD, HBD, Pka, TPSA) are generated from SD files containing structures of molecules using ChemAxon cxcalc software.
MW - Molecular weight. called with “mass”. Default settings.
clogP - calculated logp. Called with “logp”. Default settings.
clogD - calculated logd. Called with “logd”. Calculated from pH 7.4, as done performed in Wager et al., 2010.
HBD - hydrogen bond donors. called with “donor count”. Default settings.
TPSA - total polar surface area. Called with “polarsurfacearea”. Default settings.
Pka - PKa. called with “pka”. By default, provides 4 PKAs; two basic and two acidic. Called to only provide the most basic Pka, as in the Pfizer paper.
Below is the command as called:
#cxcalc -o [output file.txt] [input file.sd] logP logD -H 7.4 pka -a 0 -b 1
#donorcount polarsurfacearea mass
The descriptors are generated as a .txt file. After generation of descriptors, an R script is called to apply monotonic or hump functions, followed by adding up the values of each transformed (T0) predictor for each molecule to create an MPO score.
MPO_pipeline.R
The output is a .CSV file with the descriptors, transformed descriptors, and MPO.
Machine learning with Assay Central®
Assay Central® is proprietary software developed to build machine learning models from high-quality datasets and generate predictions. It applies extended-connectivity fingerprint descriptors from the Chemistry Development Kit library 20 and a Bayesian algorithm previously described 14, 15 and utilized for other drug discovery projects 16-18, 21-27. Structure-activity datasets were collated in Molecular Notebook (Molecular Materials Informatics, Inc. in Montreal, Canada) and were curated through a series of scripts to detect and correct any problematic data (i.e. multiple components, salt removal, potentially inaccurate structure depiction). Performance metrics generated from internal five-fold cross-validation are included with each model. These include a receiver operator characteristic curve, recall, precision, specificity, Cohen’s kappa, Matthews Correlation Coefficient, and balanced accuracy.
Predictions are generated from resulting Bayesian model by first enumerating all training data fingerprints and calculating a given fingerprint’s “contribution” to an active classification from the ratio of its presence in active and inactive molecules; the summation of contributions of the fingerprints in a prospective molecule produces the probability-like prediction score 14. Scores greater than 0.5 are considered an active prediction.
Supplementary Material
ACKNOWLEDGMENTS
Alex Clark is acknowledged for Assay Central support and Biovia is kindly acknowledged for providing Discovery Studio.
Grant information
This work was funded by PsychoGenics. We kindly acknowledge NIH funding: R44GM122196-02A1 from NIGMS, 3R43AT010585-01S1 from NCCAM and 1R43ES031038-01 from NIEHS (PI – Sean Ekins). “Research reported in this publication was supported by the National Institute of Environmental Health Sciences of the National Institutes of Health under Award Number R43ES031038. The content is solely the responsibility of the authors and does not necessarily represent the official views of the National Institutes of Health.” F.U. was partially supported by the NIH award number DP7OD020317.
Footnotes
Supporting information
Four additional figures showing comparisons of ClogP predictions, comparisons of descriptors and MPO scores generated with Discovery Studio, comparisons of MPO.v2 scores, and two tables showing examples of molecules with MPO scores, a selection of recent BBB models and their statistics, as well as supplemental references.
Conflicts of interest
S.E. is owner, and F.U. and K.M.Z. are employees of Collaborations Pharmaceuticals, Inc. D.B. is an employee of PsychoGenics.
References
- 1.Rankovic Z, CNS Physicochemical Property Space Shaped by a Diverse Set of Molecules with Experimentally Determined Exposure in the Mouse Brain. J Med Chem 2017, 60 (14), 5943–5954. [DOI] [PubMed] [Google Scholar]
- 2.Rankovic Z, Retraction of "CNS Physicochemical Property Space Shaped by a Diverse Set of Molecules with Experimentally Determined Exposure in the Mouse Brain". J Med Chem 2019, 62 (3), 1699. [DOI] [PubMed] [Google Scholar]
- 3.Zhang X; Liu T; Fan X; Ai N, In silico modeling on ADME properties of natural products: Classification models for blood-brain barrier permeability, its application to traditional Chinese medicine and in vitro experimental validation. J Mol Graph Model 2017, 75, 347–354. [DOI] [PubMed] [Google Scholar]
- 4.Zhang D; Xiao J; Zhou N; Zheng M; Luo X; Jiang H; Chen K, A Genetic Algorithm Based Support Vector Machine Model for Blood-Brain Barrier Penetration Prediction. Biomed Res Int 2015, 2015, 292683. [DOI] [PMC free article] [PubMed] [Google Scholar]
- 5.Yuan Y; Zheng F; Zhan CG, Improved Prediction of Blood-Brain Barrier Permeability Through Machine Learning with Combined Use of Molecular Property-Based Descriptors and Fingerprints. AAPS J 2018, 20 (3), 54. [DOI] [PMC free article] [PubMed] [Google Scholar]
- 6.Plisson F; Piggott AM, Predicting Blood(−)Brain Barrier Permeability of Marine-Derived Kinase Inhibitors Using Ensemble Classifiers Reveals Potential Hits for Neurodegenerative Disorders. Mar Drugs 2019, 17 (2). [DOI] [PMC free article] [PubMed] [Google Scholar]
- 7.Miao R; Xia LY; Chen HH; Huang HH; Liang Y, Improved Classification of Blood-Brain-Barrier Drugs Using Deep Learning. Sci Rep 2019, 9 (1), 8802. [DOI] [PMC free article] [PubMed] [Google Scholar]
- 8.Alsenan S; Al-Turaiki I; Hafez A, A Recurrent Neural Network model to predict blood-brain barrier permeability. Comput Biol Chem 2020, 89, 107377. [DOI] [PubMed] [Google Scholar]
- 9.Shaker B; Yu MS; Song JS; Ahn S; Ryu JY; Oh KS; Na D, LightBBB: Computational prediction model of blood-brain-barrier penetration based on LightGBM. Bioinformatics 2020. [DOI] [PubMed] [Google Scholar]
- 10.Majumdar S; Basak SC; Lungu CN; Diudea MV; Grunwald GD, Finding Needles in a Haystack: Determining Key Molecular Descriptors Associated with the Blood-brain Barrier Entry of Chemical Compounds Using Machine Learning. Mol Inform 2019, 38 (8-9), e1800164. [DOI] [PubMed] [Google Scholar]
- 11.Wager TT; Hou X; Verhoest PR; Villalobos A, Moving beyond rules: the development of a central nervous system multiparameter optimization (CNS MPO) approach to enable alignment of druglike properties. ACS Chem Neurosci 2010, 1 (6), 435–49. [DOI] [PMC free article] [PubMed] [Google Scholar]
- 12.Wager TT; Hou X; Verhoest PR; Villalobos A, Central Nervous System Multiparameter Optimization Desirability: Application in Drug Discovery. ACS Chem Neurosci 2016, 7 (6), 767–75. [DOI] [PubMed] [Google Scholar]
- 13.Wang Z; Yang H; Wu Z; Wang T; Li W; Tang Y; Liu G, In Silico Prediction of Blood-Brain Barrier Permeability of Compounds by Machine Learning and Resampling Methods. ChemMedChem 2018, 13 (20), 2189–2201. [DOI] [PubMed] [Google Scholar]
- 14.Clark AM; Dole K; Coulon-Spektor A; McNutt A; Grass G; Freundlich JS; Reynolds RC; Ekins S, Open Source Bayesian Models. 1. Application to ADME/Tox and Drug Discovery Datasets. J Chem Inf Model 2015, 55 (6), 1231–45. [DOI] [PMC free article] [PubMed] [Google Scholar]
- 15.Clark AM; Ekins S, Open Source Bayesian Models. 2. Mining a "Big Dataset" To Create and Validate Models with ChEMBL. J Chem Inf Model 2015, 55 (6), 1246–60. [DOI] [PubMed] [Google Scholar]
- 16.Lane T; Russo DP; Zorn KM; Clark AM; Korotcov A; Tkachenko V; Reynolds RC; Perryman AL; Freundlich JS; Ekins S, Comparing and Validating Machine Learning Models for Mycobacterium tuberculosis Drug Discovery. Mol Pharm 2018, 15 (10), 4346–4360. [DOI] [PMC free article] [PubMed] [Google Scholar]
- 17.Russo DP; Zorn KM; Clark AM; Zhu H; Ekins S, Comparing Multiple Machine Learning Algorithms and Metrics for Estrogen Receptor Binding Prediction. Mol Pharm 2018, 15 (10), 4361–4370. [DOI] [PMC free article] [PubMed] [Google Scholar]
- 18.Zorn KM; Lane TR; Russo DP; Clark AM; Makarov V; Ekins S, Multiple Machine Learning Comparisons of HIV Cell-based and Reverse Transcriptase Data Sets. Mol Pharm 2019, 16 (4), 1620–1632. [DOI] [PMC free article] [PubMed] [Google Scholar]
- 19.Mansouri K; Cariello NF; Korotkov A; Tkachenko V; Grulke CM; Sprankle CS; Allen D; Casey WM; Kleinstreuer N; Williams AJ, Open-source QSAR models for pKa prediction using multiple machine learning approaches. J Cheminform 2019, 11, 60. [DOI] [PMC free article] [PubMed] [Google Scholar]
- 20.Willighagen EL; Mayfield JW; Alvarsson J; Berg A; Carlsson L; Jeliazkova N; Kuhn S; Pluskal T; Rojas-Cherto M; Spjuth O; Torrance G; Evelo CT; Guha R; Steinbeck C, The Chemistry Development Kit (CDK) v2.0: atom typing, depiction, molecular formulas, and substructure searching. J Cheminform 2017, 9 (1), 33. [DOI] [PMC free article] [PubMed] [Google Scholar]
- 21.Anantpadma M; Lane T; Zorn KM; Lingerfelt MA; Clark AM; Freundlich JS; Davey RA; Madrid PB; Ekins S, Ebola Virus Bayesian Machine Learning Models Enable New in Vitro Leads. ACS Omega 2019, 4 (1), 2353–2361. [DOI] [PMC free article] [PubMed] [Google Scholar]
- 22.Dalecki AG; Zorn KM; Clark AM; Ekins S; Narmore WT; Tower N; Rasmussen L; Bostwick R; Kutsch O; Wolschendorf F, High-throughput screening and Bayesian machine learning for copper-dependent inhibitors of Staphylococcus aureus. Metallomics 2019, 11 (3), 696–706. [DOI] [PMC free article] [PubMed] [Google Scholar]
- 23.Ekins S; Gerlach J; Zorn KM; Antonio BM; Lin Z; Gerlach A, Repurposing Approved Drugs as Inhibitors of Kv7.1 and Nav1.8 to Treat Pitt Hopkins Syndrome. Pharm Res 2019, 36 (9), 137. [DOI] [PMC free article] [PubMed] [Google Scholar]
- 24.Ekins S; Puhl AC; Zorn KM; Lane TR; Russo DP; Klein JJ; Hickey AJ; Clark AM, Exploiting machine learning for end-to-end drug discovery and development. Nat Mater 2019, 18 (5), 435–441. [DOI] [PMC free article] [PubMed] [Google Scholar]
- 25.Hernandez HW; Soeung M; Zorn KM; Ashoura N; Mottin M; Andrade CH; Caffrey CR; de Siqueira-Neto JL; Ekins S, High Throughput and Computational Repurposing for Neglected Diseases. Pharm Res 2018, 36 (2), 27. [DOI] [PMC free article] [PubMed] [Google Scholar]
- 26.Sandoval PJ; Zorn KM; Clark AM; Ekins S; Wright SH, Assessment of Substrate-Dependent Ligand Interactions at the Organic Cation Transporter OCT2 Using Six Model Substrates. Mol Pharmacol 2018, 94 (3), 1057–1068. [DOI] [PMC free article] [PubMed] [Google Scholar]
- 27.Wang PF; Neiner A; Lane TR; Zorn KM; Ekins S; Kharasch ED, Halogen Substitution Influences Ketamine Metabolism by Cytochrome P450 2B6: In Vitro and Computational Approaches. Mol Pharm 2019, 16 (2), 898–906. [DOI] [PMC free article] [PubMed] [Google Scholar]
Associated Data
This section collects any data citations, data availability statements, or supplementary materials included in this article.


