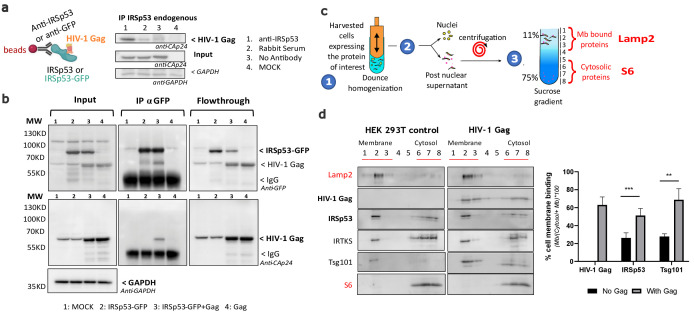
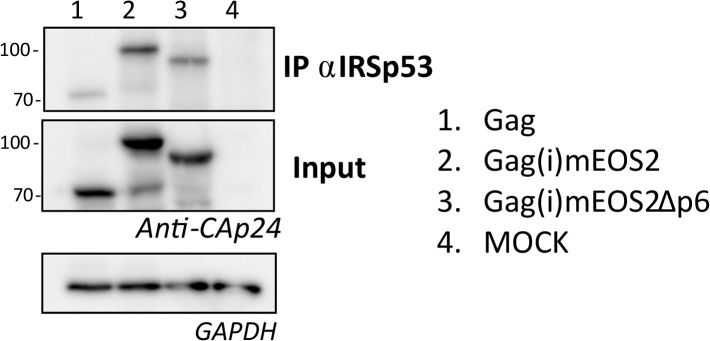
Figure 2. Intracellular HIV-1 Gag and IRSp53 complexation and cell membrane binding.
(a) Co-immunoprecipitation of HIV-1 Gag/IRSp53 with an anti-IRSp53 antibody. HIV-1 Gag is enriched in the anti-IRSp53 pulldown (lane 1), as compared to the controls (lane 2: IP with an anti-rabbit serum; lane 3: no antibody; lane 4: mock, i.e., without Gag). (b) Co-Immunoprecipitation of HIV-1 Gag/ectopic IRSp53-GFP with an anti-GFP antibody upon overexpression of HIV-1 Gag and ectopic IRSp53-GFP in transfected HEK293 T cells. HIV-1 Gag is enriched in the anti-IRSp53-GFP pulldown (lane 3: transfected HEK293T cell lysate containing IRSp53-GFP and HIV-1 Gag), as compared to the controls (lane 1: mock without Gag or IRSp53-GFP; lane 2: IRSp53 alone; lane 4: Gag alone). Input, IP anti-GFP and flowthrough after IP are shown. (c) Membrane flotation assay protocol: (1) 293T cells were dounced, (2) the post-nuclear supernatant was loaded on a discontinuous sucrose gradient, and (3) following ultracentrifugation, cell membranes (lysosomal associated membrane protein, Lamp2 biomarker, fractions 1–3) were separated from the cytosolic fraction (ribosomal S6 protein biomarker, fractions 6–8). (d) Immunoblots of the indicated proteins (on the left) and quantification of the % of protein membrane binding in the graph below show that upon HIV-1 Gag expression in cells, IRSp53 is significantly enriched by twofold in the cell membrane fraction (p value = 0.000129; ***Student’s t-test) (n = 5 independent experiments). A similar increase is observed for Tsg-101, a known interactor of the p6 domain of Gag (p value = 0.00517; **, Student’s t-test).


