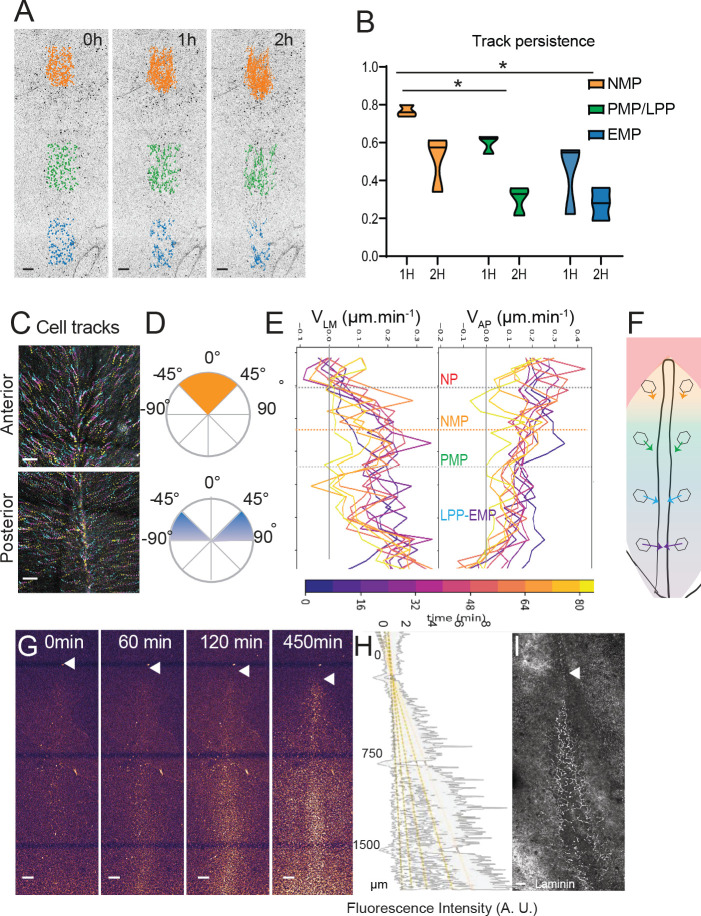
Figure 6. Limited convergence and ingression of the NMP territory in the epiblast.
(A) Representative snapshots from a time-lapse movie of a stage 5HH chicken embryo in which the epiblast was labeled with nuclear red (Video 4). Tracks of single-labeled nuclei are shown at three different PS levels at three different timepoints (0, 1, and 2 hr) to illustrate differences in longevity of the cells (n = 3 embryos) (NMP: gold; PMP/LPP: green; EMP: blue). (B) Quantification of tracks longevity measured as the ratio of tracks number after 1 and 2 hr divided by the number of tracks at t0 in each of the colored regions shown in Figure 3A. t0 marks the start of time-lapse movies of stage 5HH chicken embryos labeled with nuclear red. Gold, green, and blue show tracks in the NMP, PMP/LPP, and EMP domains, respectively, corresponding to the tracks shown in Figure 5A (n = 3; n = 1502 tracks). Two-way ANOVA NMP-PMP/LPP; NMP-EMP. *p<0.05. (C) Representative color-coded time projection showing tracks of epiblast cells at the anterior and posterior PS level after nuclear red labeling in a stage 5HH chicken embryo. The tracks color code represents early timepoints in cyan and later timepoints in yellow (n = 3 embryos). (D) Representative quantification of the angle with the midline of tracks shown in (C). Top: anterior PS region; bottom: posterior PS region (n = 3 embryos). (E) Representative mean lateral to medial speed (VLM) and anterior to posterior speed (VAP) over time of epiblast cells labeled with nuclear red in stage 5HH chicken embryos. Y axis represents AP position along the embryo. Color code indicates time of measurement since beginning of the movie (n = 3 embryos). (F) Diagram showing the main direction of epiblast cell movements as a function of their AP position in the epiblast. The length of arrows is proportional to convergence speed. (G) Representative snapshots from a confocal movie of the PS region of a chicken embryo labeled dorsally at stage 5HH with nuclear red and imaged from the ventral side to show epiblast cells ingression (n = 3 embryos). (H) Representative intensity measurement of the nuclear red signal from the ventral side along the PS of the movie shown in (G). Y axis, distance to Hensen’s node (n = 3 embryos). (I) Representative whole-mount immunohistochemistry with anti-laminin (white) in a stage 5HH chicken embryo. Ventral view (n = 3 embryos). Dorsal views, anterior to the top. EMP: extraembryonic progenitors; NMP: neuromesodermal progenitors; PMP: presomitic mesoderm progenitor; LPP: lateral plate progenitor; PS: primitive streak. Arrowhead shows Hensen’s node position. Scale bar: 100 µm.
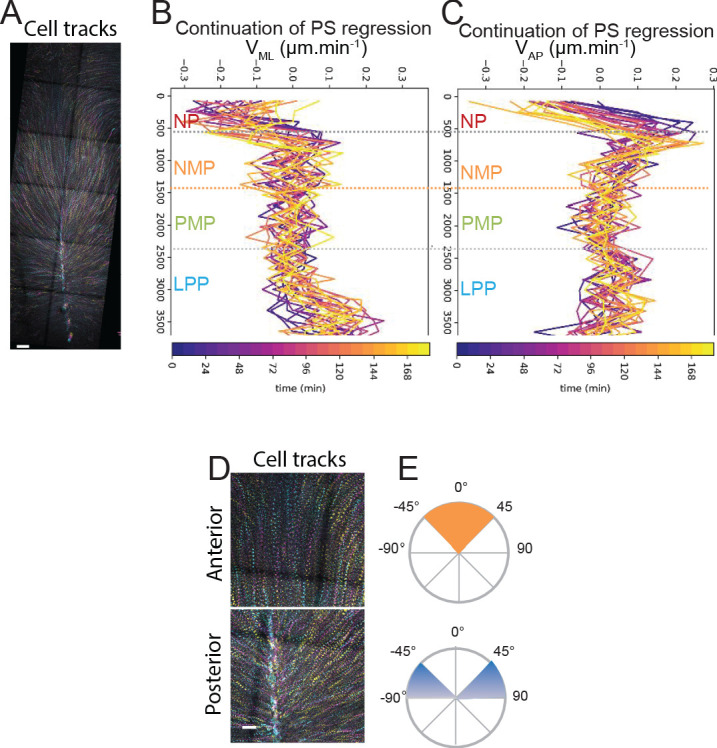
Figure 6—figure supplement 1. Quantification of longevity, cell speed, and trajectories in time-lapse movies of nuclear red-labeled chicken embryos.


