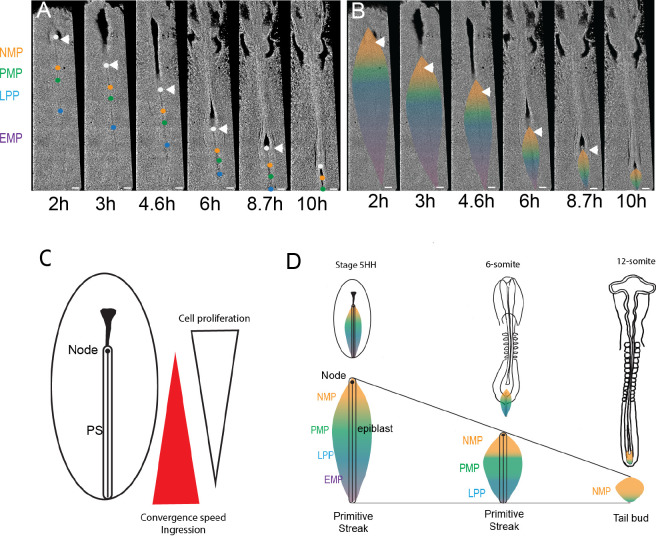
Figure 8. Posterior to anterior exhaustion of primitive streak (PS) progenitor territories results in NMPs remaining as the major PS remnant in the tail bud.
(A, B) Snapshots from a 13 hr time-lapse movie of a chicken embryo starting at stage 5HH. The approximate position of the boundaries is shown by colored dots (A), and the corresponding territories are shown (B) during PS regression. Boundaries between NMP-PMP, PMP-LPP, and LPP-EMP are illustrated by orange, green, and blue dots (A) and color transition (B), respectively. The initial position of groups of cells marking the boundaries between the different PS territories was identified based on their distance to Hensen’s node (white arrowhead) as established in our experiments and in Psychoyos and Stern, 1996. These groups of cells were tracked during PS regression to follow the fate of the different PS territories (n = 3 embryos). Dorsal views. (C) Schematics illustrating the position of the opposite gradients of cell proliferation and ingression in the epiblast during PS regression. (D) Schematics summarizing the dynamics of the NMP territory (gold) during PS regression in embryos of stage 5HH and 6-somite and around PS to tail bud transition (12-somite embryo). (A–D) Dorsal views, anterior to the top. AP: anteroposterior; NMP: neuromesodermal progenitors (gold); PMP: presomitic mesoderm progenitors (green); LPP: lateral plate progenitor (blue); EMP: extraembryonic mesoderm precursors (purple). Arrowhead: Hensen’s node (n = 3 embryos). Scale bar: 100 µm.

