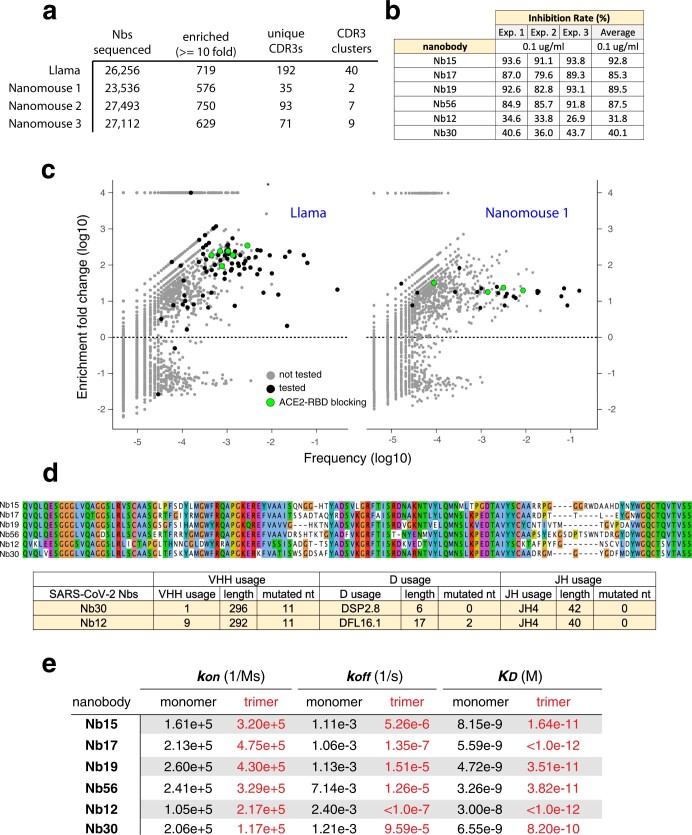
Extended Data Fig. 5. Isolation of anti-SARS-CoV-2 RBD nanobodies.
a, Table indicating (1) the total number of unique nanobody genes identified from llama and three nanomice phage display libraries following selection for RBD binding; (2) the number of nanobodies enriched at least tenfold after selection; (3) the number of nanobodies with a unique CRD3; and (4) the different clusters of nanobodies that share similar CDR3 s (with no more than 2 amino acid differences). b, Table showing in vitro neutralization results for the six leading nanobodies using the sVNT kit of GenScript. c, Dot plot depicting the extent of enrichment (y axis) and frequency (x axis) of unique nanobodies after RBD selection of llama (left) or nanomouse 1 (right) libraries. Green circles represent nanobodies that block ACE2–RBD interactions in vitro, black circles are nanobodies that do not efficiently block ACE2–RBD interactions, and grey dots represent untested nanobodies. d, Top graph shows protein alignment of the six nanobodies isolated from llama and nanomice immunized with SARS-CoV-2 spike and RBD. Bottom table shows detailed information of the VHH, D and J domains of nanomouse nanobodies. e, Table depicting equilibrium (KD), association (Kon) and dissociation (Koff) constants obtained for each nanobody as a monomer (black) or trimer (red) form.

