

Abstract
Fusion genes including NPM-ALK can promote T cell transformation, but the signals required to drive a healthy T cell to become malignant remain undefined. In this study, we introduce NPM-ALK into primary human T cells and demonstrate induction of the epithelial-to-mesenchymal transition (EMT) program, attenuation of most T cell effector programs, re-emergence of an immature epigenomic profile, and dynamic regulation of c-Myc, E2F, and PI3K/mTOR signaling pathways early during transformation. A mutant of NPM-ALK failed to bind several signaling complexes including GRB2/SOS, SHC1, SHC4, and UBASH3B and was unable to transform T cells. Lastly, TCR-generated signals were required to achieve T cell transformation, explaining how healthy individuals can harbor T cells with NPM-ALK translocations. These findings describe the fundamental mechanisms of NPM-ALK-mediated oncogenesis, and may serve as a model to better understand factors that regulate tumor formation.
INTRODUCTION:
Translocation between the genes encoding anaplastic lymphoma kinase (ALK), a receptor tyrosine kinase physiologically expressed in immature neuronal tissue, and nucleophosmin (NPM), a ubiquitously expressed nucleolar protein, generates the NPM-ALK fusion protein, which is a key driver of anaplastic large-cell lymphoma (ALCL) (1,2). NPM-ALK forms oligomers, resulting in constitutive activation of its kinase domain, which is required for NPM-ALK-mediated transformation of T lymphocytes (3). Extensive mutagenesis studies of tyrosine-based motifs within NPM-ALK’s protein sequence followed by immunoprecipitation studies have revealed key amino acid residues by which a number of signaling proteins bind to NPM-ALK including IRS1, SRC, SHC1, SHP2, GRB2, SOS, and PLCγ (4). For example, using rodent fibroblasts as a model, the Y567 and Y664 sites were found to be dispensable for cell transformation (3). However, another study using murine leukemic Ba/F3 cells demonstrated that mutation of the Y664 residue in NPM-ALK failed to result in NPM-ALK-mediated transformation due to loss of PLCγ recruitment (5). To date, studies on NPM-ALK signaling have been performed using patient tumor samples and cell lines or non-NPM-ALK-expressing cell lines that have undergone transformation with NPM-ALK expressed exogenously (4,6). Thus, it is not clear which, if any, of these pathways are principle drivers that lead a primary human T cell to become an ALCL.
The NPM-ALK kinase is able to activate several downstream signaling cascades, including STAT3, cJUN/ JunB/AP1, PI3K/AKT/mTOR, MEK-ERK, and NFAT (6,7), but which of these signaling pathways are induced early and which contribute to transformation is unknown. Intriguingly, the NPM-ALK translocation can also be detected in T cells of some healthy individuals and cord blood (8–11), suggesting that expression of an oncogenic tyrosine kinase (NPM-ALK) is not sufficient to induce transformation in these cells, but rather that additional, yet undefined, signals are necessary (12). Since ALK is not normally expressed in mature T cells, a cell type that is generally resistant to transformation (13), it is remarkable that this aberrantly expressed kinase is able to reprogram T cells to become tumors. Understanding which pathways are altered early in the transformation process will provide key clues to delineate how NPM-ALK expression functions to transform T cells.
Historically, mature T cells were thought to be the cell of origin for ALCLs because the transformed cells have rearranged TCR loci and produce cytotoxic molecules like Perforin and Granzyme B (14–16). However, other studies suggest that a less differentiated cell may be the cell of origin for ALCL based on cell morphology and methylation patterns (17–19). Transgenic mouse models of NPM-ALK transformation have attempted to address some of these unresolved issues, but these have failed to produce tumors that recapitulate primary human ALCL (20). Thus, it has been difficult to study NPM-ALK driven-oncogenesis in T cells. We previously demonstrated that introducing NPM-ALK into activated human CD4 T cells mediated their transformation into ALCL lines indistinguishable from those isolated from patients (21). Here, we use this primary human T-cell model of NPM-ALK-mediated transformation to study mechanistically how NPM-ALK drives T-cell tumorigenesis. We show that NPM-ALK rapidly alters gene expression in mature T cells, driving them to a less differentiated state that genetically resembles a more thymic-progenitor like state. These findings support the notion that a mature T cell can be the cell of origin for ALCL. We identify critical tyrosine signaling residues and signaling pathways whose disruption block T cell transformation. We further demonstrate that NPM-ALK expression alone is not sufficient to transform primary human CD4 T cells, but rather that TCR engagement is also required. Our data provide a time line of the changes a T cell undergoes to become an ALCL, and a new understanding of the requirements emanating from both NPM-ALK and the T-cell intrinsic signaling machinery that lead to transformation.
MATERIALS AND METHODS
Construction and production of lentiviral vectors:
The NPM-ALK constructs pTRPE-NPM-ALK and pTRPE-NPM-ALKKD (K210R) were used to produce lentivirus for NPM-ALK and NPM-ALKKD expression and have been previously described (21). To create single mutants of NPM-ALK, the QuikChange II Site-Directed Mutagenesis kit (Agilent Technologies, Santa Clara, CA) was used to perform site directed mutagenesis of the indicated single mutants of NPM-ALK. For some NPM-ALK single mutants and NPM-ALK mutants containing two or three mutations, G-block gene fragments (IDT, Coralville, IA) were used and standard molecular biology was used to introduce these fragments into pTRPE. Sequences encoding the high affinity IV9-specific TCR were provided by Bent Jakobsen (Adaptimmune Inc, Oxford UK) based on a previously described natural TCR (22). Supernatants containing lentiviral vector particles were produced as previously described (23).
Generation of ALCL lines and cell culture:
Generation of ALCL lines by NPM-ALK transduction was previously described (21). In brief, de-identified primary human CD4 T cells were obtained from the Human Immunology Core at the University of Pennsylvania under an IRB approved protocol. These T cells were activated with CD3/28 coated beads (Thermofisher), transduced with NPM-ALK lentiviral vectors, counted, and reduced to 0.5 million per ml every two days. In some experiments, freshly isolated T cells were incubated in 100 units IL-2 (Proleukin/Aldesleukin from Clingen), 10 ng/ml IL-7 (R&D systems), and 5 ng/ml IL-15 (BioLegend) for 4 days prior to being transduced with NPM-ALK expressing vectors once a day for the next 3 days. T cells and ALCL lines were maintained in Gibco complete RPMI 1640 (ThermoFisher Scientific, Carlsbad, CA) supplemented with 10% FBS (Seradigm, Radnor, PA), 2 mM Glutamax (ThermoFisher Scientific), Penicillin 100 U/mL/ Streptomycin 100 ug/mL; ThermoFisher Scientific) and 10 mM HEPES (ThermoFisher Scientific). Karpas 299, DEL, SUP-M2, and SUDHL1 ALK+ ALCL cells were a kind gift from Megan Lim and Kojo Elenitoba-Johnson. These human ALK+ ALCL cell lines were maintained in complete RPMI 1640. K562 cells expressing HLA-A2, CD64 and the IV9 minigene that contains 50 amino acids surrounding the IV9 epitope were constructed as previously described (24).
Vector Integration Analysis:
Sites of integration of lentiviral vectors were determined essentially as described (25–27). Briefly, DNA was purified from cells, then fragmented by sonication. DNA linkers were then ligated to the broken DNA ends, and PCR was carried out using primers that bind to the linker and the vector LTR. PCR products were sequenced using the Illumina method. Reads were aligned to the hg38 draft of the human genome. Clone size was inferred by counting the numbers of sites of ligation of linkers recovered for each unique integration site (25). . The distributions of vector integration sites were compared to distributions of random sites using the ROC area method (28).
RNA sequencing:
To enrich for NPM-ALK expressing cells, cells were incubated with anti-PDL1-APC (Biolegend, San Diego, CA 329708), followed by incubation with Anti-APC MicroBeads (# 130-048-801, Miltenyi Inc, Bergisch Gladbach, Germany) and purification using Miltenyi MS columns as per the manufacturer’s instructions. Untransduced and NPM-ALKKD transduced T cells were purified similarly using anti-CD4-APC (Biolegend, #300537) instead of anti-PD-L1-APC. RNA was extracted using the Qiagen RNeasy Kit (Qiagen, 74104) according to the manufacturer’s instructions. 0.5-2.0million cells were used for each extraction. Cells expressing NPM-ALK, NPM-ALKKD, NPM-ALKY664F, and NPM-ALKTrpM were separated using Miltenyi separation as described above on Days 6, 9, and 12. Samples from three independent donors were used for RNA sequencing on days 6 and 9, and from two donors on days 12, 33 and 63. Samples from day 33 and 63 were fully transformed, and so PD-L1/CD4 cell sorting was not required. Because NPM-ALKKD and untransduced cells do not survive beyond day ~15-20, NPM-ALKKD cells were used for comparison in NPM-ALK sequencing to NPM-ALK on Day 33 and 63. Libraries for RNA sequencing were prepared by Beijing Genomics Institute (BGI: Hong Kong, China) using 100ng of purified total RNA and the Truseq stranded total RNA RiboZero library preparation kit (Illumina Catalog #: RS-122-2201) strictly following the Illumina guide (15031048 E). Briefly, rRNA was depleted with rRNA Removal Mix (RRM) and then fragmented into ~160bp fragments. rRNA-depleted RNA fragments served as templates for first-strand cDNA synthesis using random hexamer-primers, followed by second stand synthesis with the addition of buffer, dNTPs, RNase H and DNA polymerase I. Double stranded cDNA was purified using the QiaQuick PCR extraction kit (Qiagen) followed by end repair, base A addition and ligation of sequencing adapters. Ligated fragments were purified by magnetic beads and amplified via PCR. The resulting library products were quantified with the Agilent2100 bioanalyzer and were sequenced using an Illumina HiSeqTM 4000 for a total of 4GB of 50bp paired-end read data per sample. RNAseq gene counts were determined with the Salmon software package (29) using the hg38 gencode29 transcriptome release after which counts were normalized and quantified with the DEseq2 software package (30). All analysis software developed for this study is available via the Zenodo data server (DOI:10.5281/zenodo.4477729).
Staining and Flow Cytometry.
Cells were washed with PBS, and stained with Fixable Viability Dye eFluor-780 (eBioscience, San Diego, CA) as per the manufacturer’s instructions. Cells were then washed with FACS wash (2.5% FBS/ PBS) one time, and surface antibodies were added (NPM-ALK (Miltenyi clone REA425, Cat# 130-106-446), CD4 (BD Biosciences clone RPA-T4 or BioLegend clone OKT4), CD274 (BD Biosciences clone MIH1), CD30 (BD Biosciences clone BerH8). The A2-IV9 tetramer was provided by NIH Tetramer Facility. Cells were washed again and Fixed with Invitrogen Fixation Medium (Medium A) for 15 minutes at room temperature or overnight at 4 degrees C. Cells were then washed once with FACS wash, and intracellular staining antibodies were added in Permeabilization Medium (Medium B; Invitrogen/ ThermoFisher Scientific). Intracellular staining was performed for 30 minutes, followed by one or two washes with FACS Wash. Cells were then fixed with 2% PFA. Data acquisition was performed using an LSR II or Fortessa, and data analysis was performed using FlowJo. Intracellular cytokine staining was performed as previously described (31). Where indicated, T cells where incubated with 3 ug/ml PMA (Sigma Aldrich, P1585), 1 μg/mL lonomycin (Sigma Aldrich, 407950) and Brefeldin A (GolgiPlug; BD Biosciences, 555029), and then incubated at 37 degrees C for 4 hours. Cells were stained for surface markers and viability, then fixed using Fixation Medium A (ThermoFisher Scientific, GAS001S100), washed, and a final intracellular cytokine staining was performed in Permeabilization Medium B (ThermoFisher Scientific, GAS002S100) using antibodies detecting IL-2, TNF, GM-CSF, and IFNγ for 30 minutes at room temperature. Cells were then washed and fixed in 4% PFA and analyzed using a BD LSR II Flow Cytometer. For CTV dilution assay, 10 million primary CD4 cells were washed twice with PBS and resuspended in 5μM of CTV for 20 minutes at room temperature in the dark. Following washout, T cells were stimulated in 100 units IL-2 (Proleukin/Aldesleukin from Clingen), 10 ng/ml IL-7 (R&D systems), and 5 ng/ml IL-15 (BioLegend) or CD3/28 coated beads (Thermofisher).
DNA methylation analysis.
Genomic DNA was prepared using the QIAgen DNeasy Blood and Tissue kit according to the manufacturer’s protocol. The genomic DNA was then modified by bisulfite treatment using the EZ DNA methylation kit (Zymo Research, Irvine CA) as per the manufacturer’s instructions. Bisulfite converted DNA was PCR amplified using primers specific for the promoters of the genes indicated. For the SHP-1 promoter loci, bisulfite sequencing was performed as described (32,33). For LCK, CD3ε, and TCF7 bisulfite specific primers that amplify both methylated and unmethylated DNA were used. Bisulfite primer sequences used were as follows: LCK forward (TAGGTGGGAGGTAGGTAGTGTAGTT), LCK reverse (TTCTCTCTAAACCTCAAAAACCTCAT); CD3ε forward (TTTTTGTTTTATTTTGGGTTTTTTA), CD3ε reverse (ACTCCTTACAAAAATCACATCCTAC); TCF7 forward (GGATAAATTTTTAGAGTTTTTGGAGG), and TCF7 reverse (ACTCTCCACCCCTAAATTCTACC). The PCR product sizes and number of CpG sites spanned for each gene were: LCK: 214 base pairs with 5 CpG sites; CD3ε: 206 base pairs with 4 total and 2 readable CpG sites spanned; and TCF7: 168 base pairs and 14 CpG sites spanned. Primers were created using MethPrimer (http://www.urogene.org/methprimer). For DNA sequence analysis, PCR products obtained with the indicated primer pairs were gel purified using the Qiagen Gel Extraction kit. Purified DNA was sequenced using the indicated reverse primer within each primer pair and sequenced/ analyzed on an automated DNA sequencer at the University of Pennsylvania DNA Sequencing Facility. Chromatograms were analyzed using the Vector NTI software (Thermofisher). At the CpG sites indicated, the percentage of C’s was calculated from the chromatogram readout.
Immunoprecipitation.
20-100 million of NPM-ALK or NPM-ALK mutant expressing T cells were resuspended at a concentration of 25 million cells/mL in 1XRIPA buffer (Cell Signaling Technology, Danvers, Massachusetts) and 1mM PMSF (Cell Signaling Technology). The lysate was then isolated by centrifugation (10 minutes at 14K g) and supernatant extracted. Cell lysate supernatant protein concentration was determined using the Pierce Coomassie Protein Assay Reagent Kit (ThermoFisher). A predetermined titrated amount (0.5 – 5 ug) of the NPM-ALK polyclonal goat antibody (Santa Cruz Biotechnology, Dallas, Texas) was added and Protein G Dynabead/ Antibody (ThermoFisher) were used as recommended by manufacturer to isolate complexes that bound to the respective NPM-ALK proteins. The samples were run at 120V into a 1mm, 10% polyacrylamide 10-well gel for 1 hour along Precision Plus dual color protein standards using (Bio-Rad) NuPAGE MES SDS running buffer and stained with SimplyBlue Safestain (ThermoFisher) according to recommended protocol. Bands were excised and Tandem LC-MS/MS analysis was performed as previously described (34) at Proteomics & Metabolomics Facility at the Wistar Institute.
RESULTS:
Regulation of the MYC, E2F, and PI3K/mTOR signaling pathways early in T cell transformation.
Previously, we demonstrated that primary human T cells transduced with a lentiviral vector expressing NPM-ALK generate tumors indistinguishable from primary, patient-derived ALCL tumors (21). To study the step-by-step changes these T cells undergo as they become ALCLs, we generated 29 unique NPM-ALK expressing tumor cell lines from primary human CD4 T cells (Fig. 1a). Consistent with our previous findings, full T cell transformation took place approximately 30 days post introduction of NPM-ALK, whereas untransduced cells and T cells transduced with a kinase-defective (K210R) NPM-ALK (NPM-ALKKD) returned to resting cell size (Fig. S1a) and started to die after ~15 days in culture (21,35). We observed extensive cell death and a decrease in the number of wild-type NPM-ALK-expressing cells between days 6 and 20 that was not observed in T cells transduced with NPM-ALKKD (Fig. 1b, c, Fig. S1b), suggesting that expression of NPM-ALK induces oncogenic toxicity, paralleling previous studies (36,37).
Figure 1: Regulation of the MYC, E2F, and PI3K/mTOR signaling pathways early in T cell transformation.
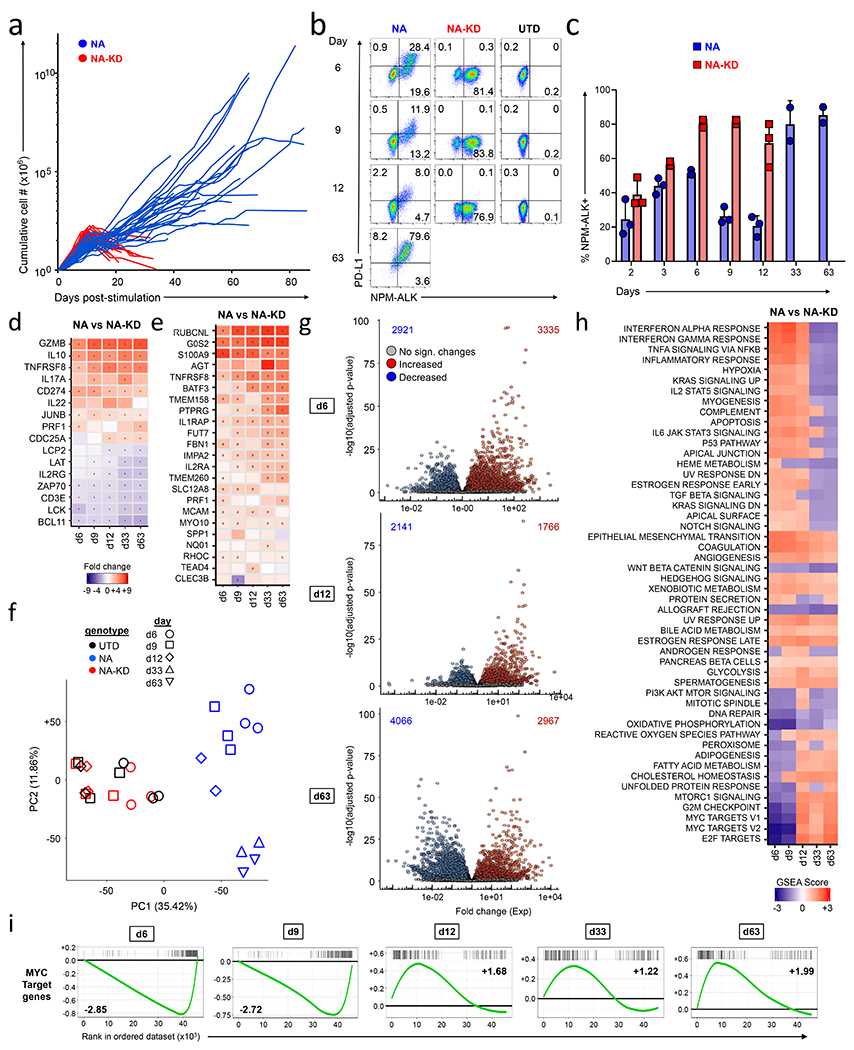
(a) Growth curves of NPM-ALK (NA) and NPM-ALK-Kinase Dead (KD) cells. Primary human CD4 T cells isolated from healthy donors were stimulated with anti-CD3/CD28 beads, and transduced with lentiviral vectors expressing either NPM-ALK or NPM-ALKKD. Cell expansion was calculated by counting and re-seeding cultures every two days. The graph presents data from 26 independent experiments. (b,c) Cell surface PDL1 and intracellular NPM-ALK expression were measured by flow cytometry in NPM-ALK (NA), NPM-ALK-Kinase Dead (NA-KD) cells, and untransduced (UTD) T cells at the indicated days of culture. (c) summarizes the percentage of cells expressing NPM-ALK from 3 donors that were transduced with either NPM-ALK or NPM-ALKKD on the indicated day of culture. (d) Heat map showing RNA sequencing results of differentially expressed genes between NPM-ALK and NPM-ALKKD. Select genes known to be associated with NPM-ALK transformation are shown at each indicated time. Significantly different values (P<0.05) are highlighted with a dot. (e) Heatmap showing gene expression changes in NPM-ALK transformed primary human CD4 T cells as compared to cells expressing NPM-ALKKD over time for the 24 genes in the ALK+ ALCL gene expression signature identified by Piva et al. This signature classifies ALK+ ALCL tumors with a sensitivity and specificity of >95%. Significantly different values (P<0.05) are highlighted with a dot. (f) Principal component analysis of RNA sequencing results for NPM-ALK-transduced (blue), NPM-ALKKD-transduced (red), and untransduced (UTD; black) T cells from day 6 through day 63 as indicated by different symbols. (g) Volcano plots depicting gene expression profiles from RNAseq in CD4 T cells transduced with NPM-ALK versus NPM-ALKKD cells at days 6, 12 and 63. The number of genes significantly upregulated for each plot is indicated in the upper right-hand corner and the number of genes significantly downregulated is listed in the upper left-hand corner of each plot. The day 63 analysis compared NPM-ALK with NPM-ALKKD day 12 gene expression profiles since the NPM-ALKKD cells do not survive to day 63. Genes that resulted in a significant difference P<0.05 are highlighted in red (upregulated) or blue (downregulated). (h,i) Gene enrichment analysis using GSEA from NPM-ALK vs. NPM-ALKKD cells at indicated days post stimulation. The top 50 GSEA pathways are shown, and the colors in the heatmap indicate the normalized enrichment score (NES) for each pathway. For days 33 and 63 NPM-ALK profiles were compared with Day 12 NPM-ALKKD profiles. (i) Time course showing individual GSEA analysis for MYC target genes.
To capture the temporal changes in gene expression induced by NPM-ALK as it drives T cells to become malignant, we analyzed the gene expression profile of 3 of these lines at 6, 9, 12, 33, and 63 days after induction of NPM-ALK expression. Since we compare expression profiles with similarly activated T cells transduced with NPM-ALKKD, our analysis focuses on the changes induced by kinase active NPM-ALK expression within the background of those induced by CD3/28 costimulation (38). To determine whether our analysis mirrored data from previous studies that examined gene expression in patient-derived ALCL, we first examined transcripts known to be regulated by NPM-ALK (32,39–42). Consistent with these previous studies, we saw upregulation of GZMB, IL10 and PDL1 (CD274) and downregulation of ZAP70, CD3E, and LCK in the ALCL lines we generated (Fig. 1d). Additionally, we took advantage of a 24-gene signature that was developed to distinguish ALK+ ALCL from related T cell tumors with a sensitivity and specificity of greater than 95% (43). This comparison suggests that the T cell tumors generated in vitro via NPM-ALK transduction have many of the characteristics of patient derived ALCL. (Fig. 1e). Principal component analysis of the RNA expression data revealed that the NPM-ALK-expressing T cells cluster together in a time point dependent manner, while the NPM-ALKKD and untransduced T cells cluster tightly with each other and separately from the NPM-ALK expressing cells (Fig. 1f). The distribution of time points for the NPM-ALK samples within the PCA plot suggests a stepwise progression of the cells from normal CD4 T cells to transformed cells on days 33 and 63 (no regression is observed). The proximity of the day 33 and 63 samples also suggests that approximately 5 weeks after the introduction of NPM-ALK, most gene expression changes induced by NPM-ALK have been set and do not change significantly afterwards. Comparison of gene expression patterns in NPM-ALK and NPM-ALKKD expressing cells demonstrates that NPM-ALK has dramatic effects on expression of many genes (>5000) as early as 6 days after it is expressed (Fig. 1g). At these early time points, fold-change increases in genes upregulated by NPM-ALK are larger than those in downregulated genes. At later time points, an equal number of genes are up and downregulated, and fold changes in genes both induced and repressed by NPM-ALK become of similar magnitude, suggesting that repression of some genes may reflect secondary regulatory events. Further analysis of mRNA expression within 10 gene clusters revealed coordinated waves of gene expression changes over time (Supplementary Fig. S2a–c). Through Gene Set Enrichment Analysis (GSEA) (Fig. 1h), and using annotation based on Kyoto Encyclopedia of Genes and Genomes (KEGG) (Supplementary Fig. S2d), we noted perturbation of many signaling pathways as a healthy T cell becomes a tumor. After six days of NPM-ALK expression, we observed a striking repression of several classes of genes targeted by c-MYC, E2F, mTOR and G2M signaling (Fig. 1h–i). However, three to six days later these pathways switched from being repressed to being activated (lower bottom, Fig. 1h). Other pathways such as the STAT3 signaling and epithelial-to-mesenchymal transition (EMT) programs remained upregulated at all time points, while those associated with DNA repair and WNT/beta catenin signaling were repressed at all time points. These studies highlight the coordinated, dynamic and profound changes in gene expression profiles that occur during oncogenic CD4 T cell transformation.
NPM-ALK activates gene expression programs of early progenitor T cells, represses genes specific to the T cell lineage, and alters DNA methylation patterns.
One striking observation from the gene expression data is that many T cell-specific transcription factors, surface receptors, and other functional molecules were strongly repressed by NPM-ALK, while several genes known to be expressed in immature lymphocyte progenitors, hematopoietic progenitor cells, and non-T cell lineages were upregulated (Fig. 2a–e). These data suggest that NPM-ALK induces a de-differentiation of T cells towards a progenitor-like state. A previous study demonstrated that ALK+ ALCL patient cells have DNA methylation patterns similar to early thymic progenitors (17). Therefore, we examined the methylation status of T cell specific genes to determine if NPM-ALK expression can induce methylation of specific gene loci, which are epigenetically silenced in thymic progenitors. Indeed, we detected increased levels of methylation at the promoters of T cell specific proteins in cells expressing NPM-ALK, including CD3E, LCK, TCF7, and SHP1 promoters (Fig. S3a–c). To determine the kinetics of DNA methylation, we analyzed the methylation status of the SHP-1 and LCK promoters over time as T cells were undergoing NPM-ALK-induced transformation (Fig. 2f–g). Methylation of the SHP-1 promoter was not detected until after the T cells had become fully transformed, with limited methylation of the promoter seen on Day 56 but gradually increasing afterwards up to Day 241. Similarly, no methylation was observed at the LCK promoter on Days 11 and 28 after NPM-ALK expression, however, methylation appeared by Day 56 and had increased by Day 118. Because the RNA sequencing data demonstrate downregulation of LCK and SHP1 RNA as early as day 6 after introduction of NPM-ALK, these data demonstrate that methylation occurs after expression of these proteins is inhibited, consistent with previous observations that DNA methylation is not an early step in gene silencing, but rather is important for reinforcing and maintaining genes in the off state after the initial silencing event (44). These data reveal the potent transforming abilities of NPM-ALK and the remarkable plasticity of mature CD4 T cells.
Figure 2: NPM-ALK activates gene expression programs of early progenitor cells, represses genes specific to the T cell lineage, and alters DNA methylation patterns.
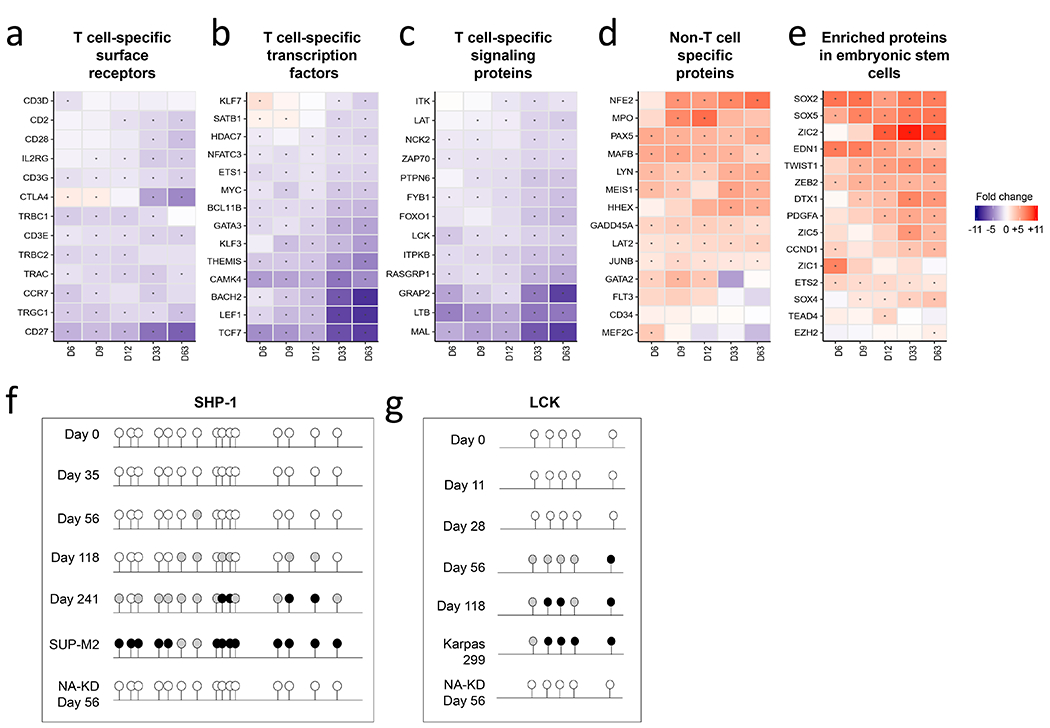
(a-e) Gene expression patterns of CD4 T cells undergoing transformation over time, arranged according to T cell-specific surface receptors (a), T cell-specific transcription factors (b), T cell-specific signaling proteins (c), non-T cell-specific genes (d), and embryonic/stem cell-specific genes (e). (f,g) Methylation status of (f) SHP1 and (g) LCK promoters in NPM-ALK transformed CD4 T cells over time. The ALCL ALK+ cell lines Karpas 299 and SUP-M2, and CD4 T cells transduced with NPM-ALKKD were used as positive and negative controls respectively. The NPM-ALKKD expressing T cells were re-stimulated every 10-14 days with CD3/28 beads were analyzed after 56 days of culture.
NPM-ALK re-programs T cell effector function.
Our expression profiling data show that NPM-ALK rapidly alters the expression of genes involved in TCR signaling and T cell identity. This prompted us to investigate how rapidly NPM-ALK alters a T cell’s ability to respond to cognate antigen. For this purpose, we co-transduced CD4 T cells with NPM-ALK or NPM-ALKKD together with a TCR that confers CD8 independent recognition to an HLA-A2-restricted, HIV DNA polymerase specific antigen termed A2-IV9 (22) (Fig. 3a). Next, we co-cultured these T cells with K562 cell-based artificial APCs engineered to express HLA-A2 and a portion of the HIV DNA polymerase corresponding to the A2-IV9 antigen linked to GFP (KTA2.IV9) and measured intracellular cytokine production (Fig. 3b). NPM-ALKKD, A2-IV9-specific expressing T cells produced high levels of TNFα and IL-2. In contrast, NPM-ALK, A2-IV9-specific expressing T cells had significantly impaired ability to produce these cytokines after antigenic stimulation, even after treatment with PMA and lonomycin. We next investigated how rapidly NPM-ALK alters cytokine production by stimulating T cells with PMA and lonomycin 1, 3, 5, and 7 days after transduction with NPM-ALK or NPM-ALKKD (Fig. 3c–d). One day after transduction of NPM-ALK into the cells (Day 2 of culture), before NPM-ALK reaches its maximum levels of expression, we noted some inhibition of cytokine synthesis. Between 3 and 7 days after the introduction of NPM-ALK (4 and 8 days of culture), we observed significantly decreased levels of GM-CSF, TNF, and IL-2 with repression of IL-2 and GM-CSF being the most striking. We observed elevated levels of IFNγ production in NPM-ALK cells as compared to NPM-ALKKD cells after treatment with PMA and lonomycin at these time points, consistent with an increased IFNγ signaling signature (Fig. 1h). Together, these data indicate that most but not all of the T cell effector cytokines produced in response to antigen stimulation are rapidly repressed by NPM-ALK expression.
Figure 3: NPM-ALK re-programs T cell effector function.
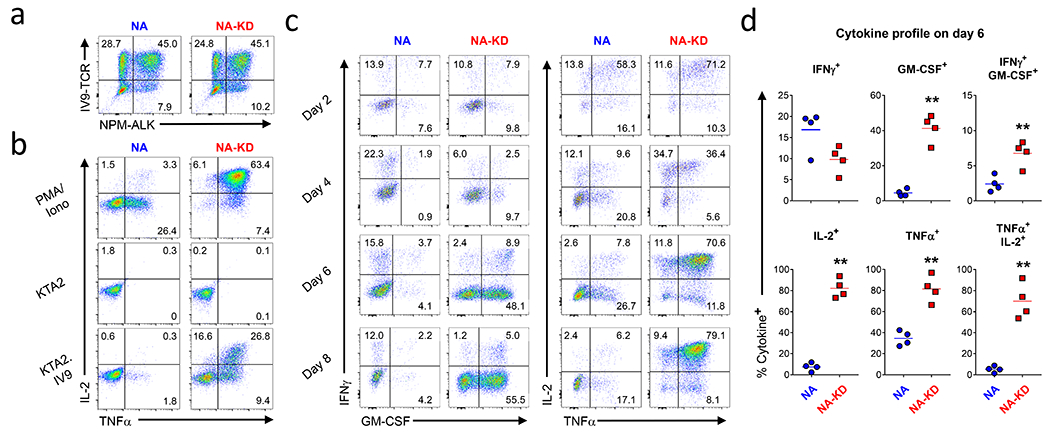
(a) CD4 T cells were activated with CD3/28 coated beads and a day later were co-transduced with a HIV specific TCR and NPM-ALK/ NPM-ALKKD. After 8 days of culture, these transduced T cells were stained with IV9 tetramer and NPM-ALK antibody and analyzed by flow cytometry. (b) Transduced cells shown in (a) were stimulated with PMA and Ionomycin, HLA-A2 expressing K562 cells, and HLA-A2 expressing K562 cells transduced with a minigene that contains 50 amino acids surrounding the IV9 epitope linked to GFP. After 5 hours, IL-2 and TNFα were measured by intracellular cytokine staining and flow cytometry. (c,d) After the indicated number of days in culture, T cells transduced with NPM-ALK were treated with PMA and lonomycin, and after 5 hours, IFNγ, GM-CSF, IL-2 and TNFα were measured by intracellular cytokine staining on CD4+ live cells, (c) is representative data from one experiment and (d) shows summary data from 4 donors at the day 6 time point.
The NPM-ALK-Y567-644-646F triple point mutant is unable to transform primary human CD4 T cells.
In order to better understand the NPM-ALK-generated signals that are required to mediate transformation, we generated a large array of tyrosine mutants based on previous studies that investigated NPM-ALK-transformed cell lines (4) (Fig. 4a). Surprisingly, no single Y to F mutation interfered with the ability of NPM-ALK to transform T cells (Fig. 4b), and several of these mutations (Y461F, Y156F and Y664F) appeared to promote T cell transformation. However, only one of these mutants (NPM-ALKY664F) consistently transformed T cells faster that NPM-ALK (Fig. 4c, S4a). In NPM-ALKY664F transformed cells we observed less NPM-ALK-mediated cell death and increased TCR diversity when compared to NPM-ALK transformed cells (Fig. S4b–d). This suggests that this mutant, when expressed in primary human T cells, causes less initial oncogenic stress, resulting in more individual T cells becoming transformed. Gene expression profiling comparing T cells transduced with NPM-ALK and NPM-ALKY664F revealed similar changes in gene expression relative to NPM-ALKKD T cells as indicated by PCA dissimilarity and GSEA analysis (Fig. 4d–e), but the degree to which the related pathways are regulated appear to be less pronounced when compared to T cells expressing NPM-ALK (compare Fig. 1h vs. Fig. 4e). In addition, a set of genes are discordantly regulated between T cells expressing NPM-ALK and NPM-ALKY664F (Fig. S4e), suggesting that altered gene expression and signaling of the NPM-ALKY664F mutant in comparison to wild type NPM-ALK may also contribute to its enhanced ability to transform primary human T cells.
Figure 4: The NPM-ALK-Y567-644-646F mutant is unable to transform primary human CD4 T cells.
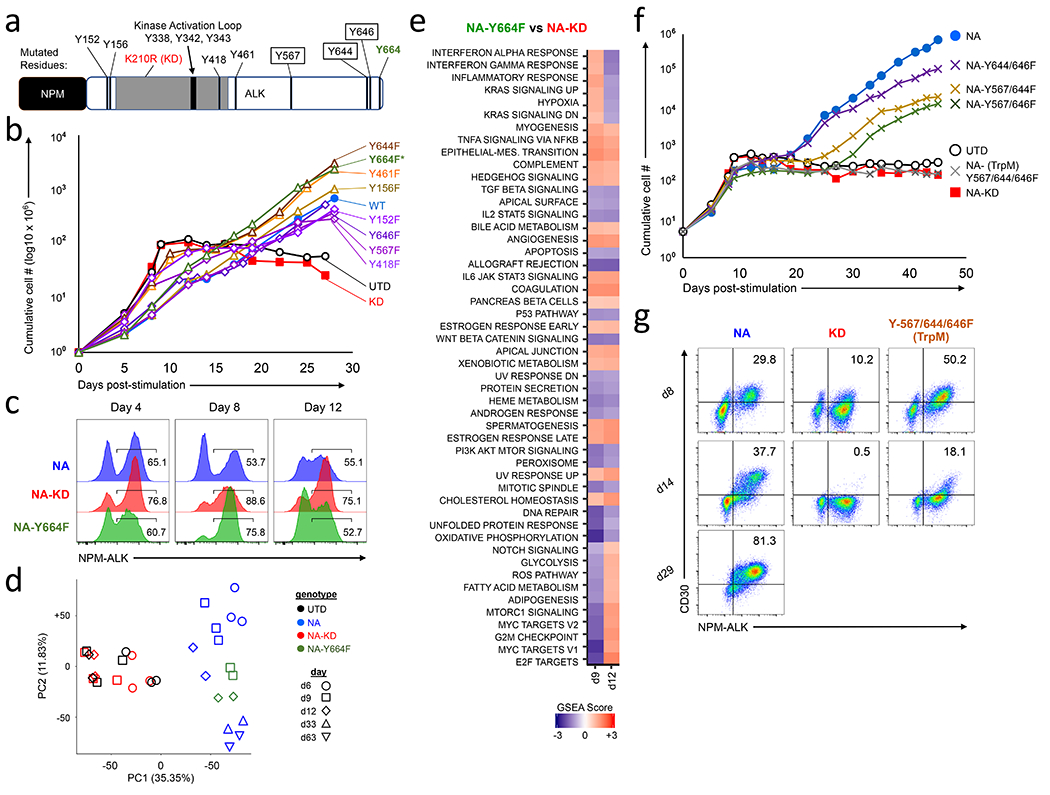
(a) Diagram of NPM-ALK fusion protein indicating the kinase activation loop and the tyrosine residues studied. Tyrosine residues highlighted in a black box indicate the triple mutant, and tyrosine Y664 is indicated with an asterisk. (b) Cumulative growth curves of primary human CD4 T cells transduced with the indicated single NPM-ALK Tyrosine to Phenylalanine (Y➔F) mutation, (c) Expression levels of NPM-ALK at days 4, 8 and 12 after transduction in CD4 T cells transduced with either NPM-ALK, NPM-ALKKD or NPM-ALKY664F. (d) PCA analysis obtained from comparing RNAseq profiles from CD4 T cells expressing NPM-ALK, NPM-ALKKD or NPM-ALKY664F on the indicated days, (e) GSEA scores comparing CD4 T cells transduced with NPM-ALKY664F against NPM-ALKKD on days 9 and 12. (f) Cumulative growth curves of primary human CD4 T cells transduced with the indicated double or triple NPM-ALK Y➔F mutations. NPM-ALKTrpM = NPM-ALK-Y567/644/646F triple mutant. (g) NPM-ALK and CD30 expression were measured by flow cytometry for the NPM-ALK, NPM-ALKKD and NPM-ALK-Y567-644-646F mutants depicted in f at time points of 8, 14 and 29 days after lentiviral transduction. Data shown is representative of 6-12 independent experiments.
Since no single tyrosine mutant blocked the ability of NPM-ALK to transform T cells, we created a series of double and triple Y to F mutants within NPM-ALK in order to define the fewest number of mutations required to block NPM-ALK’s transforming ability. After evaluating a number of combinations (Fig. S4f), we identified a triple point mutant, NPM-ALK-Y567-644-646F (NPM-ALKTrpM) that failed to transform mature CD4 T cells (Fig. 4f and Fig. S4g). Importantly, the NPM-ALKTrpM mutant induced some signaling in T cells as demonstrated by induction of CD30 expression at early time points (Fig. 4g, Day 8), but this was not maintained and the cultures were not viable after 20-30 days post-NPM-ALKTrpM transduction. Thus, the NPM-ALKTrpM mutant can temporarily display some of the hallmarks of NPM-ALK-mediated transformation but is unable to fully support and sustain T cell transformation.
NPM-ALKTrpM fails to bind GRB2/SOS, SHC1, SHC4, and UBASH3B protein complexes.
To define differential gene expression patterns induced by NPM-ALKTrpM relative to NPM-ALK, we performed RNA sequencing on cells expressing NPM-ALK, NPM-ALKKD, or NPM-ALKTrpM after 6 and 9 days of culture. PCA analysis revealed that cells expressing NPM-ALKTrpM cluster between NPM-ALK and NPM-ALKKD (Fig. 5a), which is consistent with our previous observations showing that NPM-ALKTrpM initiates aspects of NPM-ALK signaling but cannot mediate full T cell transformation (Fig. 4f–g). GSEA comparison between NPM-ALKTrpM and NPM-ALKKD showed that some gene sets including E2F, IFNα and IFNγ, and KRAS are similarly regulated by both NPM-ALK and NPM-ALKTrpM (Fig. 5b). However, there were a number of pathways that are regulated by NPM-ALK but not by NPM-ALKTrpM. For instance, compared to the changes in regulation happening in NA vs NA-KD (Fig. 1h), we did not see induction of genes regulated by EMT, STAT3 or Notch nor did we observe downregulation of MYC, mTORC-1 and WNT signaling pathways at Days 6 and 9. We also compared gene sets identified in Fig. 2 that focus on T and stem cell-specific factors in NPM-ALKTrpM vs NPM-ALKKD expressing T cells (Fig. 5c). NPM-ALKTrpM was able to downregulate T cell specific surface receptors similarly to NPM-ALK but not T cell specific transcription factors or signaling proteins. We did not see induction of the non-T cell specific genes or genes associated embryonic stem cells by NPM-ALKTrpM, further supporting the GSEA analysis indicating that NPM-ALKTrpM is unable to induce the de-differentiation program that may be required to enable transformation of mature T cells.
Figure 5. NPM-ALKTrpM fails to bind GRB2/SOS, SHC1, SHC4, and UBASH3B protein complexes.
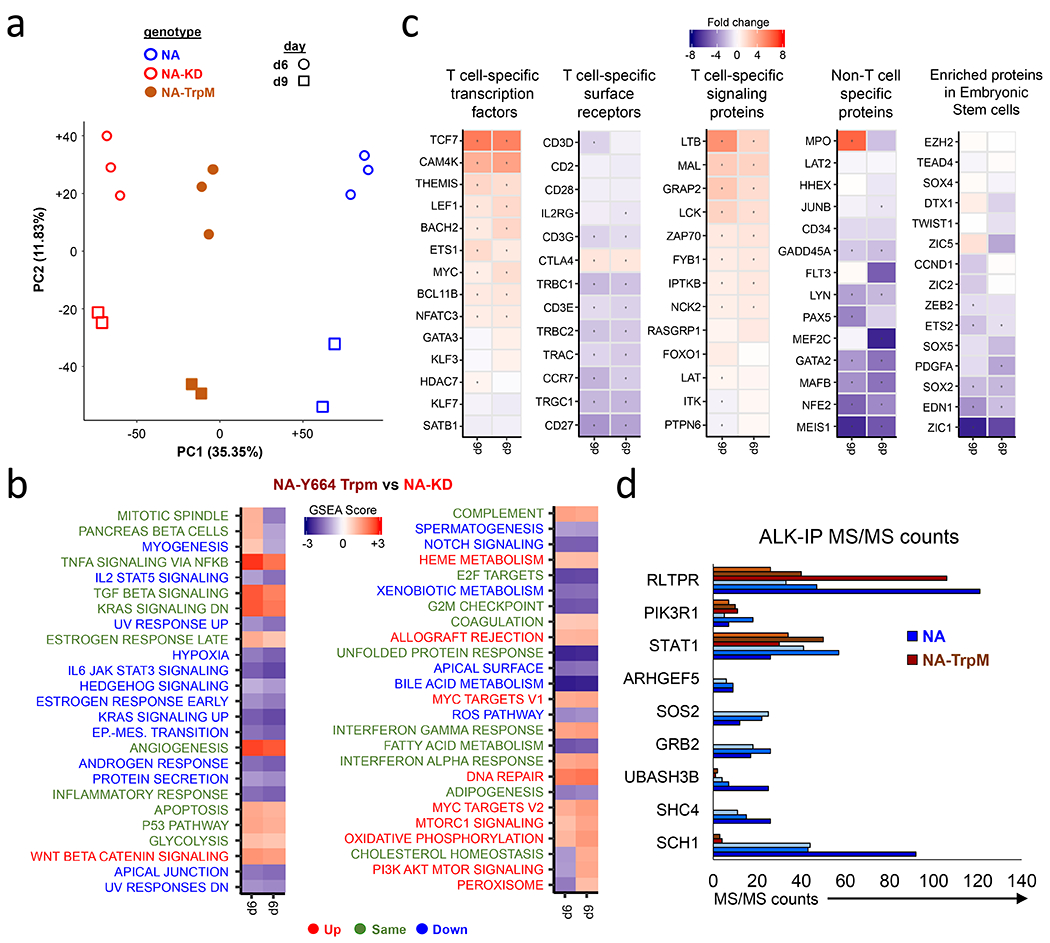
(a) PCA analysis comparing RNA sequencing results on cells expressing NPM-ALK, NPM-ALKKD, or NPM-ALKTrpM at 6 and 9 days after start of transduction. (b) GSEA Normalized Enrichment scores (NES) of NPM-ALKTrpM vs NPM-ALKKD. For the lettering of pathways indicated beside the heatmap, Green indicates pathways that similarly regulated between NPM-ALKTrpM and NPM-ALK (Figure 2E). Blue indicates pathways that are downregulated by NPM-ALKTrpM and are not downregulated by NPM-ALK and red indicates pathways that are upregulated by NPM-ALKTrpM but are not upregulated by NPM-ALK. (c) Individual gene mRNA expression levels in NPM-ALKTrpM vs NPM-ALK arranged according to specific T cell identity aspects or embryonic-stem cell specific proteins. (d) NPM-ALK, NPM-ALKKD or NPM-ALKTrpM transduced CD4 T cells were lysed and immunoprecipitation performed with primary antibodies against ALK. IP eluents were run on an acrylamide gel and bands were cut out and further processed for MS/MS analysis. Shown are the MS/MS counts for the all proteins that were not found in the pulled-down in the NPM-ALK NPM-ALKTrpM cells when compared to the NPM-ALK IP precipitates, and 3 proteins that were pulled-down to similar extent in both precipitates. MS/MS values for 3 independent experiments are depicted. Table S1 summarizes all of the proteins identified by this approach.
To gain further insight into the signaling complexes that are required for NPM-ALK-mediated transformation, we identified proteins whose binding to NPM-ALK is lost in NPM-ALKTrpM. We performed immunoprecipitation of NPM-ALK followed by Tandem LC MS/MS from T cells expressing either NPM-ALK, NPM-ALKKD, NPM-ALKY664F, or NPM-ALKTrpM. We performed immunoprecipitation on day 8, which is a time of high cell viability and also when CD30 and PD-L1 are still expressed in NPM-ALKTrpM T cells. NPM-ALKTrpM failed to bind several signaling proteins such as SOS2, GRB2, and SHC1 while others such as STAT1 bound NPM-ALK and NPM-ALKTrpM equivalently (Fig. 5d and Table S1). These proteins have been shown to bind NPM-ALK in patient-derived ALCLs or cell lines forced to express NPM-ALK (45,46). We also identified several proteins not previously demonstrated to bind to NPM-ALK, including SHC4, ARHGEF5 and UBASH3B, which interact with NPM-ALK but fail to interact with either NPM-ALKKD or NPM-ALKTrpM. The SHC1 and UBASH3B interactions with NPM-ALK but not NPM-ALKTrpM were further validated by western blotting (Fig. S5). Thus, by making mutations to three residues within NPM-ALK outside of the kinase domain, we no longer observed NPM-ALK-mediated transformation, indicating that complexes that bind to these motifs and the pathways they regulate provide signals that are critical for T cell transformation.
Lentiviral vector insertion analysis identifies ARID1A as a candidate gene that can influence NPM-ALK-mediated transformation.
Lentiviral insertional mutagenesis has been a potent means to discover genes that potentiate CAR T cell function (47,48). We wished to determine whether we could use this approach to identify genes that promoted NPM-ALK transformation. To determine whether T cells harboring specific integrations were enriched over time using the samples described in Fig 1a, we first analyzed samples from three experiments collected at ~12, 28 and > 50 days post NPM-ALK transduction. We observed that the number of independent clones, as reported by marking with unique vector integration sites, decreased over time until only a handful of clones dominated the culture (Fig. 6a–b, and Fig. S6a). Analysis of the distributions of integration sites relative to chromosomal features showed that integration was favored near active transcription units and associated epigenetic marks (Fig. 6c–d), and that there were no major differences early versus late, or comparing NPM-ALK to NPM-ALKY664F cells.
Figure 6; Lentiviral vector insertion analysis identifies ARID1A as a candidate gene that can influence NPM-ALK-mediated transformation.
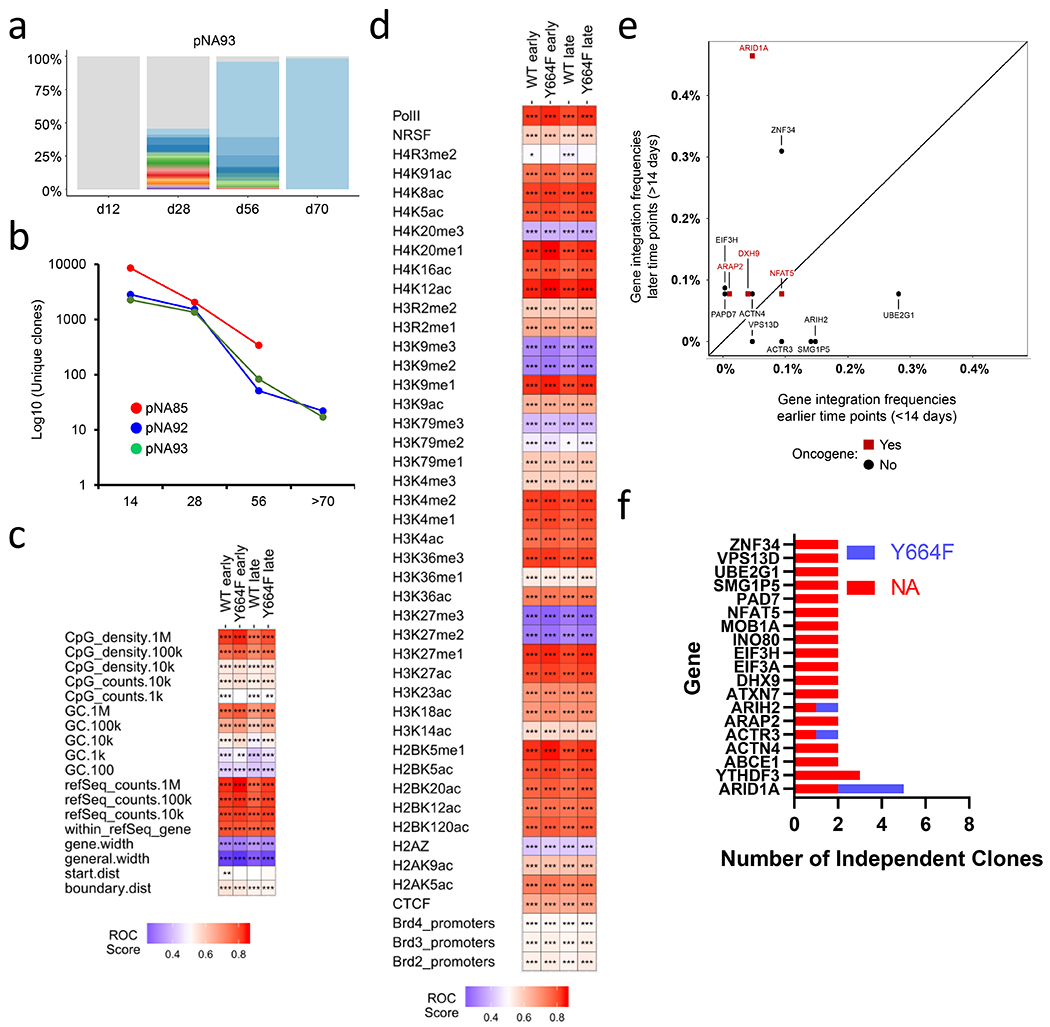
(a) At the indicated time points, genomic DNA was prepared from an NPM-ALK transformed cell line and the number of unique integration sites were measured. Colors other than gray depict the enriched clones and the relative width of the line reflects clone abundance in one cell line. (b) Number of unique clones measured over time for three independent NPM-ALK cell lines. (c) Heat map summarizing lentiviral vector integration frequency relative to mapped genomic features. The distributions of vector integration sites were compared to distributions of random sites using the ROC area method (28). The columns indicated data for pooled integration site data for each sample type. The rows indicate comparisons to annotation of genomic features on the human draft genome sequence (hg38). Values of the ROC area are color coded on each tile and vary between 0 (negatively associated; blue) and 1 (positively associated; red). Because the most appropriate chromosomal interval for comparison is unknown, multiple different intervals were used. P-values were calculated using the Wald test using a Chi Square distribution; no correction for multiple comparisons was applied. p-values are marked on the heat map tiles as follows: p < 0.05 (*), < 0.01 (**), < 0.001 (***). refSeq.counts indicates comparison based on relationships to refseq gene numbers in the indicated intervals; gene.width indicates the width of genes hosting integration sites; general.width indicates the width of intergenic regions hosting integration sites; start.dist shows comparisons based on distances to transcription start sites, and boundary.dist compares based on distances to gene boundaries. Early refers to less than 14 days of culture. (d) As in (c), but comparing integration site distributions and random distributions relative to mapped epigenetic marks and sites of bound proteins in T cells (indicated with row labels). All comparisons used 10 kilobase intervals. (e) Bivariate plot showing frequencies of integration within select genes (see Fig. 6f) during early and later time points from the NA93 cell culture. (f) List of genes with vector insertions within 25KB of its coding region whose clonal relative abundances exceeds 1% of an ALCL line. Only genes that had vector insertions in two or more out of 29 NPM-ALK or 3 NPM-ALKY664F ALCL cultures are displayed.
Next, we hypothesized that the repeated isolation of integration sites in or near the same gene may indicate that insertional mutagenesis altered activity of the targeted gene, thereby promoting cell growth. We thus examined all 29 transformation experiments to determine whether any signaling pathways or individual genes were consistently targeted by lentiviral integration in NPM-ALK tumors that expanded. There was great heterogeneity in the number of clones within a particular cell line, with some tumor lines being nearly homogenous with a single vector insertion event, while others contained well over 20 separate vector integrations (Fig. S6b). Integration acceptor sites were spread throughout the genome and were not preferentially located in oncogenes (Table S2). However, we did observe insertion of lentiviral vectors near a distinct set of functionally diverse genes in multiple independent samples (Fig 6e–f), including genes involved in chromatin structure (ARID1A, INO80), cytoskeleton (ACTN4, ACTR3, ARAP2, ATXN7), RNA turnover (YTHDF3, ABCE1, DNX9), protein translation (E1F3A, E1F3H), tumor suppression (MOB1A), and ubiquitination (AR1H2, UBE2G1).
We carried out a permutation test to assess the significance of the repeated isolation of integration sites in genes associated with expanded clones. We defined expanded clones as those comprising at least 1% of all cells sampled, yielding a total of 295 clones. We then drew 295 clones from the pool of all clones 1000 times, and asked how often we obtained multiple integration sites in the same locus. Of the thousand draws, only 15 showed 5 isolations within the same gene, suggesting the detection of 5 expanded clones at ARID1A was likely not due to chance (simulation p value of 0.015). Lower numbers of recurrences were obtained more frequently and could be due to chance. Together, these analyses provide the rationale to perform mechanistic studies to determine the role ARID1A plays in NPM-ALK-mediated T cell transformation.
TCR triggering is required to transform NPM-ALK expressing T cells.
Healthy individuals can harbor resting T cells that have the NPM-ALK translocation (8–11). We wished to see if we could recapitulate this in our system to interrogate why some individuals progress to ALCLs while others remain healthy. A cocktail of cytokines (IL-2, IL-7 and IL-15) was shown to facilitate low levels of proliferation and efficient lentiviral transduction in the absence of TCR triggering (49). We introduced NPM-ALK, NPM-ALKY664F and NPM-ALKKD into these cytokine-treated T cells (Fig. 7a) and tracked survival and expansion to determine the NPM-ALK transformative capacities (Fig. 7b). After one month of culture in these cytokines, we observed no T cell transformation despite seeing high and consistent expression of NPM-ALK and robust T cell viability. Moreover, we did not observe any difference between T cells that received NPM-ALK or NPM-ALKY664F and those that received NPM-ALKKD, indicating that NPM-ALK expression alone is not sufficient to transform primary human T cells. To determine if TCR signals are necessary to promote T cell transformation, we stimulated NPM-ALK expressing T cells with anti-CD3/28 or anti-CD3 nine days after the initial cytokine mediated transduction (Fig. 7c–d). In all cases, NPM-ALK and NPM-ALKY664F expressing T cells transformed, whereas those expressing NPM-ALKKD did not. Additionally, consistent with our earlier findings, T cells expressing the NPM-ALKY644F mutant transformed more rapidly than T cells expressing wild type NPM-ALK after CD3 only or CD3/CD28 stimulation, indicating that co-stimulation is not necessary for NPM-ALK-mediated transformation of T cells. These ALCLs were indistinguishable from the ALCLs generated by first activating T cells and then transducing based on expansion kinetics, CD30 and NPM-ALK expression (Fig. 7e). It is important to note that these T cells cultured with common gamma chain cytokines can proliferate, albeit less than CD3/28 activated T cells (Fig 7f), suggesting that proliferation is not sufficient to enable T cell transformation but rather TCR triggered signal transduction is necessary for NPM-ALK-mediated transformation. Because our findings indicate that TCR triggering is an essential part of the NPM-ALK-mediated T cell transformation process, they suggest that for a T cell bearing an NPM-ALK gene translocation to gain a malignant phenotype, the T cell must first recognize its cognate pMHC and initiate TCR-dependent signal transduction. This mechanism may provide an explanation for why healthy individuals can harbor T cells containing the highly oncogenic NPM-ALK translocation without developing ALCL.
Figure 7: TCR triggering is required to transform NPM-ALK expressing T cells.
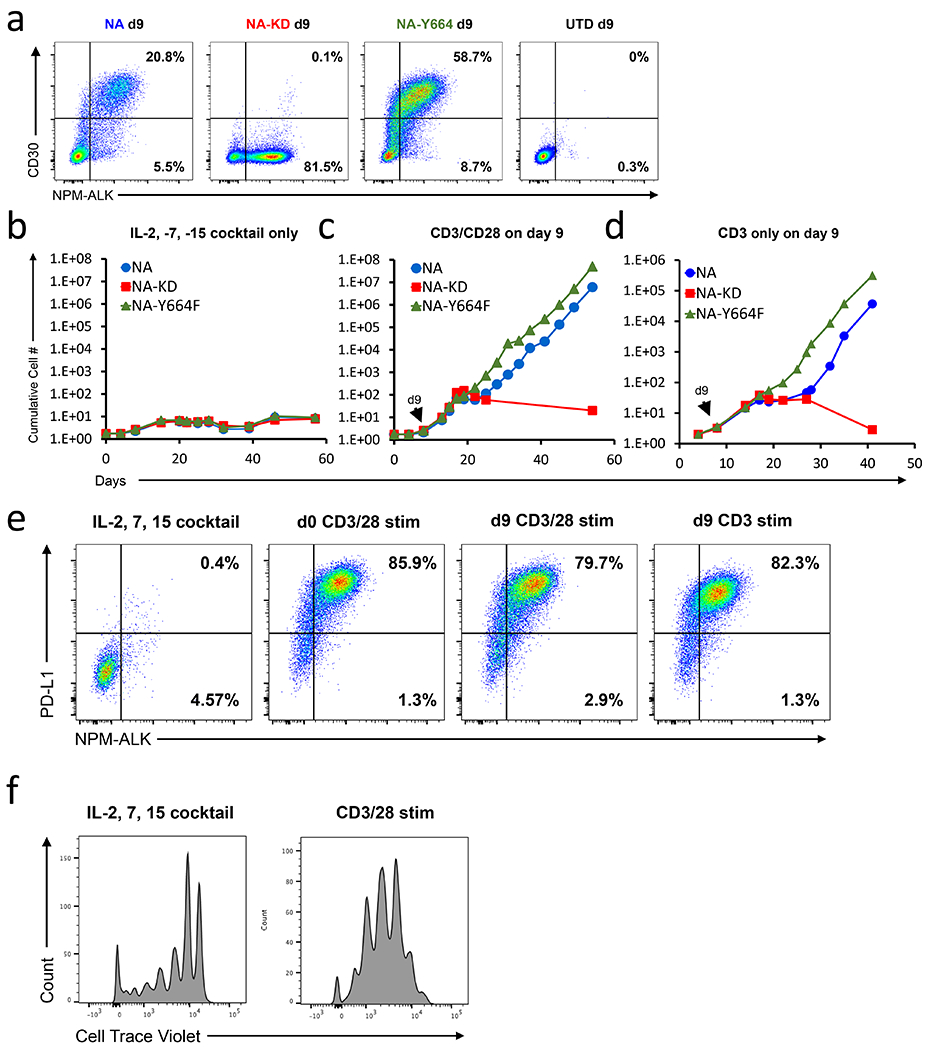
(a) Primary human CD4 T cells were incubated with IL-2, IL-7 and IL-15 and then transduced with the indicated NPM-ALK isoform. Nine days after transduction both NPM-ALK and CD30 expression was measured by flow cytometry. Representative NPM-ALK and CD30 staining from 6 experiments is shown. These cells were then further not stimulated (b) or stimulated on day 9 with either anti-CD3/CD28 (c) or anti-CD3 alone coated beads (d). Representative growth curves from 2-6 experiments are shown. (e). Representative flow cytometric analysis depicting PDL1 and intracellular NPM-ALK expression 40 days after initiation of the experiment described in b. T cells stimulated with CD3/28 beads on Day 0 are shown as a control. (f). Primary human CD4 T cells were labeled with Cell Trace Violet (CTV) and stimulated with either IL-2,-7,and-15 or CD3/28 coated beads. After 9 days of stimulation, CTV dilution was measured by flow cytometry.
DISCUSSION
Studying tumorigenesis of human cells is an emerging and growing field (50). While much can be learned by studying primary tumor samples and established cell lines, this is an endpoint analysis, making it challenging to understand the events driving tumor formation. Viruses such as EBV, HTLV-1/2, and Herpesvirus saimiri can transform lymphocytes, but in these cases, viral proteins play an active role in the transformation process (51). Murine models have been used to uncover some important aspects of malignant cell transformation but overall have not proven to be faithful models of human tumorigenesis (52). In particular, several attempts have been made to generate a murine model of NPM-ALK transformation, but none have resulted in T cell tumors arising from mature T cells (18,20). Previously, we found that T cells from human peripheral blood transduced with a lentiviral vector expressing NPM-ALK were able to transform, and such tumors were indistinguishable from patient-derived ALCL when examined in adoptively-transferred NSG mice (21).
Here, using the above model, we have investigated the mechanisms required to promote full transformation of NPM-ALK-expressing T cells. We observed regulation of several critical signaling pathways including MYC, mTOR, and the EMT pathway early during transformation, as well as a striking downregulation of T cell identity and functionality (Figs 1–3, S2, S3). Critical T cell transcription factors including TCF7, BCL11b and LEF1 were strongly downregulated by NPM-ALK (Fig 2b). BACH2, which was recently shown to play a critical role in T cell subset differentiation and production of a memory T cell phenotype (53) was repressed starting as early as day 6 (Fig. 2b). SATB1, GATA3, and THEMIS, which have important roles in T cell differentiation and trafficking, were also rapidly downregulated by NPM-ALK (54–56). Simultaneous with the downregulation of mature T cell-specific genes, we observed an upregulation of a pluripotency signature, including genes such as Sox2, Zeb2 and ETS2 (Fig 2e), which are normally expressed in embryonic stem cells or early progenitor cells. Thus, by both upregulating programs associated with sternness and downregulating genes associated with T cell differentiation, the NPM-ALK-induced program leads to malignant transformation.
The above findings are important given that some studies postulate that the ALK+ ALCL cell of origin may be a thymic progenitor cell (17–19). The evidence in favor of this scenario includes the methylation of promoters of T-cell specific genes and a cell morphology that more closely resembles early thymic progenitors (17,40). In CD4 T cells transformed by NPM-ALK, we observed a downregulation of the same T cell-specific proteins that display hypermethylation in ALK+ALCL cells (Fig. 2, S3) (17). Moreover, SHP-1 (PTPN6), which is epigenetically silenced in many hematologic malignancies including NPM-ALK+ ALCL (57), was downregulated by NPM-ALK as early as day 9 (Fig 2c, 2f, S3). The striking similarity in the T cell specific genes downregulated by NPM-ALK and those methylated in patient samples further supports the notion that NPM-ALK may promote de-differentiation of mature CD4 T cells.
We found that, other than disruption of the NPM-ALK catalytic domain (NPM-ALKKD), no single mutation that impairs tyrosine phosphorylation blocked T cell transformation (Fig 4a–b, S4g), suggesting that NPM-ALK recruits a large signaling complex(es), which remains stable when single anchor points are removed. By defining a triple mutant that failed to transform T cells, we uncovered signals that are required to mediate full transformation (Fig 4f–g, 5, S4f–g). We did not observe early repression of MYC signaling, induction of the EMT program, nor sustained STAT3 signaling in NPM-ALKTrpM when compared to NPM-ALKKD, whereas NPM-ALK and NPM-ALKTrpM equally regulated other pathways including glycolysis, TNFα signaling, and apoptosis (Fig 5b). Importantly, while we observed downregulation of some T cell specific factors, we did not observe induction of genes associated with sternness, indicating that early induction of these factors may be important for the de-differentiation required to facilitate transformation (Fig. 5c). These data suggest that the protein complexes that bind to NPM-ALK but not NPM-ALKTrpM (Fig. 5d) modulate some if not all the pathways regulated by NPM-ALK that are essential for transformation.
Our data uncovered a set of genes that may favor the expansion and/or survival of particular NPM-ALK clones (Fig 6). Of note, ARID1A is a tumor-suppressor gene frequently disrupted in ovarian cancers (58) and clones with lentiviral integrations in this locus preferentially expanded in five out of 29 independent experiments (Fig 6e–f). ARID1A suppresses HDAC6 activity (59), which suggests that loss of ARID1A activity would result in more HDAC6 mediated epigenetic changes. ARID1A is normally expressed in lymph nodes, and loss of activity has been implicated in genome instability and cancer progression (60,61), suggesting that ARID1A may be a negative regulator of NPM-ALK transformation. ARID1A down-regulation has also been implicated in inducing the EMT program (61), potentially contributing to the transcriptional signal observed here.
Our studies also suggest that a key factor in determining why some individuals that harbor T cells with NPM-ALK translocations develop into ALCL is whether their T cells become exposed to antigens (pMHC). This finding also suggests that a specific TCR-triggered pathway(s), rather than an exit from G0 or increased metabolic activity, is required to enable NPM-ALK transformation, as cytokine-treated T cells have many of the characteristics of activated T cells but did not transform (Fig 7b,e,f). The cooperation between NPM-ALK and TCR signaling is likely to be essential only during the initial stages of NPM-ALK-mediated transformation since NPM-ALK subsequently downregulates many components of the TCR signaling pathway (17,62,63).
In summary, we have developed a robust model of early-stage T cell oncogenesis that demonstrates the requirement for TCR activation to foster the full transformation of NPM-ALK-expressing T cells. We also identify dynamic regulation of the MYC, EMT, and PI3K/mTOR, signaling pathways early in the transformation process that parallel a downregulation of T cell identity and function. We further define key residues within NPM-ALK required for binding to signaling complexes that are mandatory to promote and sustain NPM-ALK-mediated oncogenic transformation. Finally, we reveal changes in the gene expression and epigenetic profiles that a mature T cell undergoes to become akin to an immature T cell, making a strong case that ALK+ ALCL can originate from mature CD4 T cells. We believe that our findings describing the fundamental mechanisms of NPM-ALK-mediated oncogenesis can serve as a model to better understand factors that promote or repress tumor formation.
Supplementary Material
STATEMENT OF SIGNIFICANCE.
This investigation into malignant transformation of T cells uncovers a requirement for TCR triggering, elucidates integral signaling complexes nucleated by NPM-ALK, and delineates dynamic transcriptional changes as a T cell transforms.
Acknowledgements:
We thank the Penn Center for AIDS Research (P30-AI045008) and Cancer Center Human Immunology Core (P30-CA016520) for providing purified human T cells (Meizan Lai, Kevin Gayout, Chui Yu Lau, Emily Winters), and performing the immune repertoire profiling experiments (Wenzhao Meng and Eline T Luning Prak); Frances Male for help with the integration analysis; Penn Bioinformatics Core (Taehyong Kim, Paul Wang) for help with RNA sequencing analysis; and the Proteomics & Metabolomics Facility at The Wistar Institute (Hsin Yao Tang, and Thomas Beer) for performing the mass spectrometry analysis. We also thank Samik Basu, Raymond Joseph Moniz, Peter Georgiev, Elaine Pinheiro, Sheila Ranganath from Merck, the NIH Tetramer Facility is supported by contract HHSN272201300006C from the National Institute of Allergy and Infectious Diseases, a component of the National Institutes of Health in the Department of Health and Human Services for the IV9 tetramer, Megan Lim and Kojo Elenitoba-Johnson, and Riley Lab for helpful discussions. Support for these studies was provided by the NIH (T32HL007775, U19AI117950), Tmunity Therapeutics, and Merck.
Funding:
Support for these studies was provided by the NIH (T32HL007775, U19AI117950), Tmunity Therapeutics, and Merck.
Competing interest statement:
J.L.R. is a co-founder and shareholder of Tmunity Therapeutics. He has been in receipt of research funding from Merck and Tmunity Therapeutics. Q.Z., F.W., M.A.W, and J.L.R. are inventors on Patent Application US20160194616A1 which is licensed to the University of Pennsylvania. A.W. and S.J. were employees of Merck when these studies were performed.
References
- 1.Morris SW, Kirstein MN, Valentine MB, Dittmer KG, Shapiro DN, Saltman DL, et al. Fusion of a kinase gene, ALK, to a nucleolar protein gene, NPM, in non-Hodgkin’s lymphoma. Science 1994;263(5151):1281–4. [DOI] [PubMed] [Google Scholar]
- 2.Ferreri AJM, Govi S, Pileri SA, Savage KJ. Anaplastic large cell lymphoma, ALK-positive. Critical Reviews in Oncology / Hematology 2012;83(2):293–302 doi 10.1016/j.critrevonc.2012.02.005. [DOI] [PubMed] [Google Scholar]
- 3.Bischof D, Pulford K, Mason DY, Morris SW. Role of the nucleophosmin (NPM) portion of the non-Hodgkin’s lymphoma-associated NPM-anaplastic lymphoma kinase fusion protein in oncogenesis. Molecular and cellular biology 1997;17(4):2312–25. [DOI] [PMC free article] [PubMed] [Google Scholar]
- 4.Chiarle R, Voena C, Ambrogio C, Piva R, Inghirami G. The anaplastic lymphoma kinase in the pathogenesis of cancer. Nat Rev Cancer 2008;8(1):11–23 doi 10.1038/nrc2291. [DOI] [PubMed] [Google Scholar]
- 5.Bai RY, Dieter P, Peschel C, Morris SW, Duyster J. Nucleophosmin-anaplastic lymphoma kinase of large-cell anaplastic lymphoma is a constitutively active tyrosine kinase that utilizes phospholipase C-gamma to mediate its mitogenicity. Molecular and cellular biology 1998;18(12):6951–61. [DOI] [PMC free article] [PubMed] [Google Scholar]
- 6.Werner MT, Zhao C, Zhang Q, Wasik MA. Nucleophosmin-anaplastic lymphoma kinase: the ultimate oncogene and therapeutic target. Blood 2017;129(7):823–31 doi 10.1182/blood-2016-05-717793. [DOI] [PubMed] [Google Scholar]
- 7.Palmer RH, Vernersson E, Grabbe C, Hallberg B. Anaplastic lymphoma kinase: signalling in development and disease. Biochem J 2009;420(3):345–61 doi 10.1042/BJ20090387. [DOI] [PMC free article] [PubMed] [Google Scholar]
- 8.Pulford K, Lamant L, Morris SW, Butler LH, Wood KM, Stroud D, et al. Detection of anaplastic lymphoma kinase (ALK) and nucleolar protein nucleophosmin (NPM)-ALK proteins in normal and neoplastic cells with the monoclonal antibody ALK1. Blood 1997;89(4):1394–404. [PubMed] [Google Scholar]
- 9.Maes B, Vanhentenrijk V, Wlodarska I, Cools J, Peeters B, Marynen P, et al. The NPM-ALK and the ATIC-ALK fusion genes can be detected in non-neoplastic cells. The American journal of pathology 2001;158(6):2185–93 doi 10.1016/s0002-9440(10)64690-1. [DOI] [PMC free article] [PubMed] [Google Scholar]
- 10.Laurent C, Lopez C, Desjobert C, Berrebi A, Damm-Welk C, Delsol G, et al. Circulating t(2;5)-positive cells can be detected in cord blood of healthy newborns. Leukemia 2012;26(1):188–90 doi 10.1038/leu.2011.209. [DOI] [PubMed] [Google Scholar]
- 11.Trumper L, Pfreundschuh M, Bonin FV, Daus H. Detection of the t(2;5)-associated NPM/ALK fusion cDNA in peripheral blood cells of healthy individuals. Br J Haematol 1998;103(4):1138–44. [DOI] [PubMed] [Google Scholar]
- 12.Tabbo F, Pizzi M, Kyriakides PW, Ruggeri B, Inghirami G. Oncogenic kinase fusions: an evolving arena with innovative clinical opportunities. Oncotarget 2016;7(18):25064–86 doi 10.18632/oncotarget.7853. [DOI] [PMC free article] [PubMed] [Google Scholar]
- 13.Newrzela S, Al-Ghaili N, Heinrich T, Petkova M, Hartmann S, Rengstl B, et al. T-cell receptor diversity prevents T-cell lymphoma development. Leukemia 2012;26(12):2499–507 doi 10.1038/leu.2012.142. [DOI] [PubMed] [Google Scholar]
- 14.Foss HD, Anagnostopoulos I, Araujo I, Assaf C, Demel G, Kummer JA, et al. Anaplastic large-cell lymphomas of T-cell and null-cell phenotype express cytotoxic molecules. Blood 1996;88(10):4005–11. [PubMed] [Google Scholar]
- 15.Krenacs L, Wellmann A, Sorbara L, Himmelmann AW, Bagdi E, Jaffe ES, et al. Cytotoxic cell antigen expression in anaplastic large cell lymphomas of T- and null-cell type and Hodgkin’s disease: evidence for distinct cellular origin. Blood 1997;89(3):980–9. [PubMed] [Google Scholar]
- 16.Irshaid L, Xu ML. ALCL by any other name: the many facets of anaplastic large cell lymphoma. Pathology 2020;52(1):100–10 doi 10.1016/j.pathol.2019.09.007. [DOI] [PubMed] [Google Scholar]
- 17.Hassler MR, Pulverer W, Lakshminarasimhan R, Redl E, Hacker J, Garland GD, et al. Insights into the Pathogenesis of Anaplastic Large-Cell Lymphoma through Genomewide DNA Methylation Profiling. Cell Rep 2016;17(2):596–608 doi 10.1016/j.celrep.2016.09.018. [DOI] [PMC free article] [PubMed] [Google Scholar]
- 18.Malcolm TI, Villarese P, Fairbairn CJ, Lamant L, Trinquand A, Hook CE, et al. Anaplastic large cell lymphoma arises in thymocytes and requires transient TCR expression for thymic egress. Nat Commun 2016;7:10087 doi 10.1038/ncomms10087. [DOI] [PMC free article] [PubMed] [Google Scholar]
- 19.Moti N, Malcolm T, Hamoudi R, Mian S, Garland G, Hook CE, et al. Anaplastic large cell lymphoma-propagating cells are detectable by side population analysis and possess an expression profile reflective of a primitive origin. Oncogene 2015;34(14):1843–52 doi 10.1038/onc.2014.112. [DOI] [PubMed] [Google Scholar]
- 20.Turner SD, Alexander DR. What have we learnt from mouse models of NPM-ALK-induced lymphomagenesis? Leukemia 2005;19(7):1128–34 doi 10.1038/sj.leu.2403797. [DOI] [PubMed] [Google Scholar]
- 21.Zhang Q, Wei F, Wang HY, Liu X, Roy D, Xiong QB, et al. The potent oncogene NPM-ALK mediates malignant transformation of normal human CD4(+) T lymphocytes. Am J Pathol 2013;183(6):1971–80 doi 10.1016/j.ajpath.2013.08.030. [DOI] [PMC free article] [PubMed] [Google Scholar]
- 22.Aleksic M, Liddy N, Molloy PE, Pumphrey N, Vuidepot A, Chang KM, et al. Different affinity windows for virus and cancer-specific T-cell receptors: implications for therapeutic strategies. Eur J Immunol 2012;42(12):3174–9 doi 10.1002/eji.201242606. [DOI] [PMC free article] [PubMed] [Google Scholar]
- 23.Leibman RS, Richardson MW, Ellebrecht CT, Maldini CR, Glover JA, Secreto AJ, et al. Supraphysiologic control over HIV-1 replication mediated by CD8 T cells expressing a re-engineered CD4-based chimeric antigen receptor. PLoS Pathog 2017;13(10):e1006613 doi 10.1371/journal.ppat.1006613. [DOI] [PMC free article] [PubMed] [Google Scholar]
- 24.Plesa G, Zheng L, Medvec A, Wilson CB, Robles-Oteiza C, Liddy N, et al. TCR affinity and specificity requirements for human regulatory T-cell function. Blood 2012;119(15):3420–30 doi 10.1182/blood-2011-09-377051. [DOI] [PMC free article] [PubMed] [Google Scholar]
- 25.Berry CC, Gillet NA, Melamed A, Gormley N, Bangham CR, Bushman FD. Estimating abundances of retroviral insertion sites from DNA fragment length data. Bioinformatics 2012;28(6):755–62 doi 10.1093/bioinformatics/bts004. [DOI] [PMC free article] [PubMed] [Google Scholar]
- 26.Sherman E, Nobles C, Berry CC, Six E, Wu Y, Dryga A, et al. INSPIIRED: A Pipeline for Quantitative Analysis of Sites of New DNA Integration in Cellular Genomes. Mol Ther Methods Clin Dev 2017;4:39–49 doi 10.1016/j.omtm.2016.11.002. [DOI] [PMC free article] [PubMed] [Google Scholar]
- 27.Berry CC, Nobles C, Six E, Wu Y, Malani N, Sherman E, et al. INSPIIRED: Quantification and Visualization Tools for Analyzing Integration Site Distributions. Mol Ther Methods Clin Dev 2017;4:17–26 doi 10.1016/j.omtm.2016.11.003. [DOI] [PMC free article] [PubMed] [Google Scholar]
- 28.Berry C, Hannenhalli S, Leipzig J, Bushman FD. Selection of target sites for mobile DNA integration in the human genome. PLoS Comput Biol 2006;2(11):e157 doi 10.1371/journal.pcbi.0020157. [DOI] [PMC free article] [PubMed] [Google Scholar]
- 29.Patro R, Duggal G, Love MI, Irizarry RA, Kingsford C. Salmon provides fast and bias-aware quantification of transcript expression. Nat Methods 2017;14(4):417–9 doi 10.1038/nmeth.4197. [DOI] [PMC free article] [PubMed] [Google Scholar]
- 30.Love MI, Huber W, Anders S. Moderated estimation of fold change and dispersion for RNA-seq data with DESeq2. Genome Biol 2014;15(12):550- doi 10.1186/s13059-014-0550-8. [DOI] [PMC free article] [PubMed] [Google Scholar]
- 31.Richardson MW, Guo L, Xin F, Yang X, Riley JL. Stabilized human TRIM5alpha protects human T cells from HIV-1 infection. Mol Ther 2014;22(6):1084–95 doi 10.1038/mt.2014.52. [DOI] [PMC free article] [PubMed] [Google Scholar]
- 32.Zhang Q, Wang HY, Liu X, Bhutani G, Kantekure K, Wasik M. IL-2R common gamma-chain is epigenetically silenced by nucleophosphin-anaplastic lymphoma kinase (NPM-ALK) and acts as a tumor suppressor by targeting NPM-ALK. Proceedings of the National Academy of Sciences of the United States of America 2011;108(29):11977–82 doi 10.1073/pnas.1100319108. [DOI] [PMC free article] [PubMed] [Google Scholar]
- 33.Zhang Q, Wang HY, Marzec M, Raghunath PN, Nagasawa T, Wasik MA. STAT3- and DNA methyltransferase 1-mediated epigenetic silencing of SHP-1 tyrosine phosphatase tumor suppressor gene in malignant T lymphocytes. Proceedings of the National Academy of Sciences of the United States of America 2005;102(19):6948–53 doi 10.1073/pnas.0501959102. [DOI] [PMC free article] [PubMed] [Google Scholar]
- 34.Wang H, Chang-Wong T, Tang HY, Speicher DW. Comparison of extensive protein fractionation and repetitive LC-MS/MS analyses on depth of analysis for complex proteomes. J Proteome Res 2010;9(2):1032–40 doi 10.1021/pr900927y. [DOI] [PMC free article] [PubMed] [Google Scholar]
- 35.Levine BL, Bernstein WB, Connors M, Craighead N, Lindsten T, Thompson CB, et al. Effects of CD28 costimulation on long-term proliferation of CD4+ T cells in the absence of exogenous feeder cells. Journal of immunology (Baltimore, Md : 1950) 1997;159(12):5921–30. [PubMed] [Google Scholar]
- 36.Ceccon M, Merlo MEB, Mologni L, Poggio T, Varesio LM, Menotti M, et al. Excess of NPM-ALK oncogenic signaling promotes cellular apoptosis and drug dependency. Oncogene 2016;35(29):3854–65 doi 10.1038/onc.2015.456. [DOI] [PMC free article] [PubMed] [Google Scholar]
- 37.Martinelli P, Bonetti P, Sironi C, Pruneri G, Fumagalli C, Raviele PR, et al. The lymphoma-associated NPM-ALK oncogene elicits a p16INK4a/pRb-dependent tumor-suppressive pathway. Blood 2011;117(24):6617–26 doi 10.1182/blood-2010-08-301135. [DOI] [PubMed] [Google Scholar]
- 38.Riley JL, Mao M, Kobayashi S, Biery M, Burchard J, Cavet G, et al. Modulation of TCR-induced transcriptional profiles by ligation of CD28, ICOS, and CTLA-4 receptors. Proceedings of the National Academy of Sciences of the United States of America 2002;99(18):11790–5 doi 10.1073/pnas.162359999. [DOI] [PMC free article] [PubMed] [Google Scholar]
- 39.Zhang Q, Wang HY, Wei F, Liu X, Paterson JC, Roy D, et al. Cutaneous T cell lymphoma expresses immunosuppressive CD80 (B7-1) cell surface protein in a STAT5-dependent manner. J Immunol 2014;192(6):2913–9 doi 10.4049/jimmunol.1302951. [DOI] [PMC free article] [PubMed] [Google Scholar]
- 40.Ambrogio C, Martinengo C, Voena C, Tondat F, Riera L, di Celle PF, et al. NPM-ALK Oncogenic Tyrosine Kinase Controls T-Cell Identity by Transcriptional Regulation and Epigenetic Silencing in Lymphoma Cells. Cancer research 2009;69(22):8611–9 doi 10.1158/0008-5472.Can-09-2655. [DOI] [PMC free article] [PubMed] [Google Scholar]
- 41.Bard JD, Gelebart P, Anand M, Amin HM, Lai R. Aberrant expression of IL-22 receptor 1 and autocrine IL-22 stimulation contribute to tumorigenicity in ALK+ anaplastic large cell lymphoma. Leukemia 2008;22(8):1595–603 doi 10.1038/leu.2008.129. [DOI] [PMC free article] [PubMed] [Google Scholar]
- 42.Wasik MA, Zhang Q, Marzec M, Kasprzycka M, Wang HY, Liu X. Anaplastic lymphoma kinase (ALK)-induced malignancies: novel mechanisms of cell transformation and potential therapeutic approaches. Seminars in oncology 2009;36(2 Suppl 1):S27–35 doi 10.1053/j.seminoncol.2009.02.007. [DOI] [PubMed] [Google Scholar]
- 43.Piva R, Agnelli L, Pellegrino E, Todoerti K, Grosso V, Tamagno I, et al. Gene expression profiling uncovers molecular classifiers for the recognition of anaplastic large-cell lymphoma within peripheral T-cell neoplasms. J Clin Oncol 2010;28(9):1583–90 doi 10.1200/JCO.2008.20.9759. [DOI] [PubMed] [Google Scholar]
- 44.Gal-Yam EN, Egger G, Iniguez L, Holster H, Einarsson S, Zhang X, et al. Frequent switching of Polycomb repressive marks and DNA hypermethylation in the PC3 prostate cancer cell line. Proceedings of the National Academy of Sciences of the United States of America 2008;105(35):12979–84 doi 10.1073/pnas.0806437105. [DOI] [PMC free article] [PubMed] [Google Scholar]
- 45.Fujimoto J, Shiota M, Iwahara T, Seki N, Satoh H, Mori S, et al. Characterization of the transforming activity of p80, a hyperphosphorylated protein in a Ki-1 lymphoma cell line with chromosomal translocation t(2;5). Proc Natl Acad Sci U S A 1996;93(9):4181–6 doi 10.1073/pnas.93.9.4181. [DOI] [PMC free article] [PubMed] [Google Scholar]
- 46.Crockett DK, Lin Z, Elenitoba-Johnson KSJ, Lim MS. Identification of NPM-ALK interacting proteins by tandem mass spectrometry. Oncogene 2004;23(15):2617–29 doi 10.1038/sj.onc.1207398. [DOI] [PubMed] [Google Scholar]
- 47.Nobles CL, Sherrill-Mix S, Everett JK, Reddy S, Fraietta JA, Porter DL, et al. CD19-targeting CAR T cell immunotherapy outcomes correlate with genomic modification by vector integration. J Clin Invest 2019. doi 10.1172/JCI130144. [DOI] [PMC free article] [PubMed] [Google Scholar]
- 48.Fraietta JA, Nobles CL, Sammons MA, Lundh S, Carty SA, Reich TJ, et al. Disruption of TET2 promotes the therapeutic efficacy of CD19-targeted T cells. Nature 2018;558(7709):307–12 doi 10.1038/s41586-018-0178-z. [DOI] [PMC free article] [PubMed] [Google Scholar]
- 49.Unutmaz D, KewalRamani VN, Marmon S, Littman DR. Cytokine signals are sufficient for HIV-1 infection of resting human T lymphocytes. J Exp Med 1999;189(11):1735–46. [DOI] [PMC free article] [PubMed] [Google Scholar]
- 50.Balani S, Nguyen LV, Eaves CJ. Modeling the process of human tumorigenesis. Nature Communications 2017;8:15422 doi 10.1038/ncomms15422. [DOI] [PMC free article] [PubMed] [Google Scholar]
- 51.Mesri EA, Feitelson MA, Munger K. Human viral oncogenesis: a cancer hallmarks analysis. Cell Host Microbe 2014;15(3):266–82 doi 10.1016/j.chom.2014.02.011. [DOI] [PMC free article] [PubMed] [Google Scholar]
- 52.Kohnken R, Porcu P, Mishra A. Overview of the Use of Murine Models in Leukemia and Lymphoma Research. Front Oncol 2017;7:22 doi 10.3389/fonc.2017.00022. [DOI] [PMC free article] [PubMed] [Google Scholar]
- 53.Richer MJ, Lang ML, Butler NS. T Cell Fates Zipped Up: How the Bach2 Basic Leucine Zipper Transcriptional Repressor Directs T Cell Differentiation and Function. Journal of immunology (Baltimore, Md : 1950) 2016; 197(4): 1009–15 doi 10.4049/jimmunol.1600847. [DOI] [PMC free article] [PubMed] [Google Scholar]
- 54.Kakugawa K, Kojo S, Tanaka H, Seo W, Endo TA, Kitagawa Y, et at. Essential Roles of SATB1 in Specifying T Lymphocyte Subsets. Cell Rep 2017;19(6):1176–88 doi 10.1016/j.celrep.2017.04.038. [DOI] [PubMed] [Google Scholar]
- 55.Paster W, Bruger AM, Katsch K, Gregoire C, Roncagalli R, Fu G, et al. A THEMIS:SHP1 complex promotes T-cell survival. EMBO J 2015;34(3):393–409 doi 10.15252/embj.201387725. [DOI] [PMC free article] [PubMed] [Google Scholar]
- 56.Fang D, Zhu J. Dynamic balance between master transcription factors determines the fates and functions of CD4 T cell and innate lymphoid cell subsets. J Exp Med 2017;214(7): 1861–76 doi 10.1084/jem.20170494. [DOI] [PMC free article] [PubMed] [Google Scholar]
- 57.Han Y, Amin HM, Frantz C, Franko B, Lee J, Lin Q, et at. Restoration of shp1 expression by 5-AZA-2’-deoxycytidine is associated with downregulation of JAK3/STAT3 signaling in ALK-positive anaplastic large cell lymphoma. Leukemia 2006;20(9): 1602–9 doi 10.1038/sj.leu.2404323. [DOI] [PubMed] [Google Scholar]
- 58.Wiegand KC, Shah SP, Al-Agha OM, Zhao Y, Tse K, Zeng T, et al. ARID1A mutations in endometriosis-associated ovarian carcinomas. New England Journal of Medicine 2010;363(16): 1532–43 doi 10.1056/NEJMoa1008433. [DOI] [PMC free article] [PubMed] [Google Scholar]
- 59.Bitler BG, Wu S, Park PH, Hai Y, Aird KM, Wang Y, et al. ARID1 A-mutated ovarian cancers depend on HDAC6 activity. Nature Cell Biology 2017; 19:962 doi 10.1038/ncb3582 [DOI] [PMC free article] [PubMed] [Google Scholar]
- 60.Zhao B, Lin J, Rong L, Wu S, Deng Z, Fatkhutdinov N, et al. ARID1A promotes genomic stability through protecting telomere cohesion. Nat Commun 2019;10(1):4067 doi 10.1038/S41467-019-12037-4. [DOI] [PMC free article] [PubMed] [Google Scholar]
- 61.Somsuan K, Peerapen P, Boonmark W, Plumworasawat S, Samol R, Sakulsak N, et al. ARID1A knockdown triggers epithelial-mesenchymal transition and carcinogenesis features of renal cells: role in renal cell carcinoma. FASEB journal : official publication of the Federation of American Societies for Experimental Biology 2019;33(11):12226–39 doi 10.1096/fj.201802720RR. [DOI] [PMC free article] [PubMed] [Google Scholar]
- 62.Ambrogio C, Martinengo C, Voena C, Tondat F, Riera L, di Celle PF, et al. NPM-ALK oncogenic tyrosine kinase controls T-cell identity by transcriptional regulation and epigenetic silencing in lymphoma cells. Cancer research 2009;69(22):8611–9 doi 10.1158/0008-5472.CAN-09-2655. [DOI] [PMC free article] [PubMed] [Google Scholar]
- 63.Ambrogio C, Voena C, Manazza AD, Piva R, Riera L, Barberis L, et al. p130Cas mediates the transforming properties of the anaplastic lymphoma kinase. Blood 2005;106(12):3907–16 doi 10.1182/blood-2005-03-1204. [DOI] [PMC free article] [PubMed] [Google Scholar]
Associated Data
This section collects any data citations, data availability statements, or supplementary materials included in this article.