Abstract
Background
The tumor microenvironment (TME) has emerged as a crucial factor in cancer development and progression. Recent findings have indicated that tumor-infiltrating immune cells (TICs) in the TME may predict cancer prognosis and response to treatment. Herein, we sought to identify critical modulators of the kidney renal clear cell carcinoma (KIRC) TME.
Methods
KIRC datasets from The Cancer Genome Atlas (TCGA) were analyzed using the ESTIMATE algorithm to determine the ImmuneScore and StromalScore. By profiling the differentially expressed genes (DEGs) in the ImmuneScore and StromalScore, we finally identified the immune- and stromal-related DEGs of the cases, through which we then performed intersection analysis to determine the immune-related genes (IRGs). Cox regression analysis and least absolute shrinkage and selection operator (LASSO) regression analysis were used to identify critical IRGs and construct a prognostic model. The CIBERSORT algorithm was used to calculate the relative content of 22 immune cell types. Finally, the datasets from the Gene Expression Omnibus (GEO) database were analyzed to validate results from the above analyses. Experimental validation was used on KIRC tissues by quantitative polymerase chain reaction (qPCR) and western blot.
Results
We found that the ImmuneScore was negatively correlated with patients’ prognosis. Intersection analysis of the ImmuneScore and StromalScore identified 118 IRGs that were enriched in immune-related functions. Following IRGs screening by Cox and LASSO regression analyses, six genes were identified and used to construct a KIRC prognostic model. Intersection analysis of these six genes and protein-protein interaction (PPI) were performed and obtained the most critical gene: Potassium Calcium-Activated Channel Subfamily N Member 4 (KCNN4). Further analysis showed that KCNN4 expression was higher in tumor samples relative to normal controls, and was negatively correlated with prognosis. CIBERSORT analysis revealed significant correlation between KCNN4 expression and multiple types of TICs, demonstrating that KCNN4 may affect KIRC prognosis by influencing the TME immune status. Ultimately, the GEO datasets and validation experiments confirmed that KCNN4 was highly expressed in tumor tissues compared to the corresponding normal tissues.
Conclusions
Our study demonstrated that KCNN4 might be a potential prognostic marker in KIRC, offering a novel therapeutic avenue.
Keywords: KCNN4, tumor microenvironment (TME), tumor-infiltrating immune cells (TICs), kidney renal clear cell carcinoma (KIRC)
Introduction
Renal cell carcinoma (RCC) originates from renal epithelium and accounts for 2–3% of all adult malignancies. According to global cancer statistics, there were approximately 403,262 new RCC cases and 175,098 deaths in 2018 (1). Kidney renal clear cell carcinoma (KIRC) is the most common subtype of RCC, accounting for 80–90% of RCCs (2). In recent years, the incidence of KIRC has gradually climbed, while age at diagnosis continues to fall (3). KIRC prognosis is relatively poor and approximately 30% of patients have distant metastases at the time of diagnosis (4,5). Although multiple targeted therapies are used as first-line treatments for advanced and recurrent KIRC, improvements on disease free survival (DFS) and overall survival (OS) have been minimal due to variations in drug efficacy (6). Thus, it is of crucial to better characterize KIRC pathogenesis for improved clinical outcomes.
A growing body of studies has indicated that stromal cells are major components of tumors as they constitute the tumor microenvironment (TME) (7). Non-hematopoietic stromal cells in the TME include endothelial cells, mesenchymal stem cells (MSCs), fibroblasts, and pericytes (8). Moreover, various innate and adaptive immune cells, referred to as tumor-infiltrating immune cells (TICs), are also present in the TME (9). Stromal and tumor cells closely interact and influence each other, with the former secreting extracellular matrix (ECM) and inflammatory factors that affect tumor cell proliferation and metastasis (10), as well as the response and access to therapy (11,12). The mutual influence between tumor and stromal elements begins in the early stage of TME formation and changes dynamically over time (8). Intriguingly, TICs in the TME have been suggested as predictors of cancer prognosis and response to therapy. For instance, in colorectal cancer, increased M1 macrophage levels indicated poor prognosis (13), while low lymphocyte number may reflect poor prognosis in non-small cell lung cancer (14). Likewise, in high-grade serous ovarian cancer, neutrophils were associated with poor prognosis of patients (15), signifying that TME immune cell components were closely correlated with malignancy and may influence the response to treatment and clinical outcomes. Currently, high throughput sequencing has made it feasible to carry out genome-wide examination of biological processes and disease mechanisms, and this technique has been used to study the TMEs of various tumors (16,17).
In this article, we downloaded the data of 539 KIRC patients from The Cancer Genome Atlas (TCGA) database. The ESTIMATE and CIBERSORT algorithms were performed to calculate the ImmuneScore and StromalScore, as well as the relative proportions of various TICs in the respective cases, combined with the least absolute shrinkage and selection operator (LASSO) algorithm to screen immune-related genes (IRGs). Finally, the most critical gene, Potassium Calcium-Activated Channel Subfamily N Member 4 (KCNN4), was identified, which can predict the prognosis of KIRC patients and the immune status in the TME. The protein encoded by KCNN4 is part of a potentially heterotetrameric voltage-independent potassium channel that is activated by intracellular calcium and may be part of the predominant calcium-activated potassium channel in T-lymphocytes. KCNN4 was highly expressed in various cancers, including thyroid cancer (18), colorectal cancer (19), and hepatocellular carcinoma (20). Moreover, KCNN4 was strongly implicated in tumor invasion, metastasis, and epithelial-mesenchymal transition (EMT) (20,21). In this study, we found that KCNN4 may affect stromal and immune components of the TME in KIRC. These findings were validated using independent datasets from the Gene Expression Omnibus (GEO) database, and experimentally using quantitative polymerase chain reaction (qPCR) and western blot analyses of four KIRC patient samples collected at the First Affiliated Hospital of Guangxi Medical University. We present the following article in accordance with the REMARK reporting checklist (available at http://dx.doi.org/10.21037/tau-21-332).
Methods
Data extraction
Transcriptomic data on the KIRC cohort (539 tumor samples; 72 normal samples) and associated clinical data were obtained from TCGA (https://portal.gdc.cancer.gov/).
Analysis of ImmuneScore, StromalScore, and ESTIMATEScore
The ESTIMATE algorithm was used to calculate the proportion of immune and stromal cells in the TME using R (https://www.r-project.org/). Kaplan-Meier survival analysis was used to assess prognosis. Log-rank P<0.05 was considered significant.
Screening for IRGs
Tumor samples were classified into high- and low-score group based on the median ImmuneScore and StromalScore. Differentially expressed genes (DEGs) were identified with limma package using a cut-off threshold of |log 2 FC| >1 and a false discovery rate (FDR) <0.05. Following intersection analyses to identify IRGs, univariate Cox regression analysis was used to identify genes that affect the OS of patients. LASSO and multivariate Cox regression analyses were used to ascertain the critical IRGs.
Enrichment function analysis
Enrichment functional analyses of the IRGs were performed on R using the packages clusterProfiler, enrichplot, and ggplot2. P<0.05 and q<0.05 were considered statistically significant.
Construction of heatmaps for DEGs and IRGs
The package pheatmap was used for heatmap visualization of DEGs and IRGs.
Correlation between clinical features and scores
After excluding cases with incomplete clinical data, 530 KIRC cases remained, and the correlation between clinical features and three kinds of scores were analyzed on R. Wilcoxon rank sum or Kruskal-Wallis rank sum tests were used for significance tests.
Construction of protein-protein interaction (PPI) networks
PPI networks were constructed using the Search Tool for the Retrieval of Interacting Genes (STRING, https://string-db.org/) online database and reconstructed using Cytoscape version 3.8.1. Nodes with interaction confidence >0.4 were selected in building the network.
TIC abundance profile
TIC abundance in KIRC samples was determined using the CIBERSORT algorithm. 403 cancer samples (P<0.05) were applied to the following analysis.
Verification of results via the GEO database
The GSE66270, GSE57357, and GSE29609 datasets were downloaded from the GEO database and used as validation KIRC datasets. The Wilcoxon rank sum test was used to compare gene expression differences between tumors and corresponding normal tissues in the GSE66270 and GSE57357 datasets. Kaplan-Meier analysis was used to assess KIRC prognosis in the GSE29609 dataset.
Specimen collection
KIRC specimens and corresponding adjacent non-cancer specimens from four patients were acquired from the First Affiliated Hospital of Guangxi Medical University, and the tumor pathologic types were verified by immunohistochemistry. The patients had not received preoperative anti-cancer therapy. Written informed consent was obtained from the patients. All procedures performed in this study involving human participants were in accordance with the Declaration of Helsinki (as revised in 2013). The study was approved by the Ethics Committee of the First Affiliated Hospital of Guangxi Medical University.
qPCR analysis
Total RNA was isolated from tissues using Trizol reagent (Thermo Fisher Scientific, MA, USA). Reverse transcription was carried out on 2 µg RNA using a cDNA synthesis kit (Thermo Fisher Scientific, MA, USA). qPCR was performed using SYBR Green Master (Roche, Switzerland) on a Mx-3000P quantitative PCR system (Stratagene, USA). KCNN4 primer sequences were 5'-ctgggtgctgtccgtgg-3' (forward) and 5'-agccgatggtcaggaatgtg-3' (reverse). β-actin was used as a housekeeping reference gene. Relative mRNA levels were assessed using the 2-ΔΔCt method.
Western blotting
Total protein was extracted from tissues using the RIPA lysis buffer (Solarbio, China) supplemented with PMSF (Solarbio, China). Equal amounts of denatured protein were separated by 10% SDS-PAGE and transferred onto PVDF membranes (Millipore, MA, USA). Membranes were then incubated overnight with the following primary antibodies: anti-β-actin [1:1,000, Cell Signaling Technology (CST), MA, USA]; and KCNN4 (1:1,000, Affinity Biosciences, OH, USA). They were then incubated with the secondary antibody (CST, MA, USA) at room temperature. The signal was developed by enhanced chemiluminescence (Millipore, MA, USA) and analyzed on ImageJ.
Statistical analysis
Statistical analysis was performed using SPSS 26.0 (IBM Corporation, USA) and GraphPad Prism 8 (GraphPad Software, USA). Student’s t-test was used to analyze the expression levels of KCNN4 in the patient samples of tumor tissue and control tissue. A P value <0.05 was considered to be statistically significant.
Results
Correlation between three kinds of scores and prognosis of KIRC
To assess the relationship between immune and stromal cell proportions and the patients’ prognosis, the ESTIMATE algorithm, combined with Kaplan-Meier analysis, were used to calculate the ImmuneScore, StromalScore, and ESTIMATEScore of the KIRC cases. Here, a higher ImmuneScore manifests a higher proportion of immune cells in the TME, while higher StromalScore reflects a higher proportion of stromal cells. The ESTIMATEScore is the sum of ImmuneScore and StromalScore. This analysis showed that the ImmuneScore was negatively correlated with KIRC OS (Figure 1A, P=0.033). However, the correlation between the StromalScore and ESTIMATEScore and prognosis did not differ significantly (Figure 1B,C).
Figure 1.
Association between scores and survival time of KIRC patients. (A) Kaplan-Meier survival analysis for high- and low-score KIRC patients, grouped based on the median ImmuneScore. (B) Kaplan-Meier survival analysis of the StromalScore. (C) Kaplan-Meier survival analysis of the ESTIMATEScore. KIRC, kidney renal clear cell carcinoma.
Correlation of the scores with clinical features in the KIRC patients
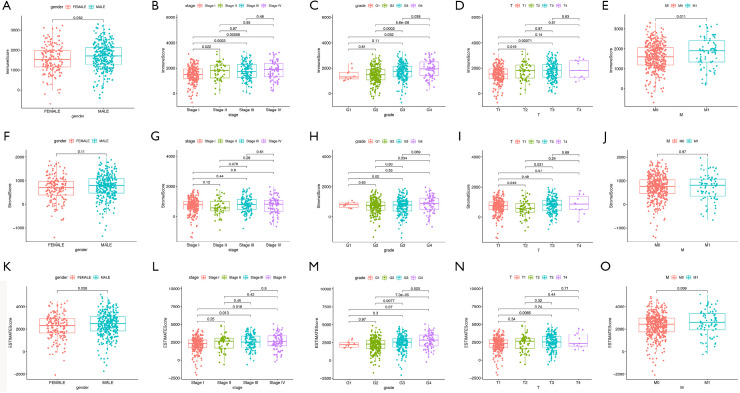
Next, we analyzed correlation between the proportion of immune and stromal cells and patients’ clinical features like gender, tumor stage, and grade. This analysis revealed that females had a lower ImmuneScore relative to males (Figure 2A, P=0.032), and the ImmuneScore was positively correlated with tumor grade and stage (Figure 2B,C). Further analysis demonstrated that ImmuneScore increased significantly from T1 to T2 and T1 to T3 in T classification of tumor stage (Figure 2D). M classification also showed a positive correlation (Figure 2E, P=0.011). Nonetheless, no statistically significant correlation between the StromalScore and most of the clinical features (Figure 2F,G,H,I,J). The ESTIMATEScore showed a gender bias similar to that of the Immune score (Figure 2K, P=0.038). Meanwhile, the ESTIMATEScore was positively correlated with tumor grade and tumor stage (Figure 2L,M), and ESTIMATScore increased significantly from T1 to T3 in T classification of tumor stage (Figure 2N, P=0.0065). No statistically significant correlation between the ESTIMATScore and M classification (Figure 2O). Taken together, these data suggested that the proportions of immune and stromal cells in the TME of KIRC were correlated with tumor progression and metastasis.
Figure 2.
Association between scores and clinical features of KIRC patients. (A,B,C,D,E) Association between gender, clinical stage, tumor grade, T classification, and M classification of KIRC patients and the ImmuneScore. (F,G,H,I,J) Association between different clinical features of KIRC patients and the StromalScore. (K,L,M,N,O) Association between different clinical features of KIRC patients and the ESTIMATEScore. KIRC, kidney renal clear cell carcinoma.
IRGs shared by the ImmuneScore and StromalScore and their enrichment analysis
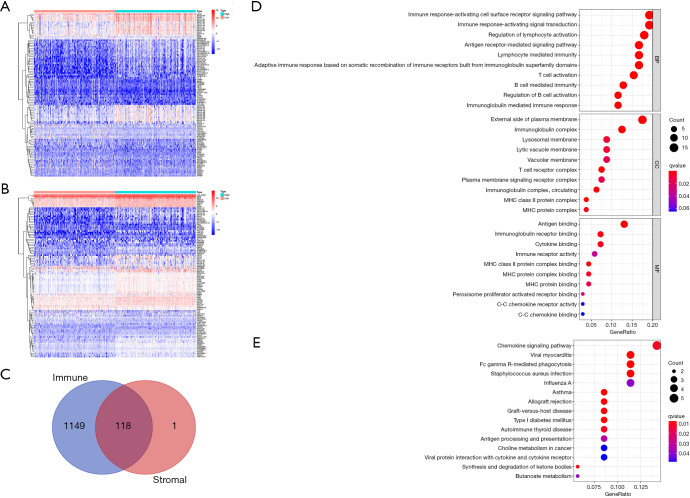
To outline gene expression differences between immune and stromal cells of the TME, the ImmuneScore and StromalScore were divided into high- and low-score groups based on the median. Values higher than the median were classified into the high-score group and vice versa, and the DEGs were visualized in heatmaps (Figure 3A,B). This analysis identified 1,267 DEGs from the ImmuneScore and 119 DEGs from the StromalScore, which included up-regulated and down-regulated genes. We then intersected the ImmuneScore and StromalScore DEGs and obtained 118 overlapping IRGs that may affect both the stromal and immune components of the TME (Figure 3C). Subsequently, gene ontology (GO) enrichment analysis of the biological roles of the IRGs revealed that they were enriched in immune-related activities such as immune response and antigen binding (Figure 3D), and the Kyoto Encyclopedia of Genes and Genomes (KEGG) pathway enrichment analysis found the IRGs to be enriched in the chemokine signaling pathway and Fc gamma R-mediated phagocytosis (Figure 3E). Taken together, the results above clarified that IRGs were mainly enriched in immune-related functions, and also exert influence on stromal components, highlighting their significance in the TME.
Figure 3.
DEGs shared by the ImmuneScore and StromalScore and functional enrichment analysis. (A) The heat map of DEGs generated based on the ImmuneScore. (B) The heat map of DEGs generated based on the StromalScore. (C) Venn plot of all 118 IRGs shared by the ImmuneScore and StromalScore. (D,E) GO and KEGG analyses for the 118 IRGs. DEG, differentially expressed gene; IRG, immune-related gene; GO, gene ontology; KEGG, Kyoto Encyclopedia of Genes and Genomes.
IRGs screening and prediction model construction
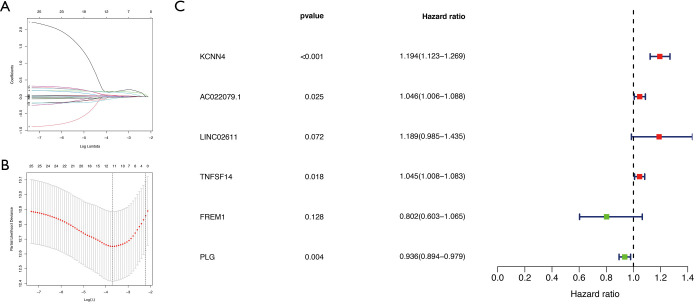
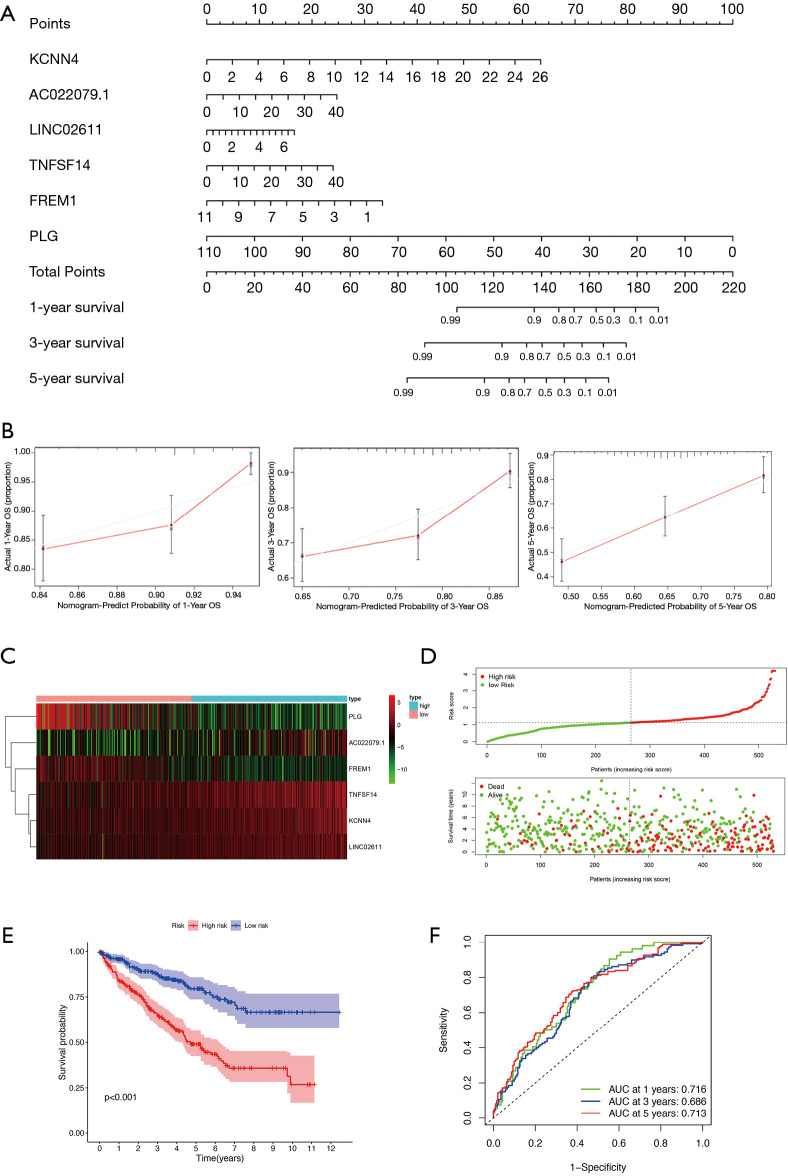
Next, we conducted a downstream analysis of the 118 overlapping IRGs. Univariate Cox regression analysis was used to screen IRGs that affected KIRC prognosis and identified 26 statistically significant IRGs (Figure 4). Further analysis of these 26 IRGs using LASSO regression analysis uncovered 11 key IRGs (Figure 5A,B). To further screen the IRGs, multivariate Cox regression analysis of these 11 IRGs was carried out, thereby obtaining KCNN4, AC022079.1, LINC02611, TNFSF14, FREM1, and PLG (Figure 5C). Finally, we constructed a KIRC prognostic model based on these six IRGs, as well as a nomogram for determining the 1-, 3-, and 5-year KIRC survival rate (Figure 6A,B).
Figure 4.
Univariate Cox regression analysis of 118 IRGs. The analysis was based on the 26 key genes with a threshold P value <0.05. IRG, immune-related gene.
Figure 5.
Screening of key IRGs using LASSO regression and multivariate Cox regression. (A) LASSO coefficient profiles of the IRGs associated with the overall survival of KIRC. (B) 10-time cross-validation for tuning parameter selection in the LASSO model for overall survival. (C) Forest plots of six genes in prediction model obtained by multivariate Cox regression analysis. IRG, immune-related gene; LASSO, least absolute shrinkage and selection operator; KIRC, kidney renal clear cell carcinoma.
Figure 6.
Prediction model construction. (A) A nomogram for predicting the 1-, 3- and 5-year OS rate of KIRC patients based on six key genes. (B) Calibration curves for predicting patient survival rates at 1-, 3- and 5-years. (C) Heat map of the six genes in the prediction model. (D) The distribution of patients’ risk scores. (E) Kaplan-Meier analysis of KIRC patients with high and low risk scores. (F) Time-dependent ROC curves at 1-, 3- and 5-years. OS, overall survival; KIRC, kidney renal clear cell carcinoma; ROC, receiver operating characteristic.
According to median risk score (RS), all cases were divided into high- and low-RS groups, the expression level of each gene of cases was visualized by heat map (Figure 6C), survival status of cases were shown in Figure 6D. Kaplan-Meier analysis demonstrated that the prognosis of the high-RS group was significantly poorer than that of the low-RS group (Figure 6E). The time-dependent receiver operating characteristic (ROC) curves analysis confirmed that the model had strong clinical predictive ability (Figure 6F), with 1-, 3-, and 5-year area under the curves (AUCs) of 0.716, 0.686, and 0.713, respectively.
Intersection analysis of the PPI network with IRGs in the prediction model
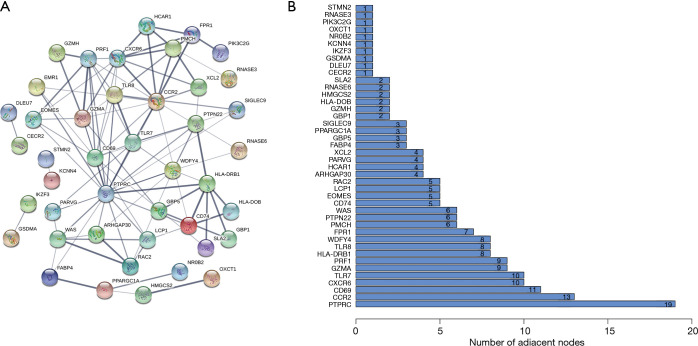
To identify key genes affecting the TME status, we used the STRING database to construct a PPI network of the 118 overlapping IRGs, and displayed gene names and node numbers on bar plots of the top 42 genes (Figure 7A,B). Intersecting the 42 genes with the six IRGs in the prediction model, we determined only one gene from the above analysis, KCNN4, reflecting it as a potentially key factor affecting the TME (Figure 8).
Figure 7.
Construction of PPI networks. (A) Construction of interaction network with nodes of interaction confidence >0.4. (B) Top 42 genes sorted by the number of connected nodes. PPI, protein-protein interaction.
Figure 8.
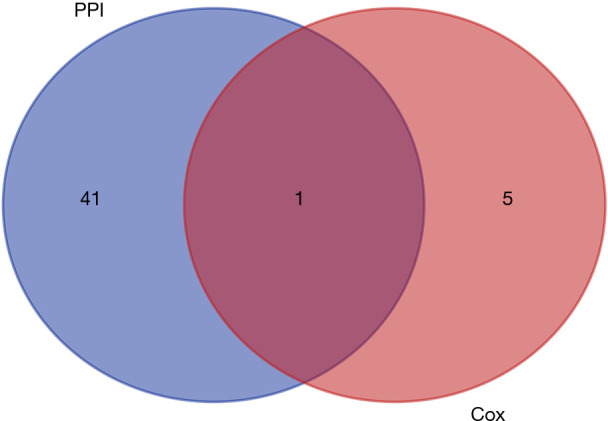
Venn plot showing the intersection of the top 42 genes sorted by number of connected nodes and the six genes in the prediction model. PPI, protein-protein interaction.
Comprehensive analysis of KCNN4 expression and its prognostic value in the KIRC
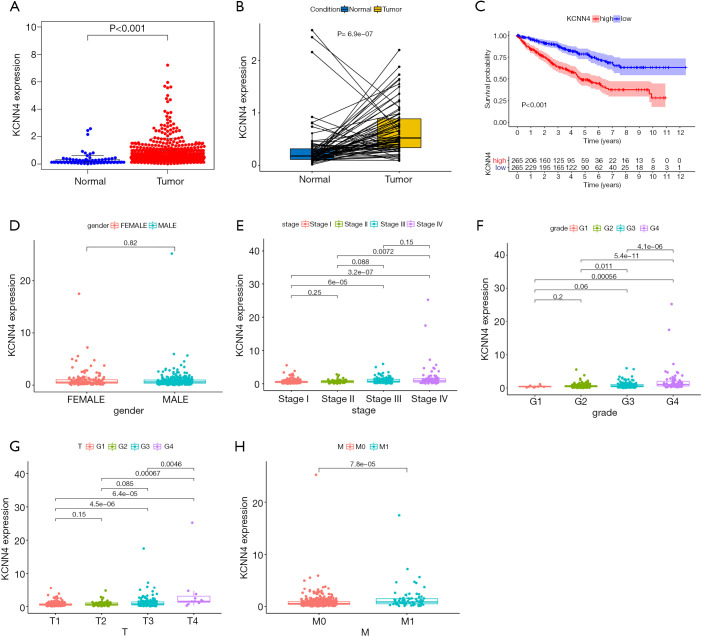
Further KCNN4 characterization showed that the expression of KCNN4 was remarkably higher in tumor tissues relative to normal controls (Figure 9A). Similar results were obtained from pairwise comparative analysis (Figure 9B). To validate the correlation between KCNN4 and KIRC prognosis, we divided all of the tumor samples into high- and low-KCNN4 groups based on the median KCNN4 expression. Survival analysis revealed that KIRC patients with high KCNN4 levels had a worse prognosis than those with low KCNN4 expression (Figure 9C). Further analysis of the relationship between KCNN4 levels and clinical features showed that both tumor stage and grade were positively correlated with KCNN4 expression (Figure 9D,E,F). Similar results were obtained based on T and M classifications of tumor stage separately (Figure 9G,H). These results demonstrated that KCNN4 may be a reliable indicator of KIRC prognosis.
Figure 9.
Differential expression of KCNN4 in different tissues and its relationship with the prognosis and clinical features of KIRC patients. (A) Differential expression of KCNN4 between normal and tumor tissues. (B) Paired comparative analysis of KCNN4 expression in normal and tumor samples obtained from the same patient. (C) Survival analysis for KIRC patients with high and low expression of KCNN4. (D-H) The relationship between KCNN4 expression and gender, tumor stage, tumor grade, T classification, and M classification of KIRC patients. KIRC, kidney renal clear cell carcinoma.
Relationship between TIC distribution and KIRC prognosis
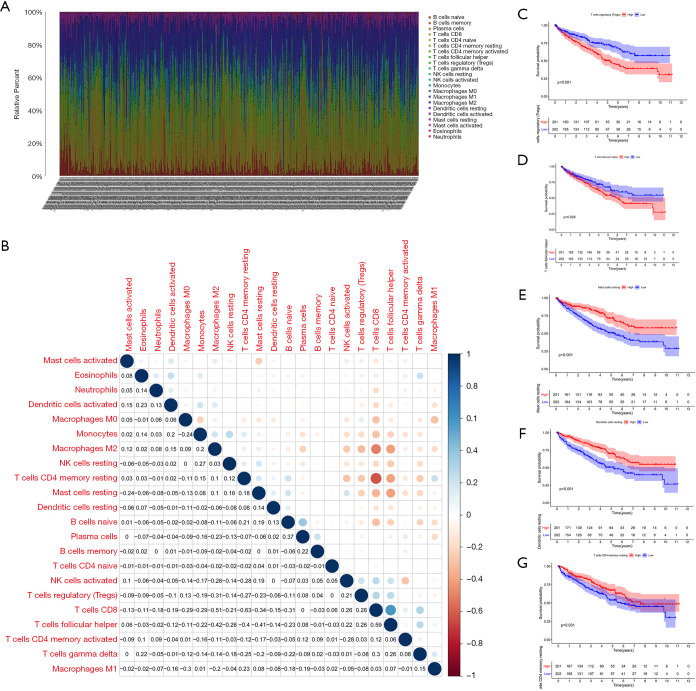
To expound the TIC distribution pattern in the TME, we used the CIBERSORT algorithm to evaluate the relative levels of 22 immune cell subtypes in the TME from KIRC samples. The relative proportions of each TIC subtype within tumor samples and the correlations between them were shown in Figure 10A,B. To identify key TICs that may affect prognosis, we divided KIRC patients into high and low groups based on the median level of each TIC subtype, and found that relative abundance of regulatory T cells and follicular helper T cells were negatively correlated with patient survival, suggesting that they promote progression and metastasis of KIRC (Figure 10C,D). In contrast, the relative abundance of resting mast cells, resting dendritic cells and resting memory CD4 T cells showed a positive correlation with patient survival, indicating that they sustained anti-tumor immunity (Figure 10E,F,G).
Figure 10.
Profiling of TICs in the TME. (A) Histogram showing the relative proportions of 22 TICs in tumor tissue. (B) Heat map showing the correlation between the 22 types of TICs. The number and color of the boxes indicates the correlation coefficient between two different immune cells. (C,D,E,F,G) Five key immune cells that influenced patients’ survival. TIC, tumor-infiltrating immune cell; TME, tumor microenvironment.
KCNN4 was a critical factor influencing the immune status of the TME
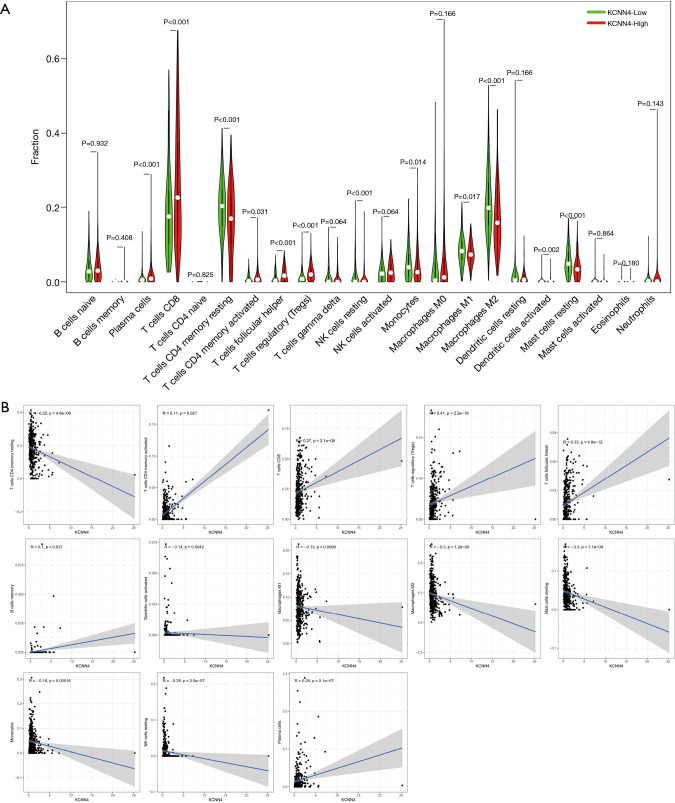
Next, we analyzed correlation between KCNN4 expression and various TIC subtypes, the differences in the proportion of 22 types of TICs in tumor tissues for the high- and low-KCNN4 expression groups were shown in violin plots (Figure 11A). Following analysis found that resting memory CD4 T cells, activated dendritic cells, M1 and M2 macrophages, resting mast cells, monocytes, and resting NK cells were negatively correlated with KCNN4 expression. In contrast, activated memory CD4 T cells, CD8 T cells, regulatory T cells, follicular helper T cells, memory B cells, and plasma cells were positively correlated with KCNN4 expression, suggesting that KCNN4 affecting KIRC prognosis by influencing the immune status of the TME (Figure 11B).
Figure 11.
Correlation between the relative proportion of TICs and KCNN4 expression. (A) Violin plot showing the difference in the proportion of 22 immune cells in KIRC tumor tissues for the high and low KCNN4 expression groups. (B) Scatter plot showing the correlation between the proportions of 13 TICs and the expression of KCNN4. TIC, tumor-infiltrating immune cell; KIRC, kidney renal clear cell carcinoma.
GEO datasets confirmed KCNN4 expression in tumors and its impact on patient prognosis
To validate the reliability and authenticity of the results in TCGA, we analyzed the GSE57357 and GSE66270 datasets. These GEO datasets are comprised of sequencing data from 72 tumor tissues and 14 corresponding normal samples. This analysis revealed that KCNN4 expression was higher in tumor samples relative to controls (Figure 12A,B). Analysis of the GSE29609 dataset to determine the relationship between KCNN4 and patients’ survival revealed that high KCNN4 levels were correlated with poorer survival (Figure 12C). However, this relationship was not statistically significant (P=0.088), and may be due to the small sample size in this dataset (n=39).
Figure 12.
Verification of results via GEO database. (A) KCNN4 was up-regulated in tumor tissues based on analysis of the GSE53757 dataset. (B) KCNN4 was differentially expressed between tumors and corresponding normal tissues in the GSE66270 dataset. (C) KCNN4 expression was associated with the survival of KIRC patients in the GSE29609 dataset. GEO, Gene Expression Omnibus.
Validation experiments verified the difference in KCNN4 expression
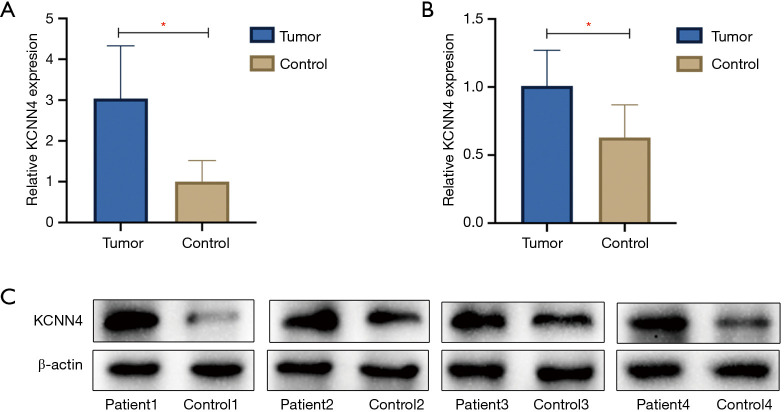
We examined KCNN4 expression in four KIRC samples and normal adjacent non-tumor controls by qPCR and western blot analyses, and found KCNN4 levels to be significantly higher in tumor tissues than in control tissues (P<0.05, Figure 13A,B,C). The clinical features of the patients were shown in Table 1.
Figure 13.
Expression of KCNN4 increased in KIRC samples. (A) Expression of KCNN4 in KIRC samples and normal adjacent non-tumor controls were assessed by qPCR (*P<0.05). (B,C) Representative blots and quantification results of western blot showed that expression of the KCNN4 protein in KIRC was significantly higher than controls (*P<0.05). KIRC, kidney renal clear cell carcinoma.
Table 1. The clinical features of the four KIRC patients.
| Patients | Gender | Age | Tumor size/cm | Location of tumor | T stage | N stage | M stage | Pathological type |
|---|---|---|---|---|---|---|---|---|
| Patient 1 | Male | 64 | 4.7×4.3×4.5 | Left | T1b | N0 | M0 | KIRC |
| Patient 2 | Female | 59 | 7.9×6.2×7.0 | Left | T2a | N0 | M0 | KIRC |
| Patient 3 | Male | 34 | 4.8×4.0×3.5 | Left | T1b | N0 | M0 | KIRC |
| Patient 4 | Female | 69 | 4.7×3.5×4.3 | Left | T1b | N0 | M0 | KIRC |
KIRC, kidney renal clear cell carcinoma.
Discussion
In recent years, the role of the TME in tumorigenesis and cancer progression has become increasingly clear (22). The TME is infiltrated by a variety of TICs, which may have pro- or anti-tumor effects. Thus, identification of the factors affecting the immune status of the TME may uncover novel anti-tumor avenues. In this study, we analyzed KIRC patient datasets from TCGA using ESTIMATE and found that the proportion of immune components in the TME was correlated with the prognosis of KIRC. These findings have potential therapeutic implications.
Recent studies have confirmed that the anti-tumor properties of immune cells are compromised within the TME of KIRC, as tumor-secreted factors could influence dendritic cell differentiation and induce anergy-related genes in T cells, thereby inhibiting the anti-tumor reactivity in the tumor milieu (23). PD-1, an immunosuppressive receptor belonging to the CD28/CTLA-4 family and can exert inhibitory activity during the effective stage of T cell activation in the TME by regulating inhibitory signals (24,25). Hence, monoclonal antibodies against PD-1 or its ligands are being used to activate T cells. Better understanding of tumor immune escape mechanisms and the TME may expand immunotherapy strategies. KIRC immunotherapy has developed considerably, and many immune checkpoint inhibitors (ICIs) have entered clinical trials and shown encouraging results (26). Notwithstanding, there is still a proportion of patients who respond poorly to treatment. Additionally, side effects and adverse events have been identified in clinical trials, which may limit the use of such treatments (27). Through analyzing KIRC transcriptomic data from TCGA, we found that KCNN4 was positively correlated with clinical stage and tumor grade, illustrating its association with poor patient prognosis. Our data highlighted KCNN4 as a potential prognostic marker and therapeutic target in KIRC.
KCNN4 is a member of the calcium-dependent potassium channel family, which are crucial regulators of membrane potential, hormone secretion, epithelial function, cell proliferation, and apoptosis (28,29). Recent studies discovered that KCNN4 promoted the proliferation and invasion of lung cancer (30), endometrial cancer (31), and glioblastoma (32). Notably, high KCNN4 expression was correlated with poor prognosis in these cancers. Our data demonstrated that KCNN4 expression in KIRC was significantly higher than in normal tissues, and its expression level was positively correlated with clinical stage and tumor grade. These findings shed the light on the fact that KCNN4 may be associated with tumor occurrence, development, and metastasis, which is consistent with findings of Rabjerg et al. (33). To study the relationship between KCNN4 expression and the TME, we analyzed the correlation between KCNN4 and various TIC subtypes. The results showed that the expression of KCNN4 was correlated with a variety of immune cells, indicating that KCNN4 may affect the immune status of the TME and KIRC prognosis. Further evidence was derived from various studies, which suggested that KCNN4 altered the antigen presentation and functions of various immune cells (34,35). Chimote et al. reported that KCNN4 upregulation improved cancer immune monitoring and response to immunotherapy (35), which may be one of the mechanisms through which KCNN4 affects immune activity in the TME.
We subsequently validated our results using GEO datasets and clinical samples, confirming that KCNN4 mRNA and protein levels were higher in tumors than in normal tissues. Nevertheless, this study has limitations that should be noted. Firstly, we did not experimentally test whether high KCNN4 levels promote tumor cell invasion and metastasis. Secondly, we did not elucidate the mechanism by which KCNN4 affects the immune status of the TME.
Conclusions
In this study, using bioinformatics to evaluate TCGA datasets, we concluded that KCNN4 may influence KIRC prognosis by affecting the immune status of the TME. Our study highlighted KCNN4 as a potential prognostic factor and therapeutic target in KIRC.
Supplementary
The article’s supplementary files as
Acknowledgments
Funding: This study was funded by the National Natural Science Foundation of China (grant number 81770759), the Major Project of Guangxi Innovation Driven (grant number AA18118016), the National Key Research and Development Program of China (grant number 2017YFC0908000) and the Guangxi key Laboratory for Genomic and Personalized Medicine (grant number 16-380-54, 17-259-45, 19-050-22, 19-185-33, 20-065-33). In addition, we thank Dr. Yongchu Sun from The Guangxi Medical University Cancer Hospital for assistance validation experiments.
Ethical Statement: The authors are accountable for all aspects of the work in ensuring that questions related to the accuracy or integrity of any part of the work are appropriately investigated and resolved. All procedures performed in this study involving human participants were in accordance with the Declaration of Helsinki (as revised in 2013). The study was approved by the Ethics Committee of the First Affiliated Hospital of Guangxi Medical University. Written informed consent was obtained from the patients.
Reporting Checklist: The authors have completed the REMARK reporting checklist. Available at http://dx.doi.org/10.21037/tau-21-332
Data Sharing Statement: Available at http://dx.doi.org/10.21037/tau-21-332
Conflicts of Interest: All authors have completed the ICMJE uniform disclosure form (available at http://dx.doi.org/10.21037/tau-21-332). All authors report that this study was funded by the National Natural Science Foundation of China (grant number 81770759), the Major Project of Guangxi Innovation Driven (grant number AA18118016), the National Key Research and Development Program of China (grant number 2017YFC0908000) and the Guangxi key Laboratory for Genomic and Personalized Medicine (grant number 16-380-54, 17-259-45, 19-050-22, 19-185-33, 20-065-33). The authors have no other conflicts of interest to declare.
(English Language Editor: A. Kassem)
References
- 1.Bray F, Ferlay J, Soerjomataram I, et al. Global cancer statistics 2018: GLOBOCAN estimates of incidence and mortality worldwide for 36 cancers in 185 countries. CA Cancer J Clin 2018;68:394-424. 10.3322/caac.21492 [DOI] [PubMed] [Google Scholar]
- 2.Ljungberg B, Bensalah K, Canfield S, et al. EAU guidelines on renal cell carcinoma: 2014 update. Eur Urol 2015;67:913-24. 10.1016/j.eururo.2015.01.005 [DOI] [PubMed] [Google Scholar]
- 3.Uhlen M, Zhang C, Lee S, et al. A pathology atlas of the human cancer transcriptome. Science 2017;357:eaan2507. 10.1126/science.aan2507 [DOI] [PubMed] [Google Scholar]
- 4.Lipworth L, Tarone RE, McLaughlin JK. Renal cell cancer among African Americans: an epidemiologic review. BMC Cancer 2011;11:133. 10.1186/1471-2407-11-133 [DOI] [PMC free article] [PubMed] [Google Scholar]
- 5.Zhang GM, Zhu Y, Gu WJ, et al. Pretreatment neutrophil-to-lymphocyte ratio predicts prognosis in patients with metastatic renal cell carcinoma receiving targeted therapy. Int J Clin Oncol 2016;21:373-8. 10.1007/s10147-015-0894-4 [DOI] [PubMed] [Google Scholar]
- 6.Vera-Badillo FE, Templeton AJ, Duran I, et al. Systemic therapy for non-clear cell renal cell carcinomas: a systematic review and meta-analysis. Eur Urol 2015;67:740-9. 10.1016/j.eururo.2014.05.010 [DOI] [PubMed] [Google Scholar]
- 7.Joyce JA, Pollard JW. Microenvironmental regulation of metastasis. Nat Rev Cancer 2009;9:239-52. 10.1038/nrc2618 [DOI] [PMC free article] [PubMed] [Google Scholar]
- 8.Turley SJ, Cremasco V, Astarita JL. Immunological hallmarks of stromal cells in the tumour microenvironment. Nat Rev Immunol 2015;15:669-82. 10.1038/nri3902 [DOI] [PubMed] [Google Scholar]
- 9.Zhang Y, Zhang Z. The history and advances in cancer immunotherapy: understanding the characteristics of tumor-infiltrating immune cells and their therapeutic implications. Cell Mol Immunol 2020;17:807-21. 10.1038/s41423-020-0488-6 [DOI] [PMC free article] [PubMed] [Google Scholar]
- 10.Levental KR, Yu H, Kass L, et al. Matrix crosslinking forces tumor progression by enhancing integrin signaling. Cell 2009;139:891-906. 10.1016/j.cell.2009.10.027 [DOI] [PMC free article] [PubMed] [Google Scholar]
- 11.Polyak K, Haviv I, Campbell IG. Co-evolution of tumor cells and their microenvironment. Trends Genet 2009;25:30-8. 10.1016/j.tig.2008.10.012 [DOI] [PubMed] [Google Scholar]
- 12.Nakasone ES, Askautrud HA, Kees T, et al. Imaging tumor-stroma interactions during chemotherapy reveals contributions of the microenvironment to resistance. Cancer Cell 2012;21:488-503. 10.1016/j.ccr.2012.02.017 [DOI] [PMC free article] [PubMed] [Google Scholar]
- 13.Ge P, Wang W, Li L, et al. Profiles of immune cell infiltration and immune-related genes in the tumor microenvironment of colorectal cancer. Biomed Pharmacother 2019;118:109228. 10.1016/j.biopha.2019.109228 [DOI] [PubMed] [Google Scholar]
- 14.Bi KW, Wei XG, Qin XX, et al. BTK Has Potential to Be a Prognostic Factor for Lung Adenocarcinoma and an Indicator for Tumor Microenvironment Remodeling: A Study Based on TCGA Data Mining. Front Oncol 2020;10:424. 10.3389/fonc.2020.00424 [DOI] [PMC free article] [PubMed] [Google Scholar]
- 15.Liu R, Hu R, Zeng Y, et al. Tumour immune cell infiltration and survival after platinum-based chemotherapy in high-grade serous ovarian cancer subtypes: A gene expression-based computational study. EBioMedicine 2020;51:102602. 10.1016/j.ebiom.2019.102602 [DOI] [PMC free article] [PubMed] [Google Scholar]
- 16.Lambrechts D, Wauters E, Boeckx B, et al. Phenotype molding of stromal cells in the lung tumor microenvironment. Nat Med 2018;24:1277-89. 10.1038/s41591-018-0096-5 [DOI] [PubMed] [Google Scholar]
- 17.Wingrove E, Liu ZZ, Patel KD, et al. Transcriptomic Hallmarks of Tumor Plasticity and Stromal Interactions in Brain Metastasis. Cell Rep 2019;27:1277-92.e7. 10.1016/j.celrep.2019.03.085 [DOI] [PMC free article] [PubMed] [Google Scholar]
- 18.Wen J, Lin B, Lin L, et al. KCNN4 is a diagnostic and prognostic biomarker that promotes papillary thyroid cancer progression. Aging (Albany NY) 2020;12:16437-56. 10.18632/aging.103710 [DOI] [PMC free article] [PubMed] [Google Scholar]
- 19.Ibrahim S, Dakik H, Vandier C, et al. Expression Profiling of Calcium Channels and Calcium-Activated Potassium Channels in Colorectal Cancer. Cancers (Basel) 2019;11:561. 10.3390/cancers11040561 [DOI] [PMC free article] [PubMed] [Google Scholar]
- 20.Li QT, Feng YM, Ke ZH, et al. KCNN4 promotes invasion and metastasis through the MAPK/ERK pathway in hepatocellular carcinoma. J Investig Med 2020;68:68-74. 10.1136/jim-2019-001073 [DOI] [PubMed] [Google Scholar]
- 21.Du Y, Song W, Chen J, et al. The potassium channel KCa3.1 promotes cell proliferation by activating SKP2 and metastasis through the EMT pathway in hepatocellular carcinoma. Int J Cancer 2019;145:503-16. 10.1002/ijc.32121 [DOI] [PubMed] [Google Scholar]
- 22.Bader JE, Voss K, Rathmell JC. Targeting Metabolism to Improve the Tumor Microenvironment for Cancer Immunotherapy. Mol Cell 2020;78:1019-33. 10.1016/j.molcel.2020.05.034 [DOI] [PMC free article] [PubMed] [Google Scholar]
- 23.Noessner E, Brech D, Mendler AN, et al. Intratumoral alterations of dendritic-cell differentiation and CD8(+) T-cell anergy are immune escape mechanisms of clear cell renal cell carcinoma. Oncoimmunology 2012;1:1451-3. 10.4161/onci.21356 [DOI] [PMC free article] [PubMed] [Google Scholar]
- 24.Nirschl CJ, Drake CG. Molecular pathways: coexpression of immune checkpoint molecules: signaling pathways and implications for cancer immunotherapy. Clin Cancer Res 2013;19:4917-24. 10.1158/1078-0432.CCR-12-1972 [DOI] [PMC free article] [PubMed] [Google Scholar]
- 25.Pardoll DM. The blockade of immune checkpoints in cancer immunotherapy. Nat Rev Cancer 2012;12:252-64. 10.1038/nrc3239 [DOI] [PMC free article] [PubMed] [Google Scholar]
- 26.Lalani AA, McGregor BA, Albiges L, et al. Systemic Treatment of Metastatic Clear Cell Renal Cell Carcinoma in 2018: Current Paradigms, Use of Immunotherapy, and Future Directions. Eur Urol 2019;75:100-10. 10.1016/j.eururo.2018.10.010 [DOI] [PubMed] [Google Scholar]
- 27.McDermott DF, Huseni MA, Atkins MB, et al. Clinical activity and molecular correlates of response to atezolizumab alone or in combination with bevacizumab versus sunitinib in renal cell carcinoma. Nat Med 2018;24:749-57. 10.1038/s41591-018-0053-3 [DOI] [PMC free article] [PubMed] [Google Scholar]
- 28.Biasiotta A, D'Arcangelo D, Passarelli F, et al. Ion channels expression and function are strongly modified in solid tumors and vascular malformations. J Transl Med 2016;14:285. 10.1186/s12967-016-1038-y [DOI] [PMC free article] [PubMed] [Google Scholar]
- 29.Zhang P, Yang X, Yin Q, et al. Inhibition of SK4 Potassium Channels Suppresses Cell Proliferation, Migration and the Epithelial-Mesenchymal Transition in Triple-Negative Breast Cancer Cells. PLoS One 2016;11:e0154471. 10.1371/journal.pone.0154471 [DOI] [PMC free article] [PubMed] [Google Scholar]
- 30.Bulk E, Ay AS, Hammadi M, et al. Epigenetic dysregulation of KCa 3.1 channels induces poor prognosis in lung cancer. Int J Cancer 2015;137:1306-17. 10.1002/ijc.29490 [DOI] [PubMed] [Google Scholar]
- 31.Zhang Y, Feng Y, Chen L, et al. Effects of Intermediate-Conductance Ca(2+)-Activated K(+) Channels on Human Endometrial Carcinoma Cells. Cell Biochem Biophys 2015;72:515-25. 10.1007/s12013-014-0497-0 [DOI] [PubMed] [Google Scholar]
- 32.Klumpp L, Sezgin EC, Skardelly M, et al. KCa3.1 Channels and Glioblastoma: In Vitro Studies. Curr Neuropharmacol 2018;16:627-35. 10.2174/1570159X15666170808115821 [DOI] [PMC free article] [PubMed] [Google Scholar]
- 33.Rabjerg M, Oliván-Viguera A, Hansen LK, et al. High expression of KCa3.1 in patients with clear cell renal carcinoma predicts high metastatic risk and poor survival. PLoS One 2015;10:e0122992. 10.1371/journal.pone.0122992 [DOI] [PMC free article] [PubMed] [Google Scholar]
- 34.Chiang EY, Li T, Jeet S, et al. Potassium channels Kv1.3 and KCa3.1 cooperatively and compensatorily regulate antigen-specific memory T cell functions. Nat Commun 2017;8:14644. 10.1038/ncomms14644 [DOI] [PMC free article] [PubMed] [Google Scholar]
- 35.Chimote AA, Balajthy A, Arnold MJ, et al. A defect in KCa3.1 channel activity limits the ability of CD8(+) T cells from cancer patients to infiltrate an adenosine-rich microenvironment. Sci Signal 2018;11:eaaq1616. [DOI] [PMC free article] [PubMed]
Associated Data
This section collects any data citations, data availability statements, or supplementary materials included in this article.
Supplementary Materials
The article’s supplementary files as


