

Abstract
Introduction
Prenatal exposure to perfluoroalkyl substances (PFASs) has been inconsistently associated with asthma and allergic diseases and increased number of infections in early childhood. We examined the association of PFASs measured in pregnancy with childhood asthma, allergies and common infectious diseases in a prospective pregnancy cohort followed to age 7 years.
Material and methods
Six PFASs (out of 19 measured) with at least 80% of measurements above the limit of quantification (LOQ) in maternal plasma during pregnancy in two subcohorts of the Norwegian Mother and Child Cohort Study (MoBa) were analyzed in relation to health outcomes: perfluorooctane sulfonic acid (PFOS), perfluorooctanoic acid (PFOA), perfluorohexane sulfonic acid (PFHxS), perfluorononanoic acid (PFNA), perfluoroundecanoic acid (PFUnDA), and perfluoroheptane sulfonic acid (PFHpS). Follow-up questionnaires were completed at 3 years by 1270 women and at 7 years by 972 women among the 1943 with pregnancy questionnaire and PFAS measures. Health outcomes included parent reports of child’s symptoms or doctor diagnosed asthma and allergic conditions at age 7 years and parent-reported frequency of various infections at 3 and 7 years of age. Logistic and Poisson regression were used. The false discovery rate was controlled at 5%. Sensitivity analyses on gender were performed.
Results
Among the allergy and asthma outcomes, a statistically significant inverse association was seen between PFUnDA concentrations and ever having atopic eczema in girls. PFUnDA also tended to be inversely associated with both wheeze and asthma. For infections from 0 to 3 and 6 to 7 years, 11 significant positive associations were seen between PFASs and airways infections (bronchitis/pneumonia, throat infection, pseudocroup), ear infection and gastric flu/diarrhea; whereas 6 inverse associations were seen for pseudocroup, ear infections and urinary tract infections. The majority of the findings with respect to infectious diseases were found in girls only.
Discussion
With the exception of an inverse association between PFUnDA and eczema, and a tendency of a similar association for wheeze and asthma, maternal PFAS levels during pregnancy showed little association with asthma or allergy related outcomes. Findings from the present study suggest immunosuppressive effects of PFASs on airways infections, such as bronchitis/pneumonia and throat infections, as well as diarrhea/gastric flu. Our results indicate a possible role of gender in the PFAS-health outcome associations.
Keywords: perfluoroalkyl substances, asthma, allergy, immunosuppression, MoBa, prenatal, childhood
Introduction
Perfluoroalkyl substances (PFASs) are synthetic fluorinated compounds that have been widely used in industrial and commercial products because of their water, oil, stain and heat resistant qualities (Kotthoff et al. 2015; Vestergren and Cousins 2009). PFASs are environmental pollutants and are ubiquitously found in nature, wildlife and humans (Houde et al. 2006; Lau et al. 2007).
The main PFAS exposure for humans is through food and beverages, although inhalation and ingestion of indoor dust may also contribute (Fromme et al. 2009; Haug et al. 2011b; Haug et al. 2010). Exposure in utero occurs through placental transfer (Apelberg et al. 2007; Gutzkow et al. 2012) and mother’s milk contributes considerably to postnatal exposure (Haug et al. 2011a; Thomsen et al. 2010).
Experimental in vitro and animal studies (DeWitt et al. 2012) suggest that PFASs have immunotoxic effects, and exposure may be particularly harmful during the time of immune system development. Some of the human studies on prenatal exposure to PFASs and vaccine responses or infectious diseases, suggest immunosuppression; an association between prenatal exposure to PFASs and reduced immune responses to childhood vaccinations was found in Faroese (Grandjean et al. 2012) and Norwegian children (Granum et al. 2013). Furthermore, in Norwegian children, maternal PFAS levels have also been associated with an increased number of episodes of common cold and gastric flu in a sub-cohort of the Norwegian Mother and Child Cohort Study (MoBa), as well as respiratory tract infections in the Environment and Childhood Asthma (ECA) study (Granum et al. 2013; Impinen et al. 2018). In the Danish Odense Child Cohort perfluorooctane sulfonic acid (PFOS) and perfluorooctanoic acid (PFOA) were found to be associated with increased number of days with fever (Dalsager et al. 2016). The Japanese Hokkaido study found maternal PFOA and perfluorohexane sulfonic acid (PFHxS) to be positively associated with infectious disease occurrence in early life (Goudarzi et al. 2017). On the contrary, using the same cohort, Okada et al. reported that maternal PFAS serum levels were not related to childhood infections (Okada et al. 2012). In the Danish National Birth Cohort, maternal PFAS levels were not related to hospitalization due to infectious diseases in Danish children (Fei et al. 2010).
Findings regarding association between prenatal PFAS exposure and asthma and allergy related outcomes in children have been inconsistent. Prenatal exposure to PFASs was inversely related to eczema and total allergic diseases (symptoms of eczema, wheeze and/or rhinoconjunctivitis) in the Japanese children (Goudarzi et al. 2016; Okada et al. 2014). However, in other studies, no associations have been found between prenatal PFAS exposure and eczema (Granum et al. 2013; Impinen et al. 2018; Okada et al. 2012; Smit et al. 2015; Wang et al. 2011). Similarly, with regard to wheeze and PFASs both inverse associations (Smit et al. 2015) and no associations (Granum et al. 2013; Okada et al. 2014; Okada et al. 2012) have been reported.
Given the suggestive experimental evidence and inconsistent human data, associations between PFAS levels in maternal plasma collected in pregnancy and childhood allergy and asthma related outcomes and infections in the Norwegian MoBa cohort were explored.
Material and methods
Study population
The study population in the present study is a subcohort of the Norwegian Mother and Child Cohort Study (MoBa). MoBa is a prospective population-based pregnancy cohort study conducted by the Norwegian Institute of Public Health (Magnus et al. 2016; Paltiel et al. 2014) (www.fhi.no/morogbarn). MoBa was approved by the Regional Committee for Medical Research Ethics and the Norwegian Data Inspectorate. The cohort participants were recruited nationwide between 1999 and 2008. Pregnant women who scheduled a routine ultrasound examination between 17 and 20 weeks of gestation were invited by mail to participate in the study. The total participation rate was 39% of the invited women. All participants signed an informed consent.
A questionnaire was used to collect information regarding demographic and lifestyle characteristics at the time of enrollment, as well as a reproductive and medical history. Further self-reported data were collected at pregnancy weeks 22 and 30, and when the child was 0.5, 1.5, 3 and 7 years old. Blood samples were obtained from the mother in mid-pregnancy (median, 18 weeks of gestation). Maternal blood samples were shipped from the collection site to Oslo by mail at ambient temperature. Data from the women recruited in MoBa were linked to the Medical Birth Registry of Norway (MBRN) (Magnus et al. 2016; Magnus et al. 2006).
The MoBa subcohort used in the present study consists of data from two previous nested case cohort studies: one addressed preeclampsia and PFAS (Starling et al. 2014), and the other addressed subfecundity and PFAS (Whitworth et al. 2012). The preeclampsia study involved mothers with singleton pregnancies, no previous live births or stillbirths, no chronic hypertension before pregnancy, enrollment in MoBa in the period of 2003–2007, and who provided a mid-pregnancy blood sample (Starling et al. 2014). From available validated preeclampsia cases 500 were randomly selected from the eligible cohort and 550 control pregnancies were randomly selected, giving a total of 1050 subjects. To be eligible for selection into the subfecundity study, the women must have enrolled in MoBa in 2003–2004, had delivered a live-born child, provided a mid-pregnancy blood sample, and provided complete information about time to pregnancy on the enrollment questionnaire (Whitworth et al. 2012). For the study, 400 pregnancies were randomly selected from all eligible MoBa participants who met the criteria for subfecundity (defined as self-reported time to pregnancy of greater than 12 months). From all eligible MoBa participants who reported a time to pregnancy of any duration 550 pregnancies were randomly selected as controls. Thus, the total number of subjects from this study was 950.
For the present study, a total of 2000 mother-child pairs with measured PFAS were available, but 1943 remained after excluding the second twin of twin pairs (n=23), one observation from subjects who were in both studies (n=17), and those whose baseline questionnaire was not returned (n=17). The later questionnaires were returned by 1756 (89%) at 0.5 year, by 1522 (77%) at 1.5 year, by 1270 (65%) at 3 years, and by 972 (49%) at 7 years; 792 participants returned all the mentioned questionnaires (Figure 1).
Figure 1.
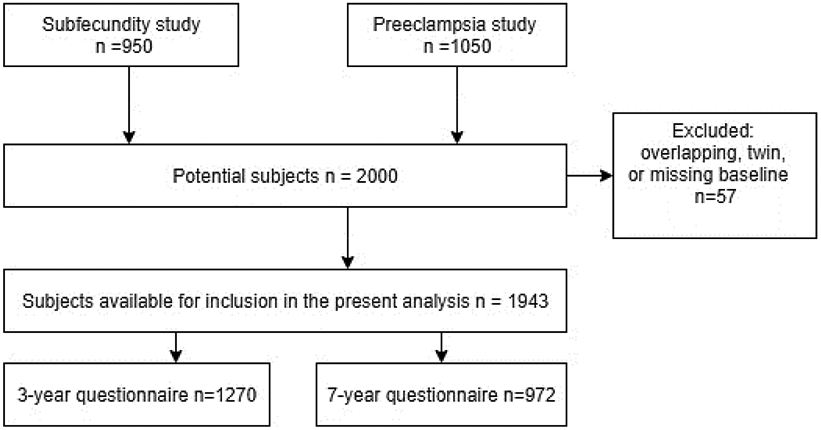
Number of observations at different stages of study
Measurement of maternal plasma PFAS concentrations
PFAS concentrations were measured in 150 μL of maternal plasma using high-performance liquid chromatography/tandem mass spectrometry at the Norwegian Institute of Public Health. For quantification of PFOS, the total area of the linear and branched isomers was integrated. Further details about the analytic method have been published previously (Haug et al. 2009). Nineteen PFASs were measured in the maternal plasma. In this study, PFASs with less than 80 % of samples above the limit of quantification (LOQ=0.05 ng/mL) were excluded from the statistical analysis. Thus, we analyzed six PFASs in relation to health outcomes: PFOS, PFOA, PFHxS, perfluorononanoic acid (PFNA), perfluoroundecanoic acid (PFUnDA), and perfluoroheptane sulfonic acid (PFHpS).
Child health outcomes
Three types of health outcomes were examined: doctor-diagnosed outcomes reported by parents at 7 years (current or ever); parent-reported asthma- and allergy-related symptoms at 7 years (current or ever) and parent-reported number of episodes of infections from 0 to 3 years of age (sum from the 0.5 year, 1.5 year and 3 year questionnaires) and from 6 to 7 years of age (from the 7 year questionnaire) (Table 1). “Current” was defined as the child having symptoms the last 12 months, whereas “ever” was defined as the child having or have had disease before age 7 years. The number of infectious diseases from 0 to 3 years of age were only calculated for the participants returning all questionnaires from birth to age 3 years (i.e. questionnaires at 0.5, 1.5 and 3 years of age). Doctor-diagnosed outcomes were asthma, atopic eczema, food allergy (milk, egg, peanuts, nuts, fish, shellfish, fruit or other foods), and inhaled allergy (pollen, cat or dog). Parent-reported symptoms were night cough without a cold, hives or urticaria, itchy rash that has come and gone for at least 6 months, itchy/runny eyes without a cold, runny nose without a cold, and tightness/wheezing/whistling in the chest. Parent-reported infections were common cold (3 years only), throat Infection with streptococcus (3 years only), other throat Infection (3 years only), pseudocroup (3 years only), bronchitis/RS-virus/ pneumonia (3 and 7 years), ear Infection (3 and 7 years), gastric flu/diarrhea (3 and 7 years) and urinary tract infection (3 and 7 years) (Table 1).
Table 1.
Doctor-diagnosed and parent reported health outcomes
| Parent report of doctor-diagnosed health outcomes at 7 years of age: current (last 12 months) and ever |
| Asthma |
| Atopic eczema |
| Food allergy (milk, egg, peanuts, nuts, fish, shellfish, fruit, other foods) |
| Inhaled allergy (pollen, cat or dog) |
| Parent-reported symptoms in children at 7 years of age: current (in last 12 months) and ever |
| Night cough without a cold |
| Wheeze (Tightness/wheezing/whistling in the chest) |
| Hives/urticaria |
| Itchy rash that has come and gone for at least 6 months |
| Itchy/runny eyes without a cold |
| Runny nose without a cold |
| Parent-reported number of episodes of childhood infections from 0 to 3 years of age and from 6 to 7 years of age |
| Common cold (3 years only) |
| Bronchitis/RS-virus/pneumonia (3 and 7 years) |
| Throat infection with streptococcus (3 years only) |
| Other throat infections (3 years only) |
| Pseudocroup (3 years only) |
| Ear infection (3 and 7 years) |
| Diarrhea/gastric flu (3 and 7 years) |
| Urinary tract infection (3 and 7 years) |
Statistical methods
For PFAS samples with levels below LOQ, data were imputed using multiple imputation with ten imputations. Imputed values of PFASs were constrained so that the generated value of concentration would be above zero and below the LOQ. PFAS concentrations were natural-log transformed to achieve approximate normality needed in imputation. Pearson correlation was computed for non-logarithmic PFAS values. Prior to regression analysis, values were divided by the interquartile range (IQR) of the respective PFAS to make it easier to interpret the regression coefficients. Thus, the odds ratios presented are interpreted as changed risk with an increase of one IQR difference.
Logistic regression analysis was used to calculate odds ratios (OR) and their 95% confidence intervals (95% CI) for all binary outcomes. Poisson regression was used for count data of infections. The resulting β-estimates were transformed to relative risk (RR) and their 95% CI. Directed acyclic graphs (DAGs) for asthma/allergy and infectious diseases were used to determine the adjustment variables in the final models (Supplement Figure 1). For all outcomes the models were adjusted for maternal age, maternal body mass index (BMI), maternal education, parity, and maternal smoking during the pregnancy. Nursery attendance was not in the minimum sufficient adjustment set. However, since nursery attendance can have an impact on the development of infectious diseases, sensitivity analyses were performed with regard to nursery attendance or not at age 3 years. Since gender differences are often seen for asthma and allergy related outcomes, sensitivity analyses with regard to gender was performed.
As there was a large number of associations examined (32 outcomes by 6 PFAS) and we did not have a clear a priori ranking of possible associations, we controlled the false discovery rate at 0.05 to address multiple testing. All statistical analyses were performed with SAS 9.4 (SAS Institute Inc., Cary, NC, USA). A non-random dropout from the follow-up was a possible source of bias. Therefore, the main analyses were performed by using inverse probability weighting (IPW) including the adjustment (Hernan et al. 2004). In sensitivity analyses, we repeated the analyses without IPW, to see if respondent attrition to later follow-up questionnaires had an effect on results. In addition, possible effect of being a case or a control in the two cohorts was evaluated by using data source as a covariate in regression analysis and comparing the model with the data source to a model with no data source covariate.
Results
Demographic and background variables
The majority of the mothers were between 25 and 34 years of age (Table 2). Half of the mothers had a normal BMI (20-25 kg/m2). Sixty per cent had 16 or more years of education. The most commonly reported maternal disease was inhaled allergy. Seventy-three per cent of mothers had no previous deliveries. During pregnancy, smoking sometimes or daily was reported by 7% of mothers and passive smoke exposure by 11%. Postnatal passive smoke exposure for the child was reported for 3-5% of the children. Only 3% of mothers reported that they did not breastfeed the child.
Table 2.
Background information for mothers and children at birth (N=1943), 0.5 year (N=1756), 1.5 year (N=1522) and 3 year (N=1270) questionnaires.
| Data source | |||||||||
|---|---|---|---|---|---|---|---|---|---|
| Whole cohort |
Subfecundity cases |
Preeclampisa cases |
Control groups | Chi- square |
|||||
| N | % | N | % | N | % | N | % | p | |
| Child’s sex | 0.040 | ||||||||
| Boy | 863 | 49 | 188 | 51 | 187 | 44 | 488 | 51 | |
| Girl | 879 | 50 | 179 | 48 | 231 | 55 | 469 | 49 | |
| Missing | 14 | 1 | 3 | 1 | 4 | 1 | 7 | 1 | |
| Mother’s illnesses | |||||||||
| Asthma | 146 | 8 | 26 | 7 | 47 | 10 | 73 | 7 | 0.047 |
| Inhaled allergy (pollen, animal) | 449 | 23 | 85 | 21 | 136 | 29 | 228 | 21 | 0.001 |
| Other allergies | 197 | 10 | 31 | 8 | 57 | 12 | 109 | 10 | 0.066 |
| Atopic eczema (childhood eczema) | 130 | 7 | 30 | 8 | 35 | 7 | 65 | 6 | 0.500 |
| Urticaria (hives) | 94 | 5 | 20 | 5 | 23 | 5 | 51 | 5 | 0.990 |
| Mother’s BMI | <0.001 | ||||||||
| <20 | 244 | 13 | 53 | 13 | 45 | 9 | 146 | 14 | |
| 20-25 | 992 | 51 | 167 | 42 | 227 | 48 | 598 | 56 | |
| >25 | 704 | 36 | 178 | 45 | 201 | 42 | 325 | 30 | |
| Missing | 3 | 0 | 2 | 1 | 1 | 0 | 0 | 0 | |
| Mother’s age | <0.001 | ||||||||
| ≤24 | 220 | 11 | 23 | 6 | 79 | 17 | 118 | 11 | |
| 25-34 | 1432 | 74 | 281 | 70 | 349 | 74 | 802 | 75 | |
| ≥35 | 291 | 15 | 96 | 24 | 46 | 10 | 149 | 14 | |
| Mother’s education | 0.006 | ||||||||
| ≤12 years | 137 | 7 | 44 | 11 | 28 | 6 | 65 | 6 | |
| 13-15 years | 539 | 28 | 120 | 30 | 133 | 28 | 286 | 27 | |
| ≥16 years | 1172 | 60 | 216 | 54 | 284 | 60 | 672 | 63 | |
| Missing | 95 | 5 | 20 | 5 | 29 | 6 | 46 | 4 | |
| No previous deliveries | 1427 | 73 | 227 | 57 | 466 | 98 | 734 | 69 | <0.001 |
| Mother’s smoking during pregnancy | |||||||||
| No | 1566 | 89 | 322 | 87 | 375 | 89 | 869 | 81 | 0.009 |
| Sometimes | 60 | 3 | 14 | 4 | 6 | 1 | 40 | 4 | |
| Daily | 78 | 4 | 28 | 8 | 21 | 5 | 29 | 3 | |
| Missing | 52 | 3 | 6 | 2 | 20 | 5 | 131 | 12 | |
| Passive smoking during pregnancy | 193 | 11 | 55 | 15 | 46 | 11 | 92 | 10 | 0.080 |
| Missing | 10 | 1 | 1 | 0 | 3 | 1 | 6 | 1 | |
| Child passive smoking until 0.5 year | 52 | 3 | 15 | 4 | 13 | 3 | 24 | 2 | 0.150 |
| Missing | 7 | 0 | 2 | 1 | 1 | 0 | 4 | 0 | |
| Child passive smoking until 1.5 year | 65 | 4 | 24 | 7 | 14 | 4 | 27 | 3 | 0.004 |
| Missing | 3 | 0 | 0 | 0 | 0 | 0 | 3 | 0 | |
| Child passive smoking until 3 years | 61 | 5 | 21 | 8 | 7 | 2 | 33 | 5 | 0.006 |
| Missing | 15 | 1 | 10 | 4 | 1 | 0 | 26 | 4 | |
| Breastfeeding months | <0.001 | ||||||||
| 0 or missing | 55 | 3 | 8 | 2 | 22 | 5 | 25 | 3 | |
| 1-6 | 350 | 20 | 103 | 28 | 82 | 19 | 165 | 17 | |
| ≥7 | 1351 | 77 | 259 | 70 | 318 | 75 | 774 | 80 | |
| In nursery at 3 years | 1073 | 84 | 232 | 84 | 253 | 88 | 588 | 83 | 0.120 |
One of the restriction criteria in the preeclampsia study was no previous live births or stillbirths, explaining the difference in parity between the two groups of cases and controls (Table 2). There were, however, no notable differences in the PFAS levels between these groups (Supplement Table 1). The restriction criteria may further explain the difference in maternal age between the preeclampsia and subfecundity cohort with more participants at lower ages in the preeclampsia group. However, the age was not reflected in maternal education where preeclampsia cases seemed to be higher educated than the subfecundity cases. Duration of breastfeeding may affect the child postnatal exposure to PFASs. Although significant differences were found between the cases and controls, the majority of the children were breastfed for 7 months or longer. There were statistically significant differences when it comes to maternal smoking during pregnancy and child passive smoking asked at 1.5 and 3 years of age. However, since the prevalence were low, the group differences have most likely not affected the results of the present study.
PFAS concentrations
All samples had PFOS and PFOA concentrations above LOQ while PFHxS, PFNA, PFUnDA, and PFHpS were below LOQ for some participants. The PFAS concentrations by percentiles are reported in Table 3, ordered by their median concentrations, with PFOS being the highest and PFHpS the lowest. The correlations among the six PFAS levels ranged from 0.09 (PFUnDA:PFHxS) to 0.75 (PFHpS:PFOS ) and all but 2 were 0.22 or greater (Supplement Table 2). As shown in Supplement Table 1, there were no notable differences between the PFAS levels in cases from the subfecundity and preeclampsia cohorts, as well as the controls.
Table 3.
PFAS concentration in plasma (ng/ml) by percentile (N=1943). LOQ: level of quantification.
| Percentile | ||||||||||
|---|---|---|---|---|---|---|---|---|---|---|
| PFAS | N, >LOQ | %, >LOQ | 1% | 5% | 25% | 50% | 75% | 95% | 99% | |
| Perfluorooctane sulfonic acid | PFOS | 1943 | 100 | 4.21 | 7.60 | 9.92 | 12.87 | 16.63 | 20.99 | 33.04 |
| Perfluorooctanoic acid | PFOA | 1943 | 100 | 0.79 | 1.41 | 1.86 | 2.54 | 3.30 | 4.19 | 6.29 |
| Perfluorohexane sulfonic acid | PFHxS | 1936 | 100 | 0.17 | 0.35 | 0.47 | 0.65 | 0.91 | 1.33 | 3.95 |
| Perfluorononanoic acid | PFNA | 1939 | 100 | 0.10 | 0.24 | 0.33 | 0.45 | 0.63 | 0.83 | 1.46 |
| Perfluoroundecanoic acid | PFUnDA | 1742 | 90 | 0.01 | 0.06 | 0.11 | 0.20 | 0.31 | 0.42 | 0.75 |
| Perfluoroheptane sulfonic acid | PFHpS | 1670 | 86 | 0.02 | 0.06 | 0.10 | 0.15 | 0.21 | 0.29 | 0.49 |
Health outcomes
The prevalence of the assessed health outcomes are shown in Tables 4A-C.
Table 4A.
Prevalence of doctor-diagnosed outcomes at 7 years
| N=972 | Current | Ever | ||
|---|---|---|---|---|
| Yes, n | Yes, % | Yes, n | Yes, % | |
| Asthma | 52 | 5 | 99 | 10 |
| Atopic eczema | 82 | 8 | 155 | 16 |
| Food allergy | 90 | 9 | 91 | 9 |
| Inhaled allergy | 35 | 4 | 94 | 10 |
Table 4C.
Number and percentage of children who had infectious diseases, and mean (SD) number of episodes of the diseases by 3 and 7 years of age. Means are calculated based on the number of participants in each age group.
| 0-3 years N=1270 |
6-7 years N=972 |
|||
|---|---|---|---|---|
| ≥ 1 episode N (%) |
Mean (SD) | ≥ 1 episode N (%) |
Mean (SD) | |
| Common cold | 1256 (99) | 9.64 (5.7) | - | |
| Bronchitis/pneumonia | 365 (29) | 0.55 (1.8) | 27 (3) | 0.04 (0.3) |
| Throat infection w/strepto | 205 (16) | 0.29 (1.1) | - | |
| Other throat infections | 309 (24) | 0.51 (1.3) | - | |
| Pseudocroup | 246 (19) | 0.25 (1.8) | - | |
| Ear infection | 576 (45) | 1.18 (1.2) | 132 (14) | 0.20 (0.6) |
| Diarrhea/gastric flu | 1018 (80) | 2.29 (2.5) | 205 (21) | 0.75 (3.1) |
| Urinary tract infection | 343 (27) | 0.47 (1.1) | 35 (4) | 0.05 (0.3) |
For PFASs and doctor-diagnosed outcomes (asthma, atopic eczema, food allergy, inhaled allergy), before FDR correction, there were inverse associations (P≤0.05) between PFUnDA and ever having asthma, current asthma, and ever having atopic eczema (Table 5A). After FDR correction, only the association between PFUnDA and atopic eczema remained statistically significant. When stratifying on gender, the association between PFUnDA and atopic eczema was significant in girls only (Supplement Table 3A).
Table 5A.
Doctor-diagnosed health outcomes by 7 years of age and their association with maternal PFAS concentration in plasma during pregnancy. Weighted analysis with p-value corrections. N=921 (51 participants not included due to missing data for confounders). Results shown in bold are statistically significant after FDR. Italics: p≤0.05 before FDR.
| Current | Ever | ||||||||||
|---|---|---|---|---|---|---|---|---|---|---|---|
| Outcome | Exposure | OR1 | LCL | UCL | p | FDR2 | OR1 | LCL | UCL | p | FDR2 |
| Asthma | PFOS | 1.11 | 0.72 | 1.69 | 0.643 | 0.953 | 0.93 | 0.68 | 1.26 | 0.631 | 0.946 |
| PFOA | 1.11 | 0.69 | 1.79 | 0.657 | 0.953 | 0.99 | 0.70 | 1.39 | 0.933 | 0.989 | |
| PFHxS | 1.21 | 0.87 | 1.67 | 0.259 | 0.888 | 0.96 | 0.79 | 1.18 | 0.724 | 0.989 | |
| PFNA | 0.99 | 0.64 | 1.52 | 0.953 | 0.953 | 1.00 | 0.73 | 1.38 | 0.989 | 0.989 | |
| PFUnDA | 0.68 | 0.48 | 0.97 | 0.035 | 0.724 | 0.75 | 0.57 | 0.98 | 0.038 | 0.452 | |
| PFHpS | 0.97 | 0.71 | 1.32 | 0.851 | 0.953 | 1.01 | 0.80 | 1.28 | 0.934 | 0.989 | |
| Atopic eczema | PFOS | 0.97 | 0.70 | 1.36 | 0.876 | 0.953 | 1.03 | 0.80 | 1.33 | 0.798 | 0.989 |
| PFOA | 0.93 | 0.64 | 1.35 | 0.707 | 0.953 | 1.02 | 0.77 | 1.34 | 0.914 | 0.989 | |
| PFHxS | 1.06 | 0.83 | 1.36 | 0.623 | 0.953 | 1.09 | 0.90 | 1.31 | 0.389 | 0.870 | |
| PFNA | 0.78 | 0.55 | 1.10 | 0.151 | 0.724 | 0.90 | 0.70 | 1.17 | 0.440 | 0.870 | |
| PFUnDA | 0.76 | 0.56 | 1.03 | 0.072 | 0.724 | 0.69 | 0.55 | 0.86 | 0.001 | 0.024 | |
| PFHpS | 0.90 | 0.72 | 1.13 | 0.354 | 0.952 | 0.95 | 0.79 | 1.15 | 0.608 | 0.946 | |
| Food allergy | PFOS | 1.02 | 0.73 | 1.41 | 0.928 | 0.953 | 0.99 | 0.72 | 1.37 | 0.969 | 0.989 |
| PFOA | 1.32 | 0.92 | 1.90 | 0.136 | 0.724 | 1.10 | 0.77 | 1.57 | 0.613 | 0.946 | |
| PFHxS | 1.10 | 0.86 | 1.41 | 0.453 | 0.953 | 1.03 | 0.82 | 1.30 | 0.799 | 0.989 | |
| PFNA | 1.22 | 0.87 | 1.71 | 0.246 | 0.888 | 1.25 | 0.90 | 1.74 | 0.183 | 0.580 | |
| PFUnDA | 0.95 | 0.70 | 1.29 | 0.753 | 0.953 | 0.79 | 0.59 | 1.05 | 0.097 | 0.580 | |
| PFHpS | 0.97 | 0.76 | 1.24 | 0.805 | 0.953 | 0.92 | 0.73 | 1.16 | 0.471 | 0.870 | |
| Inhaled allergy | PFOS | 1.11 | 0.72 | 1.69 | 0.643 | 0.953 | 1.27 | 0.93 | 1.74 | 0.135 | 0.580 |
| PFOA | 0.96 | 0.55 | 1.67 | 0.887 | 0.953 | 1.25 | 0.88 | 1.78 | 0.213 | 0.580 | |
| PFHPxS | 1.21 | 0.81 | 1.81 | 0.357 | 0.952 | 1.18 | 0.93 | 1.50 | 0.166 | 0.580 | |
| PFNA | 0.89 | 0.53 | 1.47 | 0.640 | 0.953 | 0.89 | 0.65 | 1.22 | 0.462 | 0.870 | |
| PFUnDA | 1.18 | 0.72 | 1.94 | 0.514 | 0.953 | 0.79 | 0.60 | 1.04 | 0.092 | 0.580 | |
| PFHpS | 0.77 | 0.56 | 1.06 | 0.109 | 0.724 | 0.87 | 0.70 | 1.09 | 0.217 | 0.580 | |
Logistic regression odds ratio (OR) adjusted for maternal age, maternal BMI, maternal education, parity, and smoking during the pregnancy with lower 95% confidence limit (LCL) and upper 95% confidence limit (UCL)
False discovery rate p-value
For parent-reported asthma- and allergy-related symptoms, before the FDR correction, current or ever wheezing both had inverse association with PFUnDA, current or ever hives had a positive association with PFHpS, and current itchy or runny eyes had a positive association with PFHxS. None of these associations remained after FDR correction (Table 5B). After FDR correction of stratified analyses on gender, no associations were significant. However, uncorrected analyses showed the same tendency as in the uncorrected analyses of the whole cohort, but with significant associations in either boys or girls (Supplement Table 3B).
Table 5B.
Parent-reported current and lifetime symptoms by 7 years of age and their association with maternal PFAS concentration in plasma during pregnancy. Weighted analysis with p-value corrections. N=921 (51 participants not included due to missing data for confounders). Italics: p≤0.05 before FDR.
| Current | Ever | ||||||||||
|---|---|---|---|---|---|---|---|---|---|---|---|
| Outcome | Exposure | OR1 | LCL | UCL | p | FDR2 | OR1 | LCL | UCL | p | FDR2 |
| Nightly cough | PFOS | 1.01 | 0.74 | 1.40 | 0.934 | 0.981 | 1.00 | 0.77 | 1.29 | 0.981 | 0.987 |
| PFOA | 1.16 | 0.81 | 1.66 | 0.430 | 0.908 | 1.17 | 0.88 | 1.57 | 0.278 | 0.714 | |
| PFHxS | 1.06 | 0.84 | 1.33 | 0.624 | 0.908 | 0.98 | 0.82 | 1.18 | 0.853 | 0.987 | |
| PFNA | 1.02 | 0.73 | 1.43 | 0.897 | 0.979 | 1.01 | 0.78 | 1.32 | 0.918 | 0.987 | |
| PFUnDA | 0.82 | 0.62 | 1.09 | 0.178 | 0.777 | 0.84 | 0.66 | 1.05 | 0.126 | 0.562 | |
| PFHpS | 1.14 | 0.87 | 1.48 | 0.353 | 0.819 | 1.08 | 0.88 | 1.33 | 0.452 | 0.815 | |
| Wheeze | PFOS | 0.94 | 0.65 | 1.37 | 0.757 | 0.908 | 0.89 | 0.69 | 1.13 | 0.340 | 0.747 |
| PFOA | 0.97 | 0.64 | 1.46 | 0.868 | 0.977 | 0.96 | 0.73 | 1.26 | 0.753 | 0.987 | |
| PFHxS | 1.07 | 0.81 | 1.41 | 0.646 | 0.908 | 1.07 | 0.90 | 1.28 | 0.458 | 0.815 | |
| PFNA | 0.93 | 0.64 | 1.37 | 0.722 | 0.908 | 0.89 | 0.69 | 1.14 | 0.353 | 0.747 | |
| PFUnDA | 0.71 | 0.51 | 0.98 | 0.037 | 0.426 | 0.71 | 0.57 | 0.89 | 0.003 | 0.090 | |
| PFHpS | 0.87 | 0.68 | 1.12 | 0.283 | 0.777 | 0.96 | 0.80 | 1.15 | 0.648 | 0.965 | |
| Hives | PFOS | 1.57 | 0.98 | 2.51 | 0.062 | 0.426 | 1.35 | 0.94 | 1.93 | 0.101 | 0.562 |
| PFOA | 1.19 | 0.71 | 2.01 | 0.514 | 0.908 | 1.28 | 0.86 | 1.92 | 0.228 | 0.684 | |
| PFHxS | 1.23 | 0.87 | 1.75 | 0.247 | 0.777 | 1.33 | 1.00 | 1.76 | 0.052 | 0.562 | |
| PFNA | 1.55 | 0.95 | 2.54 | 0.079 | 0.426 | 1.19 | 0.82 | 1.74 | 0.352 | 0.747 | |
| PFUnDA | 1.15 | 0.72 | 1.82 | 0.567 | 0.908 | 0.82 | 0.60 | 1.11 | 0.196 | 0.641 | |
| PFHpS | 1.74 | 1.09 | 2.78 | 0.022 | 0.426 | 1.60 | 1.13 | 2.28 | 0.009 | 0.158 | |
| Itchy rash | PFOS | 0.93 | 0.64 | 1.36 | 0.711 | 0.908 | 0.78 | 0.59 | 1.04 | 0.094 | 0.562 |
| PFOA | 0.92 | 0.60 | 1.43 | 0.714 | 0.908 | 1.00 | 0.79 | 1.28 | 0.972 | 0.987 | |
| PFHxS | 1.33 | 0.96 | 1.83 | 0.083 | 0.426 | 0.89 | 0.65 | 1.22 | 0.478 | 0.815 | |
| PFNA | 1.07 | 0.71 | 1.61 | 0.746 | 0.908 | 1.04 | 0.72 | 1.48 | 0.853 | 0.987 | |
| PFUnDA | 0.96 | 0.66 | 1.38 | 0.808 | 0.938 | 1.21 | 0.94 | 1.57 | 0.140 | 0.562 | |
| PFHpS | 0.88 | 0.66 | 1.16 | 0.364 | 0.819 | 1.05 | 0.75 | 1.46 | 0.789 | 0.987 | |
| Itchy/runny eyes | PFOS | 1.40 | 0.97 | 2.02 | 0.074 | 0.426 | 1.33 | 0.96 | 1.84 | 0.085 | 0.562 |
| PFOA | 1.26 | 0.83 | 1.89 | 0.276 | 0.777 | 1.08 | 0.76 | 1.54 | 0.670 | 0.965 | |
| PFHxS | 1.34 | 1.00 | 1.80 | 0.048 | 0.426 | 1.15 | 0.90 | 1.46 | 0.262 | 0.714 | |
| PFNA | 1.14 | 0.78 | 1.65 | 0.510 | 0.908 | 1.00 | 0.72 | 1.38 | 0.987 | 0.987 | |
| PFUnDA | 1.06 | 0.75 | 1.50 | 0.756 | 0.908 | 0.93 | 0.69 | 1.24 | 0.610 | 0.955 | |
| PFHpS | 0.99 | 0.75 | 1.31 | 0.954 | 0.981 | 1.05 | 0.81 | 1.35 | 0.713 | 0.987 | |
| Runny nose | PFOS | 1.14 | 0.77 | 1.67 | 0.517 | 0.908 | 1.13 | 0.80 | 1.58 | 0.498 | 0.815 |
| PFOA | 1.32 | 0.86 | 2.03 | 0.201 | 0.777 | 1.34 | 0.92 | 1.95 | 0.134 | 0.562 | |
| PFHxS | 1.05 | 0.79 | 1.40 | 0.729 | 0.908 | 1.02 | 0.80 | 1.30 | 0.889 | 0.987 | |
| PFNA | 1.27 | 0.86 | 1.88 | 0.234 | 0.777 | 1.27 | 0.90 | 1.80 | 0.176 | 0.632 | |
| PFUnDA | 1.00 | 0.70 | 1.43 | 0.982 | 0.982 | 0.96 | 0.71 | 1.31 | 0.797 | 0.987 | |
| PFHpS | 0.87 | 0.68 | 1.13 | 0.302 | 0.777 | 0.90 | 0.72 | 1.14 | 0.383 | 0.766 | |
Logistic regression odds ratio (OR) adjusted for maternal age, maternal BMI, maternal education, parity, and smoking during the pregnancy with lower 95% confidence limit (LCL) and upper 95% confidence limit (UCL)
False discovery rate p-value
After FDR correction, 19 associations between PFAS exposure and infectious diseases (p≤0.05) remained significant (Table 5C; Figure 2A-B). The overall trend in the analyses in the whole cohort and gender specific analyses was mainly similar, but some associations were significant in one gender only (Figure 2C-D, Supplement Table 3C).
Table 5C.
Parent-reported common infectious diseases by 3 and 7 years of age and their association with maternal PFAS concentration in plasma during pregnancy. Weighted analysis with p-value corrections. Results shown in bold are statistically significant after FDR. Italics: p≤0.05 before FDR.
| 0-3 years, n=1207 | 6-7 years, n=921 | ||||||||||
|---|---|---|---|---|---|---|---|---|---|---|---|
| Outcome | Exposure | RR1 | LCL | UCL | p | FDR2 | RR1 | LCL | UCL | p | FDR2 |
| Common cold | PFOS | 0.94 | 0.92 | 0.97 | <0.001 | <0.001 | |||||
| PFOA | 0.96 | 0.94 | 0.99 | 0.012 | 0.045 | ||||||
| PFHxS | 1.01 | 1.00 | 1.03 | 0.058 | 0.156 | ||||||
| PFNA | 0.99 | 0.97 | 1.02 | 0.641 | 0.756 | ||||||
| PFUnDA | 0.98 | 0.95 | 1.00 | 0.046 | 0.133 | ||||||
| PFHpS | 0.99 | 0.97 | 1.01 | 0.438 | 0.563 | ||||||
| Bronchitis/pneumonia | PFOS | 1.20 | 1.07 | 1.34 | 0.001 | 0.007 | 0.77 | 0.50 | 1.19 | 0.242 | 0.398 |
| PFOA | 1.27 | 1.12 | 1.43 | <0.001 | 0.001 | 0.75 | 0.45 | 1.23 | 0.254 | 0.398 | |
| PFHxS | 1.15 | 1.06 | 1.24 | <0.001 | 0.003 | 0.92 | 0.70 | 1.21 | 0.555 | 0.701 | |
| PFNA | 1.01 | 0.91 | 1.13 | 0.815 | 0.876 | 0.67 | 0.43 | 1.05 | 0.081 | 0.193 | |
| PFUnDA | 1.05 | 0.95 | 1.16 | 0.344 | 0.465 | 1.00 | 0.66 | 1.51 | 0.998 | 0.998 | |
| PFHpS | 1.15 | 1.05 | 1.25 | 0.002 | 0.008 | 0.86 | 0.63 | 1.18 | 0.345 | 0.465 | |
| Throat infection w/strepto | PFOS | 0.90 | 0.78 | 1.04 | 0.163 | 0.309 | |||||
| PFOA | 1.14 | 0.96 | 1.35 | 0.125 | 0.261 | ||||||
| PFHxS | 0.93 | 0.86 | 1.01 | 0.104 | 0.226 | ||||||
| PFNA | 1.29 | 1.11 | 1.50 | 0.001 | 0.007 | ||||||
| PFUnDA | 1.12 | 0.97 | 1.30 | 0.127 | 0.261 | ||||||
| PFHpS | 0.95 | 0.86 | 1.05 | 0.305 | 0.458 | ||||||
| Other throat infections | PFOS | 0.90 | 0.81 | 1.01 | 0.064 | 0.158 | |||||
| PFOA | 0.91 | 0.80 | 1.04 | 0.157 | 0.305 | ||||||
| PFHxS | 1.10 | 1.02 | 1.18 | 0.013 | 0.045 | ||||||
| PFNA | 0.97 | 0.87 | 1.08 | 0.580 | 0.720 | ||||||
| PFUnDA | 1.02 | 0.92 | 1.14 | 0.719 | 0.796 | ||||||
| PFHpS | 1.05 | 0.97 | 1.15 | 0.228 | 0.398 | ||||||
| Pseudocroup | PFOS | 1.07 | 0.96 | 1.20 | 0.217 | 0.391 | |||||
| PFOA | 1.22 | 1.07 | 1.38 | 0.002 | 0.010 | ||||||
| PFHxS | 1.20 | 1.11 | 1.30 | <0.001 | <0.001 | ||||||
| PFNA | 0.98 | 0.87 | 1.09 | 0.687 | 0.796 | ||||||
| PFUnDA | 0.86 | 0.78 | 0.95 | 0.002 | 0.010 | ||||||
| PFHpS | 1.07 | 0.99 | 1.16 | 0.098 | 0.225 | ||||||
| Ear infection | PFOS | 0.88 | 0.82 | 0.94 | <0.001 | 0.002 | 1.13 | 0.92 | 1.40 | 0.254 | 0.398 |
| PFOA | 1.00 | 0.92 | 1.08 | 0.968 | 0.982 | 1.12 | 0.88 | 1.41 | 0.349 | 0.465 | |
| PFHxS | 1.09 | 1.04 | 1.14 | <0.001 | 0.003 | 1.08 | 0.93 | 1.25 | 0.298 | 0.456 | |
| PFNA | 0.94 | 0.88 | 1.01 | 0.100 | 0.225 | 1.12 | 0.90 | 1.38 | 0.315 | 0.458 | |
| PFUnDA | 0.90 | 0.84 | 0.96 | 0.002 | 0.008 | 1.22 | 0.99 | 1.50 | 0.063 | 0.158 | |
| PFHpS | 0.99 | 0.94 | 1.05 | 0.717 | 0.796 | 1.01 | 0.86 | 1.19 | 0.870 | 0.922 | |
| Diarrhea/gastric flu | PFOS | 0.98 | 0.93 | 1.03 | 0.348 | 0.465 | 1.12 | 1.01 | 1.24 | 0.033 | 0.104 |
| PFOA | 1.00 | 0.94 | 1.06 | 0.945 | 0.972 | 1.48 | 1.31 | 1.67 | <0.001 | <0.001 | |
| PFHxS | 0.98 | 0.96 | 1.02 | 0.318 | 0.458 | 1.27 | 1.18 | 1.38 | <0.001 | <0.001 | |
| PFNA | 1.06 | 1.00 | 1.12 | 0.036 | 0.108 | 1.08 | 0.96 | 1.20 | 0.191 | 0.353 | |
| PFUnDA | 0.97 | 0.92 | 1.01 | 0.152 | 0.304 | 1.01 | 0.91 | 1.11 | 0.904 | 0.943 | |
| PFHpS | 0.98 | 0.94 | 1.02 | 0.255 | 0.398 | 1.02 | 0.93 | 1.11 | 0.702 | 0.796 | |
| Urinary tract infection | PFOS | 0.78 | 0.70 | 0.87 | <0.001 | <0.001 | 0.91 | 0.63 | 1.31 | 0.604 | 0.737 |
| PFOA | 0.78 | 0.69 | 0.88 | <0.001 | 0.001 | 0.66 | 0.43 | 1.01 | 0.054 | 0.150 | |
| PFHxS | 0.93 | 0.88 | 0.99 | 0.030 | 0.098 | 0.79 | 0.66 | 0.95 | 0.012 | 0.045 | |
| PFNA | 0.93 | 0.83 | 1.05 | 0.235 | 0.398 | 0.64 | 0.44 | 0.94 | 0.021 | 0.072 | |
| PFUnDA | 1.01 | 0.91 | 1.13 | 0.792 | 0.864 | 1.20 | 0.81 | 1.77 | 0.367 | 0.481 | |
| PFHpS | 0.89 | 0.82 | 0.97 | 0.011 | 0.045 | 0.94 | 0.71 | 1.24 | 0.638 | 0.756 | |
Poisson regression rate ratio (RR) adjusted for maternal age, maternal BMI, maternal education, parity, and smoking during the pregnancy with lower 95% confidence limit (LCL) and upper 95% confidence limit (UCL)
False discovery rate p-value
Figure 2.
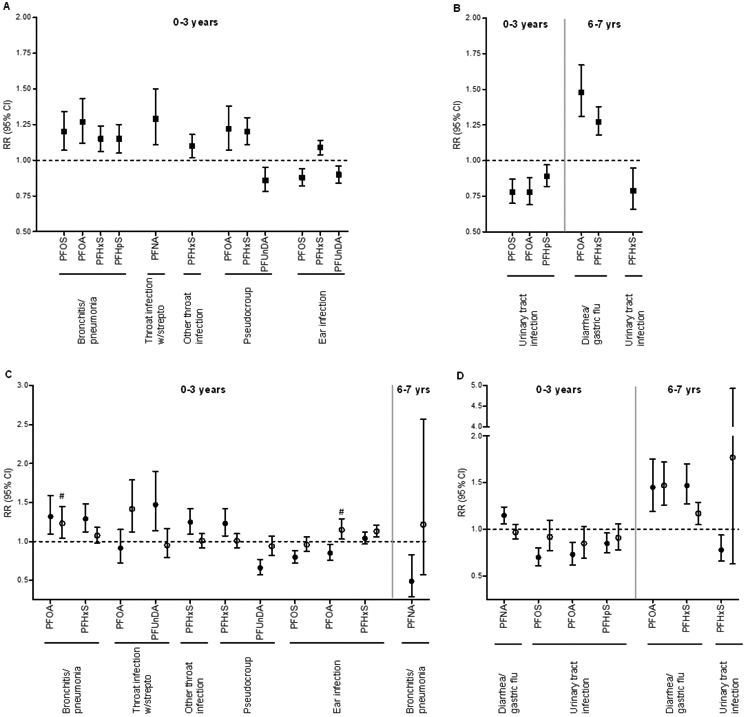
Parent-reported common infectious diseases by 3 and 7 years of age with significant exposure-outcome associations after FDR correction (p≤0.050). A and B show results for the whole cohort for airways and other infections, respectively. C and D show statistically significant results with gender stratified analysis (p≤0.050) for airways and other infections, respectively. Closed squares: main effect in the whole cohort; closed circles: girls; open circles: boys. #: p>0.05 after FDR.
Between ages 0 and 3, common cold was inversely associated with PFOS and PFOA (Table 5C). After stratifying by gender, these associations were significant in girls only (Supplement Table 3C).
Bronchitis/pneumonia was positively associated with PFOS, PFOA, PFHxS and PFHpS between age 0 and 3 years (Figure 2A). The associations for PFOA and PFHxS were significant in girls only (Figure 2C). No significant associations were found between 6 and 7 years in the whole cohort, however, there was an inverse association with PFNA in girls after stratifying by gender (Figures 2C).
Between 0 and 3 years of age, throat infection with streptococcus were positively association with PFNA in the whole cohort, whereas a positive association with PFOA was found in boys and with PFUnDA in girls (Figure 2A and C, Supplement Table 3C). Other throat infections were positively associated with PFHxS in girls (Figure 2A and C, Supplemental Table 3C).
Both pseudocroup and ear infection showed inconsistent results. Pseudocroup was positively associated with PFOA and PFHxS and inversely associated with PFUnDA (Figure 2A). In the stratified analyses, PFOA was no longer significantly associated with pseudocroup but showed the same positive trend as in the analysis on the whole cohort (Figure 2C, Supplement Table 3C). Between 0 and 3 years of age, ear infection was positively associated with PFHxS and inversely associated with PFOS and PFUnDA (Figure 2A). PFOS and PFOA was inversely associated in girls only (Figure 2C). No associations were observed between PFAS concentrations and ear infections at age 6 to 7 years (Table 5C).
Between the age 0 to 3 years, no associations were observed for gastric flu in the whole cohort (Table 5C). However, stratified by gender, there was a positive association with PFNA in girls (Figure 2D). Between 6 and 7 years of age, diarrhea/gastric flu was positively associated with PFOA and PFHxS, whereas no differences were found between gender (Figure 2B and D, Supplement Table 3C). Urinary tract infection between 0 and 3 years of age was inversely associated with PFOS, PFOA and PFHpS (Figure 2B; Table 5C). After stratifying on gender, these associations were significant in girls only (Figure 2D). Between 6 and 7 years of age, urinary tract infection was inversely associated with PFHxS in girls (Figures 2B and D).
When stratified by nursery attendance at age 3 years, there were significantly differences in number of episodes of common cold, throat infections with streptococcus, pseudocroup and diarrhea/gastric flu between age 0 to 3 years in the nursery group compared to the no nursery group (Supplement Table 4). In the sensitivity analyses based on nursery attendance, there were no group differences when it comes to PFOS and common cold. Whereas the association observed for PFOA in the whole cohort, was no longer significant in the stratified analysis (Supplement Table 5). With regard to throat infections with streptococcus, there were significant findings in the nursery group for PFNA and PFUnDA only. In addition there was an inverse association with PFOS in the no nursery group (Supplement Table 5). For pseudocroup, there where group differences with respect to PFOA and PFHxS with a positive association with pseudocroup in children not attending nursery, whereas it was an inverse association between pseudocroup and PFUnDA in children attending nursery. No significant associations were found between PFASs and diarrhea/gastric flu between age 0 and 3 years in the whole cohort. However in the sensitivity analyses based on nursery attendance, there was an inverse association for PFOS in the no nursery group and a positive association for PFNA in the nursery group (Supplement Table 5).
Weighted analyses with inverted probability weights (IPW) had few differences compared to the analyses with no weights as three more associations became statically significant after weighting (Supplement Tables 6A-C). These associations were atopic eczema and PFUnDA, common cold and PFOA, and pseudocroup and PFUnDA. Cohort and case/control status were additionally used as a covariate to model the possible effect of selection. There were no differences in the statistically significant results (Supplement Table 7).
Discussion
In the present study, no statistically significant associations were found between prenatal exposure to PFASs and the doctor-diagnosed outcomes food allergy, inhaled allergy (rhinitis) and asthma at age 7 years, while prenatal exposure to PFUnDA was inversely related to atopic eczema in girls. In a previously published study using another MoBa sub-cohort (BraMat), no associations were found between prenatal PFAS exposures and doctor-diagnosed asthma or atopic eczema until 3 years og age (Granum et al. 2013). Even though both studies originate from MoBa, there are some important differences between the two sub-cohorts. BraMat was considerably smaller than in the present study (n=99), information on health outcomes were collected annually until age 3 years using study-specific questionnaires, and fewer PFASs were used in the statistical analyses (e.g. PFUnDA was not included). Results from these two MoBa sub-cohorts may, therefore, not be directly comparable.
When it comes to doctor-diagnosed eczema, the finding from the present study is in line with findings from the Japanese Hokkaido Study where inverse associations were found between PFUnDa and PFTrDA and eczema in girls at age two years (Okada et al. 2014), and between PFDoDA and PFTrDA and total allergic disease (having at least one of the following outcomes: eczema, wheezing and rhinoconjunctivitis) in four year old children (Goudarzi et al. 2016). Birth-cohort studies from Norway (Granum et al. 2013; Impinen et al. 2018), Taiwan (Wang et al. 2011), Japan (Okada et al. 2012) and Greenland/Ukraine (Smit et al. 2015) have reported no associations between prenatal PFASs and eczema. Inverse relationships between PFASs and eczema have only been reported for long-chain PFASs (PFUnDA, PFDoDA and PFTrDA with 11, 12 and 13 carbons, respectively), whereas no associations have been reported for PFASs with a chain-length of 9 carbons or less. This may imply that prenatal exposure to long-chain PFASs may be more important with regard to eczema compared to the PFASs with shorter carbon chains.
With regard to food allergy and rhinitis no associations were found in the present study, in line with previous studies in Japanese or Norwegian children (Okada et al. 2012) (Impinen et al. 2018; Okada et al. 2014). Likewise, no associations between prenatal exposure to PFASs and asthma were found in children from Norway (Granum et al. 2013; Impinen et al. 2018) and Greenland/Ukraine (Smit et al. 2015).
To our knowledge, we are the first to study the association between PFAS exposure and coughing at night, hives, itchy rash, itchy runny eyes and runny nose (i.e. symptoms that can reflect asthma and allergic diseases). None of these parent-reported symptoms at seven years of age showed statistically significant associations with prenatal exposure to PFASs. Sensitivity analyses based on gender did not affect the conclusions. When it comes to wheeze, there was an inverse relation between PFUnDA and current and ever wheeze before the FDR correction, but in boys only. Interestingly, we observed a similar inverse relation between PFUnDA and current and ever asthma before FDR correction in the whole cohort. This common effect of PFUnDA on the association of both wheeze and asthma may indicate a suppressive effect on asthma. An inverse relation between PFASs (expressed as a principle component dominated by PFOA and PFOS) and current wheeze was also reported in a birth cohort with children from Ukraine and Greenland, with significant findings in the Ukraine cohort only (Smit et al. 2015). Furthermore, in the Hokkaido Study an inverse relationship was found between PFDoDA and PFTrDA and total allergic disease defined as having at least one of the following outcomes: eczema, wheezing and rhinoconjunctivitis (Goudarzi et al. 2016). Even though these studies provide some evidence of an inverse relation between prenatal PFAS exposure and wheeze, there are also studies reporting no associations (Granum et al. 2013; Okada et al. 2014; Okada et al. 2012). Thus more data is needed to conclude on possible effects of prenatal PFAS exposure on wheeze in childhood.
While sparse associations were observed between prenatal PFAS exposures and the asthma and allergy related outcomes, 19 associations remained (after FDR correction) between PFASs and the number of episodes of common childhood infections from 0 to 3 years of age and from 6 to 7 years of age. With regard to the associations between PFOS and PFOA and common cold up to age three years, the RR’s were close to one (0.95-0.96). Thus, the biological relevance of these findings is uncertain. For the other associations, the direction of the effect appeared to vary between different groups of infectious diseases. From 0 to 3 years of age positive associations were found between bronchitis and/or pneumonia and PFOS, PFOA, PFHxS, and PFHpS, between throat infection with streptococcus and PFNA, between other throat infection and PFHxS, between pseudocroup and PFOA and PFHxS, and between ear infection and PFHxS. Inverse associations were found between pseudocroup and PFUnDA, ear infection and PFOS and PFUnDA, and urinary tract infection with PFOS, PFOA and PFHpS. An inverse association between urinary tract infection and PFHxS were also found from 6 to 7 year of age. Finally, there were positive associations between PFOA and PFNA and gastric flu/diarrhea from age 6 to 7 years.
Our findings on bronchitis/pneumonia and throat infections (with or without streptococcus) are consistent with previous Norwegian reports on prenatal exposure to PFASs and airways infections in childhood in that there were positive associations between PFASs and common cold in children at age three years in the MoBa sub-cohort BraMat (Granum et al. 2013), and positive associations between PFASs and common cold at age two years, and lower respiratory tract infections at age 10 years in the ECA study (Impinen et al. 2018). These findings are consistent and indicate that prenatal exposure to PFASs may have immunosuppressive effect with respect to these airways infections during childhood.
The results with respect to pseudocroup and ear infections were inconsistent. With regard to pseudocroup, a positive relation were found for PFHxS and PFOA and an inverse relation for PFUnDA. When stratified on gender, the associations for PFHxS and PFUnDA were observed in girls only. Since pseudocroup is an infectious disease with an inflammation in the area of the larynx and the vocal cords, it would be expected to observe similar effects of PFASs on both pseudocroup and throat infections. No associations were observed between PFAS exposure and ear infections when the children were 7 years old, while several associations were found at age three years. Ear infections were positively associated with PFHxS (boys only), and inversely associated with PFOS and PFOA (both in girls) and PFUnDA. There are two previous studies on ear infection (otitis media), both reporting no associations with prenatal PFAS exposure; in Japanese children until age 18 months and in Norwegian children until age three years (Granum et al. 2013; Okada et al. 2012). Compared to the present study, these two studies were smaller and the prevalence of ear infections were lower (Japanese study: 61/343 [18%]; Norwegian study: 27/99 [37%]; present study: 576/1270 [47%]). Thus, one possible reason for the inconsistent results could be differences in statistical power. The results on ear infections in the present study indicate that there may be an effect of prenatal PFAS exposure on ear infections in early childhood. However, due to the inconsistent findings regarding both pseudocroup and ear infections, more studies are needed to further elucidate possible effects of prenatal exposure to PFASs on these infectious diseases.
When it comes to the infectious diseases not related to the airways, the present study supports previous findings made in the MoBa cohort on a positive association between prenatal PFAS exposure and diahhrea/gastric flu (Granum et al. 2013). Urinary tract infection has, to our knowledge, not previously been studied in relation to PFAS exposure. Urinary tract infections was the only infectious disease that were consistently associated with a reduced number of episodes of disease, but in girls only. Infectious diseases can be divided into contagious and non-contagious. it is interesting that the rate ratio is reduced in the only purely non-contagious infection included in the present study, i.e. urinary tract infections. Furthermore, even though ear infections in many cases follow contagious diseases, such as common cold or throat infections, this disease may also occur without contact with a carrier of infection. Thus, we speculate that our results indicate a reduced risk of non-contagious infectious disease with increased prenatal exposure to PFASs.
The majority of the findings with respect to infectious diseases were found in girls only indicating a gender difference in the effect of PFASs on these diseases. The same gender effect was also seen for eczema. This implies that it is important to perform statistical analyses stratified by gender, and the size of the present study is thus one of the strengths compared to a number of previous studies.
Children attending a nursery are more likely to get contagious diseases compared to other children. Thus, nursery attendance can be an important effect modifier when analyzing possible effects of prenatal PFAS exposure on development of infectious diseases. There were significantly higher number of episodes (0-3 years) of common cold, throat infections with streptococcus and diarrhea/gastric flu in children attending a nursery at three years of age compared to the other children, while there were less episodes of pseudocroup in children attending nursery. Sensitivity analyses based on nursery attendance were therefore performed. No group differences were observed for the association between PFAS exposures and common cold. There was a significant positive association between throat infections with streptococcus and PFNA in the whole cohort, but this association were positive only for children attending nursery. Even though not being significant when analyzing the whole cohort, PFUnDA and PFNA were positively associated with throat infections with streptococcus and diahrrea/gastric flu, respectively, for children attending a nursery. Whereas, for children not attending nursery, PFOS were inversely related to both outcomes. With regard to pseudocroup, the positive associations seen in the whole cohort for PFOA and PFHxS were, in the sensitivity analyses, significant only in children not attending nursery. While PFUnDA were inversely related to pseudocroup in children attending nursery only. These findings indicate that for some PFAS-outcome associations, nursery attendance may be an effect modifier, possibly due to the higher infection pressure. However, all associations observed were in the same direction as in the whole population. It should be noted that as many as 84.5% of the children attended a nursery at three years of age. The results from the sensitivity analyses may, therefore, also be affected by the differences in the number of children included in the two groups. Likewise, other children living in the household may also be an important factor with regard to getting contagious diseases. However, in the present study, no statistically significant differences in the number of episodes of the contagious diseases were found between children with or without other children living in the household (results not shown).
Possible weaknesses of our study were the loss to follow-up and reliance on questionnaire-based outcomes. For the doctor diagnosed allergic conditions we did not require objective allergy testing nor did we require bronchial responsiveness testing for asthma at age seven years. However, the present asthma and allergic outcomes are frequently used in large population as well as genetic studies (Demenais et al. 2018). Further, when evaluating the seven year questionnaire reports of asthma medication use reported by MoBa parents, there was a high concordance between parent-reported use of asthma medication and dispensing of asthma medications in the Norwegian Prescription Drug Registry (Furu et al. 2011). The number of infection episodes may be difficult to estimate and recall for parents. Further, it is possible that a single illness episode could be reported with more than one of the infection symptoms making counting of episodes more uncertain. Bronchitis, RSV and pneumonia may have different disease severities. However, in the MoBa questionnaires these infectious diseases are all included in the same question. Thus, these outcomes cannot be re-categorized into separate diseases outcomes. We had substantial loss to follow-up at age seven. However, we attempted to control the possible bias by performing analysis with inverse probability weighting to adjust for the effects of drop-out from follow-up; this adjustment had a relatively minor effect on the results. Reassuringly, with linkage to the Norwegian Prescription Drug Registry, the rate of dispensing of asthma medications was very similar among respondents and non-respondents to the seven year questionnaire (Furu et al. 2011), suggesting minimal differential loss to follow up dependent on asthma status. Finally, with less than 2000 individuals included in the study, our study was most likely underpowered to identify weak associations with the less frequent outcomes. Some strengths of our study were the 7-year follow-up time, the relatively large number of participants compared with other studies, that a high number of PFASs were assessed also including the ones currently on a rise in the environment and the wide range of outcomes considered.
Conclusion
Except for an inverse relationship between PFUnDA and eczema in girls, our results give little support for an association between prenatal PFAS exposures and allergy related outcomes. PFUnDA also tended to be inversely associated with both wheeze and asthma, indicating an immunosuppressive effect. Our results further suggest immunosuppressive effects of PFASs on airways infections, such as bronchitis/pneumonia and throat infections, as well as diarrhea/gastric flu. However, prenatal PFAS exposure was inversely related to the non-contagious disease urinary tract infection. Our results indicate a possible role of gender in the PFAS-health outcome associations.
Supplementary Material
Table 4B.
Prevalence of asthma and allergy related symptoms at 7 years
| N=972 | Current | Ever | ||
|---|---|---|---|---|
| Yes, n | Yes, % | Yes, n | Yes, % | |
| Nightly cough | 90 | 9 | 153 | 16 |
| Wheeze | 67 | 7 | 179 | 19 |
| Hives | 39 | 4 | 71 | 8 |
| Itchy rash | 57 | 6 | 91 | 10 |
| Ithcy/runny eyes | 69 | 7 | 93 | 10 |
| Runny nose | 62 | 6 | 84 | 9 |
Highlights.
An inverse association between maternal PFUnDA and eczema in the children was found.
Prenatal PFUnDA exposure tended to be inversely associated with wheeze and asthma.
Prenatal PFAS exposure may cause increased risk of airways infections in childhood.
Prenatal PFAS exposure may cause increased risk of gastric flu in childhood.
Gender may play a role in the PFAS-health outcome associations.
Footnotes
Competing financial interests
While this manuscript was being prepared, MPL was working part-time at Ramboll, with support from 3 M. The work on this manuscript was done solely with NIEHS support (MPL as a government contractor). Each author certifies that their freedom to design, conduct, interpret, and publish research was not compromised by any sponsor.
References
- Apelberg BJ; Witter FR; Herbstman JB; Calafat AM; Halden RU; Needham LL; Goldman LR Cord serum concentrations of perfluorooctane sulfonate (PFOS) and perfluorooctanoate (PFOA) in relation to weight and size at birth. Environ Health Perspect 2007;115:1670–1676 [DOI] [PMC free article] [PubMed] [Google Scholar]
- Dalsager L; Christensen N; Husby S; Kyhl H; Nielsen F; Host A; Grandjean P; Jensen TK Association between prenatal exposure to perfluorinated compounds and symptoms of infections at age 1-4years among 359 children in the Odense Child Cohort. Environment international 2016;96:58–64 [DOI] [PubMed] [Google Scholar]
- Demenais F; Margaritte-Jeannin P; Barnes KC; Cookson WOC; Altmuller J; Ang W; Barr RG; Beaty TH; Becker AB; Beilby J; Bisgaard H; Bjornsdottir US; Bleecker E; Bonnelykke K; Boomsma DI; Bouzigon E; Brightling CE; Brossard M; Brusselle GG; Burchard E; Burkart KM; Bush A; Chan-Yeung M; Chung KF; Couto Alves A; Curtin JA; Custovic A; Daley D; de Jongste JC; Del-Rio-Navarro BE; Donohue KM; Duijts L; Eng C; Eriksson JG; Farrall M; Fedorova Y; Feenstra B; Ferreira MA; Freidin MB; Gajdos Z; Gauderman J; Gehring U; Geller F; Genuneit J; Gharib SA; Gilliland F; Granell R; Graves PE; Gudbjartsson DF; Haahtela T; Heckbert SR; Heederik D; Heinrich J; Heliovaara M; Henderson J; Himes BE; Hirose H; Hirschhorn JN; Hofman A; Holt P; Hottenga J; Hudson TJ; Hui J; Imboden M; Ivanov V; Jaddoe VWV; James A; Janson C; Jarvelin MR; Jarvis D; Jones G; Jonsdottir I; Jousilahti P; Kabesch M; Kahonen M; Kantor DB; Karunas AS; Khusnutdinova E; Koppelman GH; Kozyrskyj AL; Kreiner E; Kubo M; Kumar R; Kumar A; Kuokkanen M; Lahousse L; Laitinen T; Laprise C; Lathrop M; Lau S; Lee YA; Lehtimaki T; Letort S; Levin AM; Li G; Liang L; Loehr LR; London SJ; Loth DW; Manichaikul A; Marenholz I; Martinez FJ; Matheson MC; Mathias RA; Matsumoto K; Mbarek H; McArdle WL; Melbye M; Melen E; Meyers D; Michel S; Mohamdi H; Musk AW; Myers RA; Nieuwenhuis MAE; Noguchi E; O'Connor GT; Ogorodova LM; Palmer CD; Palotie A; Park JE; Pennell CE; Pershagen G; Polonikov A; Postma DS; Probst-Hensch N; Puzyrev VP; Raby BA; Raitakari OT; Ramasamy A; Rich SS; Robertson CF; Romieu I; Salam MT; Salomaa V; Schlunssen V; Scott R; Selivanova PA; Sigsgaard T; Simpson A; Siroux V; Smith LJ; Solodilova M; Standl M; Stefansson K; Strachan DP; Stricker BH; Takahashi A; Thompson PJ; Thorleifsson G; Thorsteinsdottir U; Tiesler CMT; Torgerson DG; Tsunoda T; Uitterlinden AG; van der Valk RJP; Vaysse A; Vedantam S; von Berg A; von Mutius E; Vonk JM; Waage J; Wareham NJ; Weiss ST; White WB; Wickman M; Widen E; Willemsen G; Williams LK; Wouters IM; Yang JJ; Zhao JH; Moffatt MF; Ober C; Nicolae DL Multiancestry association study identifies new asthma risk loci that colocalize with immune-cell enhancer marks. Nat Genet 2018;50:42–53 [DOI] [PMC free article] [PubMed] [Google Scholar]
- DeWitt JC; Peden-Adams MM; Keller JM; Germolec DR Immunotoxicity of perfluorinated compounds: recent developments. Toxicol Pathol 2012;40:300–311 [DOI] [PubMed] [Google Scholar]
- Fei C; McLaughlin JK; Lipworth L; Olsen J Prenatal exposure to PFOA and PFOS and risk of hospitalization for infectious diseases in early childhood. Environ Res 2010;110:773–777 [DOI] [PubMed] [Google Scholar]
- Fromme H; Tittlemier SA; Volkel W; Wilhelm M; Twardella D Perfluorinated compounds--exposure assessment for the general population in Western countries. Int J Hyg Environ Health 2009;212:239–270 [DOI] [PubMed] [Google Scholar]
- Furu K; Karlstad O; Skurtveit S; Haberg SE; Nafstad P; London SJ; Nystad W High validity of mother-reported use of antiasthmatics among children: a comparison with a population-based prescription database. J Clin Epidemiol 2011;64:878–884 [DOI] [PMC free article] [PubMed] [Google Scholar]
- Goudarzi H; Miyashita C; Okada E; Kashino I; Chen CJ; Ito S; Araki A; Kobayashi S; Matsuura H; Kishi R Prenatal exposure to perfluoroalkyl acids and prevalence of infectious diseases up to 4years of age. Environment international 2017;104:132–138 [DOI] [PubMed] [Google Scholar]
- Goudarzi H; Miyashita C; Okada E; Kashino I; Kobayashi S; Chen CJ; Ito S; Araki A; Matsuura H; Ito YM; Kishi R Effects of prenatal exposure to perfluoroalkyl acids on prevalence ofallergic diseases among 4-year-old children. Environment international 2016;94:124–132 [DOI] [PubMed] [Google Scholar]
- Grandjean P; Andersen EW; Budtz-Jorgensen E; Nielsen F; Molbak K; Weihe P; Heilmann C Serum vaccine antibody concentrations in children exposed to perfluorinated compounds. Jama 2012;307:391–397 [DOI] [PMC free article] [PubMed] [Google Scholar]
- Granum B; Haug LS; Namork E; Stolevik SB; Thomsen C; Aaberge IS; van Loveren H; Lovik M; Nygaard UC Pre-natal exposure to perfluoroalkyl substances may be associated with altered vaccine antibody levels and immune-related health outcomes in early childhood. J Immunotoxicol 2013;10:373–379 [DOI] [PubMed] [Google Scholar]
- Gutzkow KB; Haug LS; Thomsen C; Sabaredzovic A; Becher G; Brunborg G Placental transfer of perfluorinated compounds is selective--a Norwegian Mother and Child sub-cohort study. Int J Hyg Environ Health 2012;215:216–219 [DOI] [PubMed] [Google Scholar]
- Haug LS; Huber S; Becher G; Thomsen C Characterisation of human exposure pathways to perfluorinated compounds--comparing exposure estimates with biomarkers of exposure. Environment international 2011a;37:687–693 [DOI] [PubMed] [Google Scholar]
- Haug LS; Huber S; Schlabach M; Becher G; Thomsen C Investigation on per- and polyfluorinated compounds in paired samples of house dust and indoor air from Norwegian homes. Environ Sci Technol 2011b;45:7991–7998 [DOI] [PubMed] [Google Scholar]
- Haug LS; Thomsen C; Becher G A sensitive method for determination of a broad range of perfluorinated compounds in serum suitable for large-scale human biomonitoring. J Chromatogr A 2009;1216:385–393 [DOI] [PubMed] [Google Scholar]
- Haug LS; Thomsen C; Brantsaeter AL; Kvalem HE; Haugen M; Becher G; Alexander J; Meltzer HM; Knutsen HK Diet and particularly seafood are major sources of perfluorinated compounds in humans. Environment international 2010;36:772–778 [DOI] [PubMed] [Google Scholar]
- Hernan MA; Hernandez-Diaz S; Robins JM A structural approach to selection bias. Epidemiology 2004;15:615–625 [DOI] [PubMed] [Google Scholar]
- Houde M; Martin JW; Letcher RJ; Solomon KR; Muir DC Biological monitoring of polyfluoroalkyl substances: A review. Environ Sci Technol 2006;40:3463–3473 [DOI] [PubMed] [Google Scholar]
- Impinen A; Nygaard UC; Lodrup Carlsen KC; Mowinckel P; Carlsen KH; Haug LS; Granum B Prenatal exposure to perfluoralkyl substances (PFASs) associated with respiratory tract infections but not allergy- and asthma-related health outcomes in childhood. Environ Res 2018;160:518–523 [DOI] [PubMed] [Google Scholar]
- Kotthoff M; Muller J; Jurling H; Schlummer M; Fiedler D Perfluoroalkyl and polyfluoroalkyl substances in consumer products. Environ Sci Pollut Res Int 2015;22:14546–14559 [DOI] [PMC free article] [PubMed] [Google Scholar]
- Lau C; Anitole K; Hodes C; Lai D; Pfahles-Hutchens A; Seed J Perfluoroalkyl acids: a review of monitoring and toxicological findings. Toxicol Sci 2007;99:366–394 [DOI] [PubMed] [Google Scholar]
- Magnus P; Birke C; Vejrup K; Haugan A; Alsaker E; Daltveit AK; Handal M; Haugen M; Hoiseth G; Knudsen GP; Paltiel L; Schreuder P; Tambs K; Vold L; Stoltenberg C Cohort Profile Update: The Norwegian Mother and Child Cohort Study (MoBa). Int J Epidemiol 2016;45:382–388 [DOI] [PubMed] [Google Scholar]
- Magnus P; Irgens LM; Haug K; Nystad W; Skjaerven R; Stoltenberg C Cohort profile: the Norwegian Mother and Child Cohort Study (MoBa). Int J Epidemiol 2006;35:1146–1150 [DOI] [PubMed] [Google Scholar]
- Okada E; Sasaki S; Kashino I; Matsuura H; Miyashita C; Kobayashi S; Itoh K; Ikeno T; Tamakoshi A; Kishi R Prenatal exposure to perfluoroalkyl acids and allergic diseases in early childhood. Environment international 2014;65:127–134 [DOI] [PubMed] [Google Scholar]
- Okada E; Sasaki S; Saijo Y; Washino N; Miyashita C; Kobayashi S; Konishi K; Ito YM; Ito R; Nakata A; Iwasaki Y; Saito K; Nakazawa H; Kishi R Prenatal exposure to perfluorinated chemicals and relationship with allergies and infectious diseases in infants. Environ Res 2012;112:118–125 [DOI] [PubMed] [Google Scholar]
- Paltiel L; Haugan A; Skjerden T; Harbak K; Bækken S; Stensrud NK; Knudsen GP; Magnus P The biobank of the Norwegian Mother and Child Cohort Study – present status. Nor J Epidemiol 2014;24:29–35 [Google Scholar]
- Smit LA; Lenters V; Hoyer BB; Lindh CH; Pedersen HS; Liermontova I; Jonsson BA; Piersma AH; Bonde JP; Toft G; Vermeulen R; Heederik D Prenatal exposure to environmental chemical contaminants and asthma and eczema in school-age children. Allergy 2015;70:653–660 [DOI] [PubMed] [Google Scholar]
- Starling AP; Engel SM; Richardson DB; Baird DD; Haug LS; Stuebe AM; Klungsoyr K; Harmon Q; Becher G; Thomsen C; Sabaredzovic A; Eggesbo M; Hoppin JA; Travlos GS; Wilson RE; Trogstad LI; Magnus P; Longnecker MP Perfluoroalkyl substances during pregnancy and validated preeclampsia among nulliparous women in the Norwegian Mother and Child Cohort Study. Am J Epidemiol 2014;179:824–833 [DOI] [PMC free article] [PubMed] [Google Scholar]
- Thomsen C; Haug LS; Stigum H; Froshaug M; Broadwell SL; Becher G Changes in concentrations of perfluorinated compounds, polybrominated diphenyl ethers, and polychlorinated biphenyls in Norwegian breast-milk during twelve months of lactation. Environ Sci Technol 2010;44:9550–9556 [DOI] [PubMed] [Google Scholar]
- Vestergren R; Cousins IT Tracking the pathways of human exposure to perfluorocarboxylates. Environ Sci Technol 2009;43:5565–5575 [DOI] [PubMed] [Google Scholar]
- Wang IJ; Hsieh WS; Chen CY; Fletcher T; Lien GW; Chiang HL; Chiang CF; Wu TN; Chen PC The effect of prenatal perfluorinated chemicals exposures on pediatric atopy. Environ Res 2011;111:785–791 [DOI] [PubMed] [Google Scholar]
- Whitworth KW; Haug LS; Baird DD; Becher G; Hoppin JA; Skjaerven R; Thomsen C; Eggesbo M; Travlos G; Wilson R; Longnecker MP Perfluorinated compounds and subfecundity in pregnant women. Epidemiology 2012;23:257–263 [DOI] [PMC free article] [PubMed] [Google Scholar]
Associated Data
This section collects any data citations, data availability statements, or supplementary materials included in this article.