Abstract
Background
Necrotizing pneumonia (NP) is an infrequent but severe complication of pneumonia in children. In the early stages of NP, CT imaging shows lung consolidation, which cannot be detected in time. This study aimed to explore the ability of non-contrast-enhanced CT radiomics features to recognize NP in early stage.
Methods
This was a retrospective study, and 250 patients who presented with lung consolidation on initial CT images were included in this study. After a follow-up period of 1–3 weeks, 116 patients developed NP, whose CT or X-ray shows cavitation or liquefied necrosis. Manual segmentation of lesion sites in the initial non-contrast-enhanced CT scans was performed with RadCloud (Huiying Medical Technology Co., Ltd., China), and 1,409 radiomics features were extracted. We used Variance threshold (0.8), SelectKBest, and the least absolute shrinkage and selection operator (LASSO) methods for feature dimension reduction. Three machine learning algorithms, k-nearest neighbor (KNN), support vector machine (SVM), and logistic regression (LR) models, were established to recognize NP early. To assess the recognition performance, the area under the receiver operating characteristic curve (AUC), sensitivity, specificity, and other indicators were used in the validation cohort.
Results
Radiomics features helped to recognize NP in early stage in both the training and validation cohorts. The AUC (sensitivity, specificity) for the training and validation cohorts were 0.81 (0.73, 0.68) and 0.71 (0.61, 0.65) for KNN, respectively; 0.81 (0.72, 0.70) and 0.77 (0.66, 0.65) for SVM, respectively; and 0.82 (0.73, 0.73) and 0.76 (0.63, 0.70) for LR, respectively. Recall and F1-scores determined that LR performed better at diagnosing early NP, with the values of the above two indexes being 0.70 and 0.67, respectively.
Conclusions
Non-contrast-enhanced CT-based radiomics models may be helpful for recognizing NP in early stage.
Keywords: Necrotizing pneumonia (NP), children, radiomics, machine learning
Introduction
Necrotizing pneumonia (NP) is a serious complication of community-acquired pneumonia and may cause necrosis and destruction of the lung parenchyma in children (1). While NP in children is a rare complication, its incidence is increasing (2). In the United States, 0.8–7% of children develop NP in tertiary centers (3). Although the condition is serious, a full recovery and good prognosis can be achieved if NP is detected and treated early. As the clinical features of NP are similar to those of simple pneumonia (SP) (2), routine tests do not provide an accurate diagnosis. Currently, chest computed tomography (CT) is the most sensitive method for the diagnosis of NP, and is characterized by destruction of lung parenchyma, loss of parenchymal enhancement, and multiple thin-walled cavities (1,3). In the early stage of lung necrosis, the density shown in plain scan images is similar to the real lung lesions, so it cannot be detected in time (4). If the consolidation area of the lung is loss of parenchymal enhancement after injection of iodine in contrast-enhanced CT, which can help for recognizing NP in early stage, but this increases the radiation dose required (1). If plain CT data can be used to recognize lung necrosis in early stage in children, this will allow for timely clinical decisions to be made regarding therapeutic options without increasing a child’s exposure to radiation.
Radiomics is a field of medicine that utilizes characterization algorithms to allow analysis of many quantitative image features from medical images (5). Radiomics signatures have been proven to reflect tissue heterogeneity (6-9). Radiology has been widely used in the diagnosis of tumors and the prediction of tumor grades, metastasis, and prognosis (10-13). CT-based radiomics have been used for predicting the spread through air spaces in lung adenocarcinoma and response to immunotherapy (14,15). Machine-learning radiomics have been used for predicting early recurrence in perihilar cholangiocarcinoma after curative resection (16). The purpose of this study was to recognize pulmonary necrosis in early stage in children with pulmonary consolidation based on radiographic features observed on non-enhanced CT scans. We present the following article in accordance with the TRIPOD reporting checklist (available at http://dx.doi.org/10.21037/tp-20-241).
Methods
Patients
The study was conducted in accordance with the Declaration of Helsinki (as revised in 2013). The study was approved by the Ethics Committee of the Children’s Hospital Affiliated with Chongqing Medical University (NO.: 20190218) and individual consent for this retrospective analysis was waived.
In total, 303 patients with histologically confirmed pneumonia consolidation between April 2009 and December 2019 were involved.
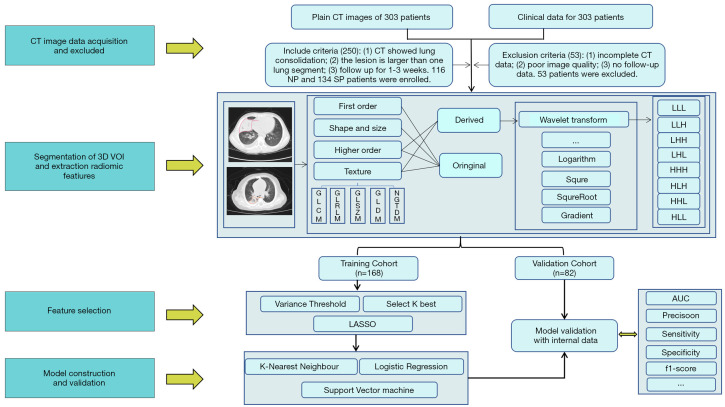
Patients were deemed eligible for in this study if their initial CT scans showed consolidation range larger than 1 pulmonary segment and if they were followed up over a 1–3-week period to monitor for necrosis with CT or X ray (Figure 1). The diagnosis of NP include the loss of normal parenchymal architecture, decreased parenchymal enhancement, air filled cavities (2). Patients who had incomplete CT scan data or poor-quality images were excluded from the study. Two hundred and fifty patients were finally enrolled in this study. There were 116 cases of NP and 134 cases of SP. The clinical and histopathological characteristics of the patients included are shown in Table 1.
Figure 1.
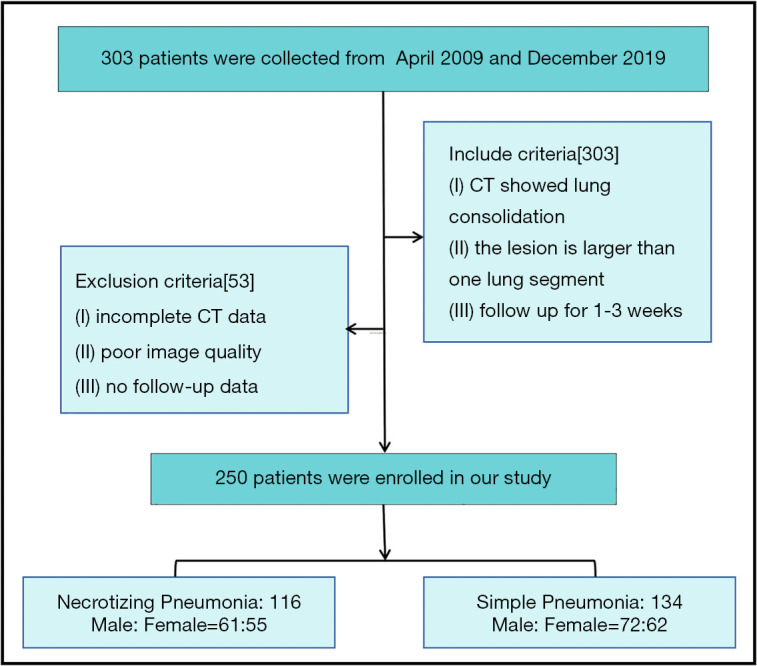
The flowchart of the inclusion of study subjects.
Table 1. The clinical and histopathological characteristics of the patients.
| Group | Necrotizing pneumonia | Simple pneumonia | P value |
|---|---|---|---|
| Number | 116 | 134 | |
| Age (mean ± SD) | 1.47±0.50 | 1.46±0.50 | 0.83 |
| Sex | 0.86 | ||
| M | 61 | 72 | |
| F | 55 | 62 |
SD, standard deviation.
CT acquisition
The CT scan was performed using a 64-detector CT scanner (GE Lightspeed VCT 64, Philips Medical Systems, Amsterdam, the Netherlands) or a 128-detector CT scanner (Brilliance ICT, Philips Medical Systems). A tube voltage of 80–120 kV was applied with the tube current being automatically regulated. A collimation of 0.6 mm was used, and images with a slice thickness of 5 mm with a gap of 1 mm were reconstructed using a standard reconstruction algorithm. Digital Imaging and Communications in Medicine (DICOME) images were downloaded from the picture archiving and communication system (PACS). Data were randomly divided into training and validation cohorts at a ratio of 3.3:6.7, and 74 random seeds were used.
Image pre-processing, segmentation, and extraction of radiomics features
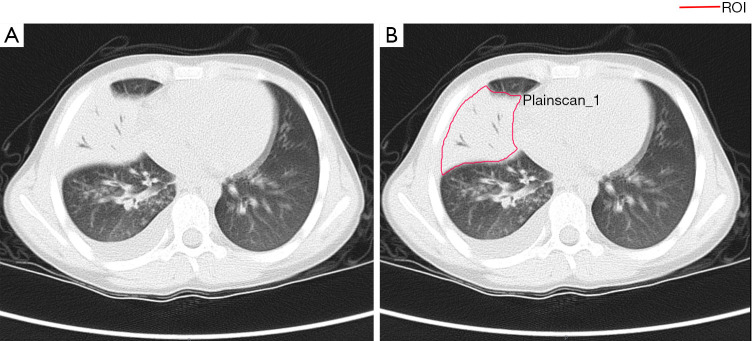
Radiomics was adopted to acquire knowledge from high-dimensional data. Radiomics features of each patient were extracted from plain CT images using the Pyradiomics v.2.1.2 package. Preprocessing of the images before feature extraction by a radiologist. The normalization of the images was centered on the mean standard deviation. The radiomics workflow was presented in Figure 2. CT images were centrally managed in Radcloud software. A radiologist (with 9-year experience). The regions of interest (ROIs) for each slice, covering the whole lesion, were manually delineated by a radiologist (with 9-year experience in thoracic radiology), Which were supervised by a radiologist (with 23-year experience). A sample of the manual voxel of interest (VOI) drawing is presented in Figure 3.
Figure 2.
Radiomics workflow and study flowchart.
Figure 3.
A sample of manually segmenting and contouring ROIs. (A) An original image showing lung consolidation. (B) The region of interest (ROI) of a manual sketch in the lung consolidation image.
Based on the delineated ROIs in CT images, 1,409 features were automatically extracted which could be divided into 4 categories: (I) first-order statistics, which mainly describe the distribution of voxel intensity in CT images; (II) shape-and size-based features; (III) texture features, which including gray-level dependence matrix (GLDM) features, gray-level run-length matrix (GLRLM) features, neighborhood gray difference matrix features, gray-level size zone matrix (GLSZM) features, and textural features that could quantify regional heterogeneity differences; (IV) higher-order statistics features, which were obtained by filter transformation of the original image. The filters used in this study include exponential, square, square root, logarithm, gradient, Ibp-2D, and wavelet.
Feature selection
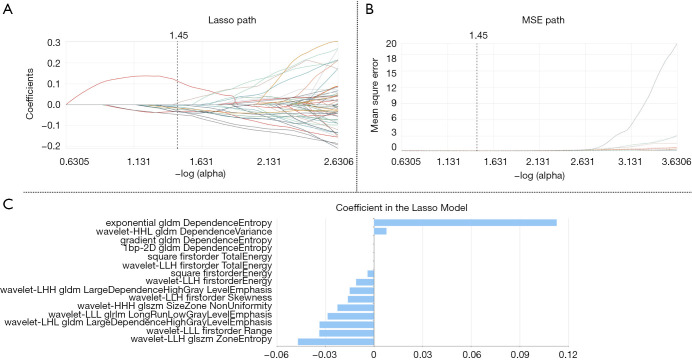
As described above, thousands of image features were obtained. However, the inclusion of too many features would have affected the recognition performance of the model, as the complexity of the model would be increased and multicollinearity would occur. Therefore, it was necessary to select the best feature set for the subsequent data analysis process. In our study, using the variance threshold, SelectKBest, and the least absolute shrinkage and selection operator (LASSO) methods were used to reduce redundant features. The variance threshold method removed the feature of variances of less than 0.8, while SelectKBest retained the features with P values of less than 0.05 in the univariate test. Finally, features with non-zero coefficients are selected using Lasso, which used an L1 regularizer as the cost function, 10 cross-validations, and a maximum of 1,000 iterations. Finally, the 15 indicators most relevant to NP were selected as shown in Table 2.
Table 2. Table of selected radiomics features, including feature name, feature category and filter.
| Radiomic feature | Radiomic class | Filter | |
|---|---|---|---|
| DependenceEntropy | GLDM | Exponential | |
| DependenceEntropy | GLDM | Gradient | |
| DependenceEntropy | GLDM | lbp-2D | |
| DependenceVariance | GLDM | Wavelet-HHL | |
| LargeDependenceHighGrayLevelEmphasis | GLDM | Wavelet-LHL | |
| Energy | Firstorder | Square | |
| TotalEnergy | Firstorder | Square | |
| ZoneEntropy | GLSZM | Wavelet-LLH | |
| LongRunLowGrayLevelEmphasis | GLRLM | Wavelet-LLL | |
| Energy | Firstorder | Wavelet-LLH | |
| TotalEnergy | Firstorder | Wavelet-LLH | |
| Range | Firstorder | Wavelet-LLL | |
| SizeZoneNonUniformity | GLSZM | Wavelet-HHH | |
| LargeDependenceHighGrayLevelEmphasis | GLDM | Wavelet-LHH | |
| Skewness | Firstorder | Wavelet-LLH | |
GLDM, gray-level dependence matrix; GLSZM, gray-level size zone matrix; GLRLM, gray-level run-length matrix.
Statistical analysis
Continuous variables (such as age) were compared by t-test, while qualitative variables (such as gender) were analyzed by Chi-square test. A P value less than 0.05 indicated statistical significance. In machine learning, the training cohort (67%) was used to develop the radiomics models [k-nearest neighbor (KNN), support vector machine (SVM), and logistic regression (LR)] to recognize NP in early stage and SP. The validation cohort (33%) was only used to evaluate the model’s generalization ability. To assess the diagnosis performance, the receiver operating characteristic (ROC) curve method, namely, the AUC, was used both in the training and validation cohorts. Five indicators including area under the ROC curve (AUC), recall, specificity, accuracy, and F1-score were used to evaluate the performance of the classifier in this study. Among them, with recall (R) = true positive / (true positive + false negative), precision (P) = true positive / (true positive + false positive), F1-score = P × R × 2 / (P + R). All statistical analyses were performed in software R (version 4.0.3).
Results
Clinical characteristics
The patient clinical characteristics are shown in Table 1. The NP and SP groups showed no significant differences in clinical characteristics (P>0.05).
Extraction and selection of features
For feature selection, 453 out of 1,409 features were initially selected using the variance threshold method. Subsequently 297 features were identified with the SelectKBest method. Ultimately, 15 optimal features (Table 2) were selected with the LASSO algorithm (Figure 4).
Figure 4.
LASSO algorithm on feature selection. (A) The LASSO path describes the relationship between the regression coefficient of the independent variable and the LASSO penalty coefficient α. The best α value selected by model was 0.37. (B) The MSE path for LASSO training process. The dotted vertical line was plotted on the value selected in (A). (C) The optimal coefficients of 15 features selected by LASSO. LASSO parameters: cv [10] and max_iter [1000]. LASSO, least absolute shrinkage and selection operator.
Recognition performance of the 3 classification models
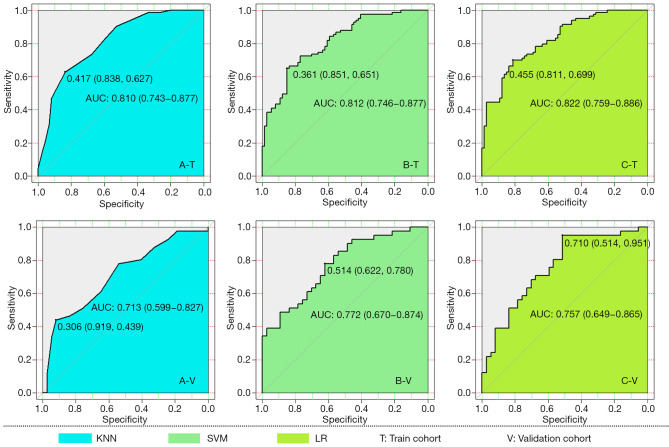
In the training cohort, the AUC (95% confidence interval [CI]), recall, and specificity of the KNN, SVM, and LR classifiers were 0.81 (0.74 to 0.88), 0.73, and 0.68; 0.81 (0.74 to 0.88), 0.72, and 0.70; and 0.82 (0.75 to 0.89), 0.73, and 0.73, respectively. Accordingly, in the validation cohort, the above evaluation indicators of these 3 classifiers were 0.71 (0.61 to 0.82), 0.61, and 0.65; 0.77 (0.67 to 0.88), 0.66, and 0.65; and 0.76 (0.65 to 0.86), 0.63, and 0.70, respectively. Combining the recall and F1-scores revealed that LR outperformed the other 2 classifiers in the recognition of NP in patients. Detailed evaluation indicator information is shown in Table 3, and the ROC curves of the 3 classifiers are shown in Figure 5.
Table 3. The ROC results with KNN, SVM, and LR classifiers of the training and validation cohorts.
| Evaluation indicator | Training cohort | Validation cohort | |||||
|---|---|---|---|---|---|---|---|
| KNN | SVM | LR | KNN | SVM | LR | ||
| AUC | 0.81 | 0.81 | 0.82 | 0.71 | 0.77 | 0.76 | |
| 95% CI | 0.74–0.88 | 0.74–0.88 | 0.75–0.89 | 0.61–0.82 | 0.67–0.88 | 0.65–0.86 | |
| Recall | 0.73 | 0.72 | 0.73 | 0.61 | 0.66 | 0.63 | |
| Specificity | 0.68 | 0.70 | 0.73 | 0.65 | 0.65 | 0.70 | |
| Precision | 0.69 | 0.69 | 0.71 | 0.60 | 0.63 | 0.63 | |
| F1-score | 0.68 | 0.70 | 0.72 | 0.62 | 0.64 | 0.67 | |
ROC, receiver operating characteristics; KNN, k-nearest neighbour; SVM, support vector machine; LR, logistic regression.
Figure 5.
ROC curves of KNN (A-T), SVM (B-T), and LR (C-T) classifiers in the training cohort, with, A-V, B-V, and C-V being the respective ROC results in the validation cohort. ROC, receiver operating characteristics; KNN, k-nearest neighbor; SVM, support vector machine; LR, logistic regression.
Discussion
NP has increasingly been identified as a complication of pediatric pneumonia (1). Staphylococcus aureus and Streptococcus pneumoniae are the most common biological factors contributing to the of emergence of NP (2). Due to the short-term severe morbidity of childhood NP, treatment usually involves pediatric intensive care unit hospitalization and a lengthy course of antibiotics. Severe cases may involve invasive surgery, including thoracic duct video-assisted thoracoscopic surgery or segmental pneumonectomy, or even the use of extracorporeal membrane oxygenation (ECMO) (1,17). Insufficient recognition of NP can lead to misdiagnosis and serious errors in clinical management (18). Thus, early identification is important for guiding appropriate clinical treatment and reducing the incidence and mortality rates associated with this disease (19). In the early stage of NP, diagnostic radiographs may show lung consolidation; However, chest CT scans are needed for a more definitive diagnosis (1). If the consolidation area of the lung shows decreased parenchymal enhancement after injection of iodine, the possibility of pulmonary necrosis is higher, but this results in exposure to an increased radiation dose (1,4). Enhanced CT is also associated with a higher radiation dose, and children are more sensitive to the risk of radiation-induced cancer than adults (20,21). Enhanced CT also increases the contrast agent load and increases the possibility of contrast agent-associated nephropathy (22). Therefore, if plain CT data can be used to recognize lung necrosis in early stage in children, this will allow for timely clinical decisions to be made regarding therapeutic options without increasing a child’s exposure to radiation.
In this study, we described the recognition of NP in lung consolidation by using a CT-based radiomics machine learning model. Our preliminary results indicated that 15 radiomics features were associated with NP. The AUC, recall, and f1-score values of the LR model in the validation cohort were 0.76, 0.70, and 0.67, respectively, outperforming both KNN and SVM. Therefore, this radiomics model has the potential to serve as a promising imaging biomarker for recognition NP, contributing to early detection, risk assessment, and treatment decisions.
Radiomics is an emerging field of study that utilizes a series of qualitative and quantitative analyses of high-throughput image features to obtain heterogeneity information from medical images. This method is different from the traditional method, which only interprets the image visually (23). Radiomics has been widely used in the diagnosis, prediction, and classification of cancers in many systems of the body (24-27). Several reports have described the use of radiomics for pulmonary infectious diseases. Some recent studies used this approach to distinguish pneumonia from paraquat poisoning, and to discriminate focal organizing pneumonia from peripheral lung adenocarcinoma (28,29). Kloth et al. noted differences in texture analysis parameters between active alveolitis and lung fibrosis in chest CT scans of patients with systemic sclerosis (30). Feng et al. reported that radiomics-based predictive models reliably identified patients with glucocorticoid-sensitive connective tissue disease-associated interstitial lung disease (31). Another study showed that these models could be used to differentiate primary progressive pulmonary tuberculosis from community-acquired pneumonia in children (32).
This present study aimed to recognize the occurrence of NP by choosing an optimum machine learning model based on the Radiomics features of the lung consolidation. In comparison with the SVM and KNN classifiers, plain CT images based on the strongest LR results showed the best classification effect. The results demonstrated that LR and radiomics can be used as novel methods for recognition of lung necrosis in early stage and can guide the planning of further clinical treatments. This method avoids the use of excessive radiation and its related complications. Therefore, it can serve as a tool to assist clinicians in determining a suitable treatment method for patients and has wide applications in clinical practice.
Radiomics features can reveal subtle changes in lesions that are difficult to quantitatively recognize by the naked eye. The report used plain CT scan images to extract the radiomics features associated with lung necrosis and these features can be used to build artificial intelligence models. Fifteen radiomics features were extracted in this study, including first-order statistics, texture feature classes, and higher-order GLSZM, GLRLM, and other parameters. The texture features describe the texture characteristics of the image. Among the feature parameters selected in this study, ZoneEntropy measures the uncertainty or randomness in the area size and the gray-level distribution. The first-order characteristics GLDM and GLRLM were correlated with the intensity, gray-length, and distribution heterogeneity of the lesion voxel.
In summary, this study cited the performance of the VOIs on CT scan images of the lung to demonstrate the feasibility of combining artificial intelligence with CT scan radiomics to recognize lung necrosis in early stage. This method is a non-invasive, high-precision approach for diagnosing lung necrosis in early stage that allows for improved guidance in treatment planning, prevention of radiation-related complications, and avoidance of the high costs associated with enhanced scanning.
There are several limitations in the current study. First, due the retrospective design of the study, the quality of the images could not be strictly controlled. Second, the number of NP cases was limited, although the results are promising. Third, our research is single-centered and further verification from multi-center research is required. Therefore, we aim to conduct further studies to verify these results with larger, more comprehensive, and more uniform samples. Patients with NP can become seriously ill, and early recognition is vital for timely clinical management and the reduction of sequelae linked to this disease.
Supplementary
The article’s supplementary files as
Acknowledgments
Funding: This study was supported by Scientific and Technological Research Program of Chongqing Municipal Education Commission (Grant No. KJQN202000440) and Chongqing Health Joint Medical Research Project (No. 2020FYYX128).
Ethical Statement: The authors are accountable for all aspects of the work in ensuring that questions related to the accuracy or integrity of any part of the work are appropriately investigated and resolved. The study was conducted in accordance with the Declaration of Helsinki (as revised in 2013). The study was approved by the Ethics Committee of the Children’s Hospital Affiliated with Chongqing Medical University (NO.: 20190218) and individual consent for this retrospective analysis was waived.
Footnotes
Reporting Checklist: The authors have completed the TRIPOD reporting checklist. Available at http://dx.doi.org/10.21037/tp-20-241
Data Sharing Statement: Available at http://dx.doi.org/10.21037/tp-20-241
Conflicts of Interest: All authors have completed the ICMJE uniform disclosure form (available at http://dx.doi.org/10.21037/tp-20-241). All authors report grants from Chongqing Municipal Education Commission, China and grants from Chongqing Health Commission, China, during the conduct of the study. The authors have no other conflicts of interest to declare.
References
- 1.Sawicki GS, Lu FL, Valim C, et al. Necrotising pneumonia is an increasingly detected complication of pneumonia in children. Eur Respir J 2008;31:1285-91. 10.1183/09031936.00099807 [DOI] [PubMed] [Google Scholar]
- 2.Spencer DA, Thomas MF. Necrotising pneumonia in children. Paediatr Respir Rev 2014;15:240-5. 10.1016/j.prrv.2013.10.001 [DOI] [PubMed] [Google Scholar]
- 3.Masters IB, Isles AF, Grimwood K. Necrotizing pneumonia: an emerging problem in children. Pneumonia (Nathan) 2017;9:11. 10.1186/s41479-017-0035-0 [DOI] [PMC free article] [PubMed] [Google Scholar]
- 4.Curry CA, Fishman EK, Buckley JA. Pulmonary gangrene: radiological and pathologic correlation. South Med J 1998;91:957-60. 10.1097/00007611-199810000-00012 [DOI] [PubMed] [Google Scholar]
- 5.Kumar V, Gu Y, Basu S, et al. Radiomics: the process and the challenges. Magn Reson Imaging 2012;30:1234-48. 10.1016/j.mri.2012.06.010 [DOI] [PMC free article] [PubMed] [Google Scholar]
- 6.Lambin P, Leijenaar R, Deist TM, et al. Radiomics: the bridge between medical imaging and personalized medicine. Nat Rev Clin Oncol 2017;14:749-62. 10.1038/nrclinonc.2017.141 [DOI] [PubMed] [Google Scholar]
- 7.Ng F, Ganeshan B, Kozarski R, et al. Assessment of primary colorectal cancer heterogeneity by using whole-tumor texture analysis: contrast-enhanced CT texture as a biomarker of 5-year survival. Radiology 2013;266:177-84. 10.1148/radiol.12120254 [DOI] [PubMed] [Google Scholar]
- 8.Liu S, Liu S, Ji C, et al. Application of CT texture analysis in predicting histopathological characteristics of gastric cancers. Eur Radiol 2017;27:4951-9. 10.1007/s00330-017-4881-1 [DOI] [PubMed] [Google Scholar]
- 9.Yip C, Landau D, Kozarski R, et al. Primary esophageal cancer: heterogeneity as potential prognostic biomarker in patients treated with definitive chemotherapy and radiation therapy. Radiology 2014;270:141-8. 10.1148/radiol.13122869 [DOI] [PubMed] [Google Scholar]
- 10.Chen X, Yang Z, Yang J, et al. Radiomics analysis of contrast-enhanced CT predicts lymphovascular invasion and disease outcome in gastric cancer: a preliminary study. Cancer Imaging 2020;20:24. 10.1186/s40644-020-00302-5 [DOI] [PMC free article] [PubMed] [Google Scholar]
- 11.Wu M, Tan H, Gao F, et al. Predicting the grade of hepatocellular carcinoma based on non-contrast-enhanced MRI radiomics signature. Eur Radiol 2019;29:2802-11. 10.1007/s00330-018-5787-2 [DOI] [PubMed] [Google Scholar]
- 12.Qi Y, Cui X, Han M, et al. Radiomics analysis of lung CT image for the early detection of metastases in patients with breast cancer: preliminary findings from a retrospective cohort study. Eur Radiol 2020;30:4545-56. 10.1007/s00330-020-06745-5 [DOI] [PubMed] [Google Scholar]
- 13.Zhang Y, Zhu Y, Shi X, et al. Soft Tissue Sarcomas: Preoperative Predictive Histopathological Grading Based on Radiomics of MRI. Acad Radiol 2019;26:1262-8. 10.1016/j.acra.2018.09.025 [DOI] [PubMed] [Google Scholar]
- 14.Jiang C, Luo Y, Yuan J, et al. CT-based radiomics and machine learning to predict spread through air space in lung adenocarcinoma. Eur Radiol 2020;30:4050-57. 10.1007/s00330-020-06694-z [DOI] [PubMed] [Google Scholar]
- 15.Deutsch E, Paragios N. Radiomics to predict response to immunotherapy, bridging the gap from proof of concept to clinical applicability. Ann Oncol 2019;30:879-81. 10.1093/annonc/mdz150 [DOI] [PubMed] [Google Scholar]
- 16.Qin H, Hu X, Zhang J, et al. Machine-learning radiomics to predict early recurrence in perihilar cholangiocarcinoma after curative resection. Liver Int 2021;41:837-50. 10.1111/liv.14763 [DOI] [PubMed] [Google Scholar]
- 17.Gerdung CA, Ross BC, Dicken BJ, et al. Pneumonectomy in a Child with Multilobar Pneumatocele Secondary to Necrotizing Pneumonia: Case Report and Review of the Literature. Case Rep Pediatr 2019;2019:2464390. 10.1155/2019/2464390 [DOI] [PMC free article] [PubMed] [Google Scholar]
- 18.De Benedictis FM, Carloni I. Management of necrotizing pneumonia in children: Time for a patient-oriented approach. Pediatr Pulmonol 2019;54:1351-3. 10.1002/ppul.24412 [DOI] [PubMed] [Google Scholar]
- 19.Ramgopal S, Ivan Y, Medsinge A, et al. Pediatric Necrotizing Pneumonia: A Case Report and Review of the Literature. Pediatr Emerg Care 2017;33:112-5. 10.1097/PEC.0000000000000585 [DOI] [PubMed] [Google Scholar]
- 20.Hall EJ. Lessons we have learned from our children: cancer risks from diagnostic radiology. Pediatr Radiol 2002;32:700-6. 10.1007/s00247-002-0774-8 [DOI] [PubMed] [Google Scholar]
- 21.Mathews JD, Forsythe AV, Brady Z, et al. Cancer risk in 680,000 people exposed to computed tomography scans in childhood or adolescence: data linkage study of 11 million Australians. BMJ 2013;346:f2360. 10.1136/bmj.f2360 [DOI] [PMC free article] [PubMed] [Google Scholar]
- 22.Frush DP, Applegate K. Computed tomography and radiation: understanding the issues. J Am Coll Radiol 2004;1:113-9. 10.1016/j.jacr.2003.11.012 [DOI] [PubMed] [Google Scholar]
- 23.Wang H, Schabath MB, Liu Y, et al. Semiquantitative Computed Tomography Characteristics for Lung Adenocarcinoma and Their Association With Lung Cancer Survival. Clin Lung Cancer 2015;16:e141-63. 10.1016/j.cllc.2015.05.007 [DOI] [PMC free article] [PubMed] [Google Scholar]
- 24.Wibmer A, Hricak H, Gondo T, et al. Haralick texture analysis of prostate MRI: utility for differentiating non-cancerous prostate from prostate cancer and differentiating prostate cancers with different Gleason scores. Eur Radiol 2015;25:2840-50. 10.1007/s00330-015-3701-8 [DOI] [PMC free article] [PubMed] [Google Scholar]
- 25.Li H, Zhu Y, Burnside ES, et al. MR Imaging Radiomics Signatures for Predicting the Risk of Breast Cancer Recurrence as Given by Research Versions of MammaPrint, Oncotype DX, and PAM50 Gene Assays. Radiology 2016;281: 382-91. 10.1148/radiol.2016152110 [DOI] [PMC free article] [PubMed] [Google Scholar]
- 26.Liang C, Huang Y, He L, et al. The development and validation of a CT-based radiomics signature for the preoperative discrimination of stage I-II and stage III-IV colorectal cancer. Oncotarget 2016;7:31401-12. 10.18632/oncotarget.8919 [DOI] [PMC free article] [PubMed] [Google Scholar]
- 27.Zinn PO, Singh SK, Kotrotsou A, et al. Distinct Radiomic Phenotypes Define Glioblastoma TP53-PTEN-EGFR Mutational Landscape. Neurosurgery 2017;64:203-10. 10.1093/neuros/nyx316 [DOI] [PMC free article] [PubMed] [Google Scholar]
- 28.Yanling W, Duo G, Zuojun G, et al. Radiomics Nomogram Analyses for Differentiating Pneumonia and Acute Paraquat Lung Injury. Sci Rep 2019;9:15029. 10.1038/s41598-019-50886-7 [DOI] [PMC free article] [PubMed] [Google Scholar]
- 29.Zhang T, Yuan M, Zhong Y, et al. Differentiation of focal organising pneumonia and peripheral adenocarcinoma in solid lung lesions using thin-section CT-based radiomics. Clin Radiol 2019;74: 78.e23-30. 10.1016/j.crad.2018.08.014 [DOI] [PubMed] [Google Scholar]
- 30.Kloth C, Blum AC, Thaiss WM, et al. Differences in Texture Analysis Parameters Between Active Alveolitis and Lung Fibrosis in Chest CT of Patients with Systemic Sclerosis: A Feasibility Study. Acad Radiol 2017;24:1596-603. 10.1016/j.acra.2017.07.002 [DOI] [PubMed] [Google Scholar]
- 31.Feng DY, Zhou YQ, Xing YF, et al. Selection of glucocorticoid-sensitive patients in interstitial lung disease secondary to connective tissue diseases population by radiomics. Ther Clin Risk Manag 2018;14:1975-86. 10.2147/TCRM.S181043 [DOI] [PMC free article] [PubMed] [Google Scholar]
- 32.Wang B, Li M, Ma H, et al. Computed tomography-based predictive nomogram for differentiating primary progressive pulmonary tuberculosis from community-acquired pneumonia in children. BMC Med Imaging 2019;19:63. 10.1186/s12880-019-0355-z [DOI] [PMC free article] [PubMed] [Google Scholar]
Associated Data
This section collects any data citations, data availability statements, or supplementary materials included in this article.
Supplementary Materials
The article’s supplementary files as


