

Abstract
E-cadherin is a calcium-dependent cell-cell adhesion molecule extensively studied for its involvement in tissue formation, epithelial cell behavior and suppression of cancer. However, E-cadherin expression in the hematopoietic system has not been fully elucidated. Combining single-cell RNA sequencing analyses and immunophenotyping, we revealed that progenitors expressing high levels of E-cadherin and contained within the granulocyte-monocyte progenitors (GMPs) fraction have an enriched capacity to differentiate into basophils and mast cells. Importantly, we detected E-cadherin expression on committed progenitors prior to the expression of other reported markers of these lineages. We named such progenitors pro-BMPs (pro-basophil and mast cell progenitors). Using RNA-sequencing, we observed transcriptional priming of pro-BMPs to the basophil and mast cell lineages. We also showed that GATA-2 directly regulates E-cadherin expression in the basophil and mast cell lineages, thus providing a mechanistic connection between the expression of this cell surface marker and the basophil and mast cell fate specification.
One Sentence Summary:
E-cadherin expression on mouse hematopoietic progenitors marks their commitment to the basophil and mast cell fates at an early stage.
Introduction
Basophils and mast cells (MCs) are functionally related cells of the innate immune system, playing critical roles in allergic diseases and responses to multicellular pathogens, including helminths. Both cell types express the high affinity receptor for IgE (FcεRIα), responsible for their activation upon the binding of allergen to cell-bound IgE(1). Several progenitor populations have been reported to differentiate into basophils and/or MCs. However, the heterogeneity of these populations, and the fact that their differentiation potential for all lineages was not systematically tested, have hampered the development of a clear model of their ontogeny. Mast cell progenitors (MCPs, Lin− c-Kit+ Sca-1− Ly6c− FcεRIα− CD27− integrin β7(β7)+ T1/ST2+) with exclusive MC potential were first identified in the bone marrow (BM)(2). In the spleen, basophil-mast cell progenitors (BMCPs), identified as Lin− c-Kit+ FcγRII/IIIhi β7hi cells, were initially described as bipotential basophil and MC progenitors(3), although a report suggested that splenic BMCPs only have MC potential(4). Phenotypically identical cells shown to differentiate exclusively into basophils and MCs, were also described in the bone marrow (BM-BMCPs)(5).
Focusing on early lineage commitment, multiple lines of evidence support the view that basophil, MC and eosinophil potential co-segregates with megakaryocyte (Mk) and erythroid fates, while neutrophil and monocyte potential segregates with lymphocyte potential, in both mouse (6, 7) and human hematopoiesis (8–10). Accordingly, multipotential development of erythroid, Mk, and MC lineages was observed in a progenitor fraction called SN-β7(6), which contains the previously described MCPs (2) and is defined as Lin− (including FcεRIα−) c-Kit+ Sca-1− Flk-2− CD150− β7+ cells. In addition, expression of GATA-1 in mouse pre–granulocyte-macrophage (pre-GM) progenitors was demonstrated to separate progenitors with MC, eosinophil, Mk, and erythroid potential (GATA-1+) from those committed to the monocyte, neutrophil and lymphocyte lineages (GATA-1−)(7). This view is however complicated by the description of additional populations of multipotent progenitors, able to generate other myeloid lineages, including neutrophils and/or monocytes, in addition to basophils and/or MCs. Among them, a small fraction of granulocyte-monocyte progenitors (GMPs) with low levels of β7 reportedly generates MCs and basophils while still preserving granulocyte and monocyte potential(3). Similarly, another fraction of GMPs characterized by expression of FcεRIα and designated pre-basophil and mast cell progenitors (pre-BMPs), displays enriched capacity to differentiate into basophils and MCs but essentially generates other myeloid cells (CD11b+ Gr-1+ and CD11b+ Gr-1−) upon STAT5 knockout(11). A recent report also showed that although GATA-2 expression in pre-GMs segregates progenitors with MC potential from those with monocyte potential, a large fraction of pre-GMP and GMPs expressing high levels of GATA-2 are bipotent for the neutrophil and MC lineages(12).
In this study, we demonstrate that E-cadherin, a calcium-dependent cell-cell adhesion molecule involved in adherens junctions, and extensively studied for its involvement in epithelial cell behavior(13), comprehensively marks the mouse basophil and MC lineages. We show that E-cadherin is expressed by mature basophils and splenic MCs, and that expression of E-cadherin in progenitor cells correlates with their ability to differentiate into basophils and MCs. We also identified a new “pro-basophil and mast cell progenitor” (pro-BMP) stage, contained within the GMP fraction and lacking other reported markers of basophils and MCs, which displays a strong commitment to the basophil and MC fates. Finally, we showed that E-cadherin expression is regulated downstream of the GATA-2 transcription factor in these lineages, thus demonstrating a direct connection between the expression of this surface marker with the transcriptional program regulating their fate.
Results
E-cadherin is expressed in the basophil and MC lineages
The fact that the E-cadherin promoter is frequently methylated in acute myeloid leukemia(14) prompted us to investigate whether E-cadherin was expressed in normal hematopoietic cells. Analysis of mouse hematopoietic stem and progenitor cells (HSPCs)(15) using the Gene Expression Commons(16), the Immunological Genome Project(17), and the public dataset(18) indeed indicated a moderate, yet higher, expression of E-cadherin in GMPs compared with other progenitors (Fig. 1A–B). We next exploited a public single cell RNA sequencing (scRNA-seq) dataset(5) to query E-cadherin expression in HSPCs (bone marrow lineage− c-Kit+ compartment). We found that a fraction of HSPCs expressed E-cadherin (gene symbol: Cdh1) (Fig. 1C).
Fig. 1.

Transcriptomic analyses uncover expression of E-cadherin in GMPs and in the basophil/MC lineage. (A) Graphical representation of the probeset meta profile for E-cadherin in the Gene Expression Commons (https://gexc.riken.jp/models/1038/genes/Cdh1?q=CDH1). The axis represents expression intensity in log2 scale. The distribution of expression levels in the database is displayed by the histogram on the left side of the axis. (B) E-cadherin expression in progenitor populations from ImmGen GSE15907 (microarray) and GSE60101 (RNA-seq). (C-E) Analysis of a public dataset on BM Lin− c-Kit+ HSPCs. (C, E) Expression pattern of the selected genes was accessed at https://gottgens-lab.stemcells.cam.ac.uk/adultHSPC10X/ and is visualized in the force-directed graph layout of the single-cell profiles (ms4a2, basophil/MC-specific gene; prss34, basophil-specific gene; gzmb, MC-specific gene). (D) Top 20 most upregulated genes in E-cadherin-expressing BM Lin− c-Kit+ HSPCs versus non-E-cadherin-expressing cells. (F-H) Analysis of the Tabula Muris dataset on unfractionated BM. (F) SPRING plot showing E-cadherin expression. (G) Top 20 most upregulated genes in E-cadherin-expressing cells from cluster 4 versus all non-E-cadherin-expressing cells. (H) Cell probability scores were calculated for the Tabula Muris Dataset on the basis of previously published gene expression signatures shared by basophils and MCs or specific for basophils(23). Abbreviations: LT-HSC (long term hematopoietic stem cell), ST-HSC (short term HSC), MPP (multipotent progenitor), MLP (multilymphoid progenitor), CLP (common lymphocyte progenitor), CMP (common myeloid progenitor), MEP (megakaryocyte erythrocyte progenitor), MDP (monocyte dendritic cell progenitor), CDP (common dendritic cell progenitor).
To gain more insight into the identity of these E-cadherin-expressing progenitors, we performed differential gene expression (DGE) analysis and found 1113 differentially expressed genes (false discovery rate under 0.001). Among the top 20 most upregulated genes (Fig. 1D), we identified multiple basophil and MC markers, including Prss34(19) (mast cell protease 11), Gzmb (granzyme B)(20), Mcpt8(21) (mast cell protease 8), Ms4a2 (high affinity IgE receptor subunit β)(22), Fcer1a(22), and Cma1 (chymase 1)(23), whose expression profiles overlapped with that of E-cadherin (Fig. 1E). Next, we focused on more differentiated cells, exploiting the scRNA-seq dataset from the Tabula Muris consortium(24), established from unfractionated bone marrow cells. Thirteen different clusters were identified (Fig. S1A–B), among which two (clusters 4 and 13) expressed E-cadherin (Fig. 1F). DGE analysis identified multiple basophil specific genes among the top upregulated genes of E-cadherin-expressing cells from cluster 4 (Fig. 1G), including Prss34(19), Mcpt8(21), Fcer1a(22), Cpa3 (carboxypeptidase A3)(25, 26), Cd200r3(27), and Ms4a2(22). Conversely, by computing a cell probability score based on the simultaneous expression of multiple markers of the basophil and MC lineages, we found an overlap between E-cadherin expressing cells and the basophil and MC shared gene expression signatures, as well as with the basophil-specific gene expression signature (Fig. 1H). Similar analyses performed on E-cadherin expressing cells from cluster 13 identified them as plasmacytoid dendritic cells (pDCs) (Fig. S1C–D), a cell type recently reported to also express E-cadherin(28).
To confirm the scRNA-seq data, we quantified E-cadherin mRNA in multiple fluorescence activated cell sorting (FACS)-purified populations corresponding to hematopoietic progenitors, pre-BMPs, basophil progenitors (baPs), basophils, and splenic MCs (Fig. 2A). pDCs were used as positive controls. GMPs and pre-BMPs displayed a higher expression of E-cadherin compared with other multipotent progenitors, while the highest levels were observed in basophils, baPs, and MCs. Next, we quantified the frequency of E-cadherin expression by flow cytometry across multiple populations (Fig. 2B–C). E-cadherin expression was detected on 31.1% (± 1.8 % (SD)) of GMPs, and on virtually all pre-BMPs, baPs, basophils, BMCPs, and splenic MCs.
Fig. 2.

E-cadherin is expressed in the mouse basophil and MC lineages. (A) RNA was isolated from the indicated populations (sorted from the bone marrow, unless otherwise indicated); E-cadherin mRNA abundance was determined by RT-qPCR and is expressed relative to RPL13A levels. (B) Frequency of E-cadherin expression for each hematopoietic cell as determined by FC. (C) Representative contour plots showing E-cadherin expression. (D) Dot plots showing that gating of Lin− Sca-1− c-Kit− CD49b+ E-cadherin+ cells identifies basophils as efficiently as gating of Lin− Sca-1− c-Kit− CD49b+ FcεRIα+ cells. (E) Dot plots showing expression of E-cadherin on Lin− Sca-1− c-Kit+ cells and the overlap with the GMP gate. Dots on the left of the GMP gate, with reduced CD34 expression, correspond to BM-BMCPs. (A-E) Data are the mean ± SEM of 3 mice. Abbreviations: LSKs (Lin− Sca-1+ c-Kit+), CLPs (common lymphocyte progenitors), CMPs (common myeloid progenitors), MEPs (megakaryocyte erythrocyte progenitors), NK (natural killer), Fr. F (Hardy’s fraction F).
Importantly, all CD49b+ E-cadherin+ cells were positive for FcεRIα (Fig. 2D). Therefore, E-cadherin staining can replace FcεRIα staining (together with CD49b) for the identification of mature basophils. Similar observations were performed for peripheral blood and spleen basophils (Fig. S2). Focusing on the progenitor compartment (Lin− c-Kit+ Sca-1−), we found that E-cadherin expression mostly overlapped with the GMP compartment based on CD34 and CD16/32 expression (Fig. 2E).
GMPs expressing high levels of E-cadherin are committed to a basophil and MC fate
As E-cadherin was expressed in some GMPs and was uniformly expressed in basophils, MCs, and their reported progenitors, we hypothesized that E-cadherin expression on GMPs might correlate with their differentiation fate. Using FACS sorting and differentiation in culture in a medium supportive of multiple myeloid lineages, we compared the differentiation potential of GMPs with high (E-cadhigh), intermediate (E-cadint) or no E-cadherin (E-cadneg) expression (Fig. 3A). Strikingly, most of the cells differentiated from E-cadhigh GMP showed commitment to the basophil or MC lineages, while E-cadneg and E-cadint fractions essentially differentiated into neutrophils and Ly6C+ CD11b+ Ly6G− cells (which include monocytes and immature neutrophils) (Fig. 3B). We then plotted the number of each differentiated cell type generated by 1,000 GMPs over time (Fig. 3C). E-cadhigh GMPs generated significantly higher numbers of basophils and MCs, and significantly lower numbers of neutrophils and Ly6C+ CD11b+ Ly6G− cells, compared to E-cadint/neg GMPs. E-cadint GMPs generated a significantly higher number of eosinophils compared with E-cadhigh/neg GMPs. Staining confirmed the immature morphology of E-cadhigh GMPs, indistinguishable from E-cadneg GMPs (Fig. 3D). Cytospins from day 5 and 7 cultures also confirmed the major prevalence of basophils and MCs in the E-cadhigh GMP cultures and of neutrophils in the E-cadneg GMP cultures.
Fig. 3.
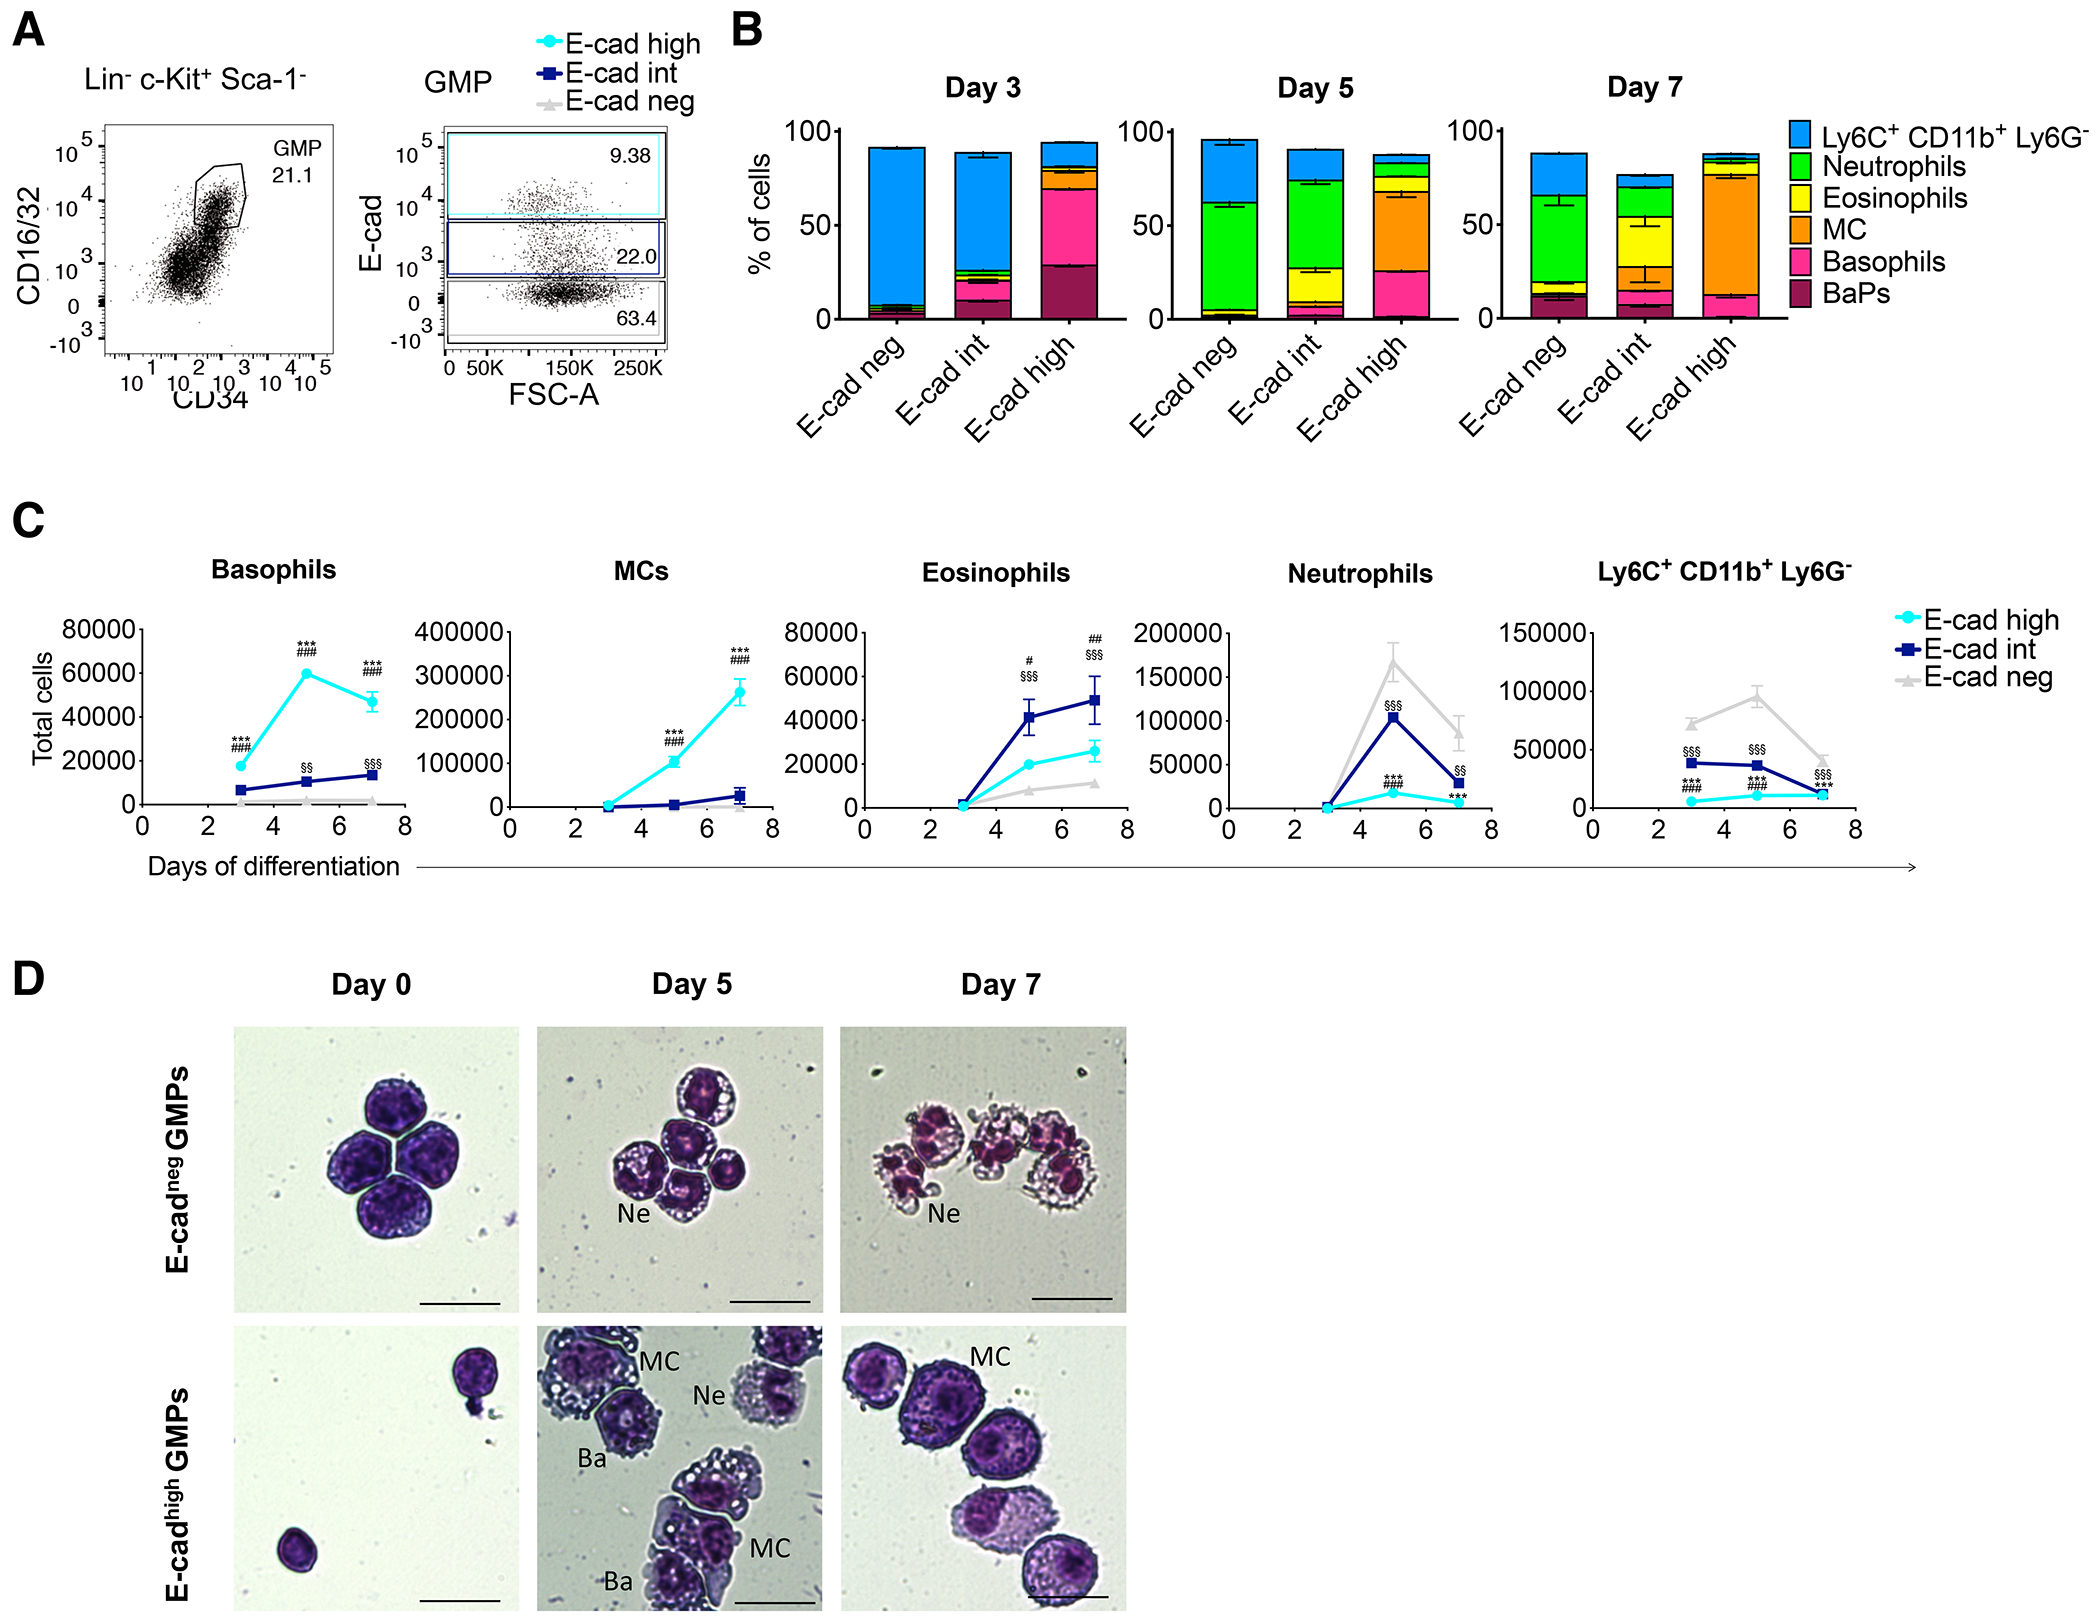
E-cadherin-expressing GMPs generate more basophils and MCs in culture. (A) Representative dot plot for the sorting of GMPs expressing different levels of E-cadherin. (B-D) GMPs were differentiated in liquid culture for 7 days. (B) Differentiation was assessed by FC and the frequency of each cell type is expressed as percentage of live cells. (C) Total number of differentiated cells obtained when plating 1,000 GMPs. Statistics were calculated using two-ways ANOVA followed by Tukey’s multiple comparison tests. Symbols for statistical tests: * for comparisons E-cadhigh vs E-cadneg; # for comparisons E-cadhigh vs E-cadint; $ for comparisons E-cadint vs E-cadneg. (D) Wright-Giemsa stainings before and after 5 and 7 days of differentiation in culture. Scale bar: 20 μm. Ne, neutrophils; Ba, basophils; MC, mast cells. (A-D) Data are representative of n=3 (mean ± SEM).
E-cadherin expression defines a new pro–BMP stage in the basophil/MC lineages
We next further investigated the expression of E-cadherin on progenitor cells as an early marker of the basophil and MC lineages. Pre-BMPs are a fraction of GMPs that express FcεRIα and have an enriched capacity to generate basophils and MCs(11). We therefore tested whether E-cadherin expression in GMPs was restricted to pre-BMPs or defined a new population of progenitors. We found that only half of the E-cadhigh GMPs also expressed FcεRIα (Fig. 4A). We thus defined a new subpopulation of GMPs characterized by a high expression of E-cadherin (at the same intensity as in pre-BMPs) and no expression of FcεRIα, that we designated based on the subsequent characterization “pro-basophil and mast cell progenitors” (pro-BMPs).
Fig. 4.

E-cadherin marks the commitment to the basophil and MC lineages at the pro-BMP stage. (A) Dot plot showing distribution and frequency of E-cadherin and FcεRIα on GMPs (mean ± SEM of n=6). (B) Histograms comparing the expression of the indicated markers on the different populations (representative of n=3). (C) Single GMPs were index-sorted from n=6 mice based on the expression of E-cadherin and FcεRIα and differentiated for 4 days. Differentiation was assessed by FC. Data show the frequency of each colony type on day 4. (D) Dot plots from day 0 (FACS index data) showing the expression of E-cadherin and FcεRIα of single cells that generated the indicated type of colony (listed on top) on day 4. (E) Single GMPs were differentiated in erythroid/Mk-favoring conditions and analyzed by FC. Data represent the frequency of each type of colony on day 4. LSKs were used as positive controls for erythroid and Mk differentiation. (F-G) 100 GMPs were differentiated in erythroid/Mk-favoring conditions and analyzed by FC on day 8. Data in (F) represent the percentage of wells (12 wells analyzed per population) for which an output in the indicated lineage was detected. Data in (G) represent the average number of each cell type per well (mean ± SEM of n=12 wells). (H) Pro-BMPs, pre-BMPs, baPs and BMCPs (depicted by lines of different colors) were FACS-sorted from the BM (pro-BMPs, pre-BMPs and baPs) or spleen (BMCPs) and differentiated in liquid culture for 7 days. Their differentiation into baPs, basophils and MC was assessed by FC until day 7. The number of differentiated cells was calculated based on the plating of 1,000 cells/well (mean ± SEM of n=3). (I-J) Pro-BMPs and pre-BMPs were FACS-sorted from donor mice (expressing CD45.2) and transplanted into recipients (expressing CD45.1). Expression of the indicated cell surface markers on the transplanted cells (CD45.2+) isolated from the spleen were analyzed 42h later by FACS. Data are representative of 2 experiments.
We first compared phenotypically the pro-BMP population with pre-BMPs, baPs, bone marrow basophils, splenic BMCPs, and MCs (Fig. 4B, Fig. S3A). Pro-BMPs and pre-BMPs expressed similar levels of the progenitor markers c-Kit and CD34 and both lacked the mature basophil marker CD49b. Most pro-BMPs (79%) lacked expression of integrin β7, which was expressed in 52% of pre-BMPs and 65% of baPs albeit at a lower level than in BMCPs and MCs (Fig. S3B–C). By definition, pro-BMPs displayed no expression of FcεRIα, which was expressed in all the other populations of the basophil/MC lineages except splenic BMCPs. Notably, only a minor overlap between pro-BMPs and BM-BMCPs(5) was observed, suggesting that these populations are essentially distinct (11.5% of pro-BMPs overlapped with BM-BMCPs and 14.5% of BM-BMCPs overlapped with pro-BMPs) (Fig. S3D–E).
We next investigated the fate of pro-BMPs, pre-BMPs, E-cadint GMPs or double-negative (E-cadneg FcεRIαneg) GMPs (DN-GMPs) at the single-cell level. After 4 days of differentiation, colonies were analyzed by flow cytometry (FC) (Fig. 4C). Colonies were detected in 270 out of the 522 single-sorted cells from all populations. DN-GMPs generated virtually no basophils and MCs, and mostly generated neutrophils (11.9%), Ly6Chigh CD11b+ Ly6G− cells (21.4%), or a combination of both (6.0%). A small fraction of E-cadint GMPs demonstrated basophil potential (7.7% basophils only; 0.4% basophils and MCs; 2.0% basophils and Ly6Chigh CD11b+ Ly6G− cells; 1,2% basophils, eosinophils and Ly6Chigh CD11b+ Ly6G− cells). However, most E-cadint GMPs differentiated into neutrophils (11.3%), Ly6Chigh CD11b+ Ly6G− cells (13.7%), or a combination of both (8.1%). Pro-BMPs generated mostly cells in the basophil and MC lineages (31.9% basophils, 5.3% MCs, 2.1% basophils and MCs, 1.1% basophils, eosinophils and Ly6Chigh CD11b+ Ly6G− cells), although neutrophils and Ly6Chigh CD11b+ Ly6G− cells were also observed (4.2% and 10.6%, respectively). Pre-BMPs almost exclusively gave rise to basophils (34.4%), MCs (17.7%) or a combination of both (4.2%). Retrospective analysis (Fig. 4D) of the index-sorted cells showed that MC potential and basophil/MC bipotential cells were found mostly in pro-BMP and pre-BMP fractions, while neutrophil/monocyte potential was excluded from the pre-BMP fraction. Interestingly, out of the 270 clones for which we detected an output, 7 had combined basophil and MC potential, supporting the existence of rare bipotent progenitors for these lineages. Rare clones (6/270) generating basophils and Ly6Chigh CD11b+ Ly6G− cells (a fraction containing monocytes and immature neutrophils), and basophils, eosinophils and Ly6Chigh CD11b+ Ly6G− cells (4/270) were also found, supporting the existence of bi- and multi-potent progenitors with potential toward the basophil/eosinophil and neutrophil/monocyte lineages (Fig. 4C, Supplemental Table 6).
As basophil and MC potential was previously demonstrated to co-segregate with erythroid and Mk fates (6, 7), we next investigated the ability of these different populations to generate erythroid cells and Mks. Using single-cell differentiation assays in erythroid and Mk-favoring conditions (Fig. 4E), we found that 15.2%, 14.1% and 4.3% of pre-BMPs differentiated into erythroid cells, Mks or a combination of both, respectively. Rare clones (3/184 (i.e., 1.6%)) also differentiated into mixed colonies containing MCs and Mks. Potential for the Mk and erythroid lineages was also observed in pro-BMPs but was more limited than in pre-BMPs (4.9, 4.3 and 2.2% for erythroid, Mk or mixed ery/Mk potential, respectively). No bipotent Mk/MC colony was detected from pro-BMP-derived colonies, likely due to the 10-fold lower frequency of these bipotent colonies compared with unipotent Mk and MC colonies.
We next repeated the assay in bulk cultures, plating 100 cells per well and assessing the output after 8 days of differentiation. In these conditions, we detected erythroid and Mk potential in 33.3% and 83.3% of wells plated with pro-BMPs, respectively, and in 83.3 and 91.6% of wells plated with pre-BMPs (Fig. 4F). However, analyzing the number of differentiated cells, erythroid cells and Mks were largely outcompeted by MCs in wells plated with pro-BMPs and pre-BMPs, unlike in those plated with LSKs (Fig. 4G).
These observations support the view that although progenitors expressing high levels of E-cadherin do have the ability to differentiate in the erythroid and Mk lineages in supportive conditions, they mostly contribute to the basophil and MC lineages. The visualization of E-cadherin expression in single-cell data from c-Kit+ CD55+ progenitors(29), a population previously shown to express GATA-1 and that has potential for the MC, eosinophil, Mk and erythroid lineages (7), confirms this view (Fig. S3F). Indeed, E-cadherin is specifically expressed in the basophil and MC branches, rather than either in the continuum of less differentiated progenitors, or in those more differentiated cells that are highly committed to the erythroid or Mk fates.
In order to assess a potential hierarchical relationship between pro-BMPs and pre-BMPs, we performed differentiation time course analyses ex vivo, which showed that pro-BMPs and pre-BMPs differentiated into baPs, basophils, and MCs with similar kinetics (Fig. 4H). We next performed short-term adoptive transfer experiments with analyses at 42h post-transplantation, a time-point at which transplanted cells retained high CD34 expression (Fig. 4I). We found that the majority of pro-BMPs generated FcεRIα-expressing cells in vivo, consistent with a pre-BMP phenotype and commitment to the basophil and/or MC lineages (Fig. 4J). A smaller fraction of pro-BMP-derived cells remained E-cadherin+ and FcεRIα− and were thus phenotypically identified as pro-BMPs, while a small percentage lost E-cadherin expression, consistent with their commitment to other myeloid lineages (as observed during ex vivo culture). Pre-BMPs-derived cells however, essentially remained double-positive (E-cadherin+ FcεRIα+) cells, suggesting that they cannot generate pro-BMPs. Therefore, we concluded that a large fraction of pro-BMPs transition through a pre-BMP stage during their commitment toward the basophil and MC lineages.
Pro-BMPs show transcriptional commitment to the basophil lineage and the capacity to express type 2 cytokines despite lacking FcεRIα expression
To pursue further the potential commitment of pro-BMPs to the basophil and MC lineages, we performed bulk RNA-seq on FACS-purified DN-GMPs, pro-BMPs, pre-BMPs, and basophils. Multidimensional scaling plots confirmed that the 4 populations were distinct (Fig. S4A). To understand the dynamics of basophil commitment, we generated a heatmap based on the top 50 most variable genes across all samples (Fig. 5A). Four major trends were observed: genes that were progressively upregulated from pro-BMPs to basophils; genes that were increased from pre-BMPs to basophils; genes that were specific for basophils; and genes that were expressed in DN-GMPs and pro-BMPs, but not in pre-BMPs and basophils. Among the genes that showed gradual upregulation from pro-BMPs to basophils, we identified basophil and/or MC markers, including the G-protein coupled receptor 34 (Gpr34)(30), the interleukin (IL)-33 receptor Il1rl1 (also known as ST2)(31), and Prss34(19).
Fig. 5.

Pro-BMPs are transcriptionally primed toward a basophil/MC fate. (A-C) RNA-seq was performed on FACS-sorted DN-GMPs, pro-BMPs, pre-BMPs, and mature basophils (n=3). (A) Heatmap showing the top 50 most variable genes between the compared populations. (B) Volcano plot showing differential gene expression between pro-BMPs and DN-GMPs. Selected basophil and MC markers are highlighted in red. (C) Expression profile of selected genes that were significantly induced in pro-BMPs vs DN-GMPs (mean ± SEM of n=3).
To better unveil differences between pro-BMPs and DN-GMPs, we performed DGE analysis. Only 262 genes were differentially expressed between pro-BMPs and DN-GMPs (versus 3336 between pre-BMPs and DN-GMPs and 6507 between basophils and DN-GMPs, using a false discovery rate cutoff of 0.05) (Tables S1–3). Importantly, we identified multiple genes with reported basophil and/or MC functions among the genes highly expressed in pro-BMPs (Fig. 5B). These genes were further increased in pre-BMPs and basophils with the exception of Gzmb, which is downregulated in basophils, in agreement with its specific expression in MCs(5, 32) (Fig. 5C). By contrast, DEGs expressed at lower levels in pro-BMPs included genes expressed by other myeloid cell types, such as neuropilin 1 (Nrp1) and triggering receptor expressed on myeloid cells 2 (Trem2) (Tables S1), both expressed in macrophages and dendritic cells(33–36). To look for a broader basophil and MC signature in pro-BMPs, we generated a heatmap of genes that were significantly more expressed in pro-BMPs, pre-BMPs, and basophils in comparison with DN-GMPs. Using this approach, 118 genes were identified (Fig. S4C). Importantly, many of these genes were also found specifically expressed in basophils, MCs, and/or their progenitors in other studies(5, 11, 23), confirming the existence of a broad basophil/MC signature in pro-BMPs.
As basophils and MCs can be robust producers of type 2 cytokines, we also compared the ability of the different populations to express IL-4 and IL-13(37). IL-4 and IL-13 mRNAs were expressed at very low to undetectable levels in DN-GMPs (Fig. S5A). Pro-BMPs expressed IL-4 and IL-13, albeit at lower levels than in more differentiated cells. Importantly, pro-BMPs, pre-BMPs, baPs, and basophils all displayed the ability to significantly induce IL-4 mRNA upon PMA and ionomycin stimulation (Fig. S5B). As expected, pro-BMPs, which lacked FcεRIα expression, did not induce IL-4 expression upon IgE crosslinking, as was observed in pre-BMPs, baPs, and basophils.
E-cadherin marks the commitment toward the basophil and MC lineages downstream of GATA-2 expression
To better understand how pro-BMPs are primed to the basophil and MC lineages, we compared the expression of transcription factors involved in basophil and MC specification, including the zinc finger transcription factors GATA-1(38, 39) and GATA-2(40, 41), runt-related transcription factor 1 (Runx1)(4), and CCAAT/enhancer-binding protein alpha (C/EBPα)(11). GATA-1 and GATA-2 were more highly expressed in pro-BMPs compared with DN-GMPs (Fig. 6A, Table S1, and Fig. S5C), which confirmed their transcriptional priming to the basophil/MC lineages. Runx1 and C/EBPα, however, were only upregulated at later stages, supporting the immature state of these progenitors.
Fig. 6.
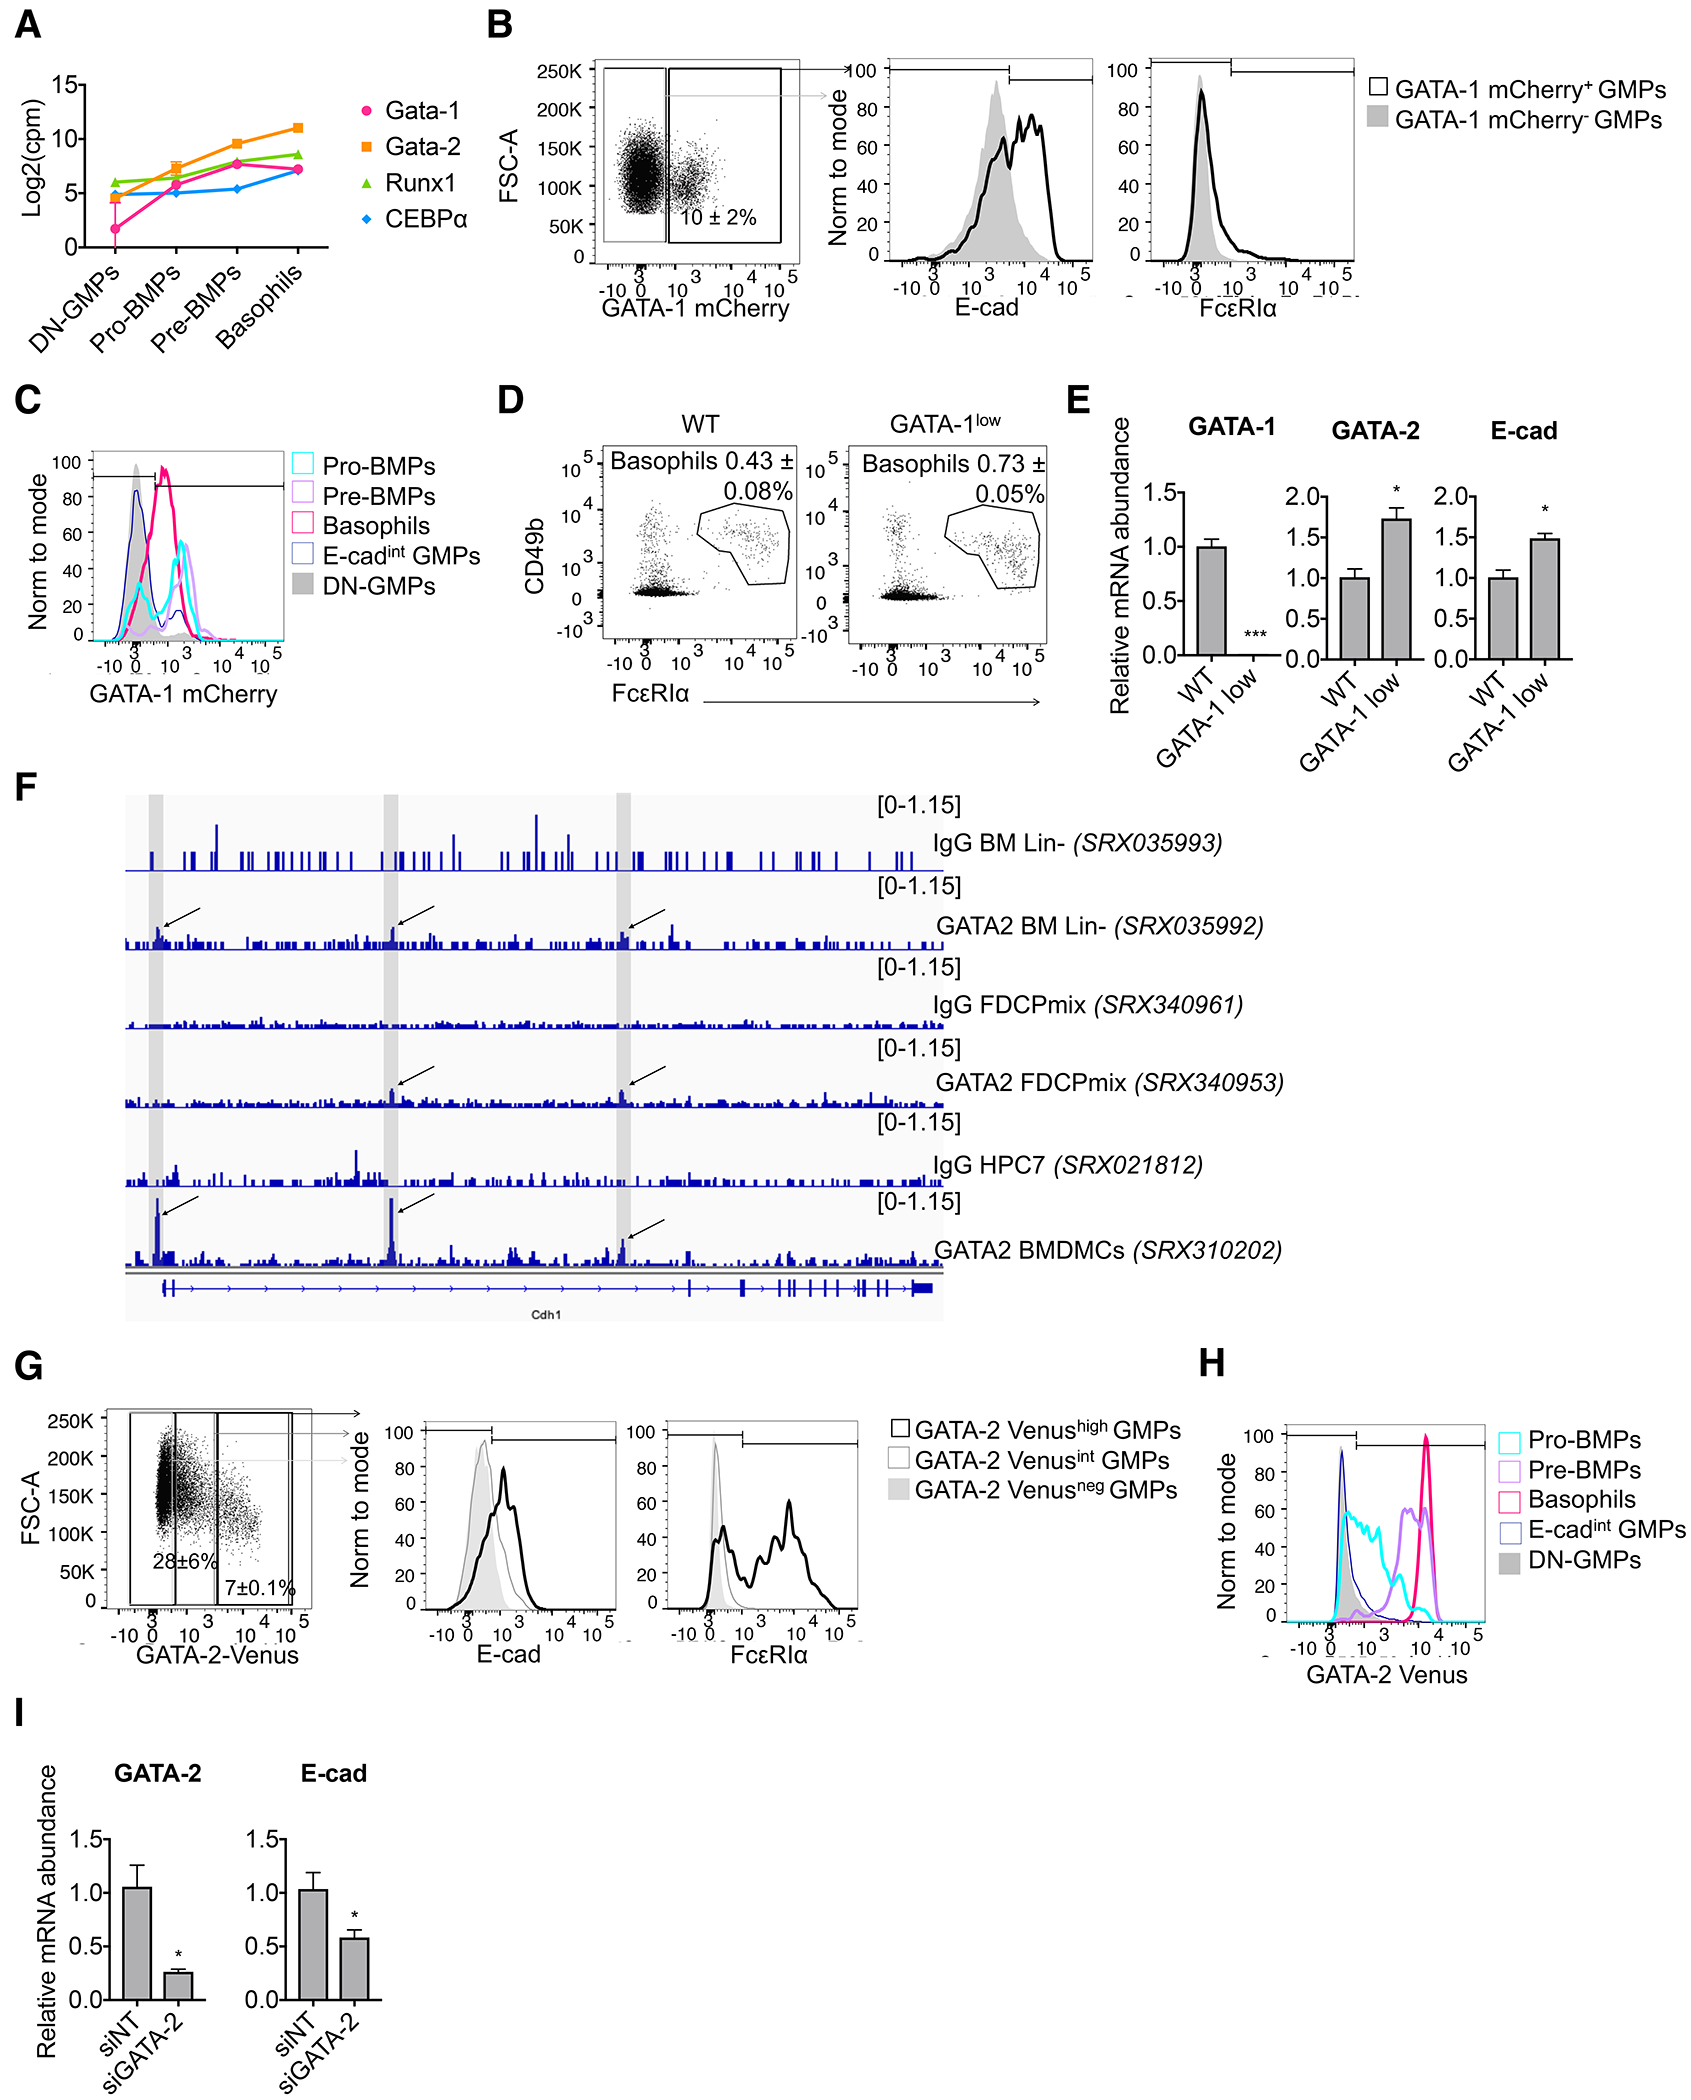
E-cadherin is induced in the basophil and MC lineages downstream of the GATA-2 transcription factor. (A) Expression profile of selected transcription factors involved in basophil and MC differentiation (RNA-seq, mean ± SEM of n=3). (B) Flow cytometry analysis of GATA-1mCherry, E-cadherin and FcεRIα on gated GMPs from a GATA-1mCherry reporter mouse (n=3). (C) Expression intensity of GATA-1mCherry in the indicated populations (n=3). (D) Dot plots showing the bone marrow basophil populations from wild-type and GATA-1low mutant mice (data are the mean ± SEM of n=3). (E) Relative mRNA abundance of GATA-1, GATA-2 and E-cadherin from FACS-sorted basophils from wild-type and GATA-1low mutant mice (data are the mean ± SEM of n=3 and statistics were calculated using t-tests). (F) GATA-2 ChIP-seq profiles at the E-cadherin locus. (G) Flow cytometry analysis of GATA-2Venus, E-cadherin and FcεRIα on gated GMPs from a GATA-2Venus reporter mouse (n=2). (H) Expression intensity of GATA-2Venus in the indicated populations (n=2). (I) BaPs were FACS-sorted from 4 mice and nucleofected with non-targeting siRNA (siNT) or siRNA against GATA-2 (siGATA-2). Relative mRNA abundance of GATA-2 and E-cadherin was analyzed 48h post-nucleofection (data are the mean ± SEM of n=4 and statistics were calculated using paired T-tests).
We next used the upstream regulator analysis tool of the Ingenuity Pathway Analysis software to identify upstream regulators responsible for gene expression changes between pro-BMPs and DN-GMPs (Tables S4). This analysis identified GATA-2 and Zinc Finger Protein, FOG Family Member 1 (Zfpm1, also known as Friend Of GATA-1 (FOG-1)) as the two regulators with the most significant overlap with the differentially expressed genes. GATA-2 was in addition predicted to be activated (Z-score 1.39) and differentially expressed in pro-BMPs vs DN-GMPs (Tables S1). These two regulators were, according to the IPA database, predicted to regulate multiple basophil and MC-specific genes increased in pro-BMPs vs DN-GMPs, such as Cpa3, Gzmb, Itga2b and Ms4a2 (Tables S4).
Interestingly, in MCF7 breast cancer cells, GATA-3 induces E-cadherin expression by binding GATA-like motifs located in its promoter(42). Further, GATA and its coregulator, U-shaped, regulate E-cadherin expression in Drosophila hematopoietic progenitors(43). We thus hypothesized that E-cadherin expression in the basophil and MC lineages may depend on the expression of GATA-1 and/or -2, thus providing a mechanistic connection between the expression of this surface marker and the commitment of pro-BMPs to the basophil and MC lineages.
Using a GATA-1 protein reporter mouse (44), we found that 57.5% of GATA-1-positive GMPs expressed E-cadherin, whereas only 11.7% expressed FcεRIα (Fig. 6B, Supplemental Table 6). Therefore, E-cadherin expression in GMPs correlates better with GATA-1 expression than does FcεRIα. Consistently, the majority of pro-BMPs and pre-BMPs expressed GATA-1 at the protein level (65.9 and 84.4%, respectively), whereas the majority of DN-GMPs (92.2%) did not (Fig. 6C).
We next investigated whether GATA-1 directly regulates E-cadherin expression. We took the advantage of the GATA-1low mutant mice, in which targeted deletions of upstream enhancer and promoter sequences of the GATA-1 gene result in reduced levels of GATA-1 expression(45). We found a significant increase in the number of basophils in the GATA-1low mutant mice compared with WT controls, although these basophils displayed reduced expression of CD49b (Fig.6D, Fig. S5D). These basophils expressed higher levels of GATA-2 and E-cadherin mRNA compared with WT controls (Fig. 6E), suggesting that GATA-2, rather than GATA-1, regulates E-cadherin expression.
Supporting this hypothesis, analysis of public GATA-2 ChIP-sequencing datasets (Fig. 6F) showed a strong enrichment of GATA-2 in the promoter region and in the intron 2 of E-cadherin in bone marrow-derived cultured mast cells (BMDMCs)(46). Interestingly, this region was previously demonstrated to be essential to initiate and maintain E-cadherin expression in different tissues(47). These peaks were also enriched in bone marrow hematopoietic progenitor cells (lineage-negative)(48) – albeit not as strongly as in BMDMCs, as only a small fraction of Lin- cells express E-cadherin – and in the multipotent FDCP mixed (factor-dependent cells Paterson) cell line (49). Using a GATA-2 transcriptional reporter mouse(50), we found that GMPs expressing high levels of GATA-2-Venus expressed E-cadherin at higher levels than GMPs expressing lower levels of GATA-2, whereas 39.8% were devoid of FcεRIα (Fig. 6G). Consistently, the majority of pro-BMPs and all pre-BMPs expressed GATA-2 Venus (72.7% and 98.8%, respectively), while most E-cadint GMPs and DN-GMPs did not (Fig. 6H). Therefore, GATA-2 and E-cadherin are co-expressed in myeloid progenitors committed to the basophil/MC lineages.
To demonstrate that GATA-2 can regulate E-cadherin expression, we deleted GATA-2 in FACS-sorted pre-BMPs from an inducible GATA-2 knockout mouse(40) (Fig. S5E). Accordingly, GATA-2 deletion resulted in a loss of E-cadherin expression at the mRNA and protein levels (Fig. S5E–F). To confirm this observation, we transfected baPs with siRNA against GATA-2 and found that the knockdown of GATA-2 resulted in decreased expression of E-cadherin mRNA (Fig. 6I). Notably, GATA-2 knockdown had minimal impact on the expression of CD63 and Alox5 (Fig. S5G), two genes commonly expressed in basophils(40), as well as on the expression of genes commonly expressed in macrophages (MPG1) (51) and neutrophils (Ela2) (52). These observations suggest that the cells obtained after GATA-2 knockdown are still basophil-like and do not result from the selective outgrowth of other myeloid lineages. All together, these data confirm the requirement of GATA-2 for the optimal expression of E-cadherin in the basophil and MC lineages.
Discussion
We have demonstrated that mouse basophils express E-cadherin and can be identified using CD49b in conjunction with E-cadherin instead of FcεRIα. This opens the possibility of marking and sorting mature basophils while leaving the FcεRI untouched, which could be of great utility for functional studies involving IgE ligation. The expression of E-cadherin has been reported in mouse BMDMCs and peritoneal MCs(53). In agreement with these observations, we found expression of E-cadherin in splenic MCs. Notably, E-cadherin mRNA is downregulated in connective tissue MCs when compared with basophils(23), suggesting that E-cadherin expression in mature MCs may be heterogeneous, for example depending on their anatomic location.
We also demonstrated that, in the bone marrow, E-cadherin comprehensively marks the basophil and MC lineages early in their specification. In addition to the multiple basophil and MC progenitor populations previously described which we find express E-cadherin, we identified a new progenitor population that we named “pro-BMPs”. Pro-BMPs express high levels of E-cadherin and display an enriched capacity to differentiate into basophils and MCs, yet lack other reported markers of the basophil and MC lineages. Phenotypically, pro-BMPs are different from the previously described pre-BMPs(11), which express FcεRIα, and from MCPs(2), which express β7 and have no potential to differentiate into basophils. A minor overlap between pro-BMPs and BM-BMCPs(5) was observed but could not explain by itself the high propensity of pro-BMPs to differentiate into basophils and MCs.
Differentiation assays demonstrated that pro-BMPs and pre-BMPs had a strong capacity to differentiate into basophils and/or MCs. Both populations also displayed potential for the erythroid and Mk lineages in single cell assays, in proportions that were comparable with their MC potential. This latter observation is in line with the description of an early branch point that separates hematopoietic progenitors with MC/eosinophil/erythroid/Mk potential (expressing GATA-1 in mice(7)) from those with monocyte/neutrophil/lymphocyte potential (not expressing GATA-1). However, approximately a third of pro-BMPs differentiated into monocytes and/or neutrophils, an observation that may, at first sight, appear contradictory to that model. Similar observations were previously reported for pre-BMPs (11) (although in our hands, using double sorting and liquid culture single cell assays, no monocyte/neutrophil potential was observed for pre-BMPs). Interestingly, we observed that a similar fraction of pro-BMPs (34%) did not express GATA-1-mCherry (Fig. 6C). Expression of GATA-1 in pro-BMPs may therefore separate clones with basophil and/or MC potential from those with monocyte and/or neutrophil potential.
The differentiation trajectory from hematopoietic stem cells to basophils and MCs has long been debated and has been complicated by the fact that no study so far has systematically analyzed the potential for basophils, MCs, erythrocytes, Mk, eosinophils, monocytes, and neutrophils at the single-cell level. Traditionally, differentiation trajectories have been elucidated by analyzing the multilineage potential of single progenitor cells. In our study, 7/522 clones tested in the myeloid conditions differentiated into both basophils and MCs, supporting that a small fraction of progenitors are bipotent. Similarly, 16/828 clones tested under erythroid/Mk favoring conditions differentiated into both erythroid and Mk cells. Rare bipotent MC and Mk clones were also observed (5/828), as previously reported in human CMPs(8) and GATA-2-overexpressing progenitors from SCL−/Δ mice(54). However, we did not observe bipotent MC and erythroid clones, nor combined MC/Ery/Mk potential at the single-cell level. These observations contrast with the frequent observation of MC/Ery/Mk combined potential in mouse GATA-1-expressing pre-GMs(7) and human CD131+ CMPs(8), suggesting that pro-BMPs are more differentiated than those progenitors. In addition, we detected rare clones with mixed potential toward the basophil and other myeloid lineages (6/522 clones with basophils and Ly6Chigh CD11b+ Ly6G− cells; 3/522 clones with eosinophils and Ly6Chigh CD11b+ Ly6G− cells; 4/522 clones with basophils, eosinophils and Ly6Chigh CD11b+ Ly6G− cells; and 1/522 clone with eosinophils, neutrophils and Ly6Chigh CD11b+ Ly6G− cells). Although eosinophil potential is likely underestimated in our study due to the suboptimal culture conditions for that lineage, our data support the concept that rare clones have neutrophil or monocyte potential in addition to basophil and/or eosinophil potential.
Therefore, our observations suggest that E-cadherin marks a continuum of hematopoietic progenitors typically enriched with basophil and MC fate, with subpopulations retaining potential for the neutrophil/monocyte and erythroid/megakaryocyte lineages. These data are compatible with the hematopoiesis landscape model previously proposed (55). In that model, low-primed undifferentiated hematopoietic stem and progenitor cells form a continuum from which unipotent progenitors emerge, as typically observed in scRNA-seq datasets. In this view, E-cadherin would be highly expressed on progenitors located right before the emergence of the MC and basophil branches from the continuum (and maintained in unipotent progenitors from these two lineages), thus explaining the ability of E-cadhigh progenitors to generate low numbers of erythroid/Mk or neutrophils/monocytes in addition to their major commitment to the MC and basophil lineages.
Using bulk RNA-seq, we demonstrated that pro-BMPs display a transcriptional profile consistent with their priming to the basophil/MC lineages. Single cell RNA-sequencing analyses may have helped to better dissect the heterogeneity of the pro-BMP population, and to discriminate the transcriptional signatures of clones committed to the basophil and MC lineages versus those committed to other fates. Nonetheless, bulk analyses were sufficient to identify a broad transcriptional signature in pro-BMPs that is enriched for genes specifically expressed in basophils, MCs, and their progenitors. We also found that the transcription factors GATA-1 and −2, involved in basophil and MC differentiation and functions (38, 39, 41), were enriched in pro-BMPs, pre-BMPs and basophils when compared with DN-GMPs. We demonstrated that in basophil and MC progenitors, E-cadherin expression was regulated by the transcription factor GATA-2, thus providing a mechanistic connection between the expression of E-cadherin and the commitment of early hematopoietic progenitors to the basophil and MC lineages.
Importantly, we report here that most basophil and MC progenitors can be identified and FACS-sorted based on the expression of a relatively specific marker, E-cadherin, circumventing the need for reporter strains. Although we investigated E-cadherin as a marker in this study, a number of ligands for E-cadherin have been described, including E-cadherin itself, but also the integrinα2β1 (56), integrinαEβ7 (57), and the Killer Cell Lectin Like Receptor G1(58). These ligands are expressed by multiple immune and non-immune cell subsets, suggesting that E-cadherin expression on basophils and MCs might be important for their ability to signal to multiple other cell types. Further studies are now required to identify the cell interactions mediated by E-cadherin in basophils, MCs, and their progenitors, and to understand how E-cadherin may modulate their signaling in health and disease.
Materials and Methods
Study design
The aim of this study was to investigate the expression of E-cadherin in the mouse hematopoietic system. We used public microarrays and single-cell RNA-sequencing datasets to query E-cadherin expression in the hematopoietic system and identified expression in the mouse basophil lineage. We used flow cytometry and RNA-sequencing analyses to characterize a new progenitor population characterized by a high commitment towards the basophil and MC lineages that we named “pro-BMPs”. Using genetic approaches, we demonstrated a role for GATA-2 in the regulation of E-cadherin expression in the mouse basophil and MC lineages. All data were collected from independent biological replicates, i.e., from different mice or cells isolated from different mice.
Mice
Wild-type (WT) C57BL/6 and B6.SJL-Ptprca Pepcb/BoyCrl mice were purchased from The Charles River Laboratory. Experiments were performed with 8-12 week-old mice. Short-term adoptive transfer experiments were performed by injecting in the tail vein 12,000 pro-BMPs or pre-BMPs FACS-sorted from C57BL/6 donor mice into B6.SJL- Ptprca Pepcb/BoyCrl recipients, pre-conditioned by a sublethal irradiation at 450 rads 6h before transplantation. Mice were housed in a sterile barrier facility and procedures were approved by the Institutional Animal Care and Use Committee at the Beth Israel Deaconess Medical Center and University of Alabama at Birmingham. Bone marrow cells from GATA-1low mice(45) and from GATA-2 inducible KO mice (Gata2f/f RosaYfp/Yfp TgCreErt2hemi and its control Gata2+/+ RosaYfp/Yfp TgCreErt2hemi)(40) were provided by Stuart Orkin and Hua Huang, respectively. The PU.1eYFP/GATA1mCherry mice(44) were housed and analyzed in Schroeder’s laboratory at ETH Zurich and animal experiments were approved according to Institutional guidelines of ETH Zurich and Swiss Federal Law by veterinary office of Canton Basel-Stadt, Switzerland (approval number 2655). GATA-2 Venus mice(50) were housed and bred by Dzierzak’s laboratory, in animal facilities at the University of Edinburgh, in compliance with the Home Office regulations. All procedures with animals were conducted by a Home Office UK Project License and approved by the University of Edinburgh Ethical Review Committee.
Flow cytometry (FC)
Single-cell suspensions from various organs were analyzed with an LSRII flow cytometer (BD Biosciences) and sorted using a FACSAria II (BD Biosciences). Phosphate buffered saline with 2% fetal bovine serum was used as a buffer at all times as the use of 2 mM EDTA interfered with the binding of the anti-E-cadherin antibody. Detailed procedures, antibodies and gating strategies are described in the Supplementary Material and Methods and Fig. S6–7.
qRT-PCR
RNA was extracted using TRIzol reagent (Thermo Fisher Scientific), reverse transcribed using the Transcriptor First Strand cDNA Synthesis Kit (Roche), and quantitatively assessed using Taq™ universal SYBR® Green (Bio-Rad) and a Rotor-Gene 6000 Real-time PCR machine (Corbett). For each sample, transcript levels of tested genes were normalized to RPL13A. Primers are listed in Supplementary Material and Methods.
Cell culture
Sorted cells were differentiated in StemSPAN SFEM (STEMCELL Technologies) supplemented with 10 ng/ml mIL-3, 10 ng/ml hIL-6, 10 ng/ml mM-CSF, 10 ng/ml mGM-CSF, 20 ng/ml mSCF, 50 ng/ml mFLT3 (all cytokines from Peprotech), and Pen-Strep (Gibco) (100U/mL) for the indicated period of time. For the single cell assay testing Mk and erythrocyte potential, single sorted cells were differentiated for 4 days, and bulk progenitors for 8 days, in StemSPAN SFEM supplemented with 10 ng/ml mIL-3, 10 ng/ml EPO, 20 ng/ml mSCF, 20 ng/ml TPO, 2 mM L-Glutamine and 1% Antibiotic-antimycotic (Gibco). When indicated, sorted cells were stimulated for 4h with 50 ng/ml phorbol 12-myristate 13-acetate (PMA) and 1 μM ionomycin (P&I) and the corresponding vehicles, crosslinked (CL) with 1 μg/ml IgE (D8406, Sigma) and 1 μg/ml anti-IgE (Clone R35-72, BD) or not crosslinked (NCL). Nucleofection of BaPs was performed 2 days post-plating using Amaxa Nucleofector kit L using Amaxa Nucleofector II program X-001 and 1 μM of siRNA against mouse GATA-2 (Dharmacon E-062114-00- 0005) or non-targeting control (Dharmacon D-001910-01-05). Following nucleofection, 900 ul of complete medium was added to cells, which were cultured for an additional 48h before analysis. For the induction of GATA-2 KO, sorted pre-BMPs were treated with 50 nM 4-hydroxytamoxifen (Sigma-Aldrich) for 5 days before analysis.
RNA-sequencing (RNA-seq)
The indicated FACS-sorted populations from 10-12-week-old C57BL/6 mice were lysed in TRIzol and RNA was isolated. Biological triplicates were prepared. RNA quality was assessed using Agilent 2100 Bioanalyzer (RIN ≥ 8.4 for all samples). Libraries were prepared using SmartSeq v4 (Takara) and Nextera XT DNA library kits (Illumina) and sequenced on a NextSeq 500 (Illumina) High flow cell (2x75). Data were deposited on Gene Expression Omnibus(59) under accession number GSE132122.
Bioinformatics analyses
Expression of E-cadherin was accessed via the Gene Expression Commons(16) (https://gexc.riken.jp/models/1038/genes/Cdh1?q=CDH1) and via the Immunological Genome Project(17) website for GSE15907 and GSE60101. For the Dahlin et al. (5) dataset, normalized counts for the Lin− c-Kit+ fraction were sourced from https://gottgens-lab.stemcells.cam.ac.uk/adultHSPC10X/. For the Tabula Muris Consortium(24), raw droplet counts were sourced from the mouse bone marrow compartment (GSM3040900 and GSM3040901). Detailed pipeline processing for scRNA-seq and bulk RNA-seq are described in Supplementary Material and Methods. Public GATA-2 ChIP-sequencing datasets were accessed using ChIP-Atlas(60) (http://chip-atlas.org) and visualized with Integrative Genomics Viewer(61).
Statistical analyses
Statistical analyses were performed using the Prism 7 Software. Depending on the data being compared, we used t-tests, one-way or two-way ANOVAs followed by multiple comparisons using the Tukey’s test or Dunnett’s as indicated in the Table S6. To ensure variance homogeneity, data presented in Fig. S5A–C were log10 transformed.
Supplementary Material
Table S1. Differentially expressed genes (false discovery rate < 0.05) between pro-BMPs and DN-GMPs (RNA-seq); Excel spreadsheet
Table S2. Differentially expressed genes (false discovery rate < 0.05) between pre-BMPs and DN-GMPs (RNA-seq); Excel spreadsheet
Table S3. Differentially expressed genes (false discovery rate < 0.05) between basophils and DN-GMPs (RNA-seq); Excel spreadsheet
Table S5. Genes associated with the indicated lineages for the calculation of cell probability scores; Excel spreadsheet
Table S4. Ingenuity Pathway Analysis of the upstream regulators of differentially expressed genes between pro-BMPs and DN-GMPs (related to Table S1); Excel spreadsheet
Table S6. Raw data file; Excel spreadsheet.
Supplementary Materials and Methods
Figure S1. Analysis of the Tabula Muris scRNA seq BM dataset.
Figure S2. E-cadherin is expressed in mouse peripheral blood and spleen basophils.
Figure S3. Expression of specific markers in basophils, MCs and their progenitor populations.
Figure S4. RNA-sequencing shows that pro BMPs are transcriptionally primed to the basophil and MC lineages.
Figure S5. Pro-BMPs express type 2 cytokines and the transcription factor GATA-2, which regulates E-cadherin expression in the basophil lineage.
Figure S6. Gating strategies for hematopoietic populations.
Figure S7. Analysis of GMP differentiation in culture.
Acknowledgments:
We thank Hua Huang and Yapeng Li (National Jewish Health, Denver, CO, USA) for sharing material from the inducible GATA-2 KO mouse, Stuart H. Orkin (Dana Farber and Boston Children’s Hospital, Boston, MA, USA) for sharing material from the GATA-1low mutant mouse strain and P.P. Pandolfi (BIDMC) for access to equipment. We thank also Samuel L. Wolock and Allon M. Klein (Department of Systems Biology, Harvard Medical School, Boston, MA, USA) for their help with the analyses of scRNA-seq datasets, the Bauer Core Facility at Harvard University for expertise in RNA-seq, the HSCI/Joslin flow cytometry facility for expertise in cell sorting.
Funding:
A.W. was supported by a fellowship from the Belgian American Education Foundation (BAEF) and a WBI.World scholarship from Wallonia-Brussels International (WBI). This work was supported by NIH grants P01HL131477 (D.G.T. and R.S.W.), 5P01CA66996 (D.G.T.), R35CA197697 (D.G.T.), R01AR067145, R01AI132494 (S.J.G.) and #CF-0003-11-04 and P30DK036836 (Joslin flow cytometry facility). M.B. was supported by a PhD Fellowship from the Italian Ministry of Education, University and Research. A.D.R. was supported by NIH/NCI Award Number R00CA188595, the Italian Association for Cancer Research (AIRC) and the Giovanni Armenise Harvard Foundation. N.A. and T.S. acknowledge support from SNF grant 179490. E.D. acknowledges support from ERC Advanced grant 341096 and Blood Cancer UK grant 18010. This research is supported by the Singapore Ministry of Health’s National Medical Research Council under its Singapore Translational Research (STaR) Investigator Award, and by the National Research Foundation Singapore and the Singapore Ministry of Education under its Research Centre of Excellence initiative.
Footnotes
Competing interests: The authors declare they have no competing interests.
Data and materials availability:
RNA-sequencing data from the pro-BMPs, pre-BMPs, DN-GMPs and basophil populations were deposited on Gene Expression Omnibus(59) under accession number GSE132122.
References:
- 1.Voehringer D, Protective and pathological roles of mast cells and basophils. Nat Rev Immunol 13, 362–375 (2013). [DOI] [PubMed] [Google Scholar]
- 2.Chen CC, Grimbaldeston MA, Tsai M, Weissman IL, Galli SJ, Identification of mast cell progenitors in adult mice. Proc Natl Acad Sci U S A 102, 11408–11413 (2005). [DOI] [PMC free article] [PubMed] [Google Scholar]
- 3.Arinobu Y et al. , Developmental checkpoints of the basophil/mast cell lineages in adult murine hematopoiesis. Proc Natl Acad Sci U S A 102, 18105–18110 (2005). [DOI] [PMC free article] [PubMed] [Google Scholar]
- 4.Mukai K et al. , Critical role of P1-Runx1 in mouse basophil development. Blood 120, 76–85 (2012). [DOI] [PMC free article] [PubMed] [Google Scholar]
- 5.Dahlin JS et al. , A single-cell hematopoietic landscape resolves 8 lineage trajectories and defects in Kit mutant mice. Blood 131, e1–e11 (2018). [DOI] [PMC free article] [PubMed] [Google Scholar]
- 6.Franco CB, Chen CC, Drukker M, Weissman IL, Galli SJ, Distinguishing mast cell and granulocyte differentiation at the single-cell level. Cell Stem Cell 6, 361–368 (2010). [DOI] [PMC free article] [PubMed] [Google Scholar]
- 7.Drissen R et al. , Distinct myeloid progenitor-differentiation pathways identified through single-cell RNA sequencing. Nat Immunol 17, 666–676 (2016). [DOI] [PMC free article] [PubMed] [Google Scholar]
- 8.Drissen R, Thongjuea S, Theilgaard-Monch K, Nerlov C, Identification of two distinct pathways of human myelopoiesis. Sci Immunol 4, (2019). [DOI] [PubMed] [Google Scholar]
- 9.Martin DI, Zon LI, Mutter G, Orkin SH, Expression of an erythroid transcription factor in megakaryocytic and mast cell lineages. Nature 344, 444–447 (1990). [DOI] [PubMed] [Google Scholar]
- 10.Grootens J et al. , CD203c distinguishes the erythroid and mast cell-basophil differentiation trajectories among human FcepsilonRI(+) bone marrow progenitors. Allergy 75, 211–214 (2020). [DOI] [PMC free article] [PubMed] [Google Scholar]
- 11.Qi X et al. , Antagonistic regulation by the transcription factors C/EBPalpha and MITF specifies basophil and mast cell fates. Immunity 39, 97–110 (2013). [DOI] [PMC free article] [PubMed] [Google Scholar]
- 12.Ahmed N et al. , A Novel GATA2 Protein Reporter Mouse Reveals Hematopoietic Progenitor Cell Types. Stem Cell Reports 15, 326–339 (2020). [DOI] [PMC free article] [PubMed] [Google Scholar]
- 13.van Roy F, Berx G, The cell-cell adhesion molecule E-cadherin. Cell Mol Life Sci 65, 3756–3788 (2008). [DOI] [PMC free article] [PubMed] [Google Scholar]
- 14.Greco M et al. , Promoter methylation of DAPK1, E-cadherin and thrombospondin-1 in de novo and therapy-related myeloid neoplasms. Blood Cells Mol Dis 45, 181–185 (2010). [DOI] [PubMed] [Google Scholar]
- 15.Gazit R et al. , Transcriptome analysis identifies regulators of hematopoietic stem and progenitor cells. Stem Cell Reports 1, 266–280 (2013). [DOI] [PMC free article] [PubMed] [Google Scholar]
- 16.Seita J et al. , Gene Expression Commons: an open platform for absolute gene expression profiling. PLoS One 7, e40321 (2012). [DOI] [PMC free article] [PubMed] [Google Scholar]
- 17.Heng TS, Painter MW, C. Immunological Genome Project, The Immunological Genome Project: networks of gene expression in immune cells. Nat Immunol 9, 1091–1094 (2008). [DOI] [PubMed] [Google Scholar]
- 18.Lara-Astiaso D et al. , Immunogenetics. Chromatin state dynamics during blood formation. Science 345, 943–949 (2014). [DOI] [PMC free article] [PubMed] [Google Scholar]
- 19.Ugajin T et al. , Basophils preferentially express mouse Mast Cell Protease 11 among the mast cell tryptase family in contrast to mast cells. J Leukoc Biol 86, 1417–1425 (2009). [DOI] [PubMed] [Google Scholar]
- 20.Tschopp CM et al. , Granzyme B, a novel mediator of allergic inflammation: its induction and release in blood basophils and human asthma. Blood 108, 2290–2299 (2006). [DOI] [PubMed] [Google Scholar]
- 21.Poorafshar M, Helmby H, Troye-Blomberg M, Hellman L, MMCP-8, the first lineage-specific differentiation marker for mouse basophils. Elevated numbers of potent IL-4-producing and MMCP-8-positive cells in spleens of malaria-infected mice. Eur J Immunol 30, 2660–2668 (2000). [DOI] [PubMed] [Google Scholar]
- 22.Metzger H, Goetze A, Kanellopoulos J, Holowka D, Fewtrell C, Structure of the high-affinity mast cell receptor for IgE. Fed Proc 41, 8–11 (1982). [PubMed] [Google Scholar]
- 23.Dwyer DF, Barrett NA, Austen KF, C. Immunological Genome Project, Expression profiling of constitutive mast cells reveals a unique identity within the immune system. Nat Immunol 17, 878–887 (2016). [DOI] [PMC free article] [PubMed] [Google Scholar]
- 24.Tabula Muris C et al. , Single-cell transcriptomics of 20 mouse organs creates a Tabula Muris. Nature 562, 367–372 (2018). [DOI] [PMC free article] [PubMed] [Google Scholar]
- 25.Serafin WE, Dayton ET, Gravallese PM, Austen KF, Stevens RL, Carboxypeptidase A in mouse mast cells. Identification, characterization, and use as a differentiation marker. J Immunol 139, 3771–3776 (1987). [PubMed] [Google Scholar]
- 26.Voehringer D, Shinkai K, Locksley RM, Type 2 immunity reflects orchestrated recruitment of cells committed to IL-4 production. Immunity 20, 267–277 (2004). [DOI] [PubMed] [Google Scholar]
- 27.Voehringer D, Rosen DB, Lanier LL, Locksley RM, CD200 receptor family members represent novel DAP12-associated activating receptors on basophils and mast cells. J Biol Chem 279, 54117–54123 (2004). [DOI] [PubMed] [Google Scholar]
- 28.Bi E et al. , E-cadherin expression on multiple myeloma cells activates tumor-promoting properties in plasmacytoid DCs. J Clin Invest 128, 4821–4831 (2018). [DOI] [PMC free article] [PubMed] [Google Scholar]
- 29.Tusi BK et al. , Population snapshots predict early haematopoietic and erythroid hierarchies. Nature 555, 54–60 (2018). [DOI] [PMC free article] [PubMed] [Google Scholar]
- 30.Sugo T et al. , Identification of a lysophosphatidylserine receptor on mast cells. Biochem Biophys Res Commun 341, 1078–1087 (2006). [DOI] [PubMed] [Google Scholar]
- 31.Moritz DR, Rodewald HR, Gheyselinck J, Klemenz R, The IL-1 receptor-related T1 antigen is expressed on immature and mature mast cells and on fetal blood mast cell progenitors. J Immunol 161, 4866–4874 (1998). [PubMed] [Google Scholar]
- 32.Pardo J et al. , Granzyme B is expressed in mouse mast cells in vivo and in vitro and causes delayed cell death independent of perforin. Cell Death Differ 14, 1768–1779 (2007). [DOI] [PubMed] [Google Scholar]
- 33.Dai X et al. , Ablation of Neuropilin 1 in Myeloid Cells Exacerbates High-Fat Diet-Induced Insulin Resistance Through Nlrp3 Inflammasome In Vivo. Diabetes 66, 2424–2435 (2017). [DOI] [PMC free article] [PubMed] [Google Scholar]
- 34.Tordjman R et al. , A neuronal receptor, neuropilin-1, is essential for the initiation of the primary immune response. Nat Immunol 3, 477–482 (2002). [DOI] [PubMed] [Google Scholar]
- 35.Bouchon A, Hernandez-Munain C, Cella M, Colonna M, A DAP12-mediated pathway regulates expression of CC chemokine receptor 7 and maturation of human dendritic cells. J Exp Med 194, 1111–1122 (2001). [DOI] [PMC free article] [PubMed] [Google Scholar]
- 36.Chung DH, Seaman WE, Daws MR, Characterization of TREM-3, an activating receptor on mouse macrophages: definition of a family of single Ig domain receptors on mouse chromosome 17. Eur J Immunol 32, 59–66 (2002). [DOI] [PubMed] [Google Scholar]
- 37.Yuk CM et al. , Basophil-derived IL-6 regulates TH17 cell differentiation and CD4 T cell immunity. Sci Rep 7, 41744 (2017). [DOI] [PMC free article] [PubMed] [Google Scholar]
- 38.Migliaccio AR et al. , GATA-1 as a regulator of mast cell differentiation revealed by the phenotype of the GATA-1low mouse mutant. J Exp Med 197, 281–296 (2003). [DOI] [PMC free article] [PubMed] [Google Scholar]
- 39.Nei Y et al. , GATA-1 regulates the generation and function of basophils. Proc Natl Acad Sci U S A 110, 18620–18625 (2013). [DOI] [PMC free article] [PubMed] [Google Scholar]
- 40.Li Y, Qi X, Liu B, Huang H, The STAT5-GATA2 pathway is critical in basophil and mast cell differentiation and maintenance. J Immunol 194, 4328–4338 (2015). [DOI] [PMC free article] [PubMed] [Google Scholar]
- 41.Tsai FY, Orkin SH, Transcription factor GATA-2 is required for proliferation/survival of early hematopoietic cells and mast cell formation, but not for erythroid and myeloid terminal differentiation. Blood 89, 3636–3643 (1997). [PubMed] [Google Scholar]
- 42.Yan W, Cao QJ, Arenas RB, Bentley B, Shao R, GATA3 inhibits breast cancer metastasis through the reversal of epithelial-mesenchymal transition. J Biol Chem 285, 14042–14051 (2010). [DOI] [PMC free article] [PubMed] [Google Scholar]
- 43.Gao H, Wu X, Fossett N, Drosophila E-cadherin functions in hematopoietic progenitors to maintain multipotency and block differentiation. PLoS One 8, e74684 (2013). [DOI] [PMC free article] [PubMed] [Google Scholar]
- 44.Hoppe PS et al. , Early myeloid lineage choice is not initiated by random PU.1 to GATA1 protein ratios. Nature 535, 299–302 (2016). [DOI] [PubMed] [Google Scholar]
- 45.McDevitt MA, Fujiwara Y, Shivdasani RA, Orkin SH, An upstream, DNase I hypersensitive region of the hematopoietic-expressed transcription factor GATA-1 gene confers developmental specificity in transgenic mice. Proc Natl Acad Sci U S A 94, 7976–7981 (1997). [DOI] [PMC free article] [PubMed] [Google Scholar]
- 46.Calero-Nieto FJ et al. , Key regulators control distinct transcriptional programmes in blood progenitor and mast cells. EMBO J 33, 1212–1226 (2014). [DOI] [PMC free article] [PubMed] [Google Scholar]
- 47.Stemmler MP, Hecht A, Kemler R, E-cadherin intron 2 contains cis-regulatory elements essential for gene expression. Development 132, 965–976 (2005). [DOI] [PubMed] [Google Scholar]
- 48.Li L et al. , Nuclear adaptor Ldb1 regulates a transcriptional program essential for the maintenance of hematopoietic stem cells. Nat Immunol 12, 129–136 (2011). [DOI] [PMC free article] [PubMed] [Google Scholar]
- 49.May G et al. , Dynamic analysis of gene expression and genome-wide transcription factor binding during lineage specification of multipotent progenitors. Cell Stem Cell 13, 754–768 (2013). [DOI] [PMC free article] [PubMed] [Google Scholar]
- 50.Kaimakis P et al. , Functional and molecular characterization of mouse Gata2-independent hematopoietic progenitors. Blood 127, 1426–1437 (2016). [DOI] [PMC free article] [PubMed] [Google Scholar]
- 51.Spilsbury K et al. , Isolation of a novel macrophage-specific gene by differential cDNA analysis. Blood 85, 1620–1629 (1995). [PubMed] [Google Scholar]
- 52.Pellin D et al. , A comprehensive single cell transcriptional landscape of human hematopoietic progenitors. Nat Commun 10, 2395 (2019). [DOI] [PMC free article] [PubMed] [Google Scholar]
- 53.Tegoshi T et al. , E-cadherin and cadherin-associated cytoplasmic proteins are expressed in murine mast cells. Lab Invest 80, 1571–1581 (2000). [DOI] [PubMed] [Google Scholar]
- 54.Salmon JM et al. , Aberrant mast-cell differentiation in mice lacking the stem-cell leukemia gene. Blood 110, 3573–3581 (2007). [DOI] [PubMed] [Google Scholar]
- 55.Grootens J, Ungerstedt JS, Nilsson G, Dahlin JS, Deciphering the differentiation trajectory from hematopoietic stem cells to mast cells. Blood Adv 2, 2273–2281 (2018). [DOI] [PMC free article] [PubMed] [Google Scholar]
- 56.Whittard JD et al. , E-cadherin is a ligand for integrin alpha2beta1. Matrix Biol 21, 525–532 (2002). [DOI] [PubMed] [Google Scholar]
- 57.Cavallaro U, Christofori G, Cell adhesion and signalling by cadherins and Ig-CAMs in cancer. Nat Rev Cancer 4, 118–132 (2004). [DOI] [PubMed] [Google Scholar]
- 58.Ito M et al. , Killer cell lectin-like receptor G1 binds three members of the classical cadherin family to inhibit NK cell cytotoxicity. J Exp Med 203, 289–295 (2006). [DOI] [PMC free article] [PubMed] [Google Scholar]
- 59.Edgar R, Domrachev M, Lash AE, Gene Expression Omnibus: NCBI gene expression and hybridization array data repository. Nucleic Acids Res 30, 207–210 (2002). [DOI] [PMC free article] [PubMed] [Google Scholar]
- 60.Oki S et al. , ChIP-Atlas: a data-mining suite powered by full integration of public ChIP-seq data. EMBO Rep 19, (2018). [DOI] [PMC free article] [PubMed] [Google Scholar]
- 61.Robinson JT et al. , Integrative genomics viewer. Nat Biotechnol 29, 24–26 (2011). [DOI] [PMC free article] [PubMed] [Google Scholar]
- 62.Lun AT, McCarthy DJ, Marioni JC, A step-by-step workflow for low-level analysis of single-cell RNA-seq data with Bioconductor. F1000Res 5, 2122 (2016). [DOI] [PMC free article] [PubMed] [Google Scholar]
- 63.Weinreb C, Wolock S, Klein AM, SPRING: a kinetic interface for visualizing high dimensional single-cell expression data. Bioinformatics 34, 1246–1248 (2018). [DOI] [PMC free article] [PubMed] [Google Scholar]
- 64.Wolock SL, Lopez R, Klein AM, Scrublet: computational identification of cell doublets in single-cell transcriptomic data. bioRxiv, 357368 (2018). [DOI] [PMC free article] [PubMed] [Google Scholar]
- 65.Lun AT, Bach K, Marioni JC, Pooling across cells to normalize single-cell RNA sequencing data with many zero counts. Genome Biol 17, 75 (2016). [DOI] [PMC free article] [PubMed] [Google Scholar]
- 66.Robinson MD, McCarthy DJ, Smyth GK, edgeR: a Bioconductor package for differential expression analysis of digital gene expression data. Bioinformatics 26, 139–140 (2010). [DOI] [PMC free article] [PubMed] [Google Scholar]
- 67.McCarthy DJ, Chen Y, Smyth GK, Differential expression analysis of multifactor RNA-Seq experiments with respect to biological variation. Nucleic Acids Res 40, 4288–4297 (2012). [DOI] [PMC free article] [PubMed] [Google Scholar]
- 68.Benjamini Y, Drai D, Elmer G, Kafkafi N, Golani I, Controlling the false discovery rate in behavior genetics research. Behav Brain Res 125, 279–284 (2001). [DOI] [PubMed] [Google Scholar]
- 69.Kolde R, pheatmap: Pretty Heatmaps. R package version 1.0.12. , (2019). [Google Scholar]
- 70.Bolger AM, Lohse M, Usadel B, Trimmomatic: a flexible trimmer for Illumina sequence data. Bioinformatics 30, 2114–2120 (2014). [DOI] [PMC free article] [PubMed] [Google Scholar]
- 71.Dobin A et al. , STAR: ultrafast universal RNA-seq aligner. Bioinformatics 29, 15–21 (2013). [DOI] [PMC free article] [PubMed] [Google Scholar]
- 72.Ramirez F, Dundar F, Diehl S, Gruning BA, Manke T, deepTools: a flexible platform for exploring deep-sequencing data. Nucleic Acids Res 42, W187–191 (2014). [DOI] [PMC free article] [PubMed] [Google Scholar]
- 73.Wang L, Wang S, Li W, RSeQC: quality control of RNA-seq experiments. Bioinformatics 28, 2184–2185 (2012). [DOI] [PubMed] [Google Scholar]
- 74.Anders S, Pyl PT, Huber W, HTSeq--a Python framework to work with high-throughput sequencing data. Bioinformatics 31, 166–169 (2015). [DOI] [PMC free article] [PubMed] [Google Scholar]
- 75.Zhang J et al. , Characterization of Siglec-H as a novel endocytic receptor expressed on murine plasmacytoid dendritic cell precursors. Blood 107, 3600–3608 (2006). [DOI] [PubMed] [Google Scholar]
- 76.Blasius AL et al. , Bone marrow stromal cell antigen 2 is a specific marker of type I IFN-producing cells in the naive mouse, but a promiscuous cell surface antigen following IFN stimulation. J Immunol 177, 3260–3265 (2006). [DOI] [PubMed] [Google Scholar]
- 77.Cisse B et al. , Transcription factor E2-2 is an essential and specific regulator of plasmacytoid dendritic cell development. Cell 135, 37–48 (2008). [DOI] [PMC free article] [PubMed] [Google Scholar]
- 78.Hadeiba H et al. , CCR9 expression defines tolerogenic plasmacytoid dendritic cells able to suppress acute graft-versus-host disease. Nat Immunol 9, 1253–1260 (2008). [DOI] [PMC free article] [PubMed] [Google Scholar]
- 79.Dursun E et al. , Continuous single cell imaging reveals sequential steps of plasmacytoid dendritic cell development from common dendritic cell progenitors. Sci Rep 6, 37462 (2016). [DOI] [PMC free article] [PubMed] [Google Scholar]
- 80.Esashi E, Bao M, Wang YH, Cao W, Liu YJ, PACSIN1 regulates the TLR7/9-mediated type I interferon response in plasmacytoid dendritic cells. Eur J Immunol 42, 573–579 (2012). [DOI] [PMC free article] [PubMed] [Google Scholar]
- 81.Tamura T et al. , IFN regulatory factor-4 and -8 govern dendritic cell subset development and their functional diversity. J Immunol 174, 2573–2581 (2005). [DOI] [PubMed] [Google Scholar]
- 82.Esashi E et al. , The signal transducer STAT5 inhibits plasmacytoid dendritic cell development by suppressing transcription factor IRF8. Immunity 28, 509–520 (2008). [DOI] [PMC free article] [PubMed] [Google Scholar]
- 83.Sawai CM et al. , Transcription factor Runx2 controls the development and migration of plasmacytoid dendritic cells. J Exp Med 210, 2151–2159 (2013). [DOI] [PMC free article] [PubMed] [Google Scholar]
Associated Data
This section collects any data citations, data availability statements, or supplementary materials included in this article.
Supplementary Materials
Table S1. Differentially expressed genes (false discovery rate < 0.05) between pro-BMPs and DN-GMPs (RNA-seq); Excel spreadsheet
Table S2. Differentially expressed genes (false discovery rate < 0.05) between pre-BMPs and DN-GMPs (RNA-seq); Excel spreadsheet
Table S3. Differentially expressed genes (false discovery rate < 0.05) between basophils and DN-GMPs (RNA-seq); Excel spreadsheet
Table S5. Genes associated with the indicated lineages for the calculation of cell probability scores; Excel spreadsheet
Table S4. Ingenuity Pathway Analysis of the upstream regulators of differentially expressed genes between pro-BMPs and DN-GMPs (related to Table S1); Excel spreadsheet
Table S6. Raw data file; Excel spreadsheet.
Supplementary Materials and Methods
Figure S1. Analysis of the Tabula Muris scRNA seq BM dataset.
Figure S2. E-cadherin is expressed in mouse peripheral blood and spleen basophils.
Figure S3. Expression of specific markers in basophils, MCs and their progenitor populations.
Figure S4. RNA-sequencing shows that pro BMPs are transcriptionally primed to the basophil and MC lineages.
Figure S5. Pro-BMPs express type 2 cytokines and the transcription factor GATA-2, which regulates E-cadherin expression in the basophil lineage.
Figure S6. Gating strategies for hematopoietic populations.
Figure S7. Analysis of GMP differentiation in culture.
Data Availability Statement
RNA-sequencing data from the pro-BMPs, pre-BMPs, DN-GMPs and basophil populations were deposited on Gene Expression Omnibus(59) under accession number GSE132122.