

Abstract
The cornea is covered by a stratified epithelium that is renewed by stem cells located in the peripheral region of the cornea known as the limbus. This stroma of the limbus contains stromal keratocytes that, when expanded in culture, are termed limbal fibroblasts (LFs). It is thought that LFs exhibit similar characteristics to bone marrow mesenchymal stem cells (BM MSCs) and help maintain the epithelial stem cell phenotype in the limbal region. In this study, we aimed at reprogramming SSEA4+ LFs and BM MSCs into corneal epithelial lineage by using a 3-dimensional culture system and embryonic stem cell medium. After enrichment, SSEA4+ cells showed a higher level of stem cell marker expression such as Sox2, Oct4, Nanog, Rex1, ABCG2, and TRA-1-60, and colony forming efficiency than did SSEA4− cells. SSEA4+, as compared to SSEA4− cells, had a greater propensity to form spheres that, in turn, were induced into ectodermal lineage and further differentiated into functional corneal epithelium. Results show that LFs were similar to BM MSCs in marker profiles, and together with the differences noted between SSEA4+ and SSEA4− cells, point to LFs’ being tissue-specific MSCs. However, LFs showed a greater potential for differentiation into corneal epithelium, indicating the potential importance of tissue-specific adult progenitors in their reprogramming capacity into cells of interest. This study opens a new avenue for investigating the molecular mechanism involved in maintaining a limbal stem cell niche and thus a potentially important clinical application to treat corneal epithelial stem cell loss.
Keywords: Limbal fibroblasts, bone marrow mesenchymal stem cells, stage-specific embryonic antigen-4, corneal epithelial stem cells, limbal niche
INTRODUCTION
The cornea is the transparent window of the ocular surface. It consists primarily of three layers: an outer layer of stratified epithelium, a middle stromal layer of collagen-rich extracellular matrix interspersed with fibroblasts and an inner layer of endothelial cells [1]. The limbus of the eye, which is located at the junction of the cornea and conjunctiva represents a unique microenvironment, containing blood vessels and melanocytes, and housing limbal epithelial stem cells (LESCs) [2]. LESCs are adult stem cells that serve as a lifelong source of corneal epithelium. It has been shown that limbal fibroblasts (LFs) are located in close proximity to LESCs and exhibit mesenchymal stem cells (MSCs) characteristics that help maintain the epithelial stem cell phenotype [3]. In support of this, LFs have been shown to express markers such as CD105, CD106, CD54, CD166, CD90, CD29, and CD71; these are also commonly expressed by MSCs taken from bone marrow (BM MSCs) [3]. Therefore, some investigators consider LFs equivalent to MSCs and regard them as multipotent [3–5]. MSC-like LFs are known for their potency and plasticity [6] and have been shown to have some capacity to regenerate corneal epithelium during wounding [7–9]. Nevertheless, it is still not clear whether LFs situated in close proximity to LESCs have a potential to differentiate into a corneal epithelial phenotype, thus providing an alternate source of LESCs, which are known to be depleted in the most severe and common causes of corneal blindness.
This is the first study investigating the role of MSCs as compared to LFs in corneal epithelial homeostasis. In previous studies, stage-specific embryonic antigen-4 (SSEA4) has been shown to be specific to early embryonic development and described as an embryonic stem cell marker [10, 11]. Furthermore, it has been used for isolation of MSCs from whole bone marrow aspirates and, following their induction, used for differentiation into fat, cartilage and bone lineages [12]. On a similar note, a study by Dravida et al. evaluated the multipotency of SSEA4+ tissue-specific cells by detecting the expression of stem cell markers and the ability of SSEA4+ corneal stromal cells to differentiate into ectoderm, mesoderm, and endoderm lineages [13]. Based on the above findings, we sought to investigate the role of SSEA4+ in maintenance of LF and BM MSC stem cell characteristics and differentiation potential into an epithelial phenotype by developing a 3-dimensional (3D) culture system that potentially simulates the limbal microenvironment. Herein, we show that SSEA4+ cells have a greater capacity than SSEA4− cells to express stem cell markers, which are necessary to maintain a cellular undifferentiated state and, upon induction, differentiate into corneal epithelial cells. Moreover, LFs behave similarly to BM MSCs, but exhibit certain advantages in potential reprogramming into corneal phenotype.
MATERIALS AND METHODS
The study was approved by the Institutional Review Boards of the Schepens Eye Research Institute, Massachusetts Eye and Ear, Boston, MA.
Media and Cell Culture
KnockOut embryonic stem cell/induced pluripotent cell medium (KnockOut ESC/iPSC) with 1% nonessential amino acids, 1% penicillin-streptomycin, 1% L-glutamine, 10 ng/ml Leukemia inhibitory factor (LIF) and 4 ng/ml Human Fibroblast Growth Factor-Basic (bFGF) (all from Invitrogen; Carlsbad, CA, http://www.invitrogen.com), was used as enrichment medium for LFs and BM MSCs. Induction medium consisted of low-glucose, low-calcium Dulbecco’s Modified Eagle’s Medium (DMEM) without pyruvate, 25 ng/ml human recombinant bone morphogenetic protein-4 (BMP-4; R&D Systems; Abingdon, UK) 1 μM all-trans retinoic acid (RA) (Sigma-Aldrich, St. Louis, http://www.sigmaaldrich.com), 10 ng/ml recombinant human epidermal growth factor (EGF) (Sigma Aldrich). Differentiation medium consisted of 3 parts low-glucose DMEM with pyruvate and 1 part Ham’s F12 medium, 5% FCS (HyClone; Rockford, IL, http://www.thermoscientific.com), 1% penicillin-streptomycin, 500 ng/ml hydrocortisone (Sigma-Aldrich), 5 μg/ml insulin (Sigma-Aldrich), 2 nM tri-iodothyronine (Sigma-Aldrich), adenine (Sigma-Aldrich), and 10 ng/ml recombinant human EGF (Sigma-Aldrich). All media were filter sterilized using a 0.22-μm filter (Millipore; Billerica, MA, http://www.millipore.com) and stored at 4°C.
Isolation of Limbal Fibroblasts (LFs)
Human corneoscleral rims from donors younger than 50 years were obtained from discarded tissue after keratoplasties performed at the MEEI. The removal of limbal epithelial sheets was performed as previously described [14]. In short, after corneoscleral tissue was rinsed with Hanks’ balanced salt solution, the sclera, conjunctiva, iris, trabecular meshwork, and corneal endothelium were removed. Then the limbal tissue was cut into 3-clock-hour segments and placed in 1.2 IU of Dispase II (Invitrogen) for 1 hour at 37°C. Intact epithelial sheets were removed from stroma and de-epithelialized stroma was further digested with 0.025% Trypsin/EDTA (Invitrogen) for 30 minutes at 37°C to yield single cells. Stromal cell suspension was then filtered with 70 μm nylon filter, and cells were resuspended in KnockOut ESC/iPSC medium on thin-coated Matrigel 6 well plates (BD Labware; Bedford, MA, http://www.bd.com) for 12–15 days (Fig. 1).
Figure 1:
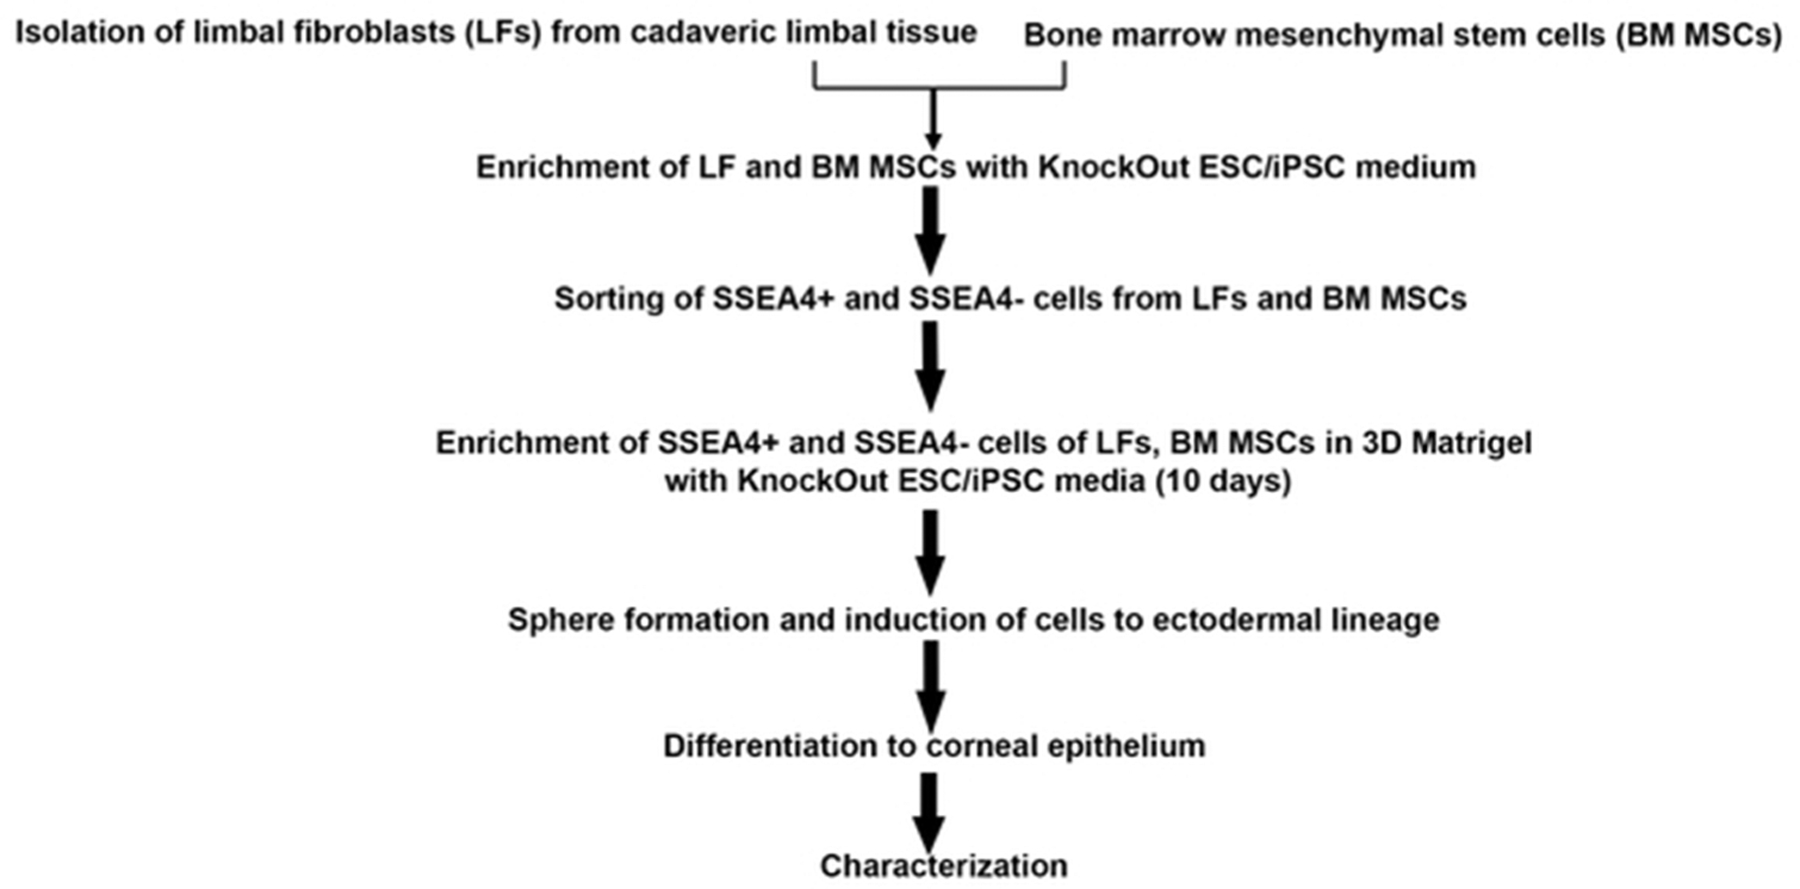
Isolation, characterization and differentiation of limbal fibroblasts (LFs) and bone marrow mesenchymal stem cells (BM MSCs). Systematic flow chart shows the procedures used to derive cells, enrich the cells and prompt them to differentiate.
Bone Marrow Mesenchymal Stem Cells (BM MSCs)
Human bone marrow-derived MSCs were obtained from Dr. Myriam Armant at the Center for Human Cell Therapy, Boston, MA. BM MSCs were plated in T175 flasks in growth media consisting of α-MEM (Lonza; Walkersville, MD, http://www.lonza.com) supplemented with 2 mM GlutaMax (Invitrogen), 10% FBS and 5 ng/ml of bFGF. After 2 days of growth, KnockOut ESC/iPSC medium was used for the remaining 6 days (Fig. 1).
Sorting of SSEA4+ and SSEA4− LFs and BM MSCs
After enrichment with stem cell medium, the LFs and BM MSCs were treated with 0.25% Trypsin-EDTA, resuspended in PBS at a concentration of 5×10⁴ cells/μl and incubated with 1 μl of anti-SSEA4 antibody (R&D Systems Inc., Minneapolis, http://www.rndsystems.com) for 30 minutes at 4°C (Fig. 1). The cells were then washed twice with PBS to remove unbound antibody and the cell suspension was incubated with 10 μl of magnetic beads tagged with goat anti-mouse IgG (Miltenyi Biotech, Auburn, CA, https://www.miltenyibiotec.com) for 20 minutes at 4°C. The cell suspension was then subjected to magnetic-activated cell sorting columns (Miltenyi Biotech) for separation. The SSEA4+ and SSEA4− fractions of LFs and BM MSCs were replated every 5–6 days with KnockOut ESC/iPSC culture medium at a dilution of 1:3, under similar culture conditions. At each passage, population-doubling time was measured using this formula: number of cell doublings (NCD) = log10(y/x)/log102, where y is the final density of the cells and x is the initial seeding density of the cells.
Flow Cytometry of SSEA4+ and SSEA4− Cells
Flow cytometric analysis of LFs and BM MSCs was performed pre- and post-sorting with anti-SSEA4 antibody. A cell suspension of LFs and BM MSCs was obtained by trypsinization and centrifugation (all centrifugation steps were performed for 3 minutes at 1,000 rpm). The cell pellet was resuspended in 100 μl of FACS Permeabilizing Solution 2 (BD Biosciences; San Diego, CA, http://www.bdbiosciences.com), followed by resuspension in 1 ml 5% BSA in PBS and, finally, resuspension in 500 μl of SSEA4 (R&D Systems Inc.) primary antibody in PBS for 30 minutes at 4°C (1:200). After centrifugation, the cell pellet was resuspended in 500 μl of Alexa Fluor 488 goat anti-mouse (Invitrogen) in PBS (1:1000) for 30 minutes at 4°C. The samples were then run through FACSCalibur flow cytometer (BD Biosciences), and results were analyzed using Summit v4.3 software (Beckman Coulter, Inc., Danvers MA, https://www.beckmancoulter.com). An isotype control was used as a negative control where the primary antibody was omitted, and non-specific mouse monoclonal IgG (Millipore) was used as a secondary antibody.
Matrigel Culture
Matrigel (BD Biosciences) solution was diluted in DMEM, and different thicknesses were prepared as previously described [15]. For thin-coating, 200 μl/cm2 of 5% Matrigel was added to culture plates, and for the 3D culture system, 200 μl/cm2 of 50% Matrigel was added and incubated at 37°C/5% CO2 for 1 hour. For enrichment and maintenance of cells in the undifferentiated state, sorted SSEA4+ and SSEA4− LFs and BM MSCs were plated on 3D Matrigel with a density of 5 × 10⁴/cm2 in KnockOut ESC/iPSC media. Subsequently, differentiation of LFs and BM MSCs was performed on thin-coated Matrigel cell culture inserts (BD Falco; San Diego, CA, http://www.bdbiosciences.com) with seeding density of 1,000 to 1,200 cells/cm2.
Preparation of Human Amniotic Membrane
Cryopreserved human amniotic membrane (hAM) pieces were obtained from North West Tissue Center (Seattle,WA). hAM was denuded by adding 250 μl of 0.25% trypsin-EDTA (Invitrogen) for 15 minutes at 37°C followed by gentle scraping of epithelial cells with cell scraper (BD Biosciences). hAM after de-epithelialization was termed as denuded amniotic membrane (dAM). The dAM was then thoroughly washed with PBS and laid on a 24 mm culture insert (Corning Inc., Corning, NY, www.corning.com).
Sphere Formation, Induction, and Differentiation of SSEA4+ and SSEA4− Cells
SSEA4+ and SSEA4− single-cell suspensions were seeded onto uncoated bacteriological plates at a density of 5×10⁴/cm2 with KnockOut ESC/iPSC medium without serum. Sphere formation was noted within 48 hours and monitored with phase-contract microscopy up to 7 days of culture. Dividing cells in spheres were labeled with 1:100 dilution of BrdU from concentrate (Invitrogen) according to manufacturer’s protocol and incubated at 37°C in CO2 for 2 hours. Spheres were fixed with 80% cold ethanol and were observed under Nikon TE300 fluorescence microscope (Supplementary Fig. S1).
All spheres at day 7 were treated with induction medium consisting of RA, BMP-4 and EGF for 4 days at 37°C in 5% CO2. After induction, spheres were dissociated into a single cell suspension by treatment with 0.025% Trypsin/EDTA for 10 minutes. The cells were then centrifugated, suspended in differentiation medium, and seeded onto thin-coated Matrigel culture inserts at a density of 1,000 to 1,200 cells/cm2 and incubated at 37°C in 5% CO2 for 9 days. For cell sheet formation, induced LFs and BM MSCs were seeded onto dAM at density of 500– 600 cells/cm2 and incubated at 37°C in 5% CO2 for 12 days. Cell growth was monitored with phase contrast light microscopy (Olympus 1×51 with DP12 Digital Microscope Camera; Melville, NY, http://www.olympusamerica.com) (Fig. 1).
Immunohistochemistry
Immunohistochemistry was performed as previously described [14]. Briefly, cells were fixed with cold methanol and acetone (1:1 ratio), permeabilized with 0.2% Triton X-100 (Sigma-Aldrich) (except for SSEA4 antibody), blocked with 5% BSA for 1 hour, and incubated with primary and secondary antibodies (Supplementary Table 1) overnight at 4°C. An isotype control was used as a negative control where the primary antibody was omitted, and non-specific mouse monoclonal IgG (Millipore) was used instead. The nuclei were stained with 100 μg/l propidium iodide (PI) (Invitrogen) for 2 minutes, or counterstaining with 4, 6-diamidino-2-phenylindole (DAPI; Vectashield; Vector Laboratories, Burlingame, CA, http://www.vectorlabs.com), and the slides were mounted with SlowFade Gold antifade reagent (Invitrogen). Images were obtained with a laser scanning confocal microscope (Leica TCS 4D; Lasertechnik, Heidelberg, Germany, http://www.leica-microsystems.com). For each sample, high-resolution images in Z-stacks were collected and final image obtained by reconstruction of all stacks with Leica LAS AF Lite software (Leica, Heidelberg).
Colony Forming Efficacy (CFE)
Mitotically inactivated (irradiated) 3T3 fibroblasts cells were plated in a 6 well plate at a density of 2.5×10⁴ cells and incubated at 37°C overnight. To determine CFE, 300–1,000 cells were plated onto 3T3 fibroblasts in KnockOut ESC/iPSC medium and cultured for 14 days as reported previously [14]. The CFE was calculated as the percentage of colonies formed at the end of the growth period divided by the total number of viable cells seeded.
RNA Extraction, Reverse Transcription, Real-Time PCR
Total RNA from the cultured LFs, BM MSCs at various stages was extracted using TRIzol reagent (Invitrogen) according to the manufacturer’s protocol. RNA quality and quantity were measured using a NanoDrop (LabTech International; East Sussex, UK, http://www.labtech.co.uk). Two μg of total RNA were reverse-transcribed in a 20 μl reaction volume using a commercially available kit (Promega; Madison, WI, http://www.promega.com) to prepare cDNA via reverse transcription. Relative mRNA expression was assessed using an ABI prism 7900 HT sequence detection system instrument (Applied Biosystems, Grand Island, NY, http://www.lifetechnologies.com). Primers are listed in Supplementary Table 2. No-template controls were run for each assay to ascertain lack of contamination. The results were normalized by an internal control, i.e., glyceraldehyde-3-phosphate dehydrogenase (GAPDH). All assays were performed in triplicate for each primer set. The amount of relative target gene mRNA was expressed relative to the amount present in the calibrator using the formula 2−ΔΔCT. The final results were an average of 6 experiments.
Transepithelial Electrical Resistance (TER)
As a functional assessment of epithelial differentiation, TER was measured in differentiated SSEA4+ and SSEA4− cells. After induction, single cell suspension at a density of 100,000 cells/insert was seeded on 0.4μm pore size 12-well transwell inserts (Corning Inc, Tewksbury, MA, http://www.corning.com/lifesciences) coated with thin-coated Matrigel. Medium was changed every other day. TER was measured on day 2, 5, 9 and 13 after plating using the EVOM2 Epithelial VoltOhm Meter (WPI; Sarasota, FL. http://www.wpiinc.com). Immortalized human corneal–limbal line (HCLE) [16] was used as a positive control, whereas an empty thin-coated Matrigel transwell served as a background control. The TER of polyester filter without cells was 2 Ω*cm2 and of thin-coated Matrigel inserts was 6 Ω*cm2. Three different experiments were analyzed. For data analysis, TER values for every time point were averaged and the SEM was calculated.
Statistical Analysis
All assays were performed in triplicate. A two-tailed Student’s t-test was performed and p values less than 0.05 were considered as statistically significant. For differentiation experiments, the difference between groups was measured with Mann-Whitney U Test and one-way analysis of variance (ANOVA) was used for TER experiment, p values less than 0.05 is considered as significant. Results are presented as the mean ± SEM of at least 6 experiments.
RESULTS
Isolation of SSEA4+ and SSEA4− Subpopulations of LFs and BM MSCs
Human LFs were isolated from corneal stroma after dispase enzymatic digestion known to remove pancytokeratin- (PKC)-positive cells of the epithelial sheet [15, 17]. Human LFs and BM MSCs were grown on thin-coated Matrigel plates, where they exhibited fibroblast morphology and reached confluence in 7 days (Fig. 2A–D). After enrichment with KnockOut ESC/iPSC culture medium, flow cytometry analysis revealed that 5.9 ± 0.5% of LFs and 4.9 ± 0.6 % of BM MSCs were immunoreactive for SSEA4 antibody. After sorting with SSEA4+ magnetic beads and further enrichment, 97.4 ± 0.6% and 93.5 ± 0.7% fractions of LFs and BM MSCs, respectively, were achieved (Fig. 2E,F). Both subpopulations of LFs and BM MSCs grew into homogenous sheets of cells, with SSEA4+ cells exhibiting more compact and round cell morphology, and SSEA4− cells showing a more spindle shaped and fibroblast morphology (Fig. 2G, H and K, L). To explore differences in proliferative capacity, the cell-doubling times (CDTs) of SSEA4+ and SSEA4− subgroups were measured during growth in 3D Matrigel. The CDTs were longer in SSEA4+ LFs (102 ± 1 hour) as compared to SSEA4− LFs (58.2 ± 1.5 hour, p = 0.00234) and in SSEA4+ BM MSCs (105 ± 1 hour) as compared to SSEA4− MSCs (56.3 ± 2 hour, p = 0.00273) (Fig. 2O), indicating slower proliferation in SSEA4+ groups as compared to SSAE4− groups. Long doubling time has been described as a characteristic of embryonic stem cells [18], and our findings suggest that SSEA4+ LFs and BM MSCs have a greater similarity to stem cells than do SSEA4− cells.
Figure 2:
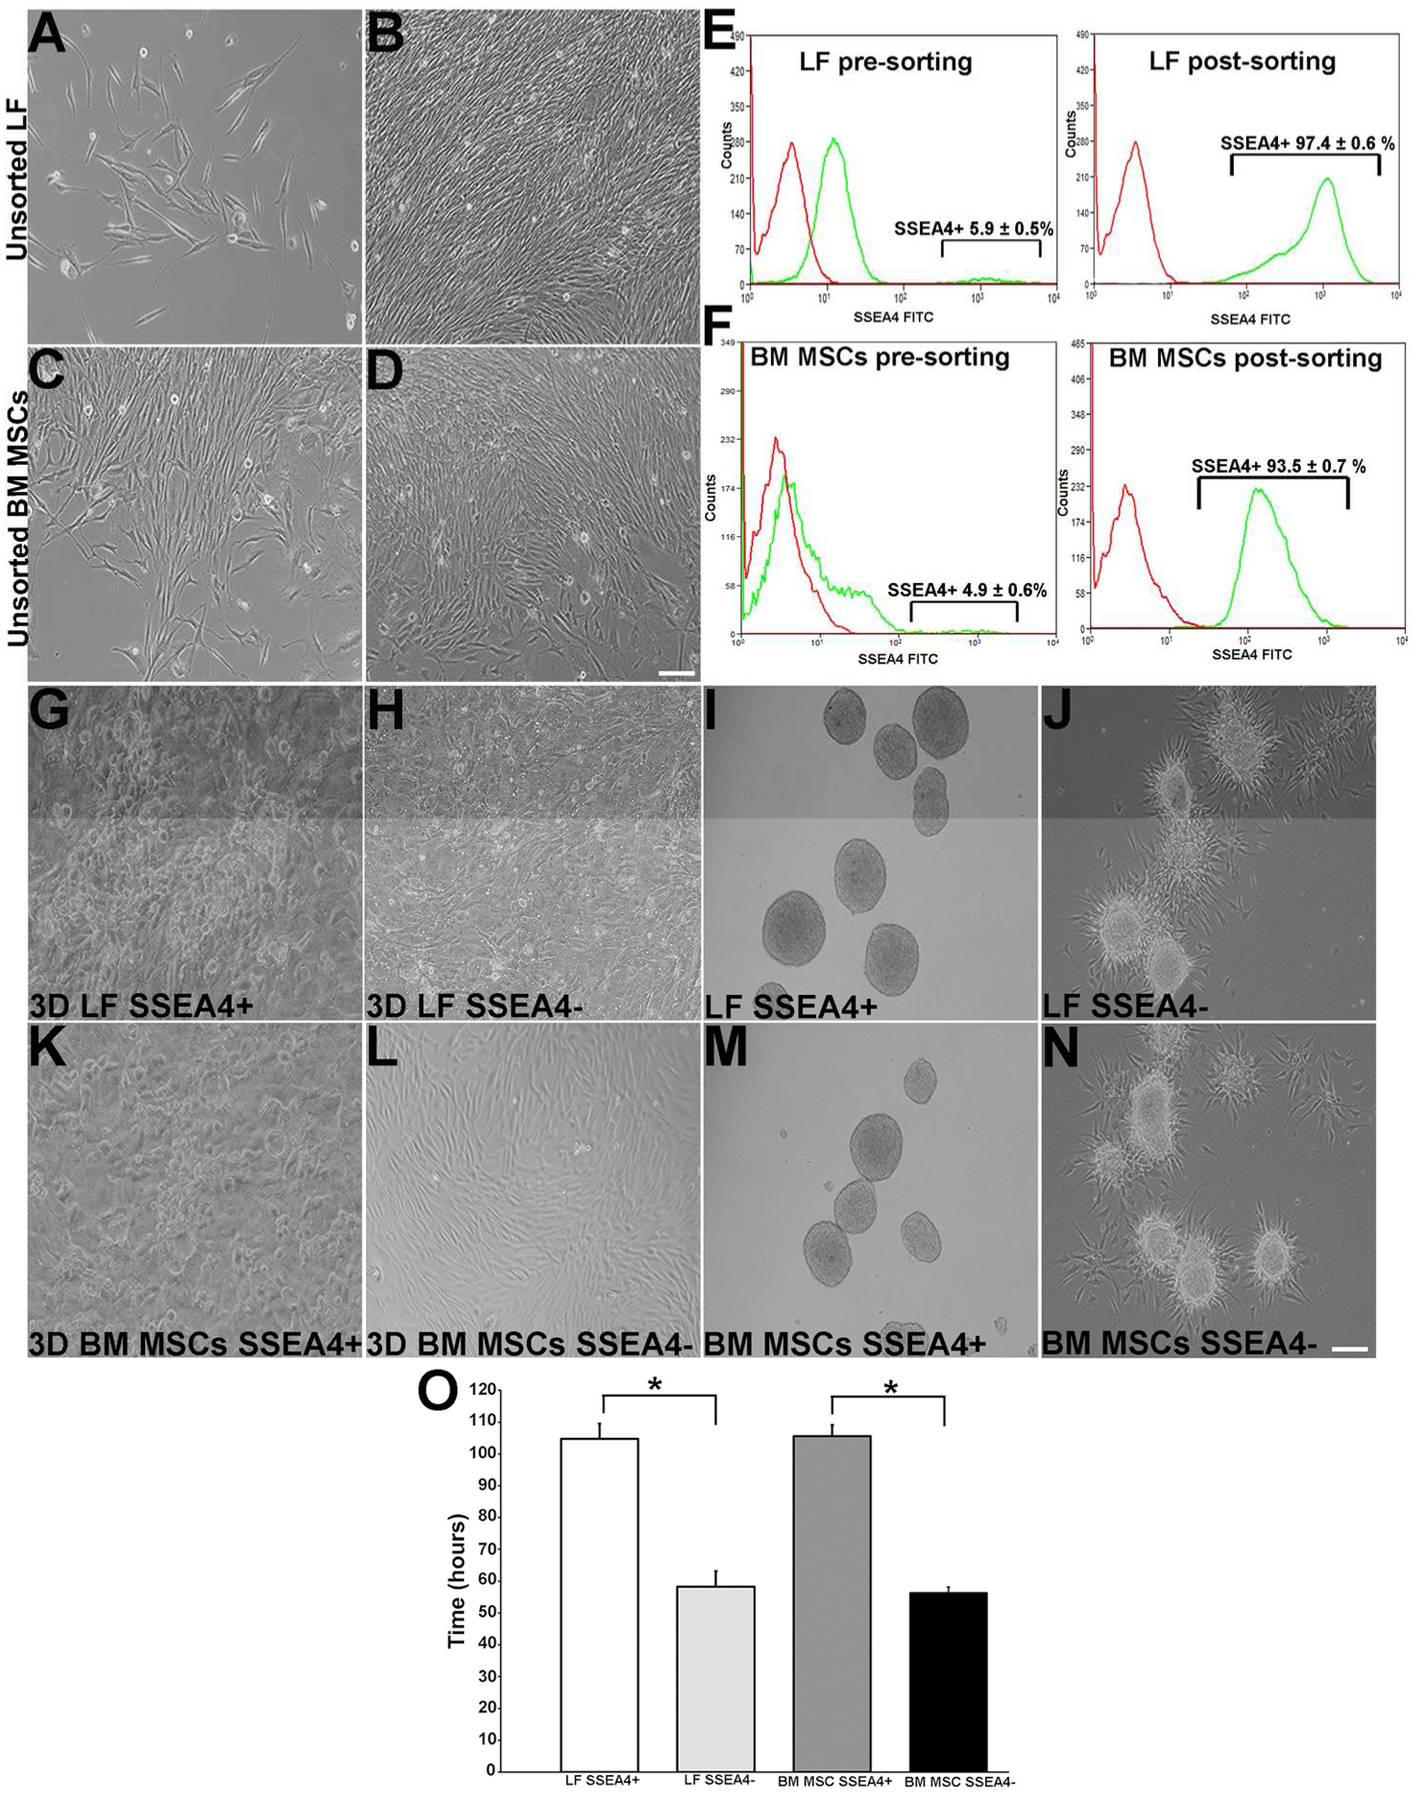
Culture of LF and BM MSC cells. (A): Cultured human LFs at day 6. (B): LFs near confluence at day 15. (C): BM MSCs at day 2. (D): BM MSCs near confluence at day 7. (E): LFs’ expression of SSEA4 pre-sorting and SSEA4 post-sorting. (F): BM MSCs pre-sorted and post-sorted for SSEA4 (green line indicates antibody expression and red line isotype control). Sorted LFs. (G): LF SSEA4+ cells in 3D cultures expressing cells with round compact morphology. (H): LF SSEA4− cells expressing fibroblast morphology. (I): LF SSEA4+ spheres. (J): LF SSEA4− spheres with outgrowth at day 7. (K): BM MSC SSEA4+ cells grown in 3D culture expressing round compact morphology at day 5. (L): BM MSC SSEA4− cells expressing fibroblast morphology day 5. (M): BM MSC SSEA4+ spheres at day 6. (N): SSEA4− spheres with outgrowth. (O): Doubling time of SSEA4+ LF and BM MSC cells are higher than those in the SSEA4− groups. Scale bar 20 μm. The data represent the mean ± SEM from 6 experiments. Statistical analysis was performed using Two tailed Student’s t test (*p < 0.05). Abbreviations: LFs, limbal fibroblasts; BM MSCs, bone marrow mesenchymal stem cells; SSEA4, stage-specific embryonic antigen 4.
Sphere-forming assay has been successfully used to isolate a subpopulation of cells that have an enhanced self-renewal capacity and differentiation potential [5, 19]. In the current study, SSEA4+ and SSEA4− cells were induced to form floating spheres, which were observed at day 2 of initial cell seeding and gradually enlarged in size (Fig. 2I, M). After day 7, the SSEA4+ plate was comprised entirely of floating spheres. In contrast, in SSEA4− group, all spheres gradually adhered to the plate surface and spindle-like cells were observed emerging from the colonies (Fig. 2J, and N). To ensure that sphere colony formation was derived from proliferating cells and not from reaggregation of the dissociated cells, BrdU assay was performed. All cells within each floating sphere labeled with BrdU on days 2, 4, and 6 (Supplementary Fig. S1), indicating that the colonies contained actively proliferating cells. Pre- and post-sorting LFs had a similar surface antigen profile as BM MSCs. LFs and BM MSCs were CD166, CD90, CD29, CD71, and CD106 positive and CD34, CD45, and CD11b negative. In addition, epithelial differentiation markers were not detected in all cell populations (Supplementary Table 3).
SSEA4+ Subgroups of LFs and BM MSCs Express Pluripotent Markers
To investigate optimal conditions for maintenance of stem cell characteristics, stem cell marker expression of SSEA4+ cells was compared between cells grown on 3D Matrigel and thin-coated Matrigel plates. There was a significant reduction in Oct4, Sox2, Nanog, Rex1, p63, ABCG2, and vimentin levels in the thin-coated Matrigel plates as compared to the 3D Matrigel cultures in both LF and BM MSC groups (Supplementary Fig. S2). Therefore, the 3D Matrigel system was determined to be the most effective in maintaining cells in an undifferentiated state and was used in the experiments involving stem cell enrichment and induction to the ectodermal lineage.
After stem cell enrichment in the 3D culture system, LF and BM MSC subgroups were assessed for stem cell and differentiation markers. Nuclear staining of Oct4 co-localized with SSEA4 antibody in SSEA4+ cells of both LFs and BM MSCs but did not stain the SSEA4− cells. Other putative stem cell markers such as TRA-1-60, localized to the cell membrane of the SSEA4+ cells but not to the SSEA4− cells for both LFs and BM MSCs. N-cadherin and vimentin exhibited positive staining in both SSEA4+ and SSEA4− groups. Cell junction staining with anti-N-cadherin antibody highlighted the difference in cell morphology between SSEA4+ and SSEA4− cells, with the former exhibiting a round cobblestone shape and the latter a spindle-like morphology. Of note, SSEA4+ BM MSCs showed a greater level of fluorescence for vimentin antibody than did LFs in both SSEA4+ and SSEA4− groups (Fig. 3A). LF and BM MSC subgroups were negative for epithelial differentiation marker pancytokeratin (PCK).
Figure 3:
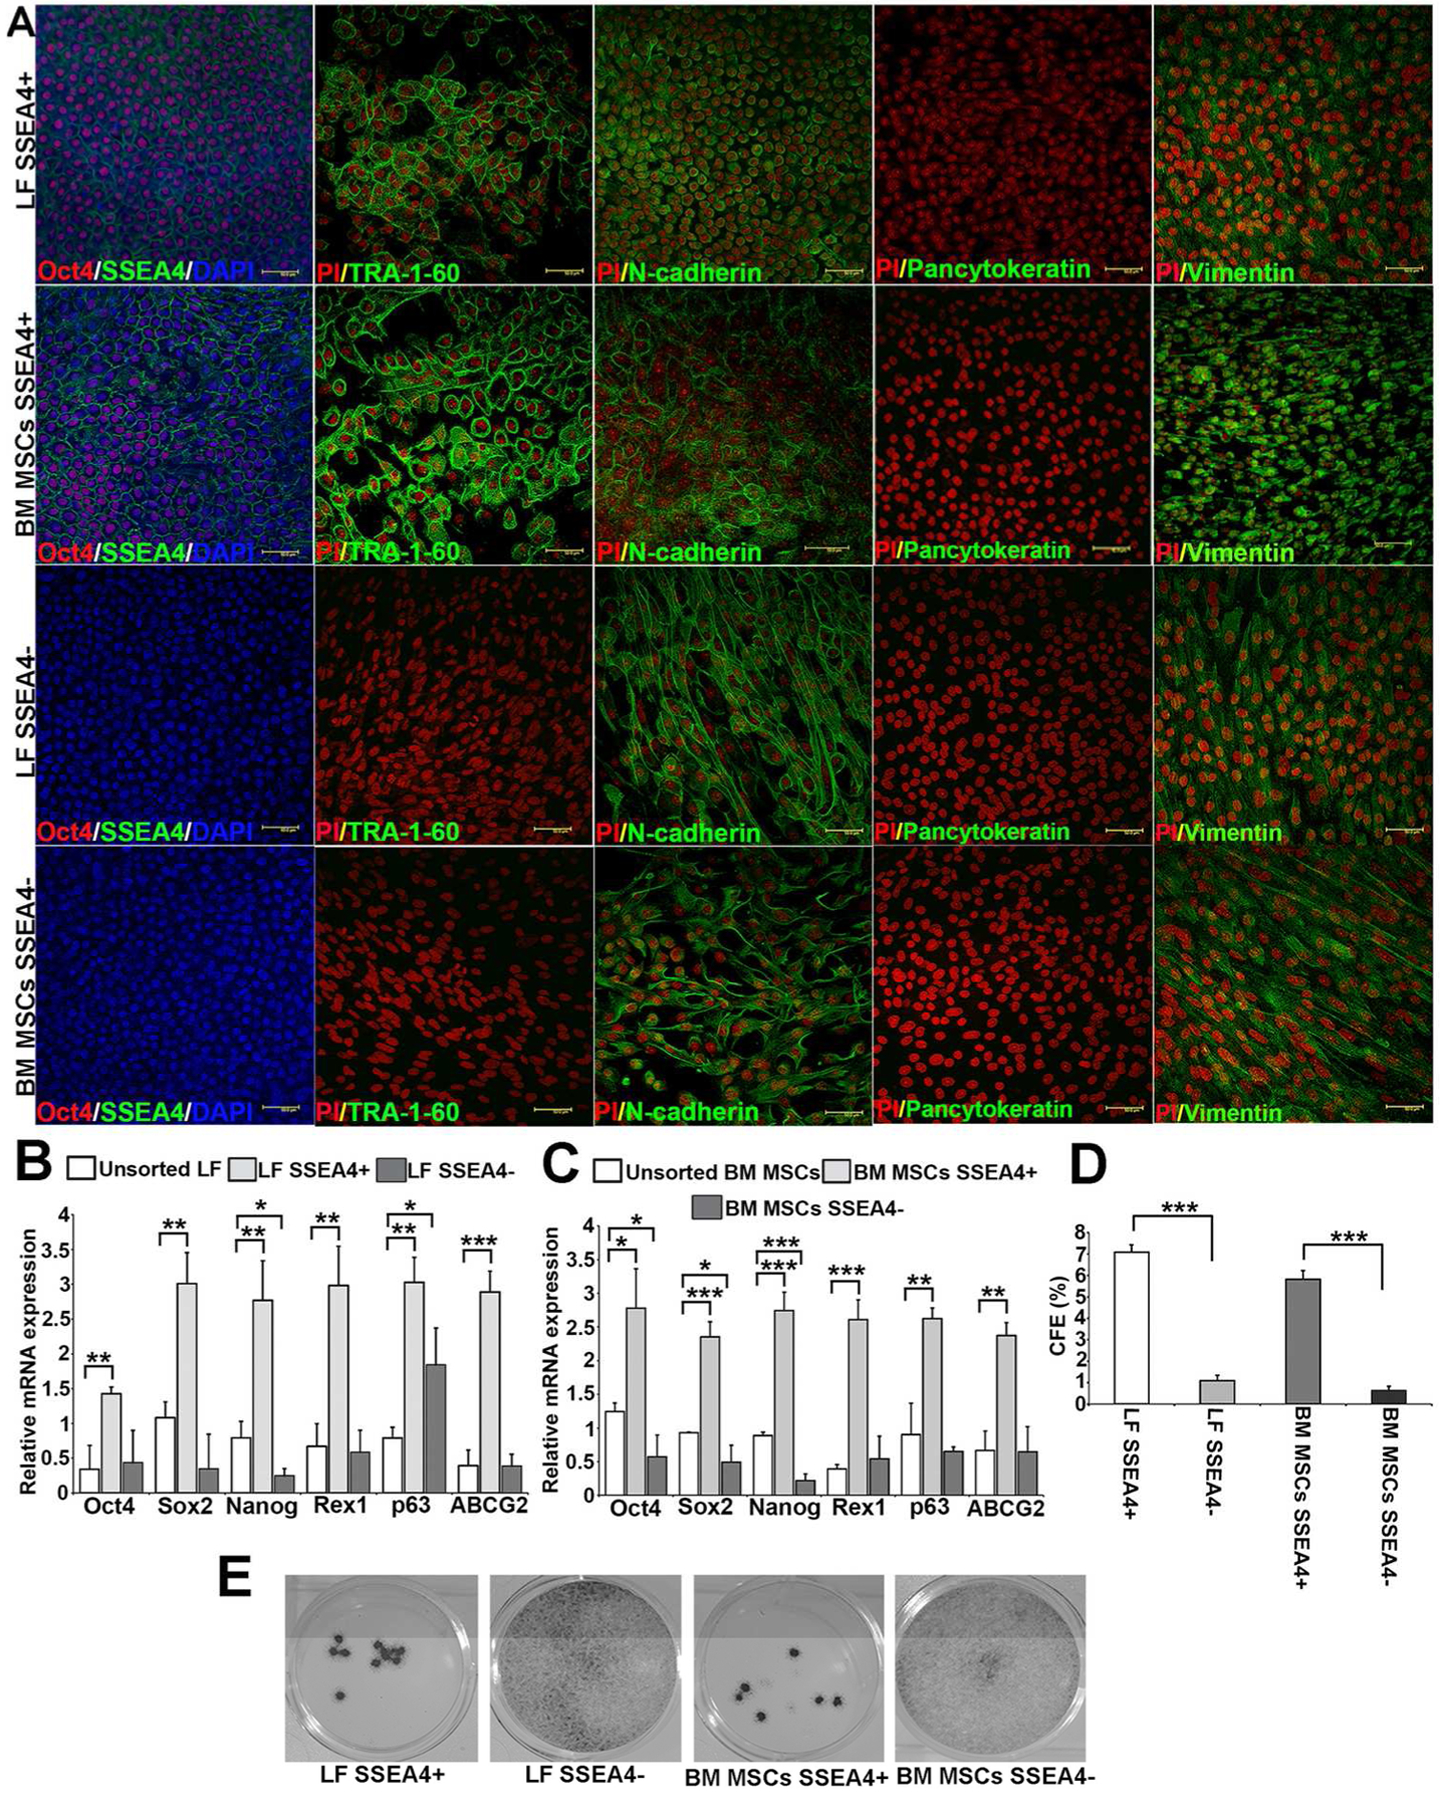
SSEA4+ cells of LFs and BM MSCs expressing stem cell markers. (A): LF and BM MSC SSEA4+ cells were both positive for SSEA4 (green), Oct4 (red), TRA-1-60 (green), N-cadherin (green), vimentin (green), and negative for epithelial marker Pancytokeratin (PCK). LF and BM MSCs SSEA4− cells were both negative for stem cell markers SSEA4, Oct4, TRA-1-60, and PCK, whereas they were positive for N-cadherin and vimentin. (B): qRT-PCR analysis of LFs in 3D Matrigel—unsorted LFs versus SSEA4+ and SSEA4− LFs. (C): qRT-PCR of BM MSCs in 3D Matrigel—unsorted BM MSCs versus SSEA4+ and SSEA4− cells. (D, E): Colony forming efficacy (CFE) of SSEA4 subgroups. A higher CFE was observed in SSEA4+ cells of both LFs and BM MSCs than in SSEA4− groups. The data represent the mean ± SEM from 6 experiments. Statistical analysis was performed using Two tailed Student’s t test (*p < 0.05, ** p < 0.01, *** p < 0.001). Abbreviations: LFs, limbal fibroblasts; BM MSCs, bone marrow mesenchymal stem cells; SSEA4, stage-specific embryonic antigen 4.
To assess stem cell marker expression further, mRNA levels of Oct4, Sox2, Nanog, Rex1, p63 and ABCG2 were compared between unsorted and SSEA4+, SSEA4− groups of LFs and BMC MSCs. SSEA4+ cells showed higher expression of Oct4 (p = 0.0060), Sox2 (p = 0.0026), Nanog (p = 0.0050), Rex1 (p = 0.0035), p63 (p = 0.00059), and ABCG2 (p = 0.00032) than unsorted LFs. In contrast, SSEA4− cells did not show an increase in stem cell marker mRNA levels when compared to unsorted LFs, except for p63 (p = 0.030). In fact, the expression of Nanog was decreased in SSEA4− LFs (Fig. 3B). Similarly, BM MSC SSEA4+ cells exhibited an increase in Oct4 (p = 0.011), Sox2 (p = 0.00038), Nanog (p = 0.00032), Rex1 (p = 0.00022), p63 (p = 0.0037), and ABCG2 (p = 0.00217) as compared to unsorted BM MSCs. In contrast, the SSEA4− groups showed a significant decrease in Oct4 (p = 0.028), Sox2 (p = 0.039), and Nanog (p = 0.0004) when compared to unsorted BM MSCs (Fig. 3C).
To further evaluate stem cell function of LF and BM MSC subgroups, we compared CFE between SSEA4+ and SSEA4− groups. The SSEA4+ subgroup of LFs had 6.4-fold higher CFE than did the SSEA4− group (p = 0.00021) and SSEA4+ group of BM MSCs had 9.14-fold higher CFE than did the SSEA4− group (p = 0.00017) (Fig. 3D and E).
Induction of LFs and BM MSCs to Ectodermal Lineage
To date, several protocols have been developed for differentiating mouse, human embryonic stem cells (ESCs), and induced pluripotent stem cells (iPS) into epidermal keratinocytes [20–24]. The differentiation protocol developed in this study was based on studies that used BMP-4 and RA for differentiation of ESCs into epidermis [24, 25]. Induction medium containing BMP-4, RA and EGF was applied to the spheres formed in the uncoated bacteriological plates (Fig. 1) of SSEA4+ and SSEA4− LFs and BM MSCs. To determine the optimal time course for ectodermal differentiation, mRNA levels of p63 and CK8 [26], which are ocular surface epithelial markers, were determined at 1, 3, 5, and 7 days post induction. The marker levels increased to their highest levels between days 3 and 5 (Supplementary Fig. S3). This finding is similar to a Metallo et al. observation, [24] where human ESCs differentiated into keratin 18-expressing epithelial cells at day 6. The SSEA4− subgroups did not show any significant enhancement of p63 and CK8 mRNA levels after induction.
Differentiation of Induced LFs and BM MSCs to Corneal Epithelial Cells
After induction to ectodermal lineage, spheres were dissociated to single-cell suspensions and plated onto thin-coated Matrigel inserts with differentiation medium (Fig. 1). Initially, SSEA4+ and SSEA4− cells exhibited fibroblast-like appearance without a significant difference in morphology. By day 4 of differentiation, there was a significant increase in round and cobblestone-appearing cells in the SSEA4+ group as compared to the SSEA4− group (Fig. 4B, F, J, and N). By day 9, the majority of SSEA4+ cells exhibited epithelial morphology, while SSEA4− cells remained spindle shaped, characteristic of fibroblasts (Fig. 4C, G, K, and O). In order to compare the differentiated cell ability to stratify as seen on the corneal surface, cross sections of LFs and MSCs grown on dAM were stained with H&E and CK3. SSEA4+ LFs formed a 2–3 layer-thick epithelial sheet and were positive for CK3 but similar stratification and CK3 expression was not observed in SSEA4− LFs (Fig. 4D, H). In contrast, differentiated SSEA4+ BM MSCs exhibited less defined epithelial cell layers as compared to LFs. Cross sections of SSEA4+ BM MSCs showed pronounced staining with CK3 antibody but the morphology of the cells was less round and more elongated as compared to SSEA4+ LFs (Fig. 4D, L). Similarly, SSEA4− BM MSCs did not exhibit signs of stratified epithelium like SSEA4− LFs and negative for CK3 (Fig. 4L, P).
Figure 4:
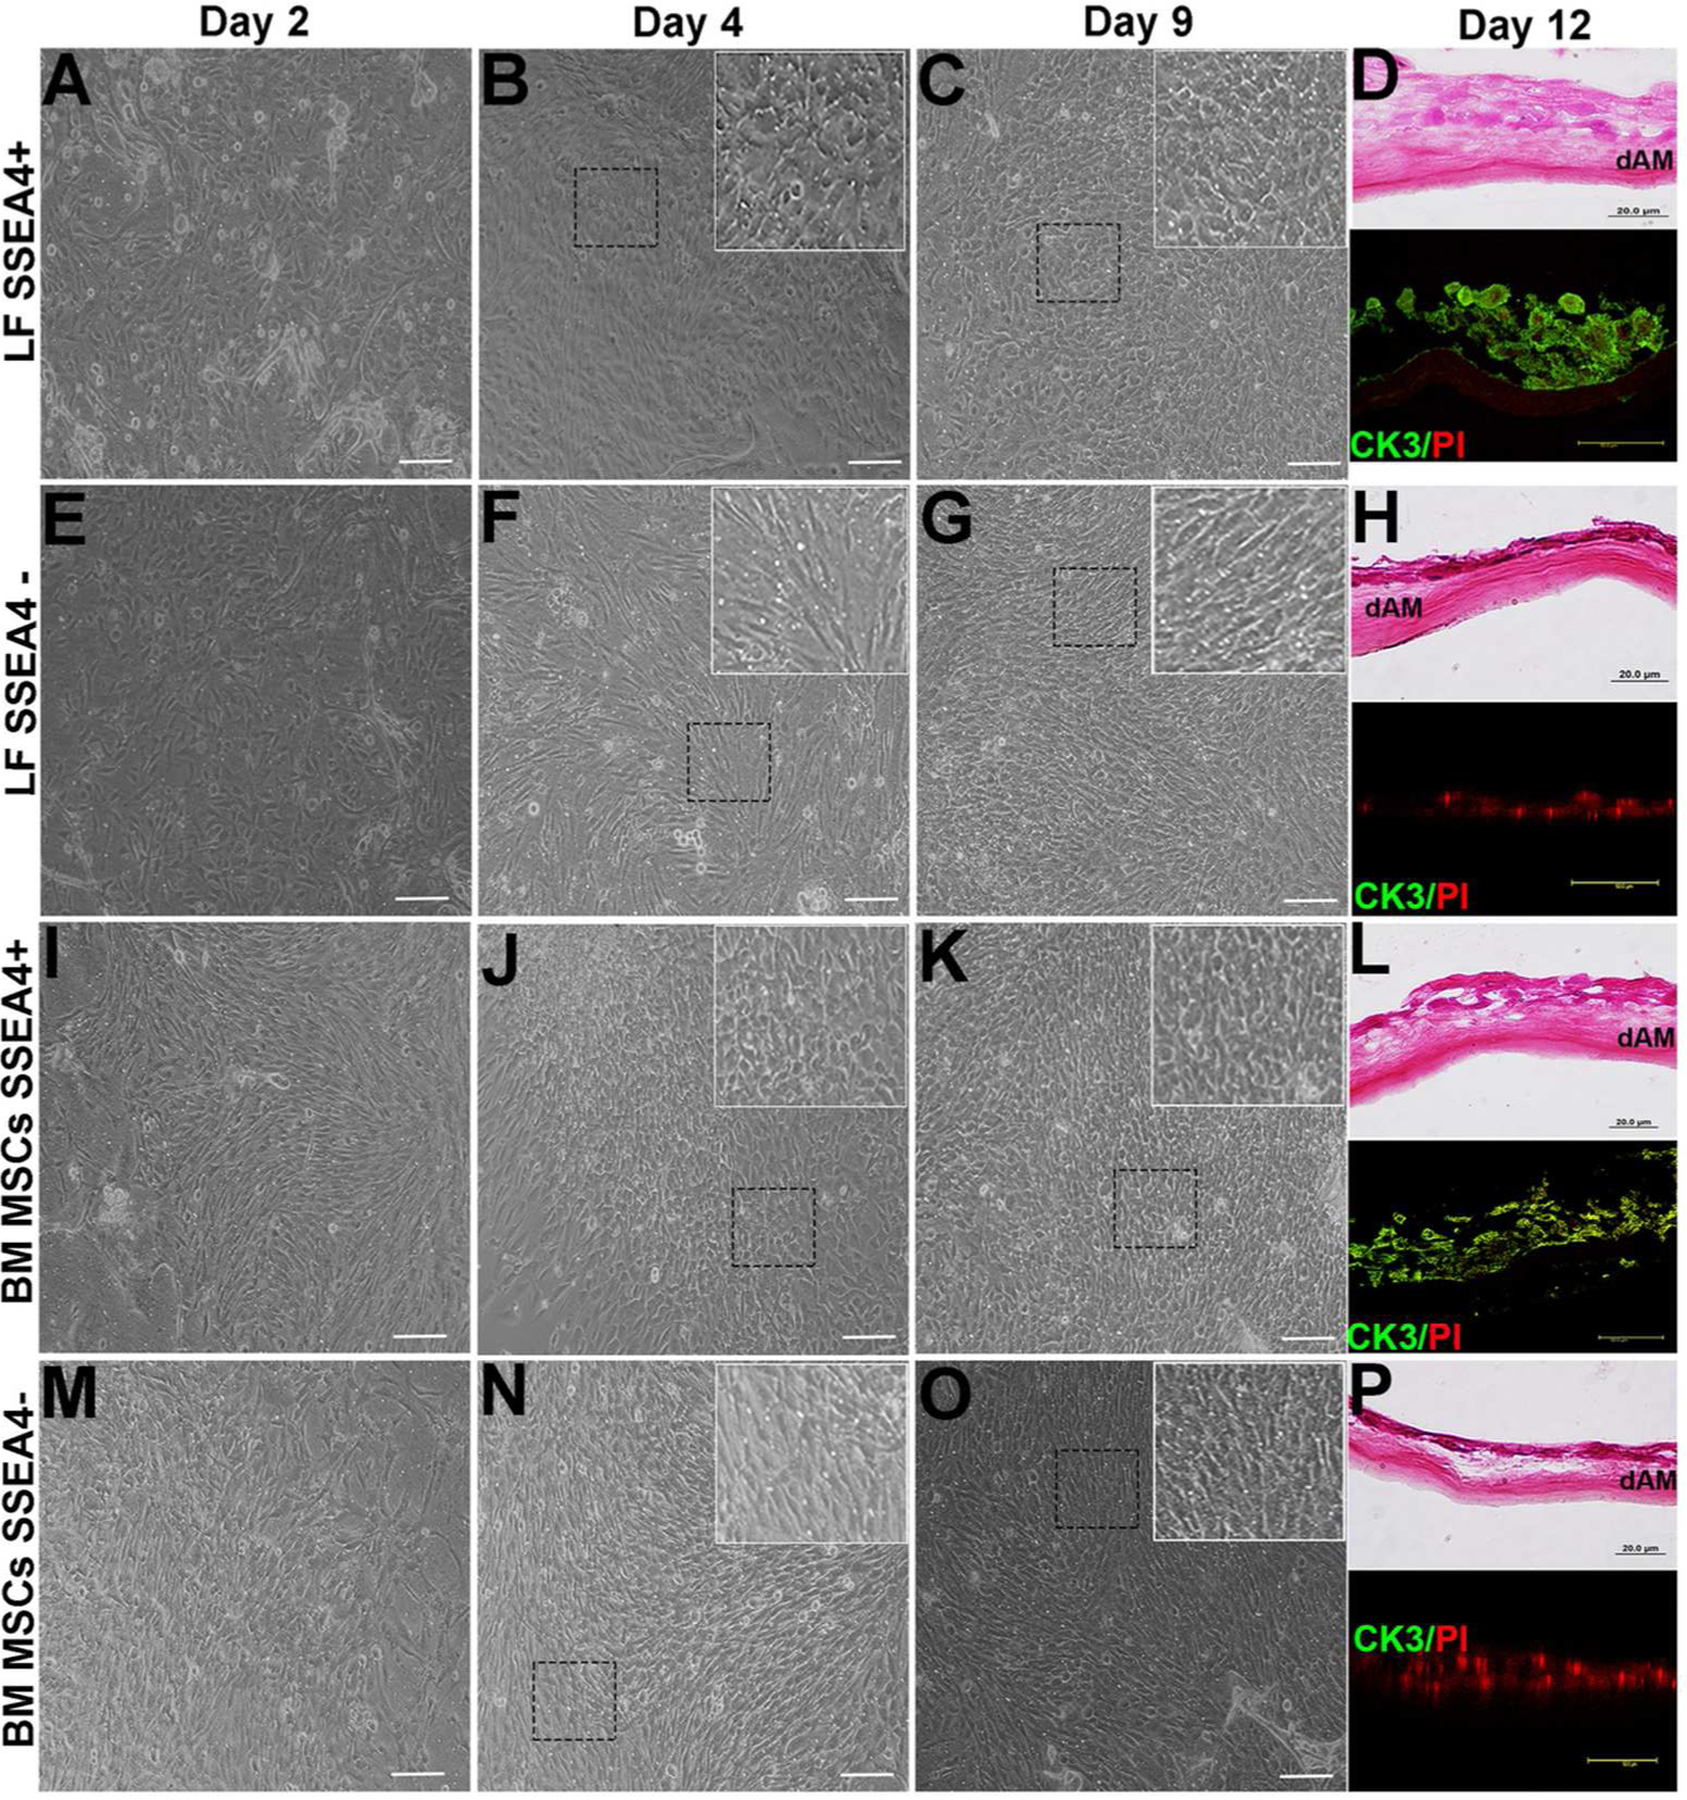
Differentiation of LFs, BM MSCs. (A): LF SSEA4+ cells at day 2. (B): LF SSEA4+ cells at day 4, cells appear to be round and compact (inset) (C): LF SSEA4+ cells appear epithelia-like at day 9 (inset). (D): Cross section of SSEA4+ LFs grown on dAM and stained with H&E at day 12 and CK3 (green) positive cells. (E): LF SSEA4− cells at day 2. (F): At day 4, LF SSEA4− cells appear fibroblast-like (inset). (G): At day 9, LF SSEA4− cells appear fibroblast-like (inset). (H): Cross section of SSEA4− LFs grown on dAM and stained with H&E at day 12 and CK3 (green) negative cells. (I): BM MSCs SSEA4+ 2 days after plating. (J): At day 4, cells appear to be round and compact in form (inset). (K): BM MSCs SSEA4+ appear round epithelial-like cell morphology at day 9 (inset). (L): Cross section of SSEA4+ BM MSCs grown on dAM and stained with H&E at day 12 and CK3 (green) positive cells. (M): BM MSC SSEA4− cells at day 2. (N): At day 4, cells appear fibroblast-like (inset). (O): BM MSC SSEA4− cells appear fibroblast-like at day 9 (inset). (P): Cross section of SSEA4+ LFs grown on dAM and stained with H&E at day 12 and CK3 (green) negative cells. Scale bar 20 μm. Inset images 40 × magnifications. Abbreviations: LFs, limbal fibroblasts; BM MSCs, bone marrow mesenchymal stem cells; SSEA4, stage-specific embryonic antigen 4; dAM, denuded amniotic membrane; H&E, hematoxylin and eosin; CK3, cytokeratin 3; PI, Propidium iodide (nuclear stain).
The differentiated cells were further characterized for epithelial and progenitor cell markers by immunofluorescence. SSEA4+ subgroups of LFs and BM MSCs, but not SSEA4− groups, were positive for CK3 and CK12, which are specific for labeling human corneal epithelium [27, 28], indicating that only SSEA4+, but not SSEA4− cells, differentiated into a corneal phenotype (Fig. 5A; Fig.6A). Cytokeratins 14 and 15, which are normally expressed in basal ocular surface epithelia [29, 30] and regarded as epithelial progenitor markers [30, 31], have shown increased staining in differentiated SSEA4+ cells as compared to SSEA4− cells (Fig. 5A; Fig. 6A). Similarly, integrin β1 and E-cadherin, normally expressed in basal and suprabasal corneal epithelial cells [32], have been detected in differentiated SSEA4+ cells and not in SSEA4− cells (Fig. 5A; Fig. 6A). On the other hand, alpha smooth muscle actin (α-SMA), which is a marker of myofibroblasts, was present in SSEA4− cells and not in SSEA4+ cells (Fig. 5A; Fig. 6A).
Figure 5:
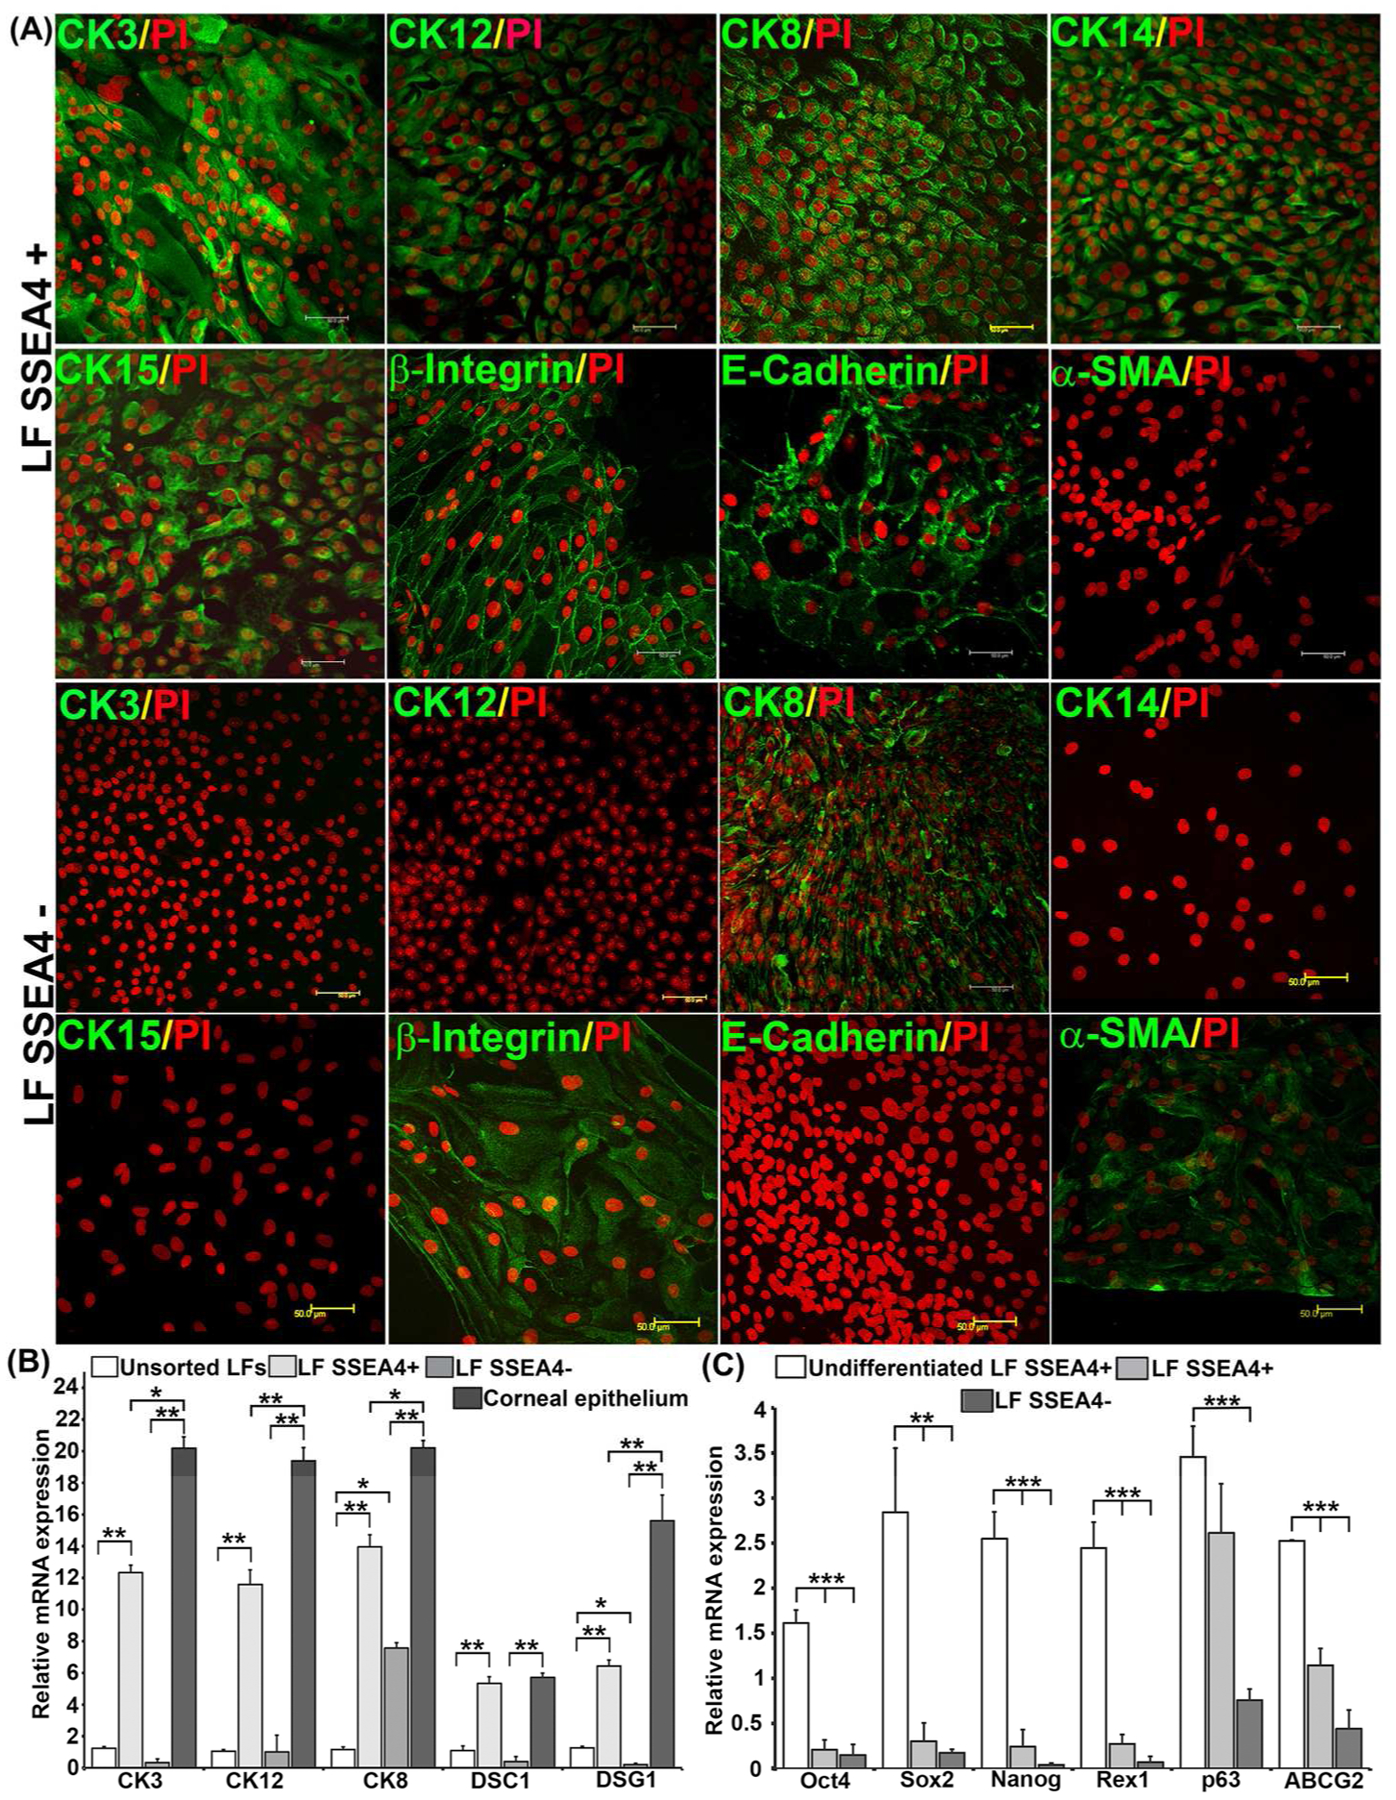
(A) Immunofluorescence of differentiated LFs. Differentiated LF SSEA4+ cells are positive for corneal epithelial markers CK3, CK12, CK8, CK14, CK15, β1 integrin, and E-cadherin, and negative for α-SMA. Differentiated LF SSEA4− cells are negative for corneal epithelial markers CK3, CK12, CK14, CK15 and E-cadherin, and positive for CK8, β1 integrin, and α-SMA. Scale bar 50 μm. (B) RT-PCR of LFs differentiated into corneal epithelial cells. (C) Expression of stem cell markers after differentiation in LFs. The normalized gene expression-to-GAPDH ratio is shown on the y-axis. The data represent the mean ± SEM from 6 experiments. Statistical analysis U Test (B) and Two tailed Student’s was performed using Mann-Whitney t test (C) (*p < 0.05, ** p < 0.01, *** p < 0.001). Abbreviations: LFs, limbal fibroblasts; BM MSCs, bone marrow mesenchymal stem cells; SSEA4, stage-specific embryonic antigen 4; CK, cytokeratin.
Figure 6.
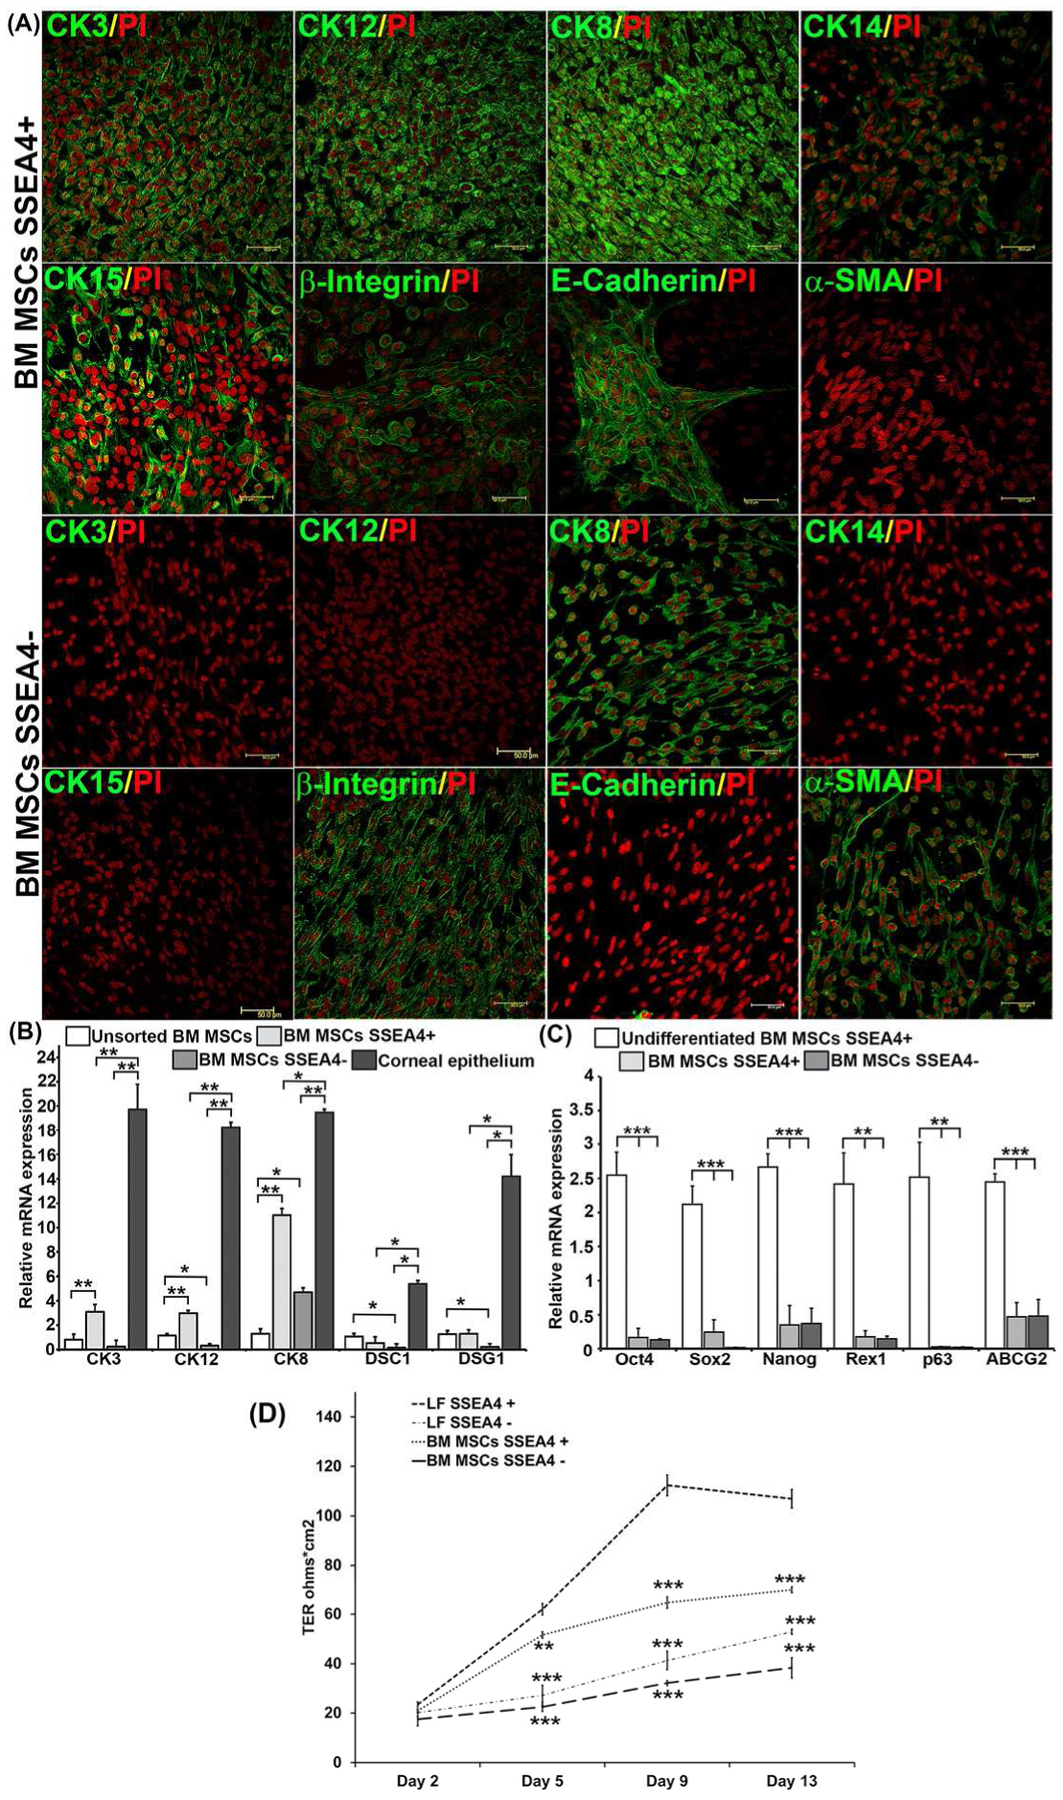
(A) Immunofluorescence of differentiated BM MSCs. Differentiated BM MSC SSEA4+ cells are positive for corneal epithelial markers CK3, CK12, CK8, CK14, CK15, β1 integrin, and E-cadherin, and negative for α-SMA. Differentiated BM MSC SSEA4− cells are negative for corneal epithelial markers CK3, CK12, CK14, CK15 and E+cadherin, and positive for CK8, β1 integrin, and α-SMA, Scale bar 50 μm. (B) RT-PCR of BM MSCs differentiated into corneal epithelial cells. (C) Expression of stem cell markers after differentiation in BM MSCs. The normalized gene expression-to-GAPDH ratio is shown on the y-axis. (D) After induction LF, BM MSCs SSEA4+ and SSEA4− cells were plated in 12-well transwell inserts (0.4 μm) at a density of 100,000 cells per transwell and transepithelial resistance (TER) was measured at day 2, 5, 9 and 13. LFs SSEA4+ were compared with LF SSEA4−, BM MSCs SSEA4+ and SSEA4− groups with one-way ANOVA. The data represent the mean ± SEM from 6 experiments. Statistical analysis was performed using Mann-Whitney U Test (B) and Two tailed Student’s t test (C), and one-way ANOVA (D) (*p < 0.05, ** p < 0.01, *** p < 0.001). Abbreviations: LFs, limbal fibroblasts; BM MSCs, bone marrow mesenchymal stem cells; SSEA4, stage-specific embryonic antigen 4; TER, transepithelial resistance; CK, cytokeratin.
Expression of corneal differentiation markers was compared between unsorted and SSEA4+ and SSEA4− differentiated cells, as well as to primary cultures of human corneal epithelium. Desmocollin-1 (DSC1) and desmoglein (DSG1) are intercellular desmosome junction proteins that are differentiation specific to stratified squamous epithelium [33]. Higher expression of CK3 (p = 0.0022), CK12 (p = 0.002), CK8 (p = 0.0050) and DSC1 (p = 0.0022) and DSG1 (p = 0.0020) was observed in the SSEA4+ group compared to unsorted LFs. In contrast, differentiated LF SSEA4− cells had levels of differentiation markers similar to those of unsorted LFs, except for CK8 (p = 0.0023) (Fig. 5B), which was present in SSEA4− cells, thus corroborating the protein data (Fig. 5A). Similarly, SSEA4+ BM MSCs had higher levels of corneal phenotype markers CK3 (p = 0.0024), CK12 (p = 0.0002), and CK8 (p = 0.0022), after differentiation as compared to unsorted BM MSCs (Fig. 6B). Primary epithelial cells taken from limbus were used as a positive control, and higher levels of corneal differentiation and junctional proteins were detected as compared to SSEA4+ and SSEA4− cells, except for DSC1, which was detected in levels similar to those in SSEA4+ LFs and primary cells (Fig. 5B). In contrast to LFs, no significant changes in DSC1 (p = 0.1797) and DSG1 (p = 0.6991) were observed in differentiated SSEA4+ BM MSCs as compared to unsorted BM MSCs, indicating that differentiated BM MSCs were not forming epithelia-specific junctions as well as differentiated LFs were (Fig. 6B). To further explore differences in differentiation potential between LFs and BM MSCs, corneal epithelial differentiation markers in SSEA4+ cells of both groups were compared, and a significantly higher expression of CK3 (p = 0.00083), CK12 (p = 0.00066), DSC1 (p = 0.00021), and DSG1 (p = 0.00053) were found in LFs as compared to BM MSCs, indicating a heightened capacity for LFs to develop into a corneal phenotype (Supplementary Fig. S4).
Putative Stem Cell Marker Expression in SSEA4+ Differentiated Epithelium
To evaluate loss of multipotency in differentiated LFs and BM MSCs, SSEA4+ and SSEA4− cells were evaluated for stem cell markers, by real-time PCR. After 9 days of differentiation, SSEA4+ and SSEA4− cells in both groups showed a decline in Oct4, Sox2, Nanog, Rex1, and ABCG2 expression as compared to enriched SSEA4+ cells prior to induction to ectodermal lineage. Moreover, the decline in stem cell markers was greater in the SSEA4− group as compared to the SSE4A+ group (Fig. 5C and Fig. 6C). These findings are consistent with a previous report by Ahmad et al. of expected loss of multipotency following stem cell differentiation into an epithelial lineage [34]. Interestingly, the mRNA level of p63 did not decrease in the SSEA4+ LF group after differentiation, indicating that SSEA4+ epithelia-like cells maintained some characteristics of limbal epithelial progenitors known to sustain proliferative potential of corneal epithelium [35].
Transepithelial Electrical Resistance of differentiated LF and BM MSCs
Measure of barrier integrity of corneal epithelial cells [36] by TER has been used as a functional assay of corneal epithelial differentiation. After induction, the measurement of TER was performed during the process of LF and BM MSC SSEA4+ and SSEA− cell differentiation into the epithelial lineage. The TER values gradually increased in all groups with a significantly higher measurements in SSEA4+ LFs as compared to the other groups at day 5, 9, and 13. LF SSEA4+ cells showed TER of 112.3 Ω*cm2 at day 9 which was higher than TERs of BM MSCs SSEA4+ cells (64.6 Ω*cm2; ANOVA p=0.001), LF SSEA4− (41.3 Ω*cm2; ANOVA p=0.001), and BM SSEA4− (32.2 Ω*cm2; ANOVA p=0.001) (Fig. 6D). Similarly, the differences in TER values between the groups was maintained at day 13, with the highest value of 107 Ω*cm2 seen in SSEA4+ LFs followed by 70 Ω*cm2 seen in SSEA4+ BM MSCs (Fig. 6D). It has been shown previously that cultured corneal epithelial cells establish a TER of 100–200 Ω*cm2 between days 5 and 10 of culture [37], indicating that reprogrammed SSEA4+ LFs had TER values typical of corneal epithelium. Even though differentiated SSEA4+ BM MSCs did not quite reach the typical TER values, it is possible that under different culture conditions and a longer follow up in culture, the results seen in LFs could have been achieved.
DISCUSSION
Corneal stroma consists of keratocytes that are neural crest-derived and, when isolated from the stroma, exhibit fibroblast appearance. At the limbus, LFs are situated in close proximity to LESCs and are known to promote limbal epithelial proliferation during wound healing [38]. In this study, we have shown that a specific subpopulation of LFs are analogous to MSCs and, under conditions replicating a limbal niche microenvironment, are capable of transdifferentiation into an epithelial cell lineage, while retaining the progenitor-like characteristics necessary to support continued renewal and maintenance of the corneal epithelial sheet (Fig. 7). This study is important for several reasons; first, it presents a new source of epithelium for autologous cell therapy; second, it establishes an important role for the SSEA4 antigen in maintenance of limbal microenvironement, and thirdly, it underscores the differential characteristics of tissue-specific adult progenitors—LFs and BM MSCs—in their reprogramming capacity to become corneal epithelia like.
Figure 7:
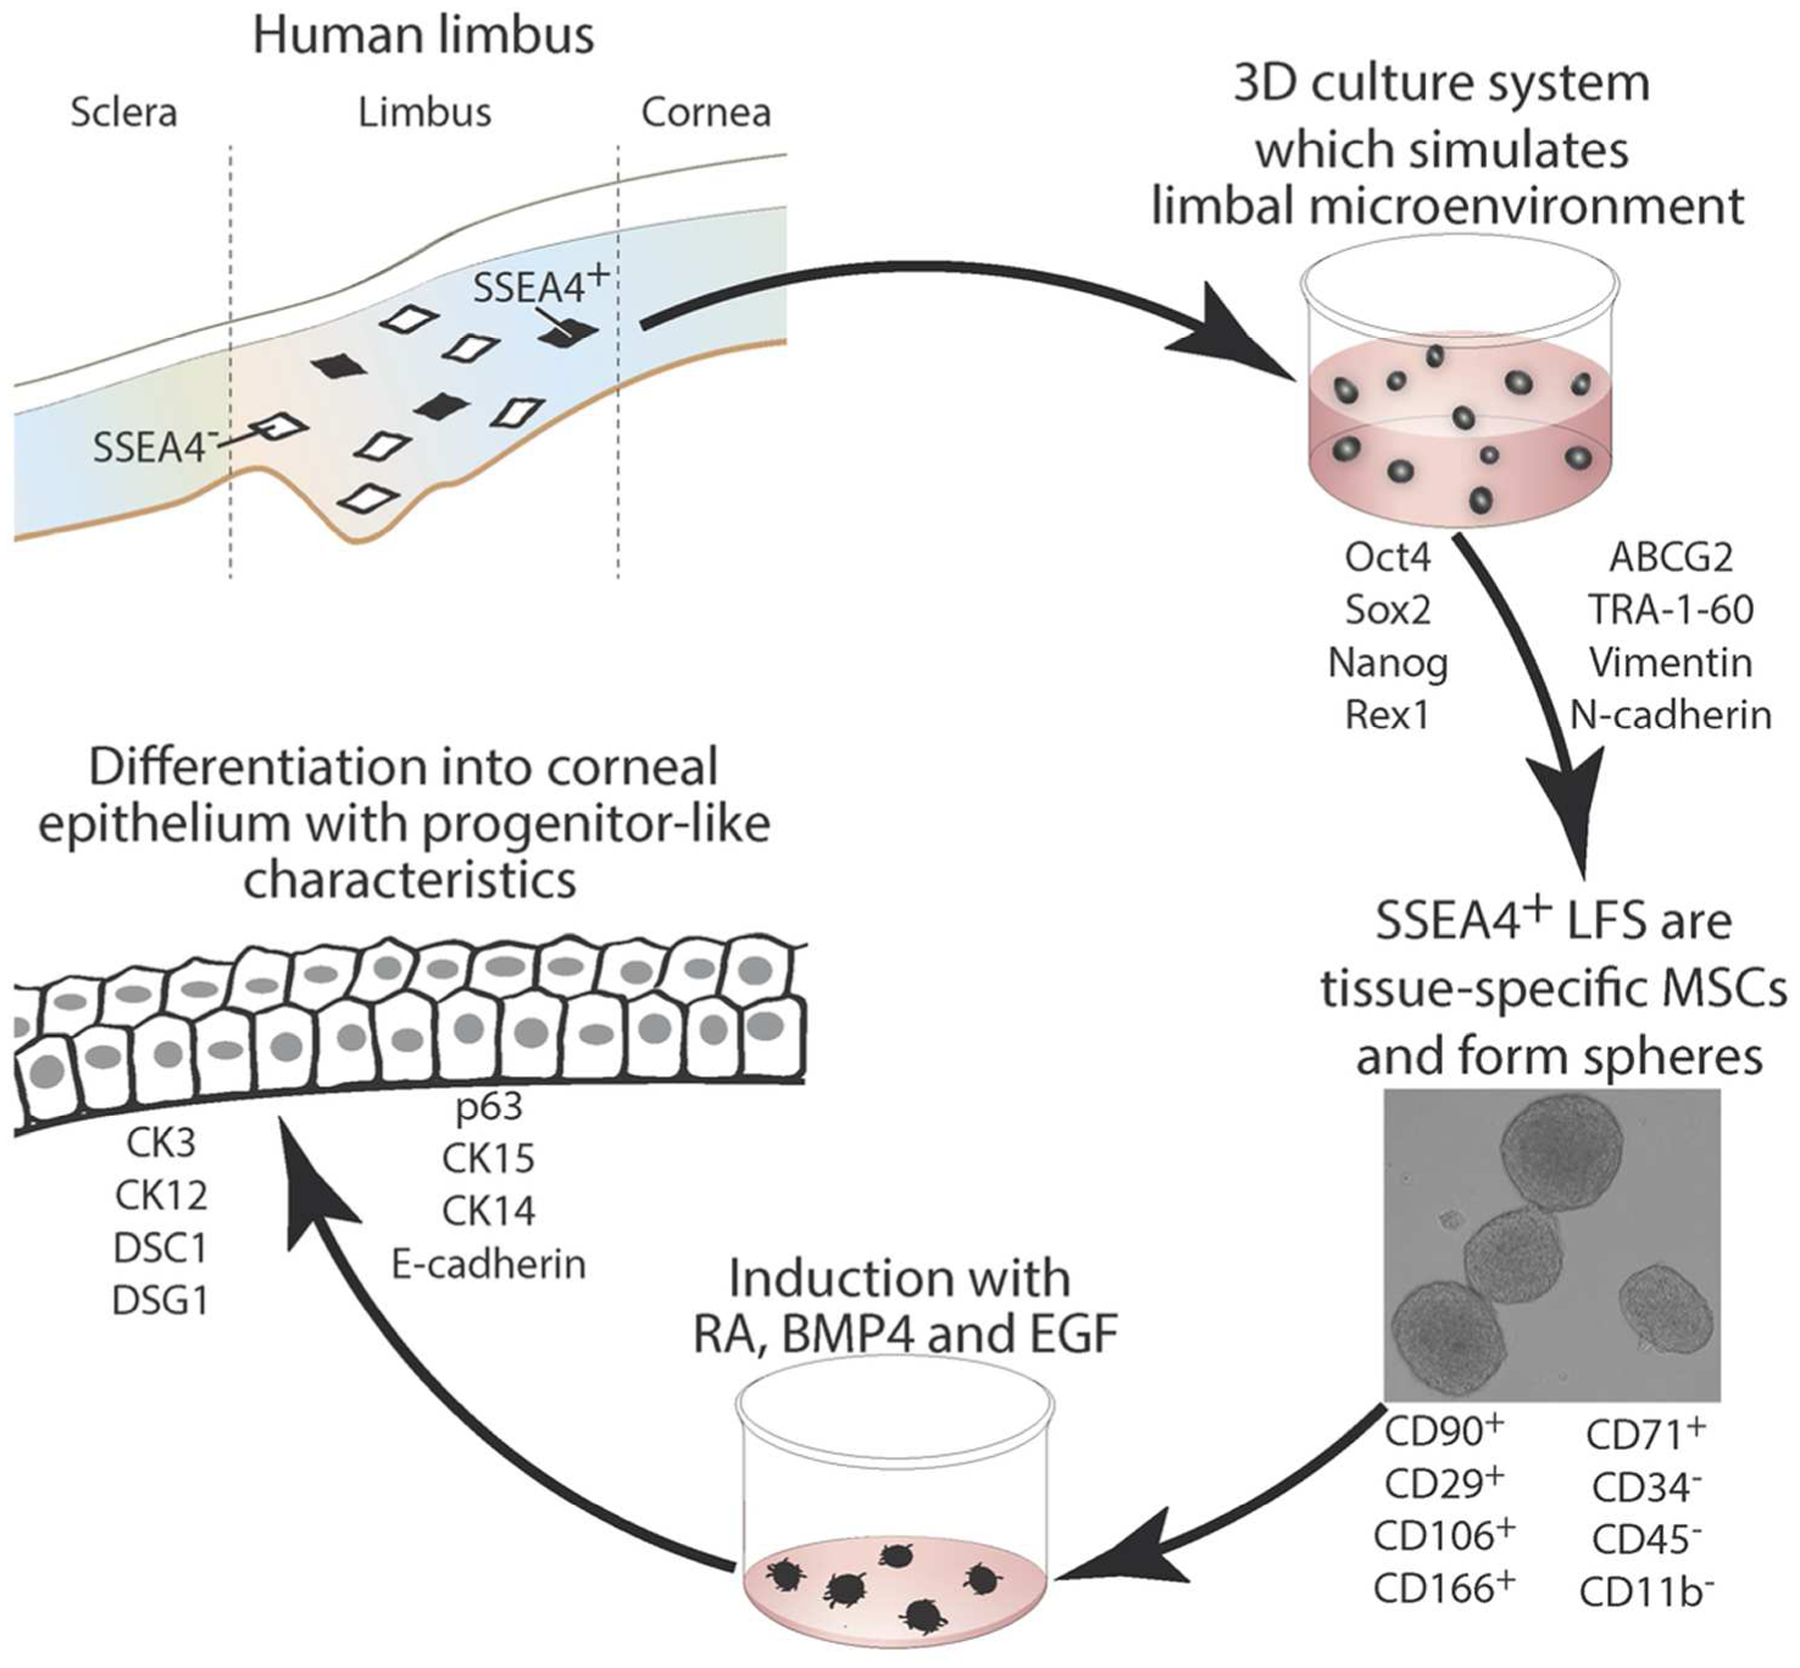
Diagram of the role of SSEA4 antigen in corneal limbal homeostasis. Isolation of SSEA4+ limbal fibroblasts and growth in 3D culture system induces stem cell marker expression that in turn leads to sphere formation and subsequent differentiation into corneal epithelium. Abbreviations: LFs, limbal fibroblasts; SSEA4, stage-specific embryonic antigen 4; CD, cluster of differentiation; CK, cytokeratin;BMP4, bone morphogenetic protein 4; RA, retinoic acid; EGF, epidermal growth factor.
The depletion of limbal epithelial stem cells in various limbal stem cell deficiencies (LSCDs) poses a significant challenge in treating patients with corneal blindness; thus a continued search for alternative sources of epithelium has been at the core of regenerative medicine. Several previous studies have described generation of epithelium, and some have specifically reported on corneal epithelium generation from MSCs [7–9], embryonic stem cells [34], and induced pluripotent cells [39]. Since allogeneic sources of stem cells pose a risk of immune rejection, utilization of autologous sources would offer significant advantages to new cell therapy protocols. This study outlines a differentiation strategy for transforming LFs and possibly BM MSCs into cornea-like epithelium, although further studies might need to take place to enhance such differentiation of BM MSCs since different protocols for LFs and BM MSCs might be required. Both sources of cells could be autologous in origin and readily obtained by a limbal biopsy or a bone marrow aspiration. However, it is not known whether LSCD affects layers of corneal and limbal stroma deeper than LESCs, thus further studies are necessary to determine whether LFs in the diseased eyes can be isolated from a stromal biopsy and have the same transdifferentiation potential as those seen in the normal donors utilized for our studies.
This study shows that SSEA4 plays a role in maintaining LFs in an undifferentiated state and that SSEA4+ cells are readily responsive to influences to differentiate into an ectodermal lineage. The SSEA4+ population of LFs and BM MSCs, as compared to SSEA4− cells, expressed higher levels of embryonic stem cell markers such as Oct4, Sox2, Nanog, Rex1, p63, ABCG2, and TRA-1-60, exhibited longer population-doubling time, and had greater CFE—all indicative of greater ‘stemness’. One might speculate that the same population of LFs also aids in preventing LESC differentiation and could play an important role in the limbal epithelial stem cell niche. In support of this, a previous study by Xie et al. showed that non-epithelial stromal MSCs situated subjacent to LESCs (and readily removed with collagenase digestion of the epithelial sheet) express Oct4, Nanog, SSEA4+, Sox2, Rex1, and N-cadherin, and represent the population of limbal NCs [15]. Similarly, in our study, sorted SSEA4+ LFs and BM MSCs, but not SSEA4− cells, were positive for stem cell markers and formed spheres characteristic of progenitor-like cells. Contrary to our findings, a study by Lim et al. did not detect stem cell marker expression in SSEA4+ LFs [40]. It is important to note that we utilized a combination of the 3D Matrigel culture system [15] and ESC medium [39] to re-create the microenvironment conducive for enrichment of SSEA4+ cells (Fig. 7). Differences in the culture methodology could explain why SSEA4+ cells did not express ESC markers when grown on thin-coated Matrigel plates as shown in Supplementary Fig. S3.
A previous study by Balasubramanian et al. has shown that somatic progenitors such as LESCs can be reprogrammed to pluripotent cells capable of differentiating into neurons, cardiomyocytes, and hepatocytes by manipulation of the cell microenvironment [41]. Similarly, our study has demonstrated a 3-step process of how LFs and BM MSCs can be reprogrammed into an epithelial phenotype without introduction of exogenous transcription factors. The reprogramming process involves preselection of mutipotential cells with the SSEA4 antibody, enrichment of cells with exogenous RA, BMP-4, EGF, and potential recreation of a limbal microenvironment within a 3D extracellular matrix. This method led to the recruitment of genes necessary to maintain cells in an undifferentiated state. Upon induction to ectodermal lineage and differentiation to corneal epithelial phenotype, both LFs and BM MSCs formed corneal epithelial monolayers. Of interest is the finding that LFs are similar to BM MSCs in marker expression levels, the ability to form spheres, and differences noted between SSEA4+ and SSEA4− cells, thus corroborating the studies that consider LFs to be MSC-like. However, the reprogramming potential to become cornea-like was significantly greater in the SSEA4+ LF population than in the BM MSC population, as seen by higher levels of CK3, CK12, DSC1, and DSG1 and ability to form stratified epithelial sheets. Also, SSEA4+ LFs were able to achieve higher TER values as compared to SSEA4+ BM MSCs, indicating greater propensity of reprogrammed LFs to become functional corneal epithelium. In addition, differentiated LFs retained p63 higher levels as compared to BM MSCs post differentiation. This difference could be attributed to tissue-specific molecular profiles that are currently unknown but enable cells in close proximity to the LESCs to differentiate into the cell of interest.
SUMMARY
The model provided in this study has numerous potential clinical applications and could serve as a tool for understanding cellular interactions in the limbal niche.
Supplementary Material
ACKNOWLEDGMENTS
We acknowledge the following individuals, Sandra Spurr-Michaud for her assistance in RT-PCR and Gale Unger for her editorial help, Schepens Eye Research Institute/Massachusetts Eye and Ear, Harvard Medical School, Boston, Massachusetts.
Grant Support:
Massachusetts Lions Eye Research Fund (UVJ)
Falk Medical Research Foundation (UVJ)
Research to Prevent Blindness Award
Curing Kids Fund (UVJ)
Cornea Donor Research Fund (UVJ and RD)
Footnotes
DISCLOSURE OF POTENTIAL CONFLICTS OF INTEREST
The authors indicate no potential conflicts of interest.
REFERENCES
- 1.Hassell JR and Birk DE. The molecular basis of corneal transparency. Exp Eye Res 2010; 91:326–335. [DOI] [PMC free article] [PubMed] [Google Scholar]
- 2.Pinnamaneni N and Funderburgh JL. Concise review: Stem cells in the corneal stroma. Stem cells 2012; 30:1059–1063. [DOI] [PMC free article] [PubMed] [Google Scholar]
- 3.Polisetty N, Fatima A, Madhira SL et al. Mesenchymal cells from limbal stroma of human eye. Mol Vis 2008; 14:431–442. [PMC free article] [PubMed] [Google Scholar]
- 4.Du Y, Funderburgh ML, Mann MM et al. Multipotent stem cells in human corneal stroma. Stem Cells 2005; 23:1266–1275. [DOI] [PMC free article] [PubMed] [Google Scholar]
- 5.Li X, Jia L, Jia X et al. Enrichment of Oct3/4-positive cells from a human bronchial epithelial cell line. APMIS : acta pathologica, microbiologica, et immunologica Scandinavica 2012. [DOI] [PubMed] [Google Scholar]
- 6.Porada CD, Zanjani ED, and Almeida-Porad G. Adult mesenchymal stem cells: a pluripotent population with multiple applications. Curr Stem Cell Res Ther 2006; 1:365–369. [DOI] [PubMed] [Google Scholar]
- 7.Gu S, Xing C, Han J et al. Differentiation of rabbit bone marrow mesenchymal stem cells into corneal epithelial cells in vivo and ex vivo. Mol Vis 2009; 15:99–107. [PMC free article] [PubMed] [Google Scholar]
- 8.Hou GH, Ye N, Wu J et al. [Preliminary study on human bone marrow mesenchymal stem cells differentiation into epithelial-like cells]. Zhonghua Yan Ke Za Zhi 2010; 46:719–724. [PubMed] [Google Scholar]
- 9.Ma Y, Xu Y, Xiao Z et al. Reconstruction of chemically burned rat corneal surface by bone marrow-derived human mesenchymal stem cells. Stem Cells 2006; 24:315–321. [DOI] [PubMed] [Google Scholar]
- 10.Abujarour R, Valamehr B, Robinson M et al. Optimized surface markers for the prospective isolation of high-quality hiPSCs using flow cytometry selection. Scientific reports 2013; 3:1179. [DOI] [PMC free article] [PubMed] [Google Scholar]
- 11.Henderson JK, Draper JS, Baillie HS et al. Preimplantation human embryos and embryonic stem cells show comparable expression of stage-specific embryonic antigens. Stem cells 2002; 20:329–337. [DOI] [PubMed] [Google Scholar]
- 12.Gang EJ, Bosnakovski D, Figueiredo CA et al. SSEA-4 identifies mesenchymal stem cells from bone marrow. Blood 2007; 109:1743–1751. [DOI] [PubMed] [Google Scholar]
- 13.Dravida S, Pal R, Khanna A et al. The transdifferentiation potential of limbal fibroblast-like cells. Brain Res Dev Brain Res 2005; 160:239–251. [DOI] [PubMed] [Google Scholar]
- 14.Sharma SM, Fuchsluger T, Ahmad S et al. Comparative Analysis of Human-Derived Feeder Layers with 3T3 Fibroblasts for the Ex Vivo Expansion of Human Limbal and Oral Epithelium. Stem Cell Rev 2012; 8:696–705. [DOI] [PubMed] [Google Scholar]
- 15.Xie HT, Chen SY, Li GG et al. Isolation and expansion of human limbal stromal niche cells. Investigative ophthalmology & visual science 2012; 53:279–286. [DOI] [PMC free article] [PubMed] [Google Scholar]
- 16.Gipson IK, Spurr-Michaud S, Argueso P et al. Mucin gene expression in immortalized human corneal-limbal and conjunctival epithelial cell lines. Investigative ophthalmology & visual science 2003; 44:2496–2506. [DOI] [PubMed] [Google Scholar]
- 17.Espana EM, Romano AC, Kawakita T et al. Novel enzymatic isolation of an entire viable human limbal epithelial sheet. Investigative ophthalmology & visual science 2003; 44:4275–4281. [DOI] [PubMed] [Google Scholar]
- 18.Bongso A, Fong CY, and Gauthaman K. Taking stem cells to the clinic: Major challenges. Journal of cellular biochemistry 2008; 105:1352–1360. [DOI] [PubMed] [Google Scholar]
- 19.Su G, Zhao Y, Wei J et al. The effect of forced growth of cells into 3D spheres using low attachment surfaces on the acquisition of stemness properties. Biomaterials 2013; 34:3215–3222. [DOI] [PubMed] [Google Scholar]
- 20.Aberdam E, Barak E, Rouleau M et al. A pure population of ectodermal cells derived from human embryonic stem cells. Stem Cells 2008; 26:440–444. [DOI] [PubMed] [Google Scholar]
- 21.Bilousova G, Chen J, and Roop DR. Differentiation of mouse induced pluripotent stem cells into a multipotent keratinocyte lineage. J Invest Dermatol 2011; 131:857–864. [DOI] [PubMed] [Google Scholar]
- 22.Green H, Easley K, and Iuchi S. Marker succession during the development of keratinocytes from cultured human embryonic stem cells. Proc Natl Acad Sci U S A 2003; 100:15625–15630. [DOI] [PMC free article] [PubMed] [Google Scholar]
- 23.Ji L, Allen-Hoffmann BL, de Pablo JJ et al. Generation and differentiation of human embryonic stem cell-derived keratinocyte precursors. Tissue Eng 2006; 12:665–679. [DOI] [PubMed] [Google Scholar]
- 24.Metallo CM, Ji L, de Pablo JJ et al. Retinoic acid and bone morphogenetic protein signaling synergize to efficiently direct epithelial differentiation of human embryonic stem cells. Stem Cells 2008; 26:372–380. [DOI] [PubMed] [Google Scholar]
- 25.Yoshida S, Yasuda M, Miyashita H et al. Generation of stratified squamous epithelial progenitor cells from mouse induced pluripotent stem cells. PLoS One 2011; 6:e28856. [DOI] [PMC free article] [PubMed] [Google Scholar]
- 26.Merjava S, Neuwirth A, Mandys V et al. Cytokeratins 8 and 18 in adult human corneal endothelium. Experimental eye research 2009; 89:426–431. [DOI] [PubMed] [Google Scholar]
- 27.Pajoohesh-Ganji A and Stepp MA. In search of markers for the stem cells of the corneal epithelium. Biology of the cell / under the auspices of the European Cell Biology Organization 2005; 97:265–276. [DOI] [PubMed] [Google Scholar]
- 28.Schermer A, Galvin S, and Sun TT. Differentiation-related expression of a major 64K corneal keratin in vivo and in culture suggests limbal location of corneal epithelial stem cells. The Journal of cell biology 1986; 103:49–62. [DOI] [PMC free article] [PubMed] [Google Scholar]
- 29.Dua HS, Shanmuganathan VA, Powell-Richards AO et al. Limbal epithelial crypts: a novel anatomical structure and a putative limbal stem cell niche. The British journal of ophthalmology 2005; 89:529–532. [DOI] [PMC free article] [PubMed] [Google Scholar]
- 30.Figueira EC, Di Girolamo N, Coroneo MT et al. The phenotype of limbal epithelial stem cells. Investigative ophthalmology & visual science 2007; 48:144–156. [DOI] [PubMed] [Google Scholar]
- 31. Yoshida S, Shimmura S, Kawakita T et al. Cytokeratin 15 can be used to identify the limbal phenotype in normal and diseased ocular surfaces. Investigative ophthalmology & visual science 2006; 47:4780–4786. [DOI] [PubMed] [Google Scholar]
- 32.Chen Z, de Paiva CS, Luo L et al. Characterization of putative stem cell phenotype in human limbal epithelia. Stem cells 2004; 22:355–366. [DOI] [PMC free article] [PubMed] [Google Scholar]
- 33.Wheelock MJ and Johnson KR. Cadherins as modulators of cellular phenotype. Annual review of cell and developmental biology 2003; 19:207–235. [DOI] [PubMed] [Google Scholar]
- 34.Ahmad S, Stewart R, Yung S et al. Differentiation of human embryonic stem cells into corneal epithelial-like cells by in vitro replication of the corneal epithelial stem cell niche. Stem cells 2007; 25:1145–1155. [DOI] [PubMed] [Google Scholar]
- 35.Pellegrini G, Dellambra E, Golisano O et al. p63 identifies keratinocyte stem cells. Proceedings of the National Academy of Sciences of the United States of America 2001; 98:3156–3161. [DOI] [PMC free article] [PubMed] [Google Scholar]
- 36.Shimazaki J, Higa K, Kato N et al. Barrier function of cultivated limbal and oral mucosal epithelial cell sheets. Investigative ophthalmology & visual science 2009; 50:5672–5680. [DOI] [PubMed] [Google Scholar]
- 37.Toropainen E, Ranta VP, Talvitie A et al. Culture model of human corneal epithelium for prediction of ocular drug absorption. Investigative ophthalmology & visual science 2001; 42:2942–2948. [PubMed] [Google Scholar]
- 38.Ainscough SL, Linn ML, Barnard Z et al. Effects of fibroblast origin and phenotype on the proliferative potential of limbal epithelial progenitor cells. Experimental eye research 2011; 92:10–19. [DOI] [PubMed] [Google Scholar]
- 39.Hayashi R, Ishikawa Y, Ito M et al. Generation of corneal epithelial cells from induced pluripotent stem cells derived from human dermal fibroblast and corneal limbal epithelium. PloS one 2012; 7:e45435. [DOI] [PMC free article] [PubMed] [Google Scholar]
- 40.Lim MN, Hussin NH, Othman A et al. Ex vivo expanded SSEA-4+ human limbal stromal cells are multipotent and do not express other embryonic stem cell markers. Mol Vis 2012; 18:1289–1300. [PMC free article] [PubMed] [Google Scholar]
- 41.Balasubramanian S, Babai N, Chaudhuri A et al. Non cell-autonomous reprogramming of adult ocular progenitors: generation of pluripotent stem cells without exogenous transcription factors. Stem cells 2009; 27:3053–3062. [DOI] [PubMed] [Google Scholar]
Associated Data
This section collects any data citations, data availability statements, or supplementary materials included in this article.