Mutagenesis, Volume 35, 11 August 2020, Pages 319–329 https://doi.org/10.1093/mutage/geaa018
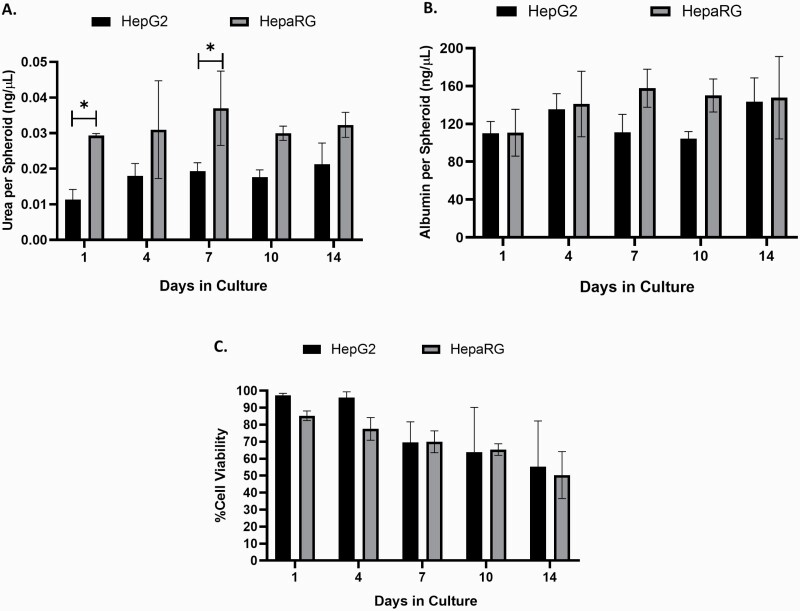
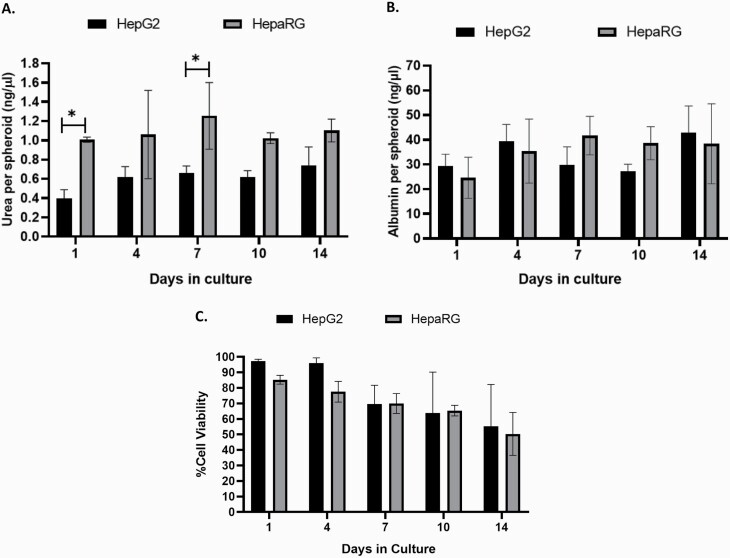
In the originally published version of this manuscript, there was an error in the y-axis of the graphs in Figure 2A and 2B. This resulted in a change to the scale bar of the y-axis in both graphs and the raw data for albumin and urea in Table 1. Both have been updated accordingly. Although the narrative of the paper remains unaffected, this corrigendum addresses the following changes that have subsequently been made to the article.
Table 1. Characterisation of 3D liver spheroids in the presence and absence of agarose.
| HepG2 cells | No Agarose | Agarose | ||
|---|---|---|---|---|
| Day 7 | Day 10 | Day 7 | Day 10 | |
| % Viability (95% CI) | 73.5% (90.07–56.03) | 60.09% (93.99–26.20) | 89.98% (102.03–77.95) | 79.6% (102.42–56.82) |
| Albumin per spheroid (ng/µl) (95% CI) | 167.63 (172.72–162.54) | 169.95 (177.10–162.81) | 167.39 (168.56–166.24) | 166.92 (167.58–166.26) |
| Urea per spheroid (ng/µl) (95% CI) | 0.80 (1.00–0.59) | 1.04 (1.46–0.62) | 0.77 (0.86–0.68) | 0.76 (0.84–0.68) |
CI, confidence interval.
As shown below, the calculation error has not affected the data trends nor the outcomes of the statistical analysis. Thus, the narrative of the paper remains unaffected. Figure 2A and 2B have been updated as follows:
Previous version
Corrected version
Consequently, the following text under the “Modified hanging drop approach supports longerterm viability of HepG2 spheroids” heading has been revised:
“Table 1 below demonstrates the results of a comparison study of spheroid viability and urea and albumin production in both the presence and absence of an agarose layer added to the base of the 96-well plate. No significant difference between urea and albumin production was observed between the two methods.” to read: “Table 1 below demonstrates the results of a comparison study of spheroid viability and urea and albumin production in both the presence and absence of an agarose layer added to the base of the 96-well plate. A significant increase in urea production was observed on day 10 in the presence of agarose (P= 0.014). No difference was observed between the two methods for albumin.”
In the Discussion section, the following text should read: “A small change was demonstrated in urea production on day 10 that was in favour of the presence of agarose.” Instead of “There was no significant difference in metabolic function (urea and albumin) in the 3D models in the presence of agarose.”
Consequently, the raw data for Urea and Albumin data in Table 1 was amended as follows:
Previous version
Corrected version
Table 1.
Characterisation of 3D liver spheroids in the presence and absence of agarose.
| HepG2 cells | No Agarose | Agarose | ||
|---|---|---|---|---|
| Day 7 | Day 10 | Day 7 | Day 10 | |
| % Viability (95% CI) | 73.5% (90.07–56.03) | 60.09% (93.99–26.20) | 89.98% (102.03–77.95) | 79.6% (102.42–56.82) |
| Albumin per spheroid (ng/µl) (95% CI) | 32.56 (39.17–25.94) | 29.83 (33.50–26.15) | 34.23(63.99–4.46) | 48.51(94.82–2.19) |
| Urea per spheroid (ng/µl) (95% CI) | 0.64 (0.70–0.58) | 0.63 (0.68–0.58) | 0.66 (0.79–0.52) | 0.82* (1.09–0.54) |
*Significant at P < 0.014. CI, confidence interval.


