Abstract
The diversity of regulatory T (Treg) cells in health and in disease remains unclear. Individuals with colorectal cancer harbor a subpopulation of RORγt+ Treg cells with elevated expression of β-catenin and pro-inflammatory properties. Here we show progressive expansion of RORγt+ Treg cells in individuals with inflammatory bowel disease during inflammation and early dysplasia. Activating Wnt–β-catenin signaling in human and murine Treg cells was sufficient to recapitulate the disease-associated increase in the frequency of RORγt+ Treg cells coexpressing multiple pro-inflammatory cytokines. Binding of the β-catenin interacting partner, TCF-1, to DNA overlapped with Foxp3 binding at enhancer sites of pro-inflammatory pathway genes. Sustained Wnt–β-catenin activation induced newly accessible chromatin sites in these genes and upregulated their expression. These findings indicate that TCF-1 and Foxp3 together limit the expression of pro-inflammatory genes in Treg cells. Activation of β-catenin signaling interferes with this function and promotes the disease-associated RORγt+ Treg phenotype.
Treg cells are essential to sustain peripheral tolerance and prevent autoimmunity. Increasing evidence suggests that Treg cells adapt phenotypically and functionally to their anatomic location and in response to the inflammatory millieu1,2. Multiple Treg cell subpopulations are described that express additional helper T (TH) cell lineage transcription factors3 including T-bet4, GATA-3 (ref. 5) and RORγt6,7. Adopting these programs equips Treg cells with the ability to regulate different TH cell responses. The intestine comprises a highly diverse Treg cell compartment. Specifically, RORγt-expressing Treg cells are found in the colon and small intestine and at lower frequencies in the peripheral lymphoid organs of healthy mice6-8. They are necessary to maintain the balance of intestinal inflammatory responses. In humans, however, the physiological regulatory functions of RORγt+Foxp3+ Treg cells remain poorly understood.
Treg cells are defined by a core regulatory program established during late differentiation by Foxp3 binding to gene enhancers made accessible by Foxo1 (ref.9). Foxp3 has a complex interactome with different modes of action10,11, including functioning as an activator in association with RelA, Ikzf2 (Helios), Ep300 and Kat5, and as a repressor with EZH2, YY1 and Ikzf3 (ref. 12). Seminal work9-12, however, suggests that Foxp3 complexes have not been exhaustively studied yet. Recently, it was suggested that overlap of Foxp3 binding with the transcription factor TCF-1 impacts Treg cell function13. We further showed that TCF-1 binding overlaps with multiple other factors, including Ikaros, Runx, Ets and HEB in double-positive thymocytes14. Furthermore, TCF-1 plays a critical roles in the differentiation of TH cell lineages15, memory formation16 and counteracting exhaustion17. In T cells, TCF-1 is the bona fide DNA-binding partner of β-catenin, the central effector of the Wnt signaling cascade. The classical dogma defines TCF-1 as a DNA-bound repressor until Wnt signals stabilize β-catenin, which translocates to the nucleus and binds TCF-1 to promote transcription18, β-catenin is also stabilized upon T cell antigen receptor (TCR) engagement19. Excessive Wnt–β-catenin activation in Treg cells may impact their function20 and is linked to autoimmunity in the context of multiple sclerosis21. Foxp3 binding to DNA is suggested to overlap with β-catenin in human Treg cells, which parallels the overlap between TCF-1 and Foxp3 DNA occupancy in mice13.
Immune suppression through recruitment of Treg cells is a major immune escape mechanism in cancer22, often correlated with detrimental outcomes23. Their role in colorectal cancer (CRC) remains unclear24-27, as they also suppress chronic inflammation, which is a cancer-promoting factor in inflammatory bowel disease (IBD)-associated CRC28,29. We described a subpopulation of RORγt+ Treg cells that expands in the tumor and peripheral blood (PB) of individuals with CRC throughout disease progression30. While these cells still suppress T cells, they are pro-inflammatory, expressing interleukin (IL)-17 and promoting mast cell degranulation. In murine polyposis models, we causatively linked the pro-inflammatory skewing of T cells to activation of Wnt–β-catenin signaling during thymic development31.
Here, we show that RORγt+ Treg cells expressing pro-inflammatory cytokines expand progressively in individuals with IBD and CRC, and in murine colitis-associated dysplasia models. Mechanistically, we establish that β-catenin upregulation imposes a pro-inflammatory phenotype onto Treg cells by interfering with TCF-1/Foxp3-mediated gene suppression.
Results
β-Cateninhi RORγt+ Treg cell frequencies increase during inflammatory bowel disease progression.
To understand how RORγt+ Treg cells expand in individuals with sporadic CRC30, we investigated IBD, which represents a unique platform for studying the mechanisms underlying the emergence and distribution of RORγt+ Treg cells during inflammation and progression to CRC. We analyzed colonic tissue and/or PB samples from 65 individuals with IBD, with or without dysplasia (IBD-Dys), and compared them to 20 healthy donors (HDs; Supplementary Table 1).
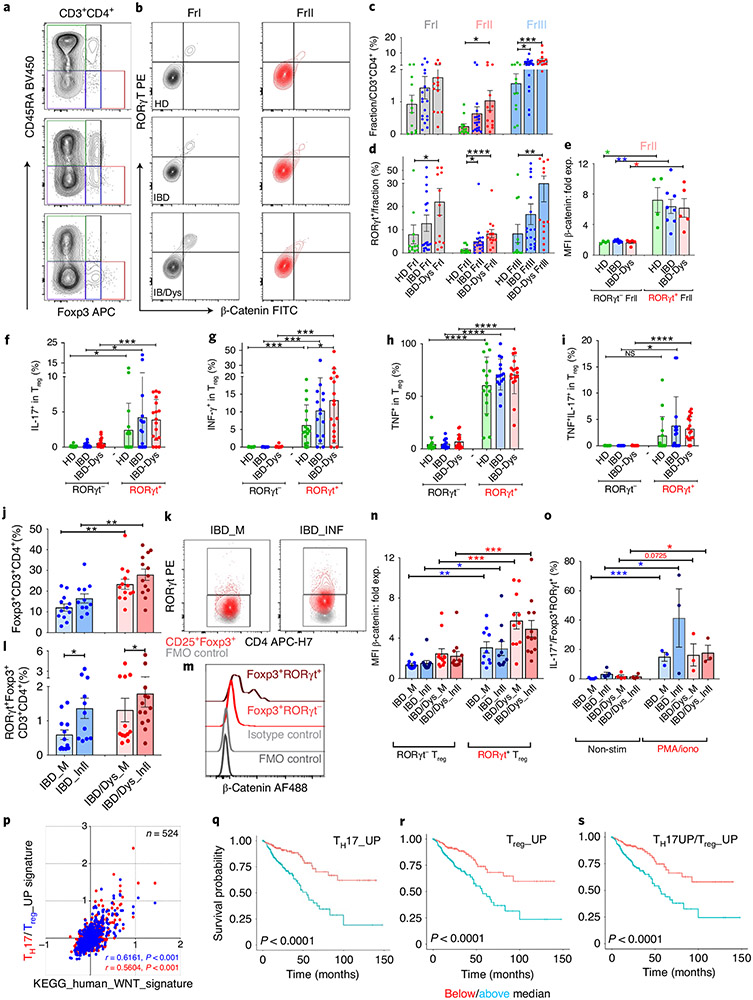
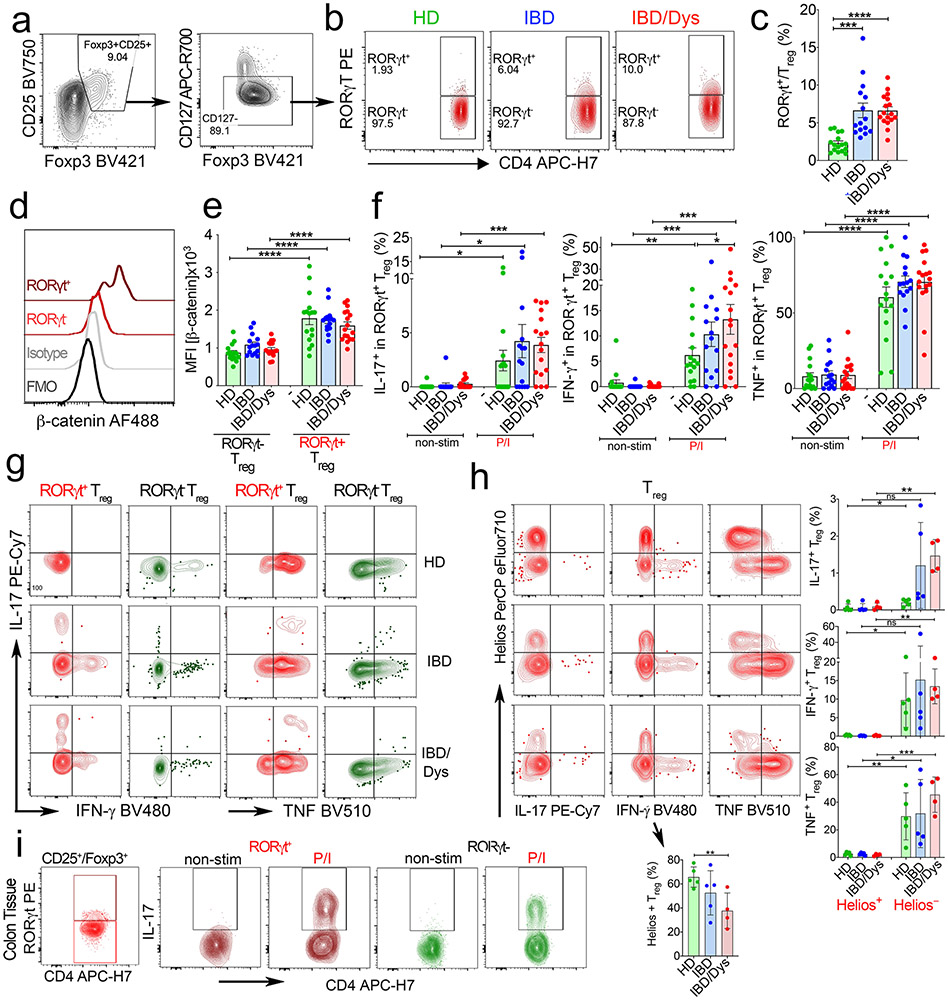
We first determined the frequencies of naïve (fraction (Fr.) I: CD45RA+Foxp3int) and activated (Fr.II: CD45RAloFoxp3hi) Treg cells, as well as activated conventional T (Tcon) cells (Fr. III: CD45RAloFoxp3int) within PB CD4+ T cells (Fig. 1a-e)27,32. Previously, we reported that Fr.II Treg cells selectively increased in sporadic CRC30. Likewise, here we show progressive enrichment of Fr.II Treg cell frequencies from HDs to individuals with IBD and IBD-Dys (Fig. 1c). We also observed a progressive increase in Fr.III T cells, suggested as prognostic for CRC clinical outcomes (Fig. 1c)27. Previously we defined pro-inflammatory Treg cells in individuals with CRC by expression of RORγt. We therefore assessed the frequency of RORγt-expressing cells within the Treg fractions (Fig. 1b-d) and in classically defined CD25+Foxp3+CD127− Treg cells (Extended Data Fig. 1a-c). Like in CRC, RORγt+ cells were enriched within Fr.II-activated Treg cells in individuals with IBD-Dys (Fig. 1d). Frequencies of RORγt+ within CD25hiFoxp3+CD127− Treg cells also increased in individuals with IBD and IBD-Dys compared to HDs (Extended Data Fig. 1b,c).
Fig. 1 ∣. β-Cateninhi RORγt+ Treg cells producing IL-17, IFN-γ and TNF expand during inflammatory bowel disease progression.
a, Live CD3+CD4+ cells divided into five fractions according to CD45RA versus Foxp3 expression. b, RORγt versus β-catenin expression assessed in Fr.I and Fr.II Treg cells. Representative samples from HDs (HD8), and individuals with IBD (IMB11) and IBD/Dys (IMB6). c, Cumulative frequencies of Fr.I and Fr.II Treg cells and Fr.III T cells in PB of HDs (n = 12) and individuals with IBD (n = 19) and IBD/Dys (n = 13). d, Relative frequencies of RORγt+ cells within Fr.I, Fr.II and Fr.III of samples in c (two-sided Kruskal–Wallis test). e, Cumulative β-catenin expression in PB RORγt+/RORyt− Fr.II Treg cells in HDs (n = 4) and individuals with IBD (n = 8) and IBD/Dys (n = 5) depicted as mean fluorescence intensity (MFI) normalized to isotype/fluorescence minus one (FMO) negative staining controls for each individual (two-sided, paired t-test). f-i, IL-17 (f), IFN-γ (g), TNF (h) and IL-17 + TNF (i) production after PMA/ionomycin stimulation in RORγt− and RORγt+ CD4+CD25+Foxp3+CD127− PB Treg cells assessed by intracellular cytokine staining (two-sided, paired t-test; HDs (n = 16); IBD (n = 15); IBD/Dys (n = 17). j, Cumulative frequencies of CD3+CD4+Foxp3+ cells in inflamed (INF) and less inflamed (margin; M) mucosa of IBD and IBD/Dys samples. k,l, Flow plots (k) and cumulative frequencies (l) of Foxp3+RORγt+ Treg cells. m,n, Flow cytometric histogram (m) and cumulative normalized MFI (n) of β-catenin expression in RORγt+/RORγt− Treg cells. j-n, IBD_M (n = 12); IBD_INF (n = 11); IBD/Dys_M (n = 13); IBD/Dys_INF (n = 13); two-sided, paired t-test. o, IL-17 production before (non-stim) and after (PMA/iono) stimulation of mucosal Treg populations assessed by intracellular staining (non-stim: IBD_M (n = 5), IBD_INF (n = 5), IBD/Dys_M (n = 4), IBD/Dys_INF (n = 4); PMA/iono: IBD_M (n = 3), IBD_INF (n = 3), IBD/Dys_M (n = 3), IBD/Dys_INF (n = 3); two-sided, unpaired t-test). p-s, Analysis of the TCGA CRC cancer cohort. p, Spearman’s correlation of average z-scores for the KEGG_human_WNT signature versus the combined TH17_UP (red; r = 0.5604, P < 0.001) and Treg_UP (blue; r = 0.6161, P < 0.001) signatures in individuals with CRC (n = 524). q-s, Kaplan–Meier plots generated after dichotomizing individuals with CRC on the median levels of TH17_UP, Treg_UP and TH17_UP/Treg_UP signature-based scores (P < 0.001, log-rank test). Unless stated otherwise, data are represented as the median ± s.e.m., and statistical testing is depicted as *P ≤ 0.05, **P ≤ 0.01, ***P ≤ 0.001, ****P ≤ 0.0001. NS, not significant.
Previously, we causatively linked the skewing of CD4+ Tcon cells toward a TH17/pro-inflammatory phenotype to the activation of Wnt–β-catenin signaling31. Hence, we assessed the amounts of β-catenin in RORγt+ and RORγt− Fr.II and in CD25hiFoxp3+CD127− Treg cells. Indeed, expression of RORγt in Treg cells uniformly correlated with enhanced β-catenin protein expression (Fig. 1b,e and Extended Data Fig. 1d,e) in Fr.II cells of individuals with IBD and IBD-Dys and HDs (Fig. 1e). Further validating previous findings21,30, RORγt+ but not RORγt− CD25+Foxp3+CD127− PB Treg cells produced pro-inflammatory cytokines upon stimulation with PMA and ionomycin (Fig. 1f-i and Extended Data Fig. 1f,g). More precisely, they intracellularly accumulated IL-17, interferon (IFN)-γ and tumor necrosis factor (TNF; Fig. 1f-h), and a fraction coproduced TNF and IL-17 (Fig. 1i). Importantly, a significantly higher percentage of RORγt+ PB Treg cells produced IFN-γ in individuals with IBD and IBD-Dys compared to HDs (Fig. 1g). Furthermore, IL-17 and TNF coexpression was significantly more frequent in RORγt+ compared to RORγt− PB Treg cells of individuals with IBD and IBD-Dys than of HDs (Fig. 1i). We further assessed the RORγt-independent Helios+ Treg cell subset throughout disease progression33. Helios+ Treg cell frequencies progressively declined in IBD and IBD-Dys, and cytokine production was limited to Helios− Treg cells (Extended Data Fig. 1h). Taken together, chronic inflammation in IBD and IBD-Dys coincides with increased frequencies of PB RORγt+ Treg cells that produce multiple pro-inflammatory cytokines.
Next, we determined the frequencies of tissue-resident RORγt+ Treg cells in individuals with IBD by purifying mononuclear cells (MNCs) from inflamed and less inflamed (‘margin’) colonic mucosa samples. We found higher frequencies of total Foxp3+ T cells (~30%) within CD4+ tissue-resident T cells compared to PB. Moreover, tissue-resident total Foxp3+ T cells were significantly increased in individuals with IBD-Dys compared to those with IBD in margin and inflamed areas (Fig. 1j). We also found increasing frequencies of RORγt+ Treg cells from margin to inflamed mucosa (Fig. 1k,l). Like their circulating counterparts, they expressed significantly higher amounts of β-catenin compared to RORγt− Treg cells and produced IL-17 upon stimulation (Extended Data Fig. 1i,m–o). Thus, circulating RORγt+ Treg cells in individuals with IBD-Dys share major similarities with the tissue-resident cells and are likely derived from tissue/tumor.
To explore possible RORγt+ Treg cell tumor infiltration, we analyzed datasets from The Cancer Genome Atlas (TCGA; https://www.cancer.gov/tcga/) and determined how expression changes of Wnt–β-catenin, Treg cell and TH17 pathway genes were connected. We calculated the average z-scores over all genes in the ‘human WNT signature’ (KEGG_human_WNT)34,35 and signatures containing genes that are transcriptionally upregulated in TH17 cells (TH17_UP) and Treg cells (Treg_UP)10. The TH17_UP signature positively correlated with the KEGG_human_WNT signature (P < 0.001, Spearman’s r = 0.5604; Fig. 1p) and mirrored the equally strong positive correlation between the Treg_UP and the KEGG_human_WNT signatures (P < 0.001, Spearman’s r = 0.6161; Fig. 1p). Also, the TH17_UP and Treg_UP signatures showed a strong positive correlation (P < 0.001, Spearman’s r = 0.7836; Extended Data Fig. 1a). This suggests that Treg cells infiltrating CRC tumors with an activated Wnt signature may possess TH17-like traits.
We further assessed whether the enhanced expression of Treg cell and TH17 signature genes correlated with adverse survival in the TCGA cohort, as the expression of TH17-associated genes could indicate detrimental outcomes in CRC36. The effect on survival was tested with a machine-learning approach. Coefficient values were derived for each gene in the TH17_UP, Treg_UP and the combined TH17_UP/Treg_UP signatures via Cox proportional hazards regression (TH17_UP signature is shown as an example; Extended Data Fig. 1b-d and Supplementary Table 2). Genes whose enhanced expression predicted decreased survival included LEF-1 and MAF. We then divided individuals with CRC, based on the median score of the TH17_UP, Treg_UP and TH17_UP/Treg_UP signatures (TH17_UP signature shown as example; Extended Data Fig. 1b-d).
We interrogated the survival outcomes of groups above or below the median weighted signature score. These analyses indicated that above-median signature scores for TH17_UP (Fig. 1q; P < 0.0001, log-rank test, n = 188; below and above median), Treg_UP (Fig. 1r; P < 0.0001) and, most importantly, for the combined TH17_UP/Treg_UP genes (Fig. 1s; P < 0.0001) correlated with reduced overall survival. The significant detriment in survival for the combined weighted signature (TH17_UP/Treg_UP) further supports the suggestion from the unweighted Spearman correlations that a Treg cell tumor infiltrate with TH17-like traits might result in detrimental outcome.
β-Catenin induces pro-inflammatory properties in human Treg cells.
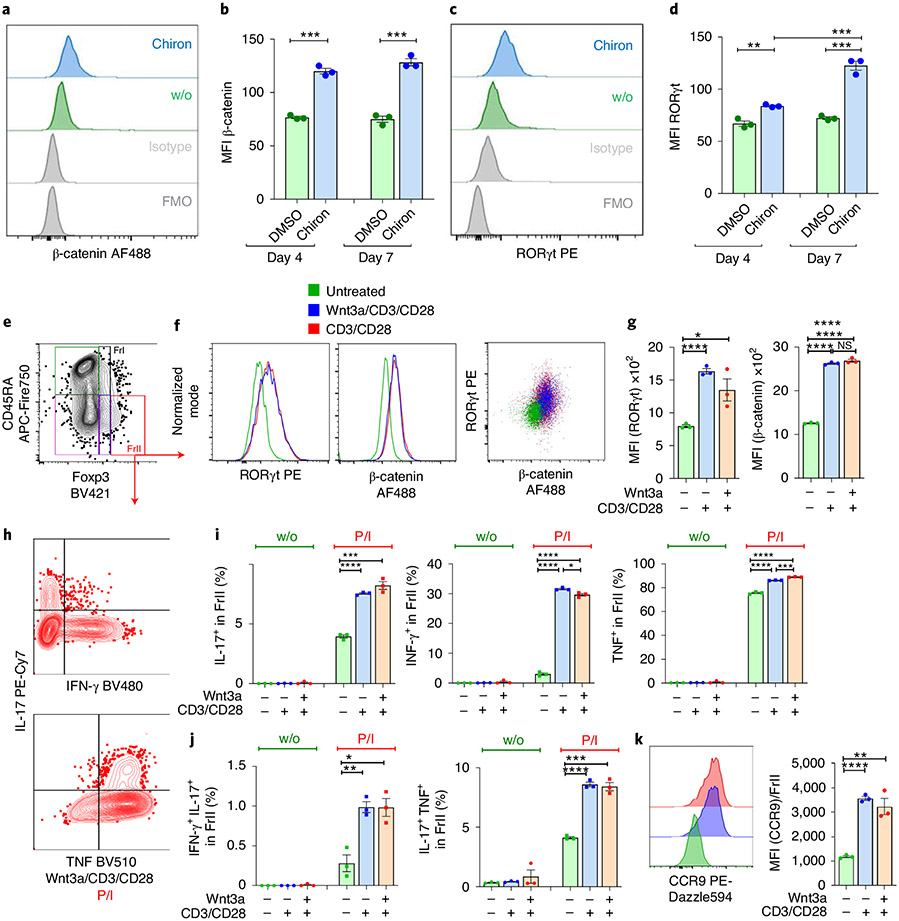
Given the correlation between RORγt expression and increased β-catenin expression in Treg cells of individuals with IBD and IBD-Dys, we investigated whether β-catenin stabilization was sufficient to induce RORγt and pro-inflammatory cytokine expression in Treg cells from HDs. We treated peripheral blood mononuclear cells (PBMCs) from HDs ex vivo with the GSK-3β inhibitor Chiron (CHIR99021) to stabilize β-catenin protein. β-catenin and RORγt expression were assessed in CD4+CD25+Foxp3+ Treg cells after 4 and 7 d of culture (Fig. 2a,c). Expression of both proteins was significantly elevated in Treg cells after Chiron treatment, with β-catenin expression plateauing on day 4 and RORγt expression significantly increasing further between days 4 and 7 (Fig. 2b,d).
Fig. 2 ∣. Ex vivo stabilization of β-catenin in human Treg cells induces the pro-inflammatory phenotype.
a–d, Ex vivo treatment of HD PBMCs with GSK-3β inhibitor Chiron for 4 to 7 d. Flow cytometric histograms and cumulative MFI analysis of β-catenin (a and b) and RORγt (c and d) expression in CD25+Foxp3+ Treg cells in these cultures. DMSO, dimethylsulfoxide. e–k, Ex vivo Wnt signaling pathway induction in HD PBMCs. e, Representative gating scheme to identify Treg cell fractions f, Representative flow cytometric histograms and dot plot of β-catenin and RORγt expression in Fr.II Treg cells on day 6 of culture. g, Cumulative MFI analysis of β-catenin and RORγt expression in Treg cells. h, Representative flow cytometric profiles of IL-17 versus IFN-γ or TNF production in Fr.II Treg cells. i,j, Cumulative analysis of IL-17+, IFN-γ+ and TNF+ Fr.II Treg cells (i), and dual production of IL-17/IFN-γ and IL-17/TNF (j), before and after stimulation with PMA/ionomycin (P/I). k, Representative flow cytometric histograms and cumulative MFI analysis of CCR9 expression. Each experiment was performed three times (with PBMCs from different HDs) in triplicate; data are represented as the median ± s.e.m., and statistical testing is depicted as two-sided, unpaired t-tests; *P ≤ 0.05, **P ≤ 0.01, ***P ≤ 0.001, ****P ≤ 0.0001.
Next to regulating β-catenin, GSK-3β phosphorylates STAT proteins in T cells37, which promote the expression of pro-inflammatory cytokines IL-17 (STAT3)38 and IFN-γ (STAT1)39. Hence, GSK-3β inhibition cannot be used to assess downstream cytokine production. Alternatively, in human primary T cell cultures19 and in murine thymocytes40, it was shown that TCR engagement stabilizes β-catenin. To determine the physiological effect of β-catenin activation, we cultured HD PBMCs for 4 d in the presence of its natural activator, Wnt3a, in combination with CD3/CD28 beads, CD3/CD28 beads alone or vehicle control. CD3/CD28 beads were removed from cultures on day 4, and Fr.II Treg cells were analyzed for β-catenin, RORγt expression and cytokine production on day 6 (Fig. 2e-i). Expression of β-catenin and RORγt directly correlated and increased significantly in Wnt3a/CD3/CD28 and CD3/CD28 compared to vehicle control-treated Fr.II Treg cells (Fig. 2f,g). Moreover, significantly higher frequencies of Wnt3a/CD3/CD28- and CD3/CD28-treated Fr.II Treg cells expressed the pro-inflammatory cytokines IL-17, IFN-γ and TNF after PMA/ionomycin stimulation (Fig. 2i). Like in individuals with IBD and IBD-Dys, expression of IL-17 and TNF, but also IL-17 and IFN-γ, coincided (Fig. 2h,j). Interestingly, the gut-homing receptor CCR9 became strongly upregulated in Fr.II Treg cells upon Wnt–β-catenin-activating stimulation (Fig. 2k). Collectively, these observations indicate that β-catenin stabilization in primary human PBMCs is sufficient to drive the pro-inflammatory phenotype of Treg cells.
RORγt+ Treg cell subpopulations expand in murine IBD to CRC progression.
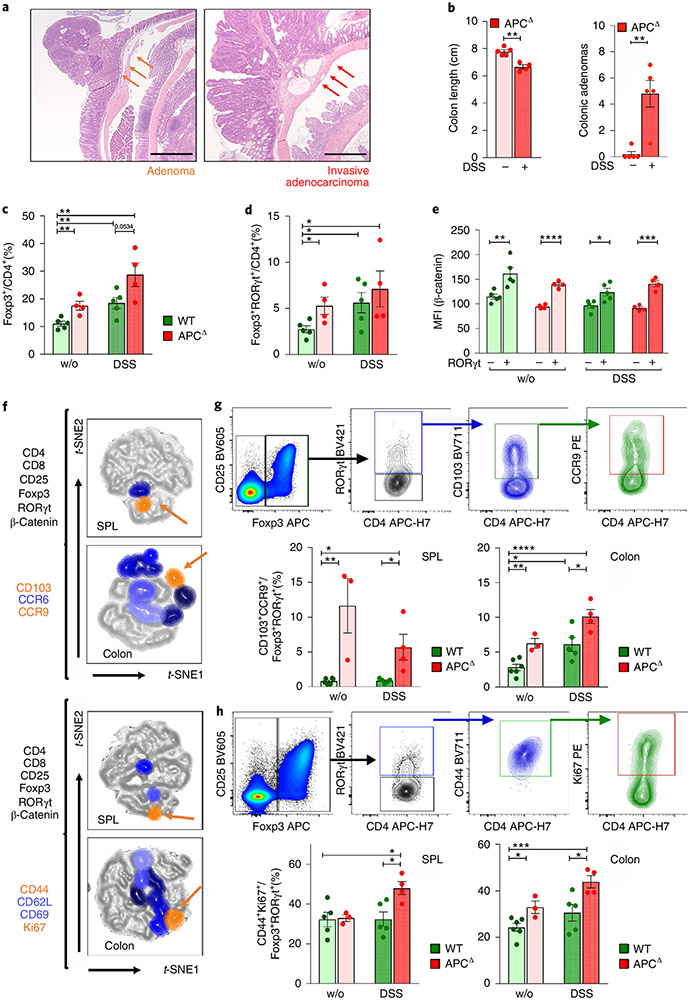
To recapitulate our findings in individuals with IBD and IBD-Dys and further analyze IBD/CRC-associated RORγt+ Treg cells, we used our murine ApcΔ468 (ApcΔ) polyposis model. Here, translation of the adenomatous polyposis coli (APC) protein prematurely terminates due to ablation of exons 11–12, resulting in a truncated, nonfunctional 468aa protein. ApcΔ mice, like ApcMin/+ mice, develop intestinal polyposis that spreads to the colon over time, and die between 6–8 months of age41. We previously used the ApcΔ model to demonstrate that Treg-specific ablation of Rorc reduced polyp burden30. Treatment of ApcMin/+ mice with dextran sulfate sodium (DSS), which causes colitis in mice42, results in development of invasive CRC43. We established invasive colonic lesions, by treating 3- to 4-month-old ApcΔ mice with three rounds of 2% DSS in drinking water for 7 d followed by 2 weeks of recovery. This regimen led to colon shortening and a highly significant increase in colonic adenomas compared to untreated ApcΔ mice (Fig. 3a,b).
Fig. 3 ∣. Activated RORγt+ Treg cell subpopulations peripherally expand during disease progression in a murine IBD/CRC model.
a, Representative H&E staining of an adenoma and an invasive adenocarcinoma (scale bar: 1 mm). b, Colon length and adenoma numbers in the colon of DSS-treated and untreated ApcΔ mice. c,d, Frequencies of colon-resident Foxp3+ Treg cells (c) and RORγt+ Treg cells (d) within CD4+CD8− T cells for the four treatment groups. e, β-catenin expression of RORγt+ versus RORγt− Treg cell populations. f, Identification and characterization of RORγt+ Treg subpopulations that increase in frequency during disease progression via t-SNE projection of multicolor flow cytometric data; two independent flow cytometric panels characterize migratory behavior and activation status. Orange arrows indicate shared populations between spleen (SPL) and colon. g,h, Gating for and quantification of shared RORγt+ Treg cell populations in different anatomic locations and treatment groups for the migratory (g) and activation (h) flow cytometric panels. WT (n = 6), WT + DSS (n = 5), APCΔ (n = 4), APCΔ + DSS (n = 4); one of a series of three experiments; data are represented as the median ± s.e.m., and statistical testing is depicted as two-sided, unpaired t-tests; *P ≤ 0.05, **P ≤ 0.01, ***P ≤ 0.001, ****P ≤ 0.0001.
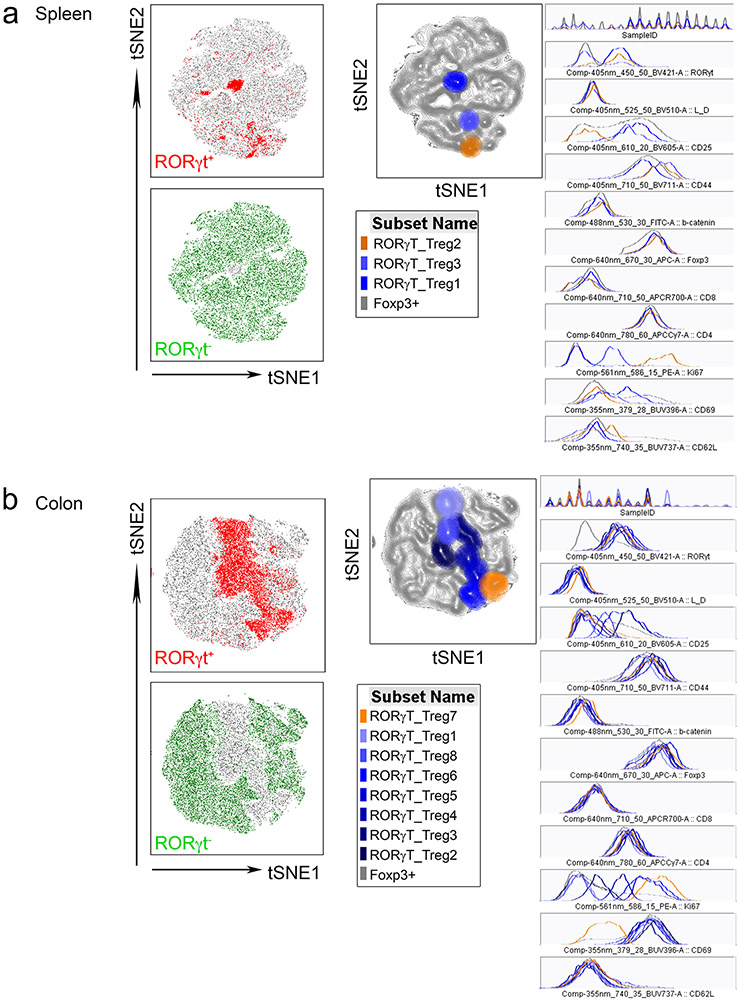
Next, we assessed the frequencies of total colonic and RORγt+ Treg cells. Each of the three pathologic conditions—colitis (wild type (WT) + DSS), polyposis (ApcΔ-DSS) and IBD/CRC (ApcΔ + DSS)—displayed increased colonic CD25+Foxp3+ and RORγt+ Treg frequencies compared to naïve mice (WT-DSS; Fig. 3c,d). As observed in individuals with IBD, β-catenin expression was significantly higher in RORγt+ than in RORγt− Treg cells for all treatment groups (Fig. 3e). However, both total and RORγt+ Treg cells trended toward higher frequencies in IBD/CRC compared to colitis or polyposis alone (Fig. 3c,d). We speculated that specific subpopulations of RORγt+ Treg cells increased under IBD/CRC conditions, but the effect was masked by the overall increase of Treg cells. Therefore, we designed two flow cytometric panels comprising CD4, Foxp3, CD25, RORγt and β-catenin to distinguish distinct RORγt+ and RORγt− Treg subsets. The first panel assessed tissue and inflammation-homing markers: gut-homing receptor CCR9, inflammation-homing receptor CCR6 and tissue-residency marker CD103. The second panel focused on proliferation and activation markers: Ki67, CD44, CD69 and CD62L (Fig. 3f). We gated on CD4+CD25+Foxp3+ Treg cells from spleen and colon MNCs, concatenated the populations from all experimental groups and performed t-distributed stochastic neighbor embedding (t-SNE) analysis. RORγt+ Treg gates were then superimposed onto the respective t-SNE landscape revealing unique populations (Extended Data Fig. 3a,b). These landscapes showed greater complexity of RORγt+ Treg cell populations in the colon than in the spleen (migration panel: colon = 8, spleen = 2 populations; activation panel: colon = 8, spleen = 3 populations, Fig. 3f). To trace the origin of these cells, we focused on populations that share markers between the spleen and colon (Fig. 3f). Analysis of expression profiles (Extended Data Fig. 3a,b) revealed that RORγt+ Treg cell populations shared between the colon and spleen expressed CCR9/CD103 and Ki67/CD44 (Fig. 3f). Cumulative frequencies of CCR9+CD103+ (Fig. 3g) and CD44+Ki67+ (Fig. 3h) RORγt+ Treg cells increased in the IBD/CRC group (ApcΔ + DSS) compared to the untreated WT, colitis (WT + DSS) and polyposis (ApcΔ-DSS) groups for colonic and splenic samples. Moreover, polyposis (ApcΔ-DSS) or colitis (WT + DSS) also showed elevated frequencies of the shared Treg cell populations in the colon, compared to the untreated group. These findings suggested that during IBD/CRC carcinogenesis, distinct subpopulations of activated RORγt+ Treg cells with gut-homing properties expanded in the colon and the periphery.
β-Catenin stabilization recapitulates the pro-inflammatory phenotype in mouse Treg cells.
To examine whether Treg-specific activation of Wnt–β-catenin signaling was sufficient to induce pro-inflammatory RORγt+ Treg cells and their physiological effects in mice, we introduced the Ctnnb1fl(ex3) allele into Foxp3YFP-Cre mice. Cre excision of the floxed exon 3 encoding the β-catenin degradation domain leads to intracellular accumulation of β-catenin protein.
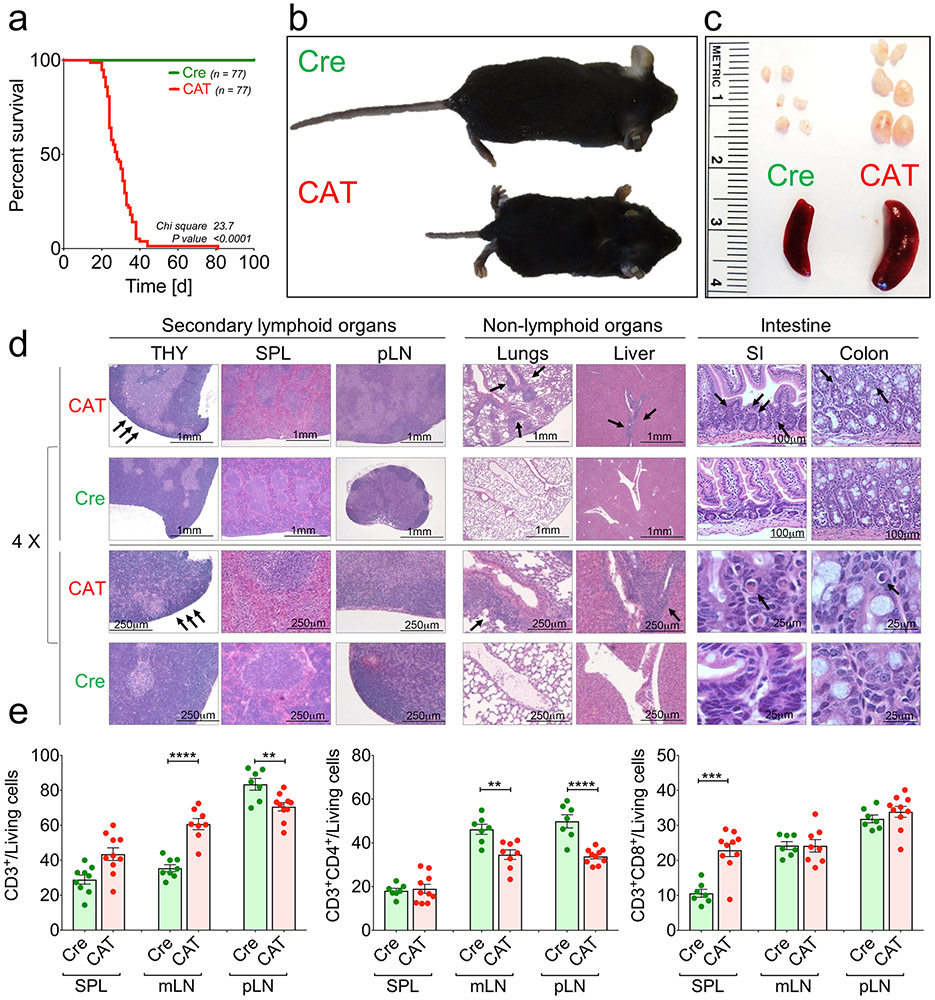
As the Foxp3 gene resides on the X chromosome, male mice are hemizygous. Male Foxp3YFP-CreCtnnb1fl(ex3) (CAT) mice showed severe X-linked, scurfy-like44 immunopathology. They were smaller than Foxp3YFP-Cre WT (Cre) littermates, died ~3–4 weeks after birth and presented enlarged secondary lymphoid organs (Extended Data Fig. 4a-c). Histological assessment by hematoxylin and eosin (H&E) staining of paraffin-embedded tissue sections revealed a reduced thymic cortex and severe immune infiltrates in lungs and liver (Extended Data Fig. 4d). These observations mirrored those of a recent study using a different Foxp3-Cre with the same Ctnnb1fl(ex3) allele21.
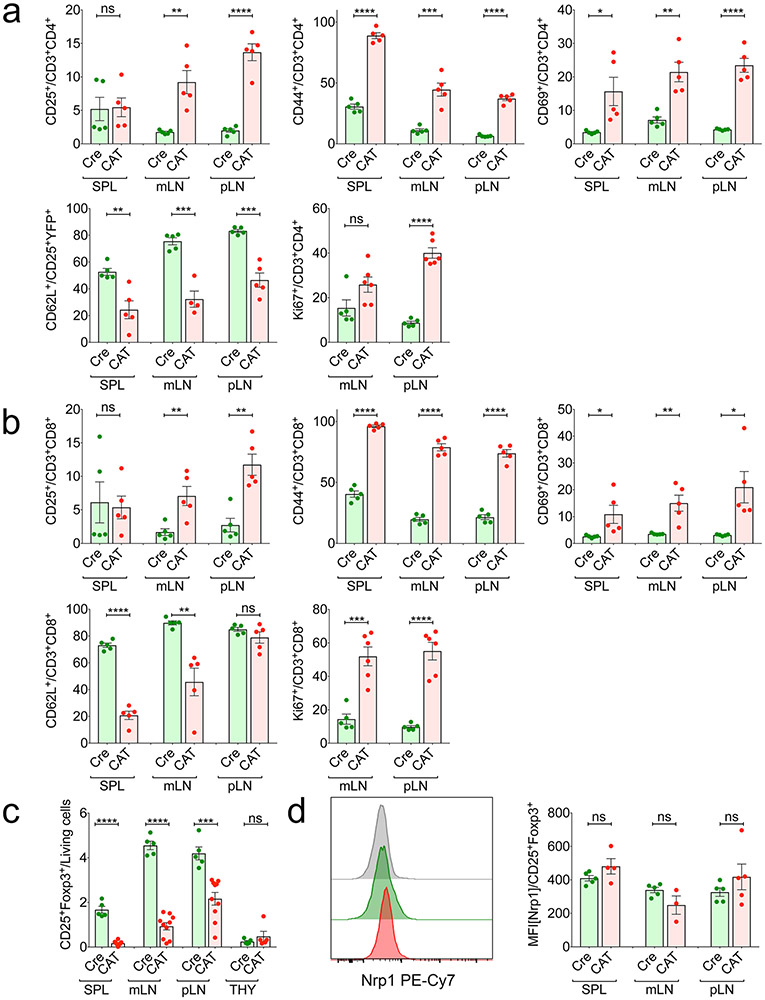
The pathology in CAT mice implied a lymphoproliferative disorder. Hence, we assessed the activation status of Tcon cells in peripheral lymphoid organs and thymi of 21-day-old mice. Compared to Cre-only mice, CAT mice had increased frequencies of total CD3+ cells in the spleen and peripheral lymph nodes (pLNs), with decreased CD4+ TH cells in the pLNs and mesenteric lymph nodes (mLNs) and increased CD8+ cytotoxic T lymphocytes (CTLs) in the spleen (Extended Data Fig. 4e). Imbalanced T cell proliferation was further supported by the increase of Ki67+ TH cells and CTLs in CAT compared to WT mice (Extended Data Fig. 5a,b). Moreover, CD25−Foxp3−CD4+ TH cells and CTLs were strongly activated in CAT mice, as shown by significantly increased frequencies of CD44+, CD69+ and CD25+ cells in all peripheral lymphoid organs and reduced frequencies of cells expressing the naïve T cell marker CD62L (Extended Data Fig. 5a,b).
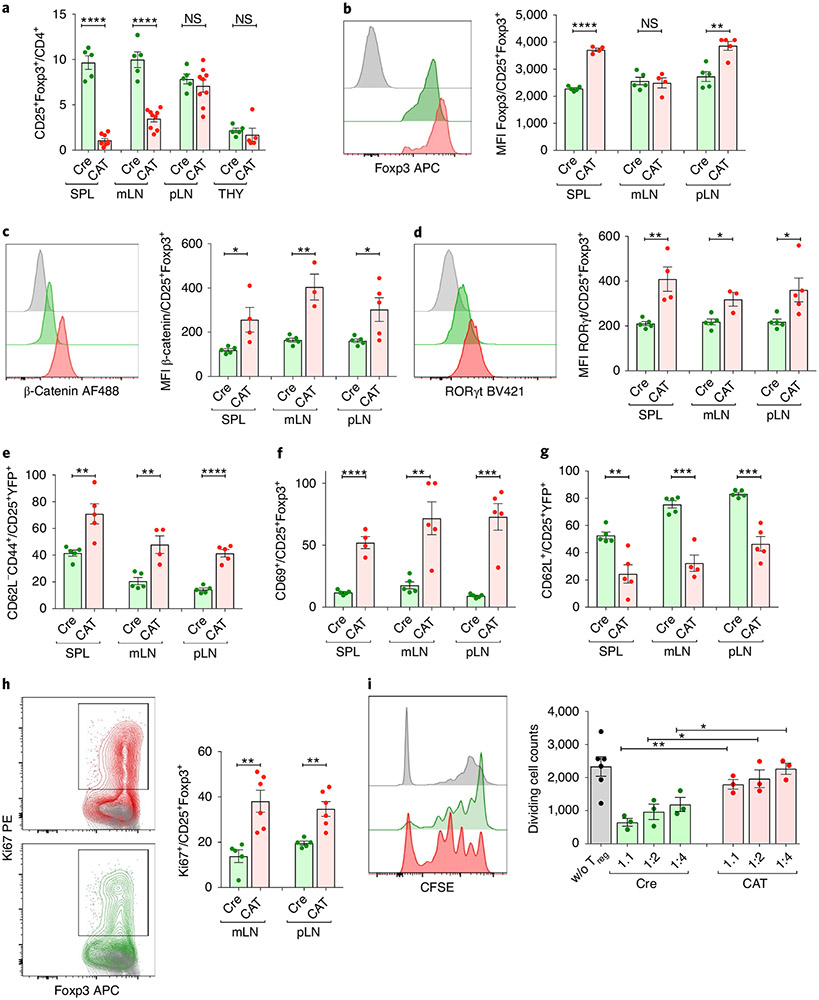
The highly activated effector T cell compartment in CAT mice suggested that β-catenin stabilization altered Treg cell homeostasis and/or function. Treg cell frequencies strongly decreased within mLNs and spleen of CAT mice; however, their thymic generation was unaltered (Fig. 4a and Extended Data Fig. 5c). In peripheral Treg cells, Foxp3 expression mildly increased (Fig. 4b), whereas expression of the Treg cell marker Neuropilin did not change (Extended Data Fig. 5d). Similarly to human ex vivo cultures, β-catenin stabilization was sufficient to uniformly upregulate RORγt expression in CAT (β-cateninhi) compared to Cre Treg cells (Fig. 4c,d). Moreover, β-cateninhi Treg cells were highly activated and more proliferative, as evidenced by increased frequencies of CD44+, CD69+ and Ki67+ Treg cells and decreased CD62L+ Treg cells in CAT mice (Fig. 4e-h). Lastly, we tested the ability of β-cateninhi Treg cells to suppress proliferation of polyclonally activated, CFSE-labeled CD4+CD25− effector T cells (Teff) in vitro. Compared to the Cre control, β-cateninhi Treg cells had significantly reduced suppressive function for all Treg:Teff ratios tested (Fig. 4i).
Fig. 4 ∣. Treg cell-specific β-catenin stabilization results in an activated Treg cell phenotype in mice.
a, Frequency of CD25+Foxp3+ Treg cells in Cre and CAT mice within CD3+CD4+ T cells (CAT (n = 10), Cre (n = 5)). b–d, Intracellular expression of Foxp3 (b), β-catenin (c) and RORγt (d) in Foxp3Cre(0/+) WT (Cre) and Foxp3Cre(0/+) Ctnnb1fl(ex3) (CAT) Treg cells, depicted as representative flow plots and cumulative column plots for peripheral lymphoid organs; Cre_SPL (n = 5), Cre_mLN (n = 5), Cre_pLN (n = 5), CAT_SPL (n = 4), CAT_mLN (n = 4), CAT_mLN (n = 5). e–h, Activation status and proliferation of Treg cells in Cre and CAT mice was determined through staining and flow cytometric analysis of CD44 (e) (Cre_SPL (n = 5), Cre_mLN (n = 5), Cre_pLN (n = 5), CAT_SPL (n = 5), CAT_mLN (n = 4), CAT_mLN (n = 5)), CD69 (f) (Cre_SPL (n = 5), Cre_mLN (n = 5), Cre_pLN (n = 5), CAT_SPL (n = 4), CAT_mLN (n = 5), CAT_mLN (n = 5)), CD62L (g) (Cre_SPL (n = 5), Cre_mLN (n = 5), Cre_pLN (n = 5), CAT_SPL (n = 5), CAT_mLN (n = 4), CAT_mLN (n = 5)) and Ki67 (h) (Cre_SPL (n = 5), Cre_pLN (n = 5), CAT_SPL (n = 6), CAT_mLN (n = 6)) in the indicated lymphoid organs. i, Representative flow cytometric histograms and cumulative analysis of the suppressive capacity of Treg cells derived from Cre versus CAT mice. Fraction of proliferating, polyclonally activated CD4+ Tcon cells is shown. 1:1, 1:2, 1:4 = Treg:Tcon ratio (CAT (n = 3), Cre (n = 3) and untreated (w/o; n = 6) Treg cells). Data are represented as the median ± s.e.m., and statistical testing is depicted as two-sided, unpaired t-tests; *P ≤ 0.05, **P ≤ 0.01, ***P ≤ 0.001, ****P ≤ 0.0001.
Thus, β-catenin stabilization in murine Treg cells was sufficient to upregulate RORγt and induce a pro-inflammatory phenotype that, combined with a reduced suppressive function, likely causes a lymphoproliferative disease in mice.
β-Cateninhi Treg cells express pro-inflammatory cytokines in healthy chimeric mice.
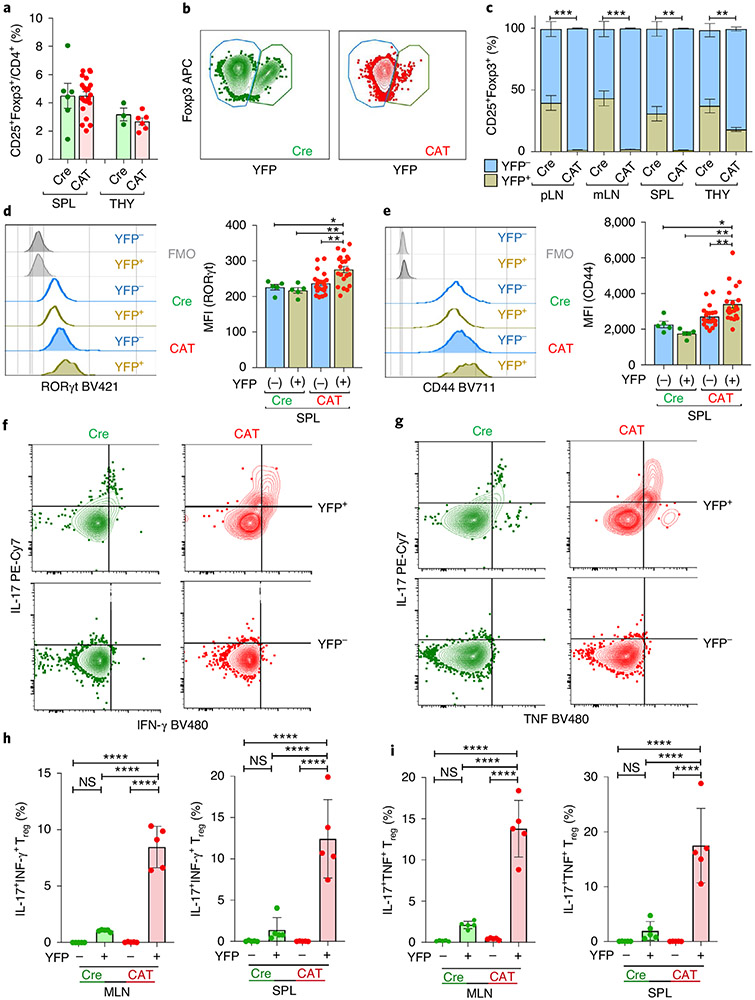
Foxp3YFP-Cre heterozygous females represent natural chimeras of β-cateninhi YFP+ versus WT YFP− Treg cells due to random X-chromosome inactivation. These mice provide the opportunity to test the inherent pathogenic potential of β-cateninhiRORγthi Treg cells in a competitive chimeric setting. Interestingly, compared to hemizygous males, heterozygous Foxp3Cre(+/−) females that carry the Ctnnb1fl(ex3) allele are healthy.
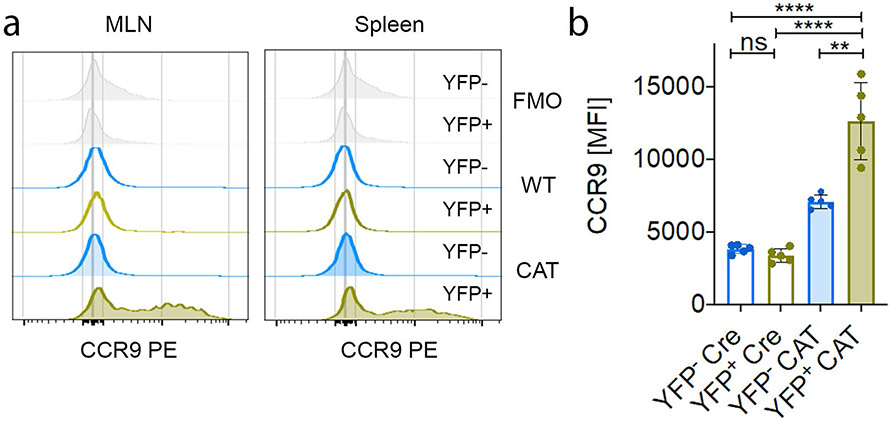
Total Treg cell frequencies were identical in the spleen and thymus of Cre (Foxp3YFP-Cre(+/−) WT) and CAT (Foxp3YFP-Cre(+−)Ctnnb1fl(ex3)) female mice (Fig. 5a). The frequency of YFP+ Treg cells, however, was drastically reduced in CAT compared to Cre females (Fig. 5b). Cumulative analysis of YFP+ and YFP− Treg cell frequencies showed that YFP+ cells only accounted for 1–3% of total Treg cells in all peripheral lymphoid organs of female CAT mice, and their thymic output dropped to 20% (Fig. 5c). In Cre females, the YFP+:YFP− Treg cell ratio was also reduced to 40%:60% (Fig. 5b,c). This could be attributed to the YFP-Cre transgene rendering Foxp3 expression in Cre-expressing Treg cells mildly hypomorphic compared to those with an unaltered Foxp3 locus45. The persisting β-cateninhi YFP+ Treg cells had elevated RORγt expression and an activated (CD44+) phenotype compared to CAT YFP− cells, but also compared to Cre YFP+ and YFP− Treg cells (Fig. 5d,e). In accordance with our findings in individuals with IBD and IBD-Dys, CAT β-cateninhi YFP+ compared to YFP− Treg cells and to Cre YFP+ and YFP− Treg cells spontaneously expressed the pro-inflammatory cytokines IL-17, IFN-γ and TNF. Moreover, a significant proportion of these β-cateninhi YFP+ Treg cells coexpressed IL-17 + IFN-γ or IL-17 + TNF (Fig. 5f-i). The gut-homing receptor CCR9 was also upregulated (Extended Data Fig. 6a,b), like in Wnt3a/anti-CD3/CD28-treated human Treg cells. Collectively, in a noninflamed, chimeric setting, β-cateninhiRORγthi Treg cells have a competitive disadvantage in mice. Although they do not spontaneously cause disease, they still produce pro-inflammatory cytokines.
Fig. 5 ∣. β-cateninhi Treg cells have a competitive disadvantage in an unperturbed chimeric setting.
a–i, Flow cytometric characterization of Foxp3Cre(+/−) Ctnnb1fl(ex3) (CAT) and Foxp3Cre(+/−) (Cre) heterozygous female mice representing intrinsic Treg chimeras. a, Frequency of Treg cells within CD4+ T cells in spleen and thymus (Cre_SPL (n = 6), CAT_SPL (n = 21), Cre_THY (n = 3), CAT_THY (n = 6)). b,c, Representative flow cytometric dot plots (b) and quantification (c) of Cre+/YFP+ and Cre−/YFP− fractions in lymphoid organs (Cre_pLN (n = 5), CAT_pLN (n = 5), Cre_mLN (n = 5), CAT_mLN (n = 5), Cre_SPL (n = 6), CAT_SPL (n = 21), Cre_THY (n = 3), CAT_THY (n = 6)). d,e, Representative flow cytometric histograms and cumulative analyses of RORγt (d) and CD44 (e) expression in YFP+/YFP− Treg cells; Cre (n = 5), CAT (n = 21). f,g, Representative flow cytometric dot plots of IL-17 versus IFN-γ (f) and IL-17 versus TNF (g) production in YFP+ versus YFP− Cre and CAT mLN Treg cells. h,i, Cumulative analysis of the frequencies of coproduction of IL-17 and IFN-γ (h) and IL-17 and TNF (i) in YFP+ and YFP− Cre and CAT Treg cells in mLNs and spleen; Cre (n = 5), CAT (n = 5); data are represented as the median ± s.e.m., and statistical testing is depicted as two-sided, unpaired t-tests; *P ≤ 0.05, **P ≤ 0.01, ***P ≤ 0.001, ****P ≤ 0.0001.
TCF-1 and Foxp3 co-bind accessible chromatin at crucial loci for Treg cell function.
Previous work indicated that β-catenin20 and TCF-1 (ref. 13) occupy DNA together with Foxp3. We anticipated that precise mapping of TCF-1 and Foxp3 co-binding in Treg cells could provide a molecular explanation for the change in Treg cell phenotype upon β-catenin overexpression. Therefore, we analyzed TCF-1–DNA binding in Treg cells through chromatin immunoprecipitation and deep sequencing (ChIP–seq) in Foxp3YFP-Cre WT Treg cells. Furthermore, we assessed regions of accessible chromatin in Treg cells via transposase-accessible chromatin and deep sequencing (ATAC-seq). We also used available data46 for Foxp3-binding (Foxp3-ChIP–seq) histone marks including monomethylated-histone3-Lys4 (H3K4me1), trimethylated-H3-Lys4 (H3K4me3), acetylated-H3-Lys27 (H3K27ac), trimethylated-H3-Lys27 (H3K27me3) and methyl-CpG binding domain-based capture and sequencing (MBD-seq).
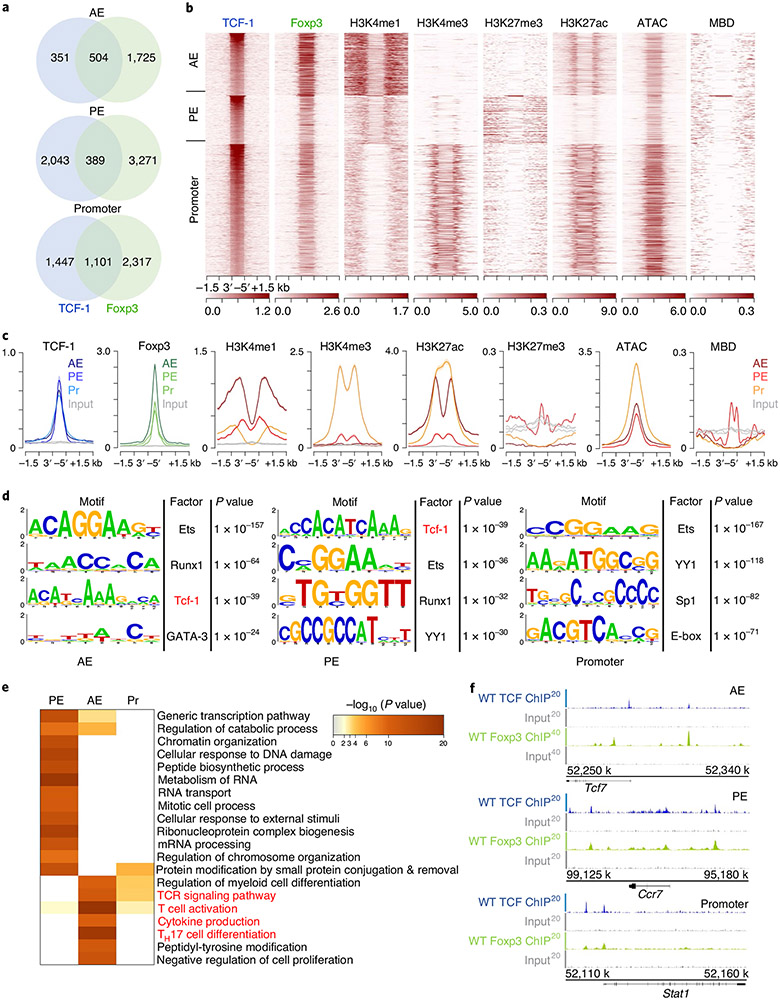
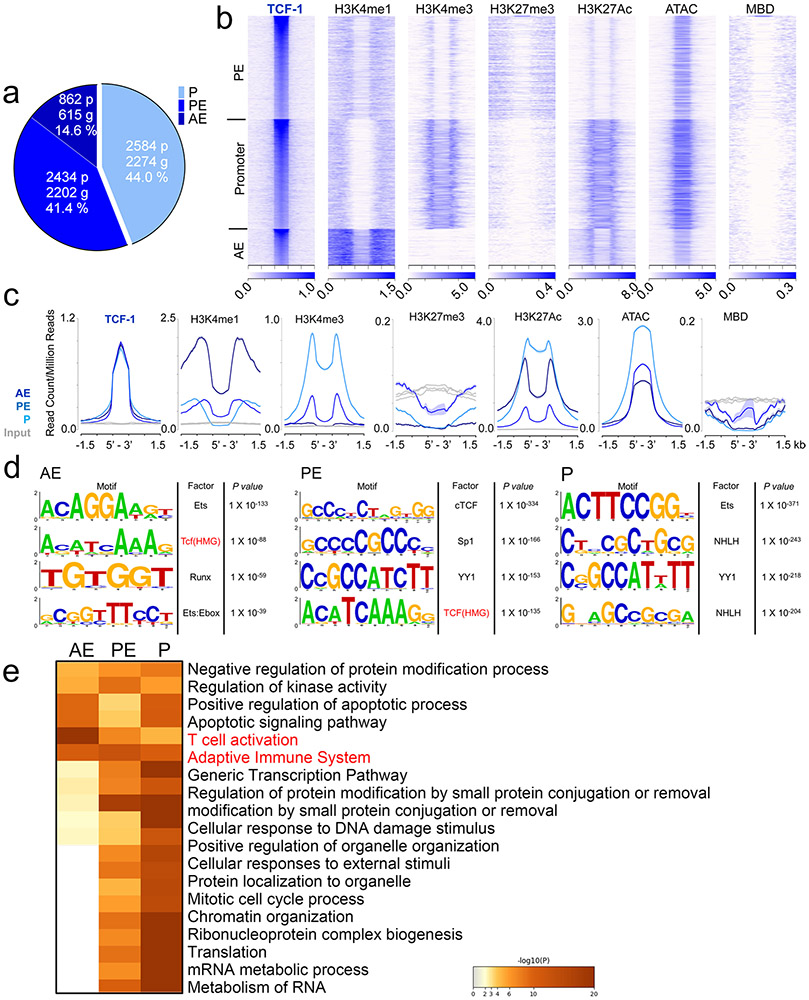
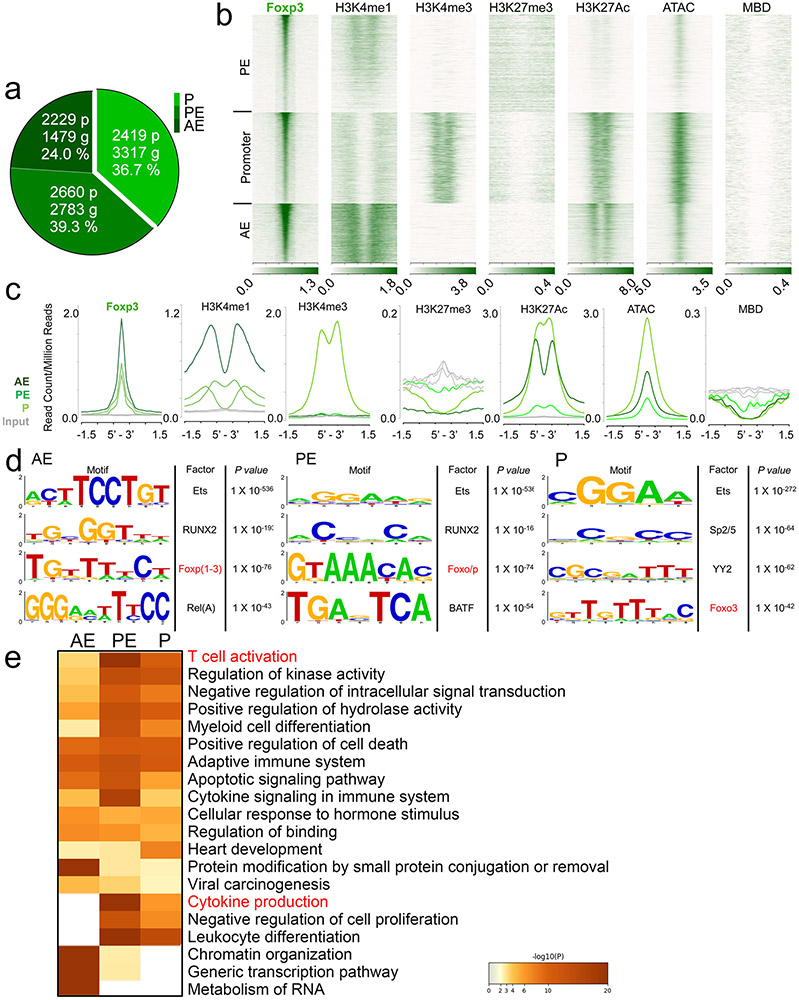
We assigned TCF-1 and Foxp3 ChIP–seq peaks to specific gene regulatory regions through k-means clustering guided by the surrounding chromatin modifications. Approximately 14.6% of TCF-1 and 24.0% of Foxp3 binding sites were assigned to active enhancers (AEs; enriched for H3K4me1 and H3K27ac), 41.6% and 39.3% to poised enhancers (PEs; enriched for H3K4me1, lacking H3K27ac) and 44.0% and 36.7% to promoters, respectively (enriched for H3K4me3, H3K27ac and accessible chromatin (ATAC-seq); Extended Data Figs. 7a-c and 8a-c). Both TCF-1 and Foxp3 preferentially bound open and poised chromatin as their binding sites rarely overlapped with the repressive histone mark H3K27me3 (Extended Data Figs. 7b,c and 8b,c). We next performed motif analysis for TCF-1- and Foxp3-bound sites. TCF-1-bound enhancer sites were enriched for the TCF-1 consensus motif, while both promoter and enhancer Foxp3-bound sites were enriched for the Foxp3 motif (Extended Data Figs. 7d and 8d). The high enrichment for motifs of other factors like ETS, RUNX and YY family members aligned with previous evidence that TCF-1 (ref. 14) and Foxp3 (ref. 12) act in multimolecular complexes. Pathway enrichment analysis (http://www.metascape.org/) revealed that TCF-1 and Foxp3 binding to promoter and enhancer sites marked genes involved in T cell activation and other T cell processes (Extended Data Figs. 6e and 7e).
We further analyzed TCF-1 and Foxp3 co-bound sites (Fig. 6), which included 504 AE, 389 PE and 1,101 promoter sites (Fig. 6a). Examples for TCF-1 and Foxp3 co-bound gene loci at AE (Tcf7), PE (Ccr7) and promoter (Stat1) sites are visualized as integrated genome browser (IGB) tracks (Fig. 6f). The TCF-1, but not the Foxp3 consensus motif, was highly enriched in the overlapping AE and promoter sites (Fig. 6d). Pathway enrichment analysis revealed that co-binding of TCF-1 and Foxp3, particularly at AE sites, marked genes involved in TH17 differentiation, T cell activation and cytokine production pathways (Fig. 6e). Thus, in Treg cells, TCF-1 and Foxp3 co-occupied sites of genes whose upregulation could explain the observed pro-inflammatory phenotype.
Fig. 6 ∣. TCF-1 co-binds accessible chromatin with Foxp3 at crucial Treg cell gene loci.
a, Venn diagrams of overlapping TCF-1 (blue) and Foxp3 (green) binding sites (numbers of peaks) in the genomic regions identified in Extended Data Figs. 6 and 7 in Treg cells for TCF-1 and Foxp3, respectively. b, Heat map of TCF-1-Foxp3 co-bound genomic regions (±1.5 kb). Enrichment of histone marks (H3K4me1, H3K4me3, H3K27me3 and H3K27ac), chromatin accessibility (ATAC) and DNA methylation (MBD) are shown. c, Comparative enrichment histograms of transcription factor binding (TCF-1 and Foxp3), histone marks, chromatin accessibility and DNA methylation marks at TCF-1-Foxp3 co-bound sites (±1.5 kb) in the genomic regions established above. d, De novo transcription factor-binding motif analysis (HOMER) of TCF-1-Foxp3 co-bound sites in the indicated genomic regions. The most highly significantly enriched motifs and corresponding P values are listed. e, Functional pathways enriched for TCF-1-Foxp3 co-bound genes in the indicated genomic regions. Pathways and their statistical enrichment were determined using Metascape. f, Representative TCF-1-Foxp3 co-bound regions at the indicated loci (IGB tracks) for the different genomic regions. ChIP-seq enrichment tracks for TCF-1 and Foxp3 and respective input controls are shown.
β-Catenin drives the epigenetic landscape of pro-inflammatory RORγt+ Treg cells.
TCF-1 is thought to be a transcriptional repressor that becomes an activator upon β-catenin binding. Hence, one could speculate that TCF-1 is part of Foxp3 repressor complexes in a Wnt-off state12, limiting the expression of genes that should not be permanently expressed in bona fide Treg cells. Thus, we postulated that β-catenin stabilization specifically affects the transcription and epigenetic states of these TCF-1–Foxp3 co-bound genes.
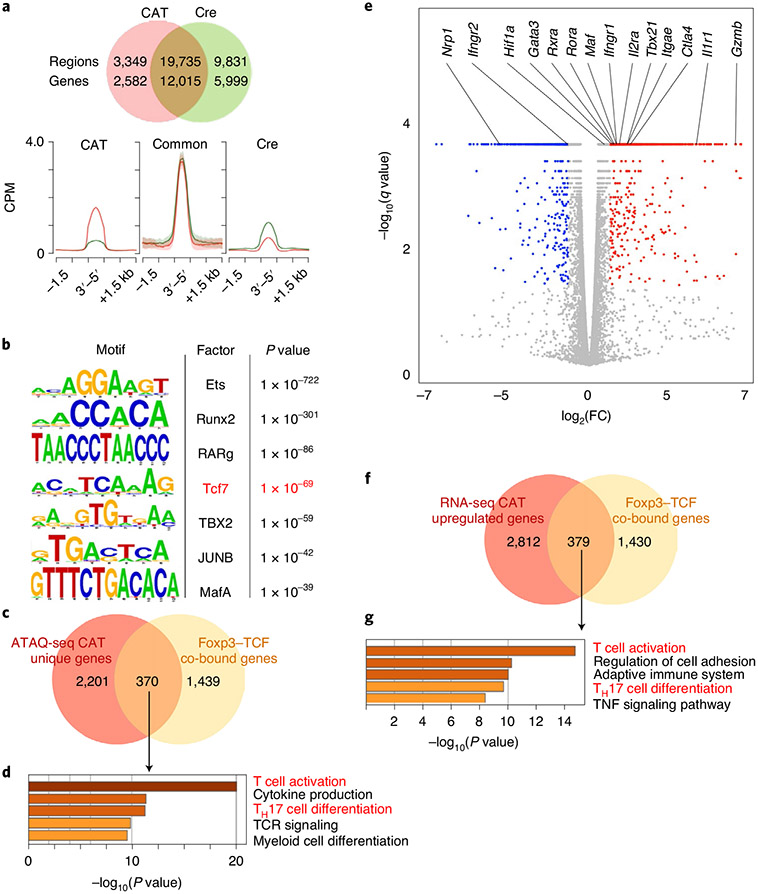
To explore this possibility, we performed ATAC-seq analysis of YFP+CD25+ β-cateninhi Treg cells isolated from CAT (Foxp3YFP-CreCtnnb1fl(ex3)) and WT (Foxp3YFP-Cre) mice (Fig. 7a). β-Cateninhi (23,084 peaks) had fewer accessible sites than Cre Treg cells (29,566 peaks). However, the sites that lost accessibility from Cre to β-cateninhi (Cre unique sites; 9,831 peaks), already had low accessibility in Cre and were not fully closed in β-cateninhi Treg cells. Most sites remained consistently accessible in both genotypes (common; 19,735 peaks), and 3,349 sites gained de novo accessibility upon β-catenin stabilization. Within the newly accessible sites, one of the most strongly enriched motifs was that of TCF-1 (Tcf7; Fig. 7b), indicating that β-catenin together with TCF-1 alter the accessibility of these sites. Motifs of transcription factors that are involved in TH17 differentiation (Maf and RARg) and T cell activation (JunB) were also highly enriched. The 3,349 newly accessible sites corresponded to 2,582 genes of which 370 were co-bound by TCF-1 and Foxp3 (Fig. 7a,c). Pathway enrichment analysis of these 370 genes revealed that T cell activation, cytokine production and TH17 differentiation pathways were most significantly enriched (Fig. 7d).
Fig. 7 ∣. Activation of β-catenin in Treg cells increased the accessibility and transcription of genes in TH17 differentiation and T cell activation pathways.
a, Venn diagram comparing accessible chromatin sites in CAT (red) versus Cre (green) Treg cells and comparative enrichment histograms of chromatin accessibility at CAT and Cre common sites, newly gained in CAT sites, as well as Cre unique sites. CPM, counts per million mapped reads. b, De novo transcription factor-binding motif analysis (HOMER) of newly accessible sites in CAT Treg cells. The most significantly enriched motifs and corresponding P values are listed. c, Venn diagram comparing genes gaining newly accessible sites in CAT Treg cells to TCF-1-Foxp3 co-bound genes. d, Functional pathway enrichment analysis of genes that gained accessibility in CAT Treg cells and are TCF-1-Foxp3 co-bound. e, Volcano plot of differentially expressed genes in CAT over Cre Treg cells (q-value cutoff < 1 × 10⁻⁵). f, Venn diagram comparing genes that were significantly upregulated (q < 0.05) in CAT Treg cells with TCF-1-Foxp3 co-bound genes. g, Functional pathway enrichment analysis of genes that were transcriptionally upregulated in CAT Treg cells and co-bound by TCF-1-Foxp3. Cells for ATAC-seq and RNA-seq analysis were isolated from pLNs of age-matched 21-day-old CAT and Cre WT mice.
We next performed RNA-seq expression profiling to investigate how the changes in chromatin accessibility impacted transcription in β-cateninhi Treg cells. Around 3,190 genes were upregulated and 2,795 were downregulated (q value ≤ 0.05) in β-cateninhi compared to Cre Treg cells. The upregulated list comprised genes that are essential for Treg cell function, including Ctla4 and Il2ra (CD25; Fig. 7e). Pathway enrichment analysis of significantly upregulated genes that were co-bound by TCF-1–Foxp3 (Fig. 7f-g) revealed enrichment for the same pathways identified by the newly accessible chromatin sites, namely, T cell activation and TH17 differentiation (Extended Data Fig. 9).
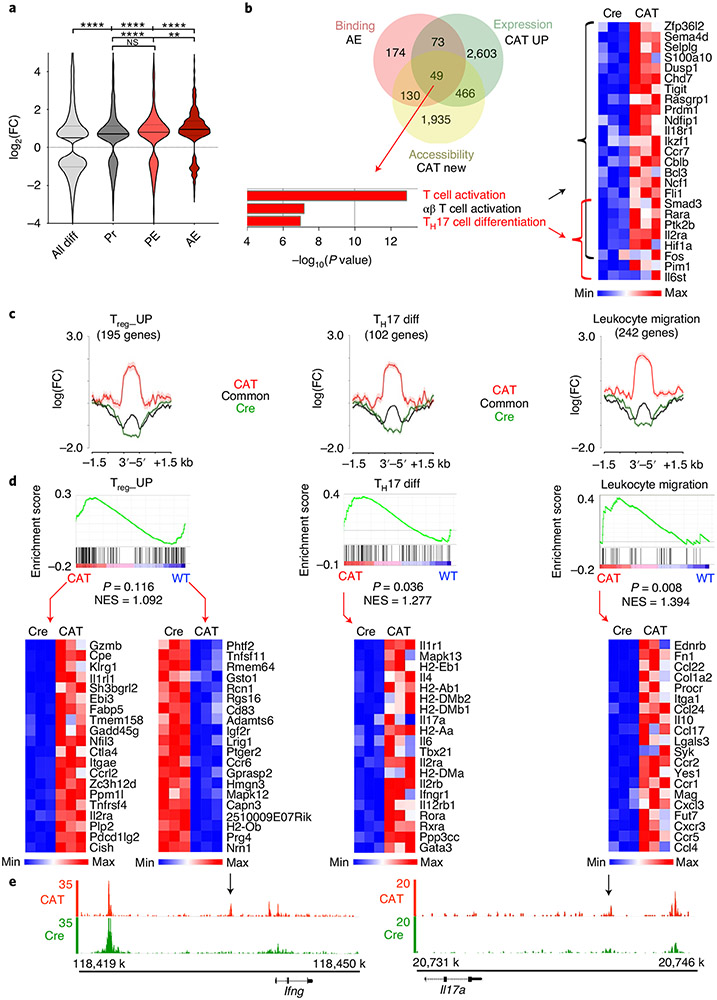
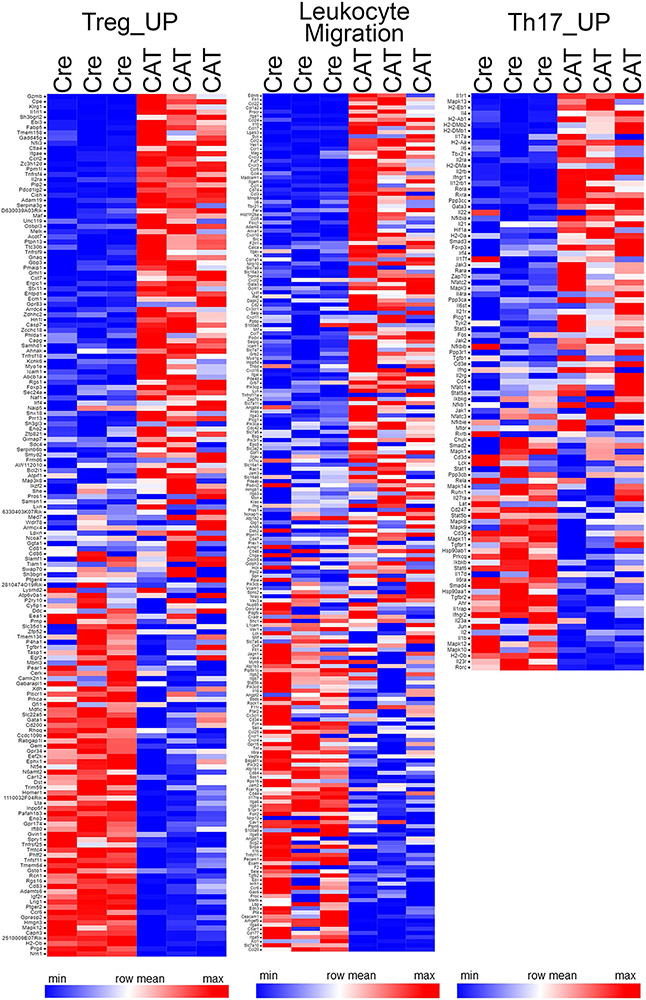
Next, we assessed the chromatin accessibility changes following β-catenin stabilization of genes co-bound by TCF-1–Foxp3 in different regulatory regions. Therefore, we compared the log2 fold accessibility changes upon β-catenin stabilization for promoter, PE and AE co-bound genes to those of all differentially accessible genes (Fig. 8a). Although TCF-1–Foxp3 co-bound genes gained accessibility overall, the AE-bound genes showed the strongest accessibility increase in β-cateninhi Treg cells (Fig. 8a). As AE co-bound genes were most affected by β-catenin stabilization, we specifically searched for upregulated genes that gained accessibility and were TCF-1–Foxp3 co-bound at AE sites (Fig. 8b). This yielded 49 genes that were enriched for the T cell activation and TH17 differentiation pathways (Fig. 8b). We further validated these findings using an inverse, non-supervised approach. We retrieved gene lists for the TH17 differentiation (102 genes) pathway (gene-set enrichment analysis (GSEA)/MSigDB database), and applied the same Treg_UP signature (195 genes) used for TCGA screening. The leukocyte migration pathway (242 genes; GSEA/MSigDB database) was also assessed due to the observed increase in CCR9 expression in human and murine RORγt+ Treg cells, suggesting their migration from the colon to the periphery. A comparison of accessibility of genes in these pathways showed strong de novo accessible sites after β-catenin stabilization compared to common and WT sites (Fig. 8c). Moreover, GSEA47 showed a significant upregulation of TH17 differentiation and leukocyte migration pathways (Fig. 8d and Extended Data Fig. 9). The Treg_UP signature, however, was not consistently changed between WT and β-cateninhi Treg cells (Fig. 8d). This indicated that the core Treg cell program was not drastically altered, but effector T cell functions were acquired upon β-catenin activation. For instance, newly accessible sites in the Ifng and Il17a loci were gained (Fig. 8e), which may account for the ability of β-cateninhi Treg cells to spontaneously produce IL-17 and IFN-γ.
Fig. 8 ∣. β-catenin stabilization epigenetically changes the activation of critical Foxp3 and TCF-1 co-regulated genes to drive the phenotype of RORγt+ Treg cells.
a, Differential accessibility estimated by ATAC-seq in regulatory regions of TCF-1-Foxp3 co-bound genes (AE: n = 373; PE: n = 275; Pr: n = 613) compared to all differentially accessible genes (all diff: n = 14,452; data are represented as the median ± two quartiles (dotted lines). Statistical testing is depicted as a Mann–Whitney, two-sided test with **P ≤ 0.01, ****P ≤ 0.0001). FC, fold change. b, Venn diagram comparing TCF-1-Foxp3 co-bound genes in active enhancers (red), transcriptionally upregulated genes in CAT Treg cells (green) and genes that gained newly accessible chromatin sites in CAT Treg cells (yellow). Functional pathway enrichment analysis of the Venn diagram overlap and corresponding RNA expression heat map (n = 3 biological replicates for each genotype; fragments per transcript kilobase per million fragments mapped (FPKMs)) are shown. c, Differential accessibility at genes within the Treg_UP (n = 195), TH17 differentiation (n = 102) and leukocyte migration signatures (n = 242). Data are represented as the mean ± s.e.m. across the regions and shown as a semitransparent shade around the mean curves. d, GSEA (top) and associated RNA expression heat maps of indicated leading-edge genes (bottom; n = 3 biological replicates for each genotype; FPKMs). NES, normalized enrichment score. e, IGB tracks for ATAC-seq accessibility at Ifng and Il17a genomic loci in CAT and Cre Treg cells. Arrows indicate CAT-enriched open chromatin peaks.
Overall, our findings indicate that β-catenin activation caused epigenetic and transcriptional changes of crucial Foxp3–TCF-1 co-regulated genes resulting in the induction of pro-inflammatory programs that were superimposed onto the Treg cell program.
Discussion
Diverse Treg cell populations that express transcriptional programs in addition to the core Treg cell signature were described previously1-7. Here we show that during IBD and progression to dysplasia, RORγt-expressing Treg cells that produce pro-inflammatory cytokines selectively expand in the colon and PB of individuals. We linked this phenotype to enhanced Wnt–β-catenin signaling in both humans and animal models.
In healthy mice, a specific consortium of bacteria induces RORγt+ Treg cells mainly in the colon, where they regulate local inflammatory responses6,7. During IBD and progression to cancer, bacterial antigens and chronically inflamed, damaged mucosal tissue mediate persistent TCR stimulation48. Furthermore, CRC tumors and the inflamed mucosa secrete enhanced levels of activating Wnt proteins49,50. Persistent TCR stimulation19,40 in a Wnt-rich environment can activate Wnt–β-catenin in T cells and, as we show here in ex vivo studies with primary human PBMCs, it induces pro-inflammatory cytokine production and RORγt expression in Treg cells specifically. Furthermore, genetic Treg-specific β-catenin stabilization in mice induces Treg cells that are homogenously RORγthi and spontaneously produce IL-17, IFN-γ and TNF even in a noninflamed, competitive chimeric setting. Thus, constitutive Wnt–β-catenin signaling in human and murine Treg cells is sufficient to promote the pro-inflammatory RORγt+ phenotype.
We previously showed increased frequencies of circulating RORγt+ Treg cells in individuals with sporadic CRC30. Mucosal barrier dysfunction51,52 in IBD and IBD-Dys can cause systemic microbial and tissue-specific antigen spread. These conditions may facilitate extravasation of gut-tissue-resident RORγt+ Treg cells in an antigen-driven manner and/or support their maintenance in the periphery, thereby increasing their frequencies in IBD and CRC. Here we provide evidence that circulating RORγt+ Treg cells are possibly derived from the colonic mucosa. We found high frequencies of RORγt+ Treg cells with pro-inflammatory properties in the mucosa of individuals with IBD-Dys and RORγt+ Treg cells with a matching pro-inflammatory phenotype in their PB. This promotes the notion that colonic and circulating RORγt+ Treg cells may be related, which is further supported by additional findings. First, β-catenin stabilization, both in human PBMCs and in the chimeric mouse model, upregulates the gut-homing receptor CCR9. Second, the expanding RORγt+ Treg cells in the IBD/CRC mouse model express CCR9 and the tissue-residency marker CD103, underlining their colonic/tissue origin. Finally, β-catenin stabilization transcriptionally upregulates leukocyte migration genes including CCR7, which promotes cell entry to lymphoid tissues53, suggesting altered migration.
The epigenetic and transcriptional studies presented here highlight mechanisms by which Treg-specific β-catenin activation promotes the disease-associated RORγt+ Treg phenotype. In line with previous studies20, we show that the genome-wide TCF-1–DNA binding in Treg cells substantially overlaps with that of Foxp3 (ref. 13). Importantly, we find that TCF-1 and Foxp3 co-bind AE regions of genes responsible for TH17 differentiation, T cell activation and leukocyte migration. Recent studies have shown that Foxp3 binding to AE sites9 can activate or suppress expression of the associated genes depending on local interactions with other cofactors. In particular, Foxp3 likely acts as a repressor in complexes with YY1, EZH2 and Ikzf3 (ref. 12). Based on current evidence13,20 and our own results, TCF-1 likely participates in repressive regulatory complexes with Foxp3. The strong enrichment of the conserved YY1 binding motif in the Foxp3–TCF-1 co-bound DNA sites further supports this suggestion. Moreover, our findings that β-catenin stabilization enhances chromatin accessibility and the expression of certain TCF-1–Foxp3 co-bound genes indicates that the TCF-1–Foxp3-mediated regulation of these genes depends on β-catenin expression levels. Enhanced β-catenin binding to TCF-1 may alter the TCF-1–Foxp3-dependent regulation of these genes by displacing corepressors to promote transcription. Indeed, regions that gain de novo accessibility upon β-catenin stabilization are enriched for the TCF-1 binding motif, suggesting that the β-catenin-mediated epigenetic changes involve TCF-1.
In conclusion, our study establishes the progressive and systemic expansion of RORγt+ Treg cells during IBD and progression to dysplasia. We show that TCF-1 and Foxp3 function together to control the expression of a pro-inflammatory program through binding to AE regions of the associated genes. We further define that this regulation is driven by β-catenin stabilization, which promotes chromatin accessibility and enhances transcription of the TCF-1–Foxp3 co-regulated genes. β-catenin mediates upregulation of T cell activation and TH17 signature genes and superimposes this activated pro-inflammatory phenotype onto the core Treg cell program. Future studies will be needed to establish the ontology and TCR specificities of these disease-associated RORγt+ Treg cells, as well as their roles in perpetuating disease, potentially through production of pro-inflammatory cytokines.
The present findings connect to our previous report that frequencies of pro-inflammatory Treg cells increase in the blood of individuals with CRC30 and extend to a premalignant, chronic inflammation setting. The stepwise increase in frequencies of RORγt+ Treg cells expressing IL-17, IFN-γ and TNF from IBD to early dysplasia and CRC emphasizes their involvement in immune dysregulation fostering cancer-promoting chronic inflammation. Early intervention in cancer treatment is highly indicative. In this context, frequencies of circulating RORγt+ Treg cells could serve as a biomarker in IBD and CRC. Furthermore, our detailed molecular analysis of genes and processes affected by β-catenin could help identify targets to limit the systemic expansion of potentially disease-promoting pro-inflammatory Treg cells during CRC.
Online content
Any methods, additional references, Nature Research reporting summaries, source data, extended data, supplementary information, acknowledgements, peer review information; details of author contributions and competing interests; and statements of data and code availability are available at https://doi.org/10.1038/s41590-021-00889-2.
Methods
Patients and healthy donors.
Forty-three patients undergoing major surgery for Crohn’s disease or ulcerative colitis treatment (proctocolectomy, colectomy, partial ileectomy or combinations of the aforementioned procedures) consented to donate 45 ml of PB either directly preoperatively or directly postoperatively. Up to 4 g of fresh intestinal mucosal tissue was collected from inflamed, margin (in most cases less inflamed) and dysplastic areas from the surgical specimens (if made available for research purposes by pathology) from the same individuals. Additionally, 22 patients with IBD undergoing routine colonoscopy check-up visits and 20 healthy individuals participated in the study by donating up to 45 ml of PB. Informed consent was obtained from all patients and healthy donors. The protocol was approved by the University of Chicago Division of the Biological Sciences Institutional Review Board and was performed in accordance with federal law.
Isolation and flow cytometric analysis of PBMCs and MNCs from patient and healthy donor samples.
PBMCs were isolated from PB samples using Lymphoprep (Serumwerk Bernburg AG for Alere Technologies AS, via Stemcell 7851) density gradient centrifugation. MNCs were isolated from mucosal tissue samples using the human Tumor Dissociation Kit (Miltenyi, 130-059-929) and gentleMACS C Tubes (Miltenyi, 130-093-237) following the instructions from the mouse Lamina Propria Dissociation Kit (Miltenyi 130-097-410). MNCs isolated from blood and intestinal mucosa were either first restimulated with Cell Stimulation Cocktail plus protein transport inhibitors 500X (eBioscience 00-4975-93) for 3 h in X-Vivo 20 medium (Lonza, 04-448-Q) or used directly for flow cytometric staining. Cells were stained for viability using the LIVE/DEAD Aqua fluorescent reactive dye (Molecular Probes–Life Technologies, L34963), followed by surface staining with varying combinations of the following antibodies: CD3 (clone OKT3, BioLegend; UCHT1, Thermo Fisher), CD4 (clone RPA-T4, BD), CD8 (RPA-T8, eBioscience/Thermo Fisher Scientific/BD), CD25 (clone M-A251, BD), CD45RA (clone HI100, BD/BioLegend), CD127 (clone HIL-7R-M21, BD), CD279/PD-1 (clone EH12.1.H7, BioLegend), CD152/CTLA-4 (clone 14D3, eBioscience/Thermo Fisher Scientific), CCR9 (L053E8, BioLegend), GITR/CD357 (V27-580, BD) and respective manufacturer isotype controls. Following surface staining, cells were fixed and permeabilized using Foxp3/Transcription Factor Fixation/Permeabilization Concentrate and Diluent (Affymetrix/eBioscience/Thermo Fisher Scientific, 00-5521), and intracellular staining was performed for Foxp3 (clone 236A/E7, eBioscience/Thermo Fisher Scientific), RORγt (clone Q21-559, BD), β-catenin (clone 14/β-Catenin, BD), IL-17 (clone BL 168, BioLegend), IFN-γ (clone 4S.B3, eBioscience/Thermo Fisher Scientific), TNF (Mab11, BioLegend), Ki67 (Ki-67, BioLegend) and respective manufacturer isotype control antibodies. Samples were then acquired using four-laser LSR Fortessa instrument equipped with 15 detectors (BD) or a five-laser Aurora (Cytek) instrument. For the spectral flow stainings, Brilliant Stain Buffer Plus (BD) was added to the staining mixes according to the manufacturer’s instructions. Isolated PBMCs were either analyzed directly ex vivo or frozen (10% DMSO (Sigma-Aldrich, D2650) and 90% human AB Serum (Gemini, 100-512)) and analyzed in batch directly after thawing.
Analysis of TCGA data using Spearman correlations.
The results are based on data generated by the TCGA Research Network (https://www.cancer.gov/tcga/). Average z-scores for each individual gene in each of the signatures and for the tumors of each patient in the TCGA database were downloaded. Average z-scores were calculated as the relative mRNA expression value of an individual gene and tumor, normalized to the gene’s expression distribution in a reference population (defined as all samples that were haploid for the respective gene). Then, z-scores of all genes in each individual signature were averaged over the number of genes in the respective signature, yielding average z-scores for the TH17_UP, Treg_UP and KEGG_human_WNT signatures for each individual.
Regularized regression of TCGA gene expression.
To determine the ability of the TH17 gene signature to inform individual-level survival, we deployed Cox proportional hazards regression on CRC clinical data extracted from TCGA. We used Ridge regression regularization54 and chose an optimal penalty coefficient, λ, using tenfold cross validation optimized for partial likelihood deviance. The TH17 gene-based score for each individual was generated by multiplying the coefficient vector by the individual-level gene expression. Individual scores were dichotomized at the median, and Kaplan–Meier curves were plotted. Statistical coding was performed using R version 3.1.2, with packages survival55, glmnet56 and survminer57.
In vitro Wnt–β-catenin pathway activation in HD PBMCs.
PBMCs were isolated using density gradient centrifugation under sterile conditions. Cells were adjusted to 1 × 10⁷ cells in X-Vivo 20 medium (Lonza, 04-448Q) supplemented with 10% AB Serum (Gemini, 100-512), 100 U ml−1 recombinant human (rh)-IL-2 (PeproTech, 200-02), 60 U ml−1 IL-4 (PeproTech, 200-04) and 1 ng ml−1 TGF-β1 (PeproTech, 100-21) and seeded in 12-well plates at 2 × 10⁶ cells per well. For the GSK-3β inhibition, cells were treated with 6 μM Chiron (CHIR99021, Sigma, SML1046) or DMSO vehicle control for 6 d in total, supplemented with 3 μM of fresh Chiron daily. Samples were analyzed by flow cytometry on days 4 and 7 for expression of CD4, CD25, CD3, β-catenin, Foxp3 and RORγt. For the TCR/Wnt3a stimulation, 4 × 10⁶ cells were seeded in six-well plates. They were stimulated with human T-activator CD3/CD28 Dynabeads (Thermo Fisher, 11161D) at a 1:1 bead-to-cell ratio and rh-Wnt3a (R&D Systems, 5036-WN-010) was added at a dilution of 100 ng ml−1. Cells were supplemented with 50 ng ml−1 rh-Wnt3a daily. On day 4, the T-activator beads were removed, while Wnt3a treatment continued until day 6. Then, cells were split, and one half was restimulated with Cell Stimulation Cocktail for 3 h. All samples were analyzed by flow cytometry using the same panel as for the patient sample analysis and spectral flow cytometry.
Mice.
Foxp3YFP-Cre Ctnnb1fl(ex3)(ref. 58), Foxp3YFP-Cre (ref. 59), APCΔ468 (ref. 60), CD45.1 and WT mice were used in all experiments described. All mice were maintained on the C57BL/6J background. Mice were housed under specific pathogen-free conditions in the animal facilities at the University of Chicago in accordance with protocol no. 71880, approved by the University of Chicago Institutional Animal Care and Use Committee.
Mouse model for inflammatory bowel disease-associated colon cancer.
Three-to four-month-old APCΔ468 (male and female) mice and aged-matched WT mice were treated with three rounds of 2% DSS (colitis grade; 160110, MP) in drinking water ad libitum over 7 d, with a 2-week recovery period on normal drinking water between each round. Weight loss was monitored every other day.
Histological assessment of inflamed tissues.
Peripheral lymphoid organs and vital organs were resected from mice and directly formalin fixed ex vivo (HT5014, Sigma-Aldrich). Colons were harvested from mice, flushed free of feces with ice-cold HBBS, formalin fixed and Swiss rolled. All fixed organs were paraffin embedded and 4-μm sections were used for H&E staining. Embedding, sectioning and H&E staining services were provided by the University of Chicago Human Tissue Resource Center.
Isolation of lymphocytes from thymi, peripheral lymphoid organs and the intestinal mucosa of mice.
Thymi, pLNs, mLNs and spleens were resected. Single-cell suspensions were generated by mashing the organs through 40–100-μm cell strainers while flushing the strainers with ice-cold 1× PBS. Erythrocytes in the splenic single-cell suspensions were lysed by resuspending the cell pellets in 2 ml ACK buffer (150 mM NH4Cl, 10 mM KHCO3 and 0.1 mM EDTA (pH 7.2–7.4)), each, for 1 min on ice. The reaction was stopped by adding 15 ml of PBS + 2% FCS, and cells were spun down immediately after and washed in 10 ml ice-cold PBS. Dead cells were removed by filtering the lysed cells suspensions through 40-μm cell strainers. Intestinal lamina propria lymphocytes were isolated according to the protocol by Atarashi and colleagues61.
Treg cell proliferation inhibition assay.
Untouched CD4+CD25− T cells were isolated from pLNs and spleens of 10-week-old CD45.1 mice using the mouse CD4+ T cell isolation kit (130-104-454, Miltenyi). The protocol was modified by adding 1 μl biotin rat anti-mouse CD25 (553070, BD) per 100 μl of the labeling cocktails to remove Treg cells. Purified CD4+CD25− CD45.1+ T cells were CFSE labeled using Cell Trace CFSE (C34554, Invitrogen/Thermo Fisher) and stimulated using Dynabeads Mouse T-Activation CD3/CD28 (11456-D, Gibco/Life Technologies/Thermo Fisher) in a 1:1 ratio. Approximately 50,000 CFSE-labeled T cells and 50,000 beads were seeded in 96-well round-bottom plates in 200 μl culture medium (DMEM; D6429, Sigma) supplemented with 0.4% gentamycin (G1397, Sigma), 1% HEPES and 10% FCS per well. After 48 h, CD4+CD25+ Treg cells from Foxp3YFP-CreCtnnb1fl(ex3) and Foxp3YFP-Cre mice were added. Treg cells were purified from pLNs and spleens using the CD4+CD25+ Regulatory T cell Isolation Kit II (130-091-041, Miltenyi). The assay was performed in triplicate with Treg to T effector cell ratios of 1:1, 1:2 and 1:4. Samples were incubated for another 48 h and then collected for flow cytometric readout. Cells were stained for viability and then surface stained with CD45.1 (clone A20, BD), CD45.2 (clone 104, BD), CD25 (clone PC61, BD) and CD4 (clone GK1.5, BD) antibodies. Stained samples were acquired using a four-laser LSR Fortessa instrument (BD) equipped with 15 detectors.
Flow cytometry and fluorescence-activated cell sorting of murine lymphocytes.
Cells isolated from peripheral lymphoid organs, thymi and intestinal mucosa were either first restimulated with Cell Stimulation Cocktail (plus protein inhibitors, 500X, eBioscience, 00-4975-93) for 3 h in X-Vivo 20 (Lonza, 04-448-Q) or used directly for flow cytometric staining. Cells were stained for viability using the LIVE/DEAD Aqua fluorescent reactive dye (Molecular Probes–Life Technologies, L34963), followed by surface staining with varying combinations of the following antibodies in FACS buffer (1× PBS + 2% vol/vol FCS): CD3 (clone 145-2C11, BD), CD4 (clone GK1.5, BD), CD8 (clone 53-6.7, BD), CD25 (clone PC61, BD), CD44 (clone IM7, BD), CD62L (clone MEL-14, BD), CD69 (clone H1.2F3, BD), CD103 (clone M290, BD), CD196/CCR6 (clone 29-2L17, BioLegend), CD199/CCR9 (clone CW-1.2, BioLegend), CD304/Neuropilin-1 (clone 3E12, BioLegend), CTLA-4 (UC10-4B9, BioLegend) and GITR (DTA-1, BD). Following surface staining, cells were fixed and permeabilized using Foxp3/Transcription Factor Fixation/Permeabilization Concentrate and Diluent (Affymetrix/eBioscience/Thermo Fisher Scientific, 00-5521). Intracellular flow cytometric staining was performed with anti-β-catenin (clone 14/β-catenin, BD), RORγt (clone Q31-378, BD), Foxp3 (clone FJK-16s, eBioscience/Thermo Fisher), Helios (clone 22F6, BioLegend), anti-GFP (clone FM264C, BioLegend), IFN-γ (clone XMG1.2, BD), IL-17A (clone TC11-18H10, BD), TNF (MP6-XT22, BioLegend), Ki67 (B56, BD), and respective manufacturer isotype control antibodies. Stained samples were acquired using a fiver-laser LSR Fortessa X20 (BD) instrument equipped with 18 detectors or a five-laser Aurora (Cytek) instrument and sorted using a four-laser FACSAria II/III (BD) equipped with 18 detectors. For the spectral flow stainings, Brilliant Stain Buffer Plus (BD) was added to the staining mixes according to the manufacturer’s instructions. Flow data were analyzed using FlowJo version 10 (BD).
Chromatin immunoprecipitation and sequencing.
For ChIP–seq, 1 × 10⁷ CD25+YFP+ Treg cells were FACS sorted from CD4+ T cells isolated from lymph nodes and spleen (CD4+ T Cell Isolation Kit, mouse; 130-104-454, Miltenyi) of 10- to 12-week-old Foxp3YFP-Cre WT mice. Chromatin immunoprecipitation and library generation were performed as previously described14,62. Libraries were sequenced on a HiSeq 4000 sequencer at the University of Chicago Genomics Facility.
Isolation and preparation of samples for RNA sequencing.
For RNA-seq, 1.5–4.0 × 10⁵ CD25+YFP+ Treg cells were FACS sorted from magnetic cell sorting (MACS)-prepurified CD4+ T cells (CD4+ T Cell Isolation Kit, mouse; 130-104-454, Miltenyi) isolated from lymph nodes of 21-day-old Foxp3YFP-CreCtnnb1fl(ex3) and Foxp3YFP-Cre WT mice. Total RNA was isolated using the PicoPure RNA Isolation Kit (KIT0202, Arcturus) following the manufacturer’s instructions. Libraries were generated and sequenced at the University of Chicago Genomics Facility.
Assay for transposase-accessible chromatin with sequencing.
For ATAC-seq, 5–10 × 104 YFP+CD25+ Treg cells were FACS sorted from MACS-prepurified CD4+ T cells (CD4+ T Cell Isolation Kit, mouse; 130-104-454, Miltenyi) isolated from lymph nodes of 21-day-old Foxp3YFP-CreCtnnb1fl(ex3) and Foxp3YFP-Cre WT mice. Cells were centrifuged at 500g at 4 °C for 5 min, washed with 1× PBS, and centrifuged again. Cells were resuspended in lysis buffer (10 mM Tris-HCl (pH 7.4), 10 mM NaCl, 3 mM MgCl2 and 0.1% IGEPAL CA-630) and immediately centrifuged at 500g at 4 °C for 10 min. Pellets were resuspended in transposition reaction buffer (25 μl 2× Tagment Buffer (FC-121-1030, Illumina)), 2.5 μl Tagment DNA Enzyme and 22.5 μl nuclease-free H2O) for 30 min at 37 °C. DNA was purified with a Qiagen MinElute Kit and amplified with Nextera PCR primers (Illumina Nextera Index Kit) and NEBNext PCR Master Mix (M0541, New England BioLabs). Amplified DNA was purified with a Qiagen PCR cleanup kit. Libraries were sequenced on a HiSeq 4000 sequencer at the University of Chicago Genomics Facility.
Genome mapping and data analysis.
Sequenced ChIP and ATAC datasets were mapped with the Galaxy (https://usegalaxy.org/) suite of tools. Data were groomed and aligned to the mouse mm10 genome with Bowtie, allowing up to one mismatch and retaining only uniquely mapped reads, and unmapped reads were filtered. For transcription factors (TCF-1 and Foxp3), peak calling was performed with MACS via HOMER63. Transcription factor peak calling was performed relative to input controls with the requirement that peaks had a minimum fivefold enrichment over the input and met a P-value cutoff of 1 × 10⁻⁵. Open chromatin (ATAC-seq) peaks were called with MACS2 (ref. 64) using the ‘--nomodel’ option and no background provided. Differential accessibility testing of ATAC-seq data was performed using the edgeR Bioconductor package65. Sequenced RNA datasets were aligned to the mouse mm10 genome like the ChIP–seq datasets. Differential gene expression analysis was performed with Cuffdiff2 (ref. 66). Genes with transcript abundance differences of q < 0.05 were considered to be significantly differentially expressed. Heat maps of normalized reads for gene subsets were generated using Genepattern67. Motif analysis was performed with the HOMER motif discovery algorithm, and transcription factor overlap analysis was conducted with the HOMER ‘mergePeaks’ command, considering only peaks that directly overlapped. Peaks were annotated to the mm10 genome with annotatePeaks.pl in HOMER. Histograms for transcription factors and histone modifications were generated with ngs.plot software68. Clustering (k-means) of ChIP–seq datasets was performed and heat maps were generated with ngs.plot. Transcription factor binding was visualized using the IGB software69. Pathway enrichment analysis for genes identified by ChIP–seq and RNA-seq analysis was performed via Metascape (http://metascape.org)70.
Statistical analysis.
Results from biologically distinct experiments were combined and analyzed with the indicated statistical tests in Prism 7 (GraphPad). The statistical significance of RNA-seq data was determined with Cuffdiff and with edgeR for ATAC-seq data. ChIP–seq (factor enrichment) and ATAC-seq (chromatin accessibility) P-value cutoffs were determined with MACS2. Gene pathway enrichment P values were determined with Metascape. Data are presented as the mean ± s.e.m.
Reporting Summary.
Further information on research design is available in the Nature Research Reporting Summary linked to this article.
Data availability
RNA-seq, ChIP–seq and ATAC-seq datasets have been deposited in the Gene Expression Omnibus under accession code GSE139960. All raw data and source data that support the findings of this study are available from the corresponding authors upon request.
Extended Data
Extended Data Fig. 1 ∣. RORγt+ Treg cells producing pro-inflammatory cytokines expand in the PB/colonic mucosa of IBD patients.
Flow cytometric gating scheme to identify Treg cells in PB a. Live CD3+CD4+CD25+ Foxp3+ cells were assessed for CD127 expression and CD127−CD3+CD4+CD25+Foxp3+ Treg cells were gated for the analyses in b-f. b. Dotplots of RORγt versus CD4 expression in PB Treg cells of representative HD (HD21), and IBD (IMB29), and IBD/Dys (IMB17) patients c. Relative frequencies of RORγt+ cells within PB Treg cells. d. Representative β-catenin expression in RORγt+/RORγt− PB Treg cells. e. Cumulative β-catenin expression in RORγt+/RORγt− PB Treg cells (MFI). f. IL-17, IFN-γ, and TNF production in RORγt+ PB Treg cells before and after stimulation by PMA/ionomycin as indicated. b-f. two-sided unpaired t-test. Number of samples in c,e,f. HD(n = 16), IBD(n = 15), IBD_Dys(n = 17) g. Flow cytometric gating scheme assessing pro-inflammatory cytokine production by RORγt+ and RORγt− PB Treg populations (CD127−CD3+CD4+CD25+Foxp3+) after PMA/ionomycin stimulation. h. (left) Flow cytometric gating scheme for assessing pro-inflammatory cytokine production versus Helios expression in PB Treg cells, (right) Cumulative frequencies of Helios+ Treg cells in HD(n = 5), IBD(n = 5) and IBD/Dys(n = 4) patients, and IL-17, IFN-γ, and TNF expression in Helios+ and Helios− PB Treg cells of the same samples (two-sided unpaired t-test). i. Flow cytometric gating scheme for assessing IL-17 production by CD3+CD4+Foxp3+ RORγt+ and RORγT− colonic mucosa Treg cells.
Extended Data Fig. 2 ∣. The expression of Th17 and Treg cell signature genes in the TCGA CRC dataset indicate a prognostic relevance.
a–d. Analysis of the TCGA CRC cohort: a. Spearman correlation of average z-scores for the Th17_UP versus Treg_UP (blue, r = 0.7836, p < 0.001) signatures in CRC patients (n = 524). b. Ridge regression regularization and, c. cross validation of the deployed Cox proportional-hazards regression on the CRC clinical data extracted from TCGA. d. Histogram of Th17 gene-based score distribution through the CRC patient cohort (median = −0.033). If not stated differently data are represented as median +/− SEM and statistical testing is depicted as *P ≤ 0.05, **P ≤ 0.01, ***P ≤ 0.001, ****P ≤ 0.0001.
Extended Data Fig. 3 ∣. tSNE projection of flow cytometric data identifies unique populations within RORγt+ Treg cells in the APC/DSS IBD-associated CRC model.
Strategy for tSNE projection of a, splenic and b, colon-tissue resident Treg populations exemplarily shown for the activation marker flow-cytometric panel: Treg populations (gated on as live/dead stain negative, CD4+CD8−Foxp3+) from all samples of all treatment groups were concatenated into one fcs file and the tSNE analysis was performed on the concatenated file (settings used for FlowJo tSNE Plugin Tool: Iterations = 1000, Perplexity = 30, ETA/Learning Rate = 100). RORγt positive and negative fractions of Treg cells are indicated in red and green in the tSNE landscapes, respectively. Different RORγt+ Treg populations were identified within in the tSNE plot and histogram expression profiles of identified RORγt+ Treg populations are shown.
Extended Data Fig. 4 ∣. Treg cell specific up-regulation of β-catenin leads to a severe scurfy-like phenotype in mice.
a, Kaplan-Mayer survival curve of Foxp3Cre(0/+) wild-type (Cre) and Foxp3Cre(0/+) Ctnnb1fl(ex3) (CAT) male mice. b, Representative picture of the scurfy-like phenotype of a CAT mouse compared to a Cre mouse (26 d old). c, Representative picture of the pathologic enlargement of peripheral LNs and splenomegaly in a CAT mouse compared to a Cre litter mate control mouse. d, H&E-stainings of paraffin sections from organs of a representative 21 d old male CAT mouse and a Cre litter mate. Enlargement of secondary lymphoid organs (SPL – spleen & pLNs – peripheral lymph nodes) and reduction of the thymic cortex (THY – thymus, arrows) in CAT mice. CAT mice show severe immune infiltrates in lung and liver (middle panels, arrows), and eosinophil infiltration in the small intestine (SI) and colon (arrows). Size are provided in the images. At least 4 independent CAT and Cre litter mate mice were analysed. e, Frequency of CD3+, CD3+CD4+, and CD3+CD8+ T cell numbers in peripheral lymphoid organs of 3-4 weeks old Cre and CAT mice as determined by flow cytometric analysis. Cre_SPL(n = 7), Cre_mLN(n = 7), Cre_pLN(n = 7), CAT_SPL(n = 10), CAT_mLN(n = 8), p(CAT_mLN) = 10, data are represented as median +/− SEM and statistical testing is depicted as two-sided unpaired t-tests with *P ≤ 0.05, **P ≤ 0.01, ***P ≤ 0.001, ****P ≤ 0.0001.
Extended Data Fig. 5 ∣. Treg cell specific stabilization of β-catenin results in severe systemic T cell activation and an altered Treg cell phenotype.
Activation status of a, CD3+CD4+ conventional T cells and, b, CD3+CD8+ CTLs was assessed via flow cytometric staining for CD25, CD44, CD69, CD62L, and Ki67 in peripheral lymphoid organs of 3-4 weeks old Foxp3Cre(0/+) wild-type (Cre) and Foxp3Cre(0/+) Ctnnb1fl(ex3) (CAT) male mice (CAT(n = 5), WT(n = 5)). c, Frequencies of total Treg cells within viable cells in peripheral lymphoid organs and the thymus (Cre_SPL(n = 5), Cre_mLN(n = 5), Cre_pLN(n = 5), Cre_THY(n = 5), CAT_SPL(n = 10), CAT_mLN(n = 10), CAT_pLN(n = 10), CAT_THY(n = 5)). d, Expression of Neuropilin in Cre and CAT Treg cells depicted as representative flow plots and cumulative column plots throughout peripheral lymphoid organs (Cre_SPL(n = 5), Cre_mLN(n = 5), Cre_pLN(n = 5), CAT_SPL(n = 4), CAT_mLN(n = 3), CAT_THY(n = 5)). Data are represented as median +/− SEM and statistical testing is depicted as two-sided unpaired t-tests with *P ≤ 0.05, **P ≤ 0.01, ***P ≤ 0.001, ****P ≤ 0.0001.
Extended Data Fig. 6 ∣. The chemokine receptor CCR9 is upregulated in β-cateninhi Treg cells.
a, Representative histograms for flow cytometric characterization of CCR9 expression in the natural chimera female heterozygote CD3+CD4+CD25+Foxp4+ Treg cells comparing YFP+ (Cre+) to YFP− (Cre−) populations in Foxp3Cre(+/−) Ctnnb1fl(ex3) (CAT) and Foxp3Cre(+/−) (Cre) chimeras in MLN and Spleen, as indicated. (FMO = fluorescence minus one negative staining control). b, Quantification of CCR9 MFI respresented as bar graphs in MLN (Cre(n = 5), CAT(n = 5)). Data are represented as median +/− SEM and statistical testing is depicted as one way Anova multiple comparisons with *P ≤ 0.05, **P ≤ 0.01, ***P ≤ 0.001, ****P ≤ 0.0001.
Extended Data Fig. 7 ∣. TCF-1 binds gene loci that are involved in T cell activation and survival in wild-type Treg cells.
a, Pie chart of the distribution of TCF-1 binding in genomic regions (P = promoter, PE = poised enhancer, AE = active enhancer) identified by K-means-clustering. Peak numbers (p), corresponding gene numbers (g), and relative percentages (%) for each genomic region. b, Heat maps centered on TCF-1 binding in indicated genomic regions (± 1.5 kb) and enrichment of histone marks (H3K4me1, H3K4me3, H3K27me3, H3K27Ac), chromatin accessibility (ATAC), and DNA methylation (MBD). c, Enrichment histograms of TCF-1 binding, histone marks, chromatin accessibility, and DNA methylation marks at TCF-1 bound sites (± 1.5 kb) in the indicated genomic regions. d, De novo transcription-factor-binding motif analysis (HOMER) of TCF-1-bound sites for the indicated genomic regions. Most, significantly enriched motifs and corresponding p values are listed. e, Functional pathways enriched for TCF-1-bound genes in the indicated genomic regions. Pathways and statistical enrichment were determined using Metascape (http://www.metascape.org).
Extended Data Fig. 8 ∣. Foxp3 preferentially binds accessible chromatin and its consensus motif within different regulatory elements of genes in Treg cells.
a, Pie chart of the distribution of Foxp3 binding in genomic regions (P = promoter, PE = poised enhancer, AE = active enhancer) identified by K-means-clustering. Peak numbers (p), corresponding gene numbers (g), and relative percentages (%) for each genomic region. b, Heat maps centered on Foxp3 binding in indicated genomic regions (± 1.5 kb) and enrichment of histone marks (H3K4me1, H3K4me3, H3K27me3, H3K27Ac), chromatin accessibility (ATAC), and DNA methylation (MBD). c, Enrichment histograms of Foxp3 binding, histone marks, chromatin accessibility, and DNA methylation marks at Foxp3 bound sites (± 1.5 kb) in the indicated genomic regions. d, De novo transcription-factor-binding motif analysis (HOMER) of TCF-1-bound sites for the indicated genomic regions. Most, significantly enriched motifs and corresponding p values are listed. e, Functional pathways enriched for TCF-1-bound genes in the indicated genomic regions. Pathways and statistical enrichment were determined using Metascape (http:/www.metascape.org).
Extended Data Fig. 9 ∣. Wnt/β-catenin activation does not significantly alter the Treg_UP signature and enhances the expression of leukocyte migration signature genes in Treg cells.
RNA expression heat maps (n = 3 biological replicates for each genotype, FPKMs) showing genes of GSEA analysis for the Treg_UP, TH17_UP, and leukocyte migration signature displayed in Fig. 8d of CAT versus Cre Treg cells.
Supplementary Material
Acknowledgements
We thank clinical research coordinators B. Putz and A. Duong for facilitating the patient sample supply, S. Keerthivasan for introducing relevant mouse strains to the laboratory, and M. -L. Alegre for helpful advice on the manuscript. We also want to thank the Flow Cytometry Core (UCFlow), Human Tissue Resource Center and the Animal Resources Center at the University of Chicago. This work was supported by National Institutes of Health (NIH) grants R21AI076720 and R01AI147652, a Digestive Diseases Research Core Center pilot award (NIDDK P30DK42086) and an ASH bridge grant (to F.G.), and grants R01AI108682 (to F.G. and K.K.) and R01CA160436 (to K.K). Further support came from the Praespero autoimmunity fund (to F.G. and K.K.) and the Chicago Biomedical Consortium (to F.G.). A.O.E. was supported by an NIH minority supplement. P.S.M. was supported by T32 HL07605 Institutional NRSA and is currently an LLS fellow. J.Q. was supported by an AAI Careers in Immunology Fellowship. M.O. is a T32HD007009 award recipient.
Footnotes
Competing interests
The authors declare no competing interests.
Extended data is available for this paper at https://doi.org/10.1038/s41590-021-00889-2.
Supplementary information The online version contains supplementary material available at https://doi.org/10.1038/s41590-021-00889-2.
Publisher’s note Springer Nature remains neutral with regard to jurisdictional claims in published maps and institutional affiliations.
References
- 1.Kuswanto W et al. Poor repair of skeletal muscle in aging mice reflects a defect in local, interleukin-33-dependent accumulation of regulatory T cells. Immunity 44, 355–367 (2016). [DOI] [PMC free article] [PubMed] [Google Scholar]
- 2.Ito M et al. Brain regulatory T cells suppress astrogliosis and potentiate neurological recovery. Nature 565, 246–250 (2019). [DOI] [PubMed] [Google Scholar]
- 3.Zhu J, Yamane H & Paul WE Differentiation of effector CD4 T cell populations. Annu. Rev. Immunol 28, 445–489 (2010). [DOI] [PMC free article] [PubMed] [Google Scholar]
- 4.Levine AG et al. Stability and function of regulatory T cells expressing the transcription factor T-bet. Nature 546, 421–425 (2017). [DOI] [PMC free article] [PubMed] [Google Scholar]
- 5.Yu F, Sharma S, Edwards J, Feigenbaum L & Zhu J Dynamic expression of transcription factors T-bet and GATA-3 by regulatory T cells maintains immunotolerance. Nat. Immunol 16, 197–206 (2015). [DOI] [PMC free article] [PubMed] [Google Scholar]
- 6.Ohnmacht C et al. The microbiota regulates type 2 immunity through RORγt+ T cells. Science 349, 989–993 (2015). [DOI] [PubMed] [Google Scholar]
- 7.Sefik E et al. Individual intestinal symbionts induce a distinct population of RORγ+ regulatory T cells. Science 349, 993–997 (2015). [DOI] [PMC free article] [PubMed] [Google Scholar]
- 8.Yang BH et al. Foxp3+ T cells expressing RORγt represent a stable regulatory T cell effector lineage with enhanced suppressive capacity during intestinal inflammation. Mucosal Immunol. 9, 444–457 (2016). [DOI] [PubMed] [Google Scholar]
- 9.Samstein RM et al. Foxp3 exploits a pre-existent enhancer landscape for regulatory T cell lineage specification. Cell 151, 153–166 (2012). [DOI] [PMC free article] [PubMed] [Google Scholar]
- 10.Fu W et al. A multiply redundant genetic switch ‘locks in’ the transcriptional signature of regulatory T cells. Nat. Immunol 13, 972–980 (2012). [DOI] [PMC free article] [PubMed] [Google Scholar]
- 11.Delacher M et al. Genome-wide DNA-methylation landscape defines specialization of regulatory T cells in tissues. Nat. Immunol 18, 1160–1172 (2017). [DOI] [PMC free article] [PubMed] [Google Scholar]
- 12.Kwon HK, Chen HM, Mathis D & Benoist C Different molecular complexes that mediate transcriptional induction and repression by FoxP3. Nat. Immunol 18, 1238–1248 (2017). [DOI] [PMC free article] [PubMed] [Google Scholar]
- 13.Xing S et al. Tcf1 and Lef1 are required for the immunosuppressive function of regulatory T cells. J. Exp. Med 216, 847–866 (2019). [DOI] [PMC free article] [PubMed] [Google Scholar]
- 14.Emmanuel AO et al. TCF-1 and HEB cooperate to establish the epigenetic and transcription profiles of CD4+CD8+ thymocytes. Nat. Immunol 19, 1366–1378 (2018). [DOI] [PMC free article] [PubMed] [Google Scholar]
- 15.Choi YS et al. LEF-1 and TCF-1 orchestrate TFH differentiation by regulating differentiation circuits upstream of the transcriptional repressor Bcl6. Nat. Immunol 16, 980–990 (2015). [DOI] [PMC free article] [PubMed] [Google Scholar]
- 16.Zhou X et al. Differentiation and persistence of memory CD8+ T cells depend on T cell factor 1. Immunity 33, 229–240 (2010). [DOI] [PMC free article] [PubMed] [Google Scholar]
- 17.Scott AC et al. TOX is a critical regulator of tumour-specific T cell differentiation. Nature 571, 270–274 (2019). [DOI] [PMC free article] [PubMed] [Google Scholar]
- 18.MacDonald BT, Tamai K & He X Wnt/β-catenin signaling: components, mechanisms and diseases. Dev. Cell 17, 9–26 (2009). [DOI] [PMC free article] [PubMed] [Google Scholar]
- 19.Lovatt M & Bijlmakers MJ Stabilisation of β-catenin downstream of T cell receptor signalling. PloS ONE 5, e12794 (2010). [DOI] [PMC free article] [PubMed] [Google Scholar]
- 20.van Loosdregt J et al. Canonical Wnt signaling negatively modulates regulatory T cell function. Immunity 39, 298–310 (2013). [DOI] [PubMed] [Google Scholar]
- 21.Sumida T et al. Activated β-catenin in Foxp3+ regulatory T cells links inflammatory environments to autoimmunity. Nat. Immunol 19, 1391–1402 (2018). [DOI] [PMC free article] [PubMed] [Google Scholar]
- 22.Mittal D, Gubin MM, Schreiber RD & Smyth MJ New insights into cancer immunoediting and its three component phases–elimination, equilibrium and escape. Curr. Opin. Immunol 27, 16–25 (2014). [DOI] [PMC free article] [PubMed] [Google Scholar]
- 23.Wing JB, Tanaka A & Sakaguchi S Human FOXP3+ regulatory T cell heterogeneity and function in autoimmunity and cancer. Immunity 50, 302–316 (2019). [DOI] [PubMed] [Google Scholar]
- 24.Salama P et al. Tumor-infiltrating FOXP3+ T regulatory cells show strong prognostic significance in colorectal cancer. J. Clin. Oncol 27, 186–192 (2009). [DOI] [PubMed] [Google Scholar]
- 25.deLeeuw RJ, Kost SE, Kakal JA & Nelson BH The prognostic value of FoxP3+ tumor-infiltrating lymphocytes in cancer: a critical review of the literature. Clin. Cancer Res 18, 3022–3029 (2012). [DOI] [PubMed] [Google Scholar]
- 26.Sinicrope FA et al. Intraepithelial effector CD3+/regulatory FoxP3+ T cell ratio predicts a clinical outcome of human colon carcinoma. Gastroenterology 137, 1270–1279 (2009). [DOI] [PMC free article] [PubMed] [Google Scholar]
- 27.Saito T et al. Two FoxP3+CD4+ T cell subpopulations distinctly control the prognosis of colorectal cancers. Nat. Med 22, 679–684 (2016). [DOI] [PubMed] [Google Scholar]
- 28.Feagins LA, Souza RF & Spechler SJ Carcinogenesis in IBD: potential targets for the prevention of colorectal cancer. Nat. Rev. Gastroenterol. Hepatol 6, 297–305 (2009). [DOI] [PubMed] [Google Scholar]
- 29.Terzic J, Grivennikov S, Karin E & Karin M Inflammation and colon cancer. Gastroenterology 138, 2101–2114 (2010). [DOI] [PubMed] [Google Scholar]
- 30.Blatner NR et al. Expression of RORγt marks a pathogenic regulatory T cell subset in human colon cancer. Sci. Transl. Med 4, 164ra159 (2012). [DOI] [PMC free article] [PubMed] [Google Scholar]
- 31.Keerthivasan S et al. β-Catenin promotes colitis and colon cancer through imprinting of pro-inflammatory properties in T cells. Sci. Transl. Med 6, 225ra228 (2014). [DOI] [PMC free article] [PubMed] [Google Scholar]
- 32.Miyara M et al. Functional delineation and differentiation dynamics of human CD4+ T cells expressing the FoxP3 transcription factor. Immunity 30, 899–911 (2009). [DOI] [PubMed] [Google Scholar]
- 33.Pratama A, Schnell A, Mathis D & Benoist C Developmental and cellular age direct conversion of CD4+ T cells into RORγ+ or Helios+ colon Treg cells. J. Exp. Med 217, e20190428 (2019). [DOI] [PMC free article] [PubMed] [Google Scholar]
- 34.Kanehisa M & Goto S KEGG: kyoto encyclopedia of genes and genomes. Nucleic Acids Res. 28, 27–30 (2000). [DOI] [PMC free article] [PubMed] [Google Scholar]
- 35.Kanehisa M, Furumichi M, Tanabe M, Sato Y & Morishima K KEGG: new perspectives on genomes, pathways, diseases and drugs. Nucleic Acids Res. 45, D353–D361 (2017). [DOI] [PMC free article] [PubMed] [Google Scholar]
- 36.Tosolini M et al. Clinical impact of different classes of infiltrating T cytotoxic and helper cells (TH1, TH2, Treg, TH17) in patients with colorectal cancer. Cancer Res. 71, 1263–1271 (2011). [DOI] [PubMed] [Google Scholar]
- 37.Beurel E, Michalek SM & Jope RS Innate and adaptive immune responses regulated by glycogen synthase kinase-3 (GSK3). Trends Immunol. 31, 24–31 (2010). [DOI] [PMC free article] [PubMed] [Google Scholar]
- 38.Wei L, Laurence A, Elias KM & O’Shea JJ IL-21 is produced by Th17 cells and drives IL-17 production in a STAT3-dependent manner. J. Biol. Chem 282, 34605–34610 (2007). [DOI] [PMC free article] [PubMed] [Google Scholar]
- 39.O’Shea JJ & Paul WE Mechanisms underlying lineage commitment and plasticity of helper CD4+ T cells. Science 327, 1098–1102 (2010). [DOI] [PMC free article] [PubMed] [Google Scholar]
- 40.Kovalovsky D et al. β-catenin/Tcf determines the outcome of thymic selection in response to αβTCR signaling. J. Immunol 183, 3873–3884 (2009). [DOI] [PMC free article] [PubMed] [Google Scholar]
- 41.Moser AR et al. ApcMin: a mouse model for intestinal and mammary tumorigenesis. Eur. J. Cancer 31A, 1061–1064 (1995). [DOI] [PubMed] [Google Scholar]
- 42.Chassaing B, Aitken JD, Malleshappa M & Vijay-Kumar M Dextran sulfate sodium-induced colitis in mice. Curr. Protoc. Immunol 104, 15.25.1–15.25.14 (2014). [DOI] [PMC free article] [PubMed] [Google Scholar]
- 43.Tanaka T et al. Dextran sodium sulfate strongly promotes colorectal carcinogenesis in ApcMin/+ mice: inflammatory stimuli by dextran sodium sulfate results in development of multiple colonic neoplasms. Int. J. Cancer 118, 25–34 (2006). [DOI] [PubMed] [Google Scholar]
- 44.Brunkow ME et al. Disruption of a new forkhead/winged-helix protein, scurfin, results in the fatal lymphoproliferative disorder of the scurfy mouse. Nat. Genet 27, 68–73 (2001). [DOI] [PubMed] [Google Scholar]
- 45.Franckaert D et al. Promiscuous Foxp3-cre activity reveals a differential requirement for CD28 in Foxp3+ and Foxp3− T cells. Immunol. Cell Biol 93, 417–423 (2015). [DOI] [PMC free article] [PubMed] [Google Scholar]
- 46.Kitagawa Y et al. Guidance of regulatory T cell development by Satb1-dependent super-enhancer establishment. Nat. Immunol 18, 173–183 (2017). [DOI] [PMC free article] [PubMed] [Google Scholar]
- 47.Subramanian A et al. Gene-set enrichment analysis: a knowledge-based approach for interpreting genome-wide expression profiles. Proc. Natl Acad. Sci. USA 102, 15545–15550 (2005). [DOI] [PMC free article] [PubMed] [Google Scholar]
- 48.Zitvogel L, Ayyoub M, Routy B & Kroemer G Microbiome and anticancer immunosurveillance. Cell 165, 276–287 (2016). [DOI] [PubMed] [Google Scholar]
- 49.Voloshanenko O et al. Wnt secretion is required to maintain high levels of Wnt activity in colon cancer cells. Nat. Commun 4, 2610 (2013). [DOI] [PMC free article] [PubMed] [Google Scholar]
- 50.Moparthi L & Koch S Wnt signaling in intestinal inflammation. Differentiation 108, 24–32 (2019). [DOI] [PubMed] [Google Scholar]
- 51.Turner JR Intestinal mucosal barrier function in health and disease. Nat. Rev. Immunol 9, 799–809 (2009). [DOI] [PubMed] [Google Scholar]
- 52.Konig J et al. Human intestinal barrier function in health and disease. Clin. Transl. Gastroenterol 7, e196 (2016). [DOI] [PMC free article] [PubMed] [Google Scholar]
- 53.Pham TH, Okada T, Matloubian M, Lo CG & Cyster JG S1P1 receptor signaling overrides retention mediated by Gαi-coupled receptors to promote T cell egress. Immunity 28, 122–133 (2008). [DOI] [PMC free article] [PubMed] [Google Scholar]
- 54.Hoerl AE & Kennard RW Ridge regression: biased estimation for nonorthogonal problems. Technometrics 12, 55–67 (1970). [Google Scholar]
- 55.Therneau TM A Package for Survival Analysis in S version 2.38. https://CRAN.R-project.org/ (2015).
- 56.Friedman JH, Hastie T & Tibshirani R Regularization paths for generalized linear models via coordinate descent. J. Stat. Softw 33, 1–22 (2010). [PMC free article] [PubMed] [Google Scholar]
- 57.Kassambara A, Kosinski M, Biecek P & Fabian S Package ‘survminer’. https://cran.r-project.org/web/packages/survminer/survminer.pdf 2017.
- 58.Harada N et al. Intestinal polyposis in mice with a dominant stable mutation of the β-catenin gene. EMBO J. 18, 5931–5942 (1999). [DOI] [PMC free article] [PubMed] [Google Scholar]
- 59.Rubtsov YP et al. Regulatory T cell-derived interleukin-10 limits inflammation at environmental interfaces. Immunity 28, 546–558 (2008). [DOI] [PubMed] [Google Scholar]
- 60.Gounari F et al. Loss of adenomatous polyposis coli gene function disrupts thymic development. Nat. Immunol 6, 800–809 (2005). [DOI] [PMC free article] [PubMed] [Google Scholar]
- 61.Atarashi K et al. TH17 cell induction by adhesion of microbes to intestinal epithelial cells. Cell 163, 367–380 (2015). [DOI] [PMC free article] [PubMed] [Google Scholar]
- 62.Dose M et al. β-Catenin induces T cell transformation by promoting genomic instability. Proc. Natl Acad. Sci. USA 111, 391–396 (2014). [DOI] [PMC free article] [PubMed] [Google Scholar]
- 63.Heinz S et al. Simple combinations of lineage-determining transcription factors prime cis-regulatory elements required for macrophage and B cell identities. Mol. Cell 38, 576–589 (2010). [DOI] [PMC free article] [PubMed] [Google Scholar]
- 64.Zhang Y et al. Model-based analysis of ChIP-seq (MACS). Genome Biol. 9, R137 (2008). [DOI] [PMC free article] [PubMed] [Google Scholar]
- 65.Robinson MD, McCarthy DJ & Smyth GK edgeR: a Bioconductor package for differential expression analysis of digital gene expression data. Bioinformatics 26, 139–140 (2010). [DOI] [PMC free article] [PubMed] [Google Scholar]
- 66.Trapnell C et al. Differential gene and transcript expression analysis of RNA-seq experiments with TopHat and Cufflinks. Nat. Protoc 7, 562–578 (2012). [DOI] [PMC free article] [PubMed] [Google Scholar]
- 67.Reich M et al. GenePattern 2.0. Nat. Genet 38, 500–501 (2006). [DOI] [PubMed] [Google Scholar]
- 68.Shen L, Shao N, Liu X & Nestler E ngs.plot: quick mining and visualization of next-generation sequencing data by integrating genomic databases. BMC Genomics 15, 284 (2014). [DOI] [PMC free article] [PubMed] [Google Scholar]
- 69.Freese NH, Norris DC & Loraine AE Integrated genome browser: visual analytics platform for genomics. Bioinformatics 32, 2089–2095 (2016). [DOI] [PMC free article] [PubMed] [Google Scholar]
- 70.Tripathi S et al. Meta- and orthogonal integration of influenza ‘OMICs’ data defines a role for UBR4 in virus budding. Cell Host Microbe 18, 723–735 (2015). [DOI] [PMC free article] [PubMed] [Google Scholar]
Associated Data
This section collects any data citations, data availability statements, or supplementary materials included in this article.
Supplementary Materials
Data Availability Statement
RNA-seq, ChIP–seq and ATAC-seq datasets have been deposited in the Gene Expression Omnibus under accession code GSE139960. All raw data and source data that support the findings of this study are available from the corresponding authors upon request.


