

Abstract
Mechanical loading is an important aspect of post-surgical fracture care. The timing of load application relative to the injury event may differentially regulate repair depending on the stage of healing. Here, we use a novel mechanobiological model of cortical defect repair that offers several advantages including its technical simplicity and spatially confined repair program, making effects of both physical and biological interventions more easily assessed. Using this model, we show that daily loading (5 N peak load, 2 Hz, 60 cycles, 4 consecutive days) during hematoma consolidation and inflammation disrupts the injury site and activates cartilage formation on the periosteal surface adjacent to the defect. We also show that daily loading during the matrix deposition phase enhances both bone and cartilage formation at the defect site, while loading during the remodeling phase results in an enlarged woven bone regenerate. All loading regimens resulted in abundant cellular proliferation throughout the regenerate and fibrous tissue formation directly above the defect demonstrating that all phases of cortical defect healing are sensitive to physical stimulation. Stress was concentrated at the edges of the defect during exogenous loading, and finite element (FE)-modeled longitudinal strain (εzz) values along the anterior and posterior borders of the defect (~2200 με) was an order of magnitude larger than strain values on the proximal and distal borders (~50–100 με). It is concluded that loading during the early stages of repair may impede stabilization of the injury site important for early bone matrix deposition, whereas loading while matrix deposition and remodeling are ongoing may enhance stabilization through the formation of additional cartilage and bone.
Keywords: Bone repair, mechanical loading, mouse tibia, cortical defect, mechanobiology
1.0. Introduction
Bone repair is a highly organized and controlled process involving specialized cells and signaling molecules that are precisely coordinated in time and space. The bone repair program is acutely sensitive to mechanical stimulation [1–6], and early weight-bearing is an important aspect of orthopaedic post-surgical care [7]. How mechanical signals are sensed and integrated to regulate healing is incompletely understood. Characterizing the mechanical environment during bone repair and understanding its effects on gene expression, cell behavior, and tissue level properties is essential for the development of novel therapeutic treatments, both physical and pharmaceutical, for complex orthopaedic injuries in weight-bearing bones.
Previous studies using osteotomy and segmental defect models examined the influence of mechanical loading on healing [8–14]. The effects of load magnitude and latency period on healing were investigated using a pinned mouse tibial osteotomy model [8]. Compressive axial loading (100 cycles/day, 1 Hz, 5 days per week for 2 weeks at 0.5 N, 1 N, and 2 N peak load) was applied across the flexed knee and ankle immediately after fracture or after a 4-day delay, which coincided with the hematoma and inflammation stages. Loading applied immediately after fracture during the acute injury stage inhibited callus formation regardless of load magnitude, resulting in reduced callus strength and stiffness compared to non-loaded controls. Of all combinations of load magnitude and latency period, only the 0.5 N load applied at 4 days post-fracture resulted in a stronger callus relative to non-loaded controls.
Additional studies have shown that femoral segmental defects subjected to daily cyclic bending (900 cycles, 1Hz, 15 min/day for 5 consecutive days per week for 1, 2 or 4 weeks) beginning on post-surgical day 10, which coincided with a provisional matrix scaffold, led to formation of pseudarthrosis with enhanced cartilage formation [9,10], increased expression of cartilage-related genes COL2A1 and COL10A1 [9] and mechanically-activated genes FAK and RhoA [11], and decreased expression of bone-related genes BMP-4, -6, and -7 [9]. In other studies, the effects of continuous compressive ambulatory loading on repair of a critical sized femoral defect were investigated [12,13]. Defects were treated with rhBMP-2 and fixed with either stiff or adjustable locking plates, which when unlocked served as compliant fixation. Adjustable plates were unlocked at either day 0 (acute injury phase) or 4 weeks post-fracture when low-density bone was present in the defect [14]. Compliant fixation beginning on day 0 resulted in significantly reduced vascularization and bone formation compared to stiff plate controls. In contrast, compliant loading beginning after a 4-week delay led to enhanced bone and cartilage formation and stimulated vascular remodeling [12,13]. Together these results suggest that loading initiated during the acute injury phase (day 0) disrupts stabilization of the injury site and inhibits bone formation, whereas loading initiated after bone matrix has been deposited enhances both bone and cartilage formation.
While these studies reveal effects of long-term habitual loading on healing, it is less clear how short-term acute loading confined to distinct stages of repair affects cellular activity, tissue formation and overall healing. Furthermore, the previously described models rely on fixation hardware (e.g., intramedullary pin, plates, external fixator) for stabilization, which can exert secondary effects on healing including inflammation at the site of implantation [15], infection [16], and disruption of the marrow cavity with intramedullary pinning, all of which may mask direct effects of mechanical stimulation on repair. Additionally, any inconsistencies in surgical implant placement may introduce variability in the amount of micromotion at the injury site across samples [12,17–19].
The aim of this study was to determine the effects of short-term exogenous mechanical loading during early (inflammation), intermediate (matrix deposition), and late (remodeling) stages of repair on cortical defect healing. Here we utilize a self-stabilizing monocortical defect model [20,21] that undergoes a well-defined intramembranous repair program and that is amenable to application of precisely controlled axial compressive loading regimens [22–25] at defined stages of healing. We chose this intramembranous repair model because any formation of cartilage and fibrous tissue could be attributed to the applied load, and the absence of radio-opaque fixation hardware: (1) eliminated potential secondary effects of hardware, (2) permitted in vivo longitudinal microCT scanning, and (3) facilitated development of FE models for estimation of load-induced mechanical strain at the injury site. We hypothesized that loading during distinct stages of repair would differentially influence cellular activity, tissue formation and healing, and if supported, may aid in the development of biophysical rehabilitative strategies to enhance fracture repair.
2.0. Materials and Methods
2.1. Experimental design
The NYU Institutional Animal Care and Use Committees approved all procedures. Sixteen-week-old C57BL/6 female mice were obtained from The Jackson Laboratory (Bar Harbor, ME) and had access ad libitum to standard mouse chow and water for the duration of the study. All mice underwent bilateral monocortical tibial defect surgery. Three mice were used for generation of ex vivo load-strain calibration curves and development of linear elastic finite element (FE) models of whole tibiae for estimating strain components at the defect site. The remaining mice were subjected to in vivo tibial axial compressive loading for four consecutive days beginning on post-surgical day (PSD) 2, 5, or 10. PSD 2–5 is dominated by hematoma formation, inflammation, and granulation tissue formation; PSD 5–8 is dominated by bone matrix deposition, and PSD 10–14 is dominated by bone remodeling. Non-loaded defects served as controls. All mice underwent in vivo longitudinal micro-computed tomographic (microCT) scanning of bilateral defects on PSD 2, 5, 8, 10 and 14 or until euthanized (see 2.5 In vivo longitudinal microCT). Groups of mice were euthanized at PSD 2, 5, 10 or 14 for histological analyses.
2.2. Monocortical defect surgery
Under isoflurane anesthesia, a small skin incision was made over the midline of the anteromedial aspect of the tibia. A 1.0 mm circular defect centered between the tibiofibular junction (TFJ) and the tibial tubercule (Figure 1a) was made using a precision surgical drill. The defect center was located 4.3 mm below the proximal articulating surface of the proximal tibia. After saline irrigation, the incision was closed with 7-0 nylon sutures. Mice were transferred into a clean cage positioned on a 37°C heating pad. Buprenorphine was administered immediately before surgery and at 6, 24, 48, and 72 hours after surgery.
Figure 1.
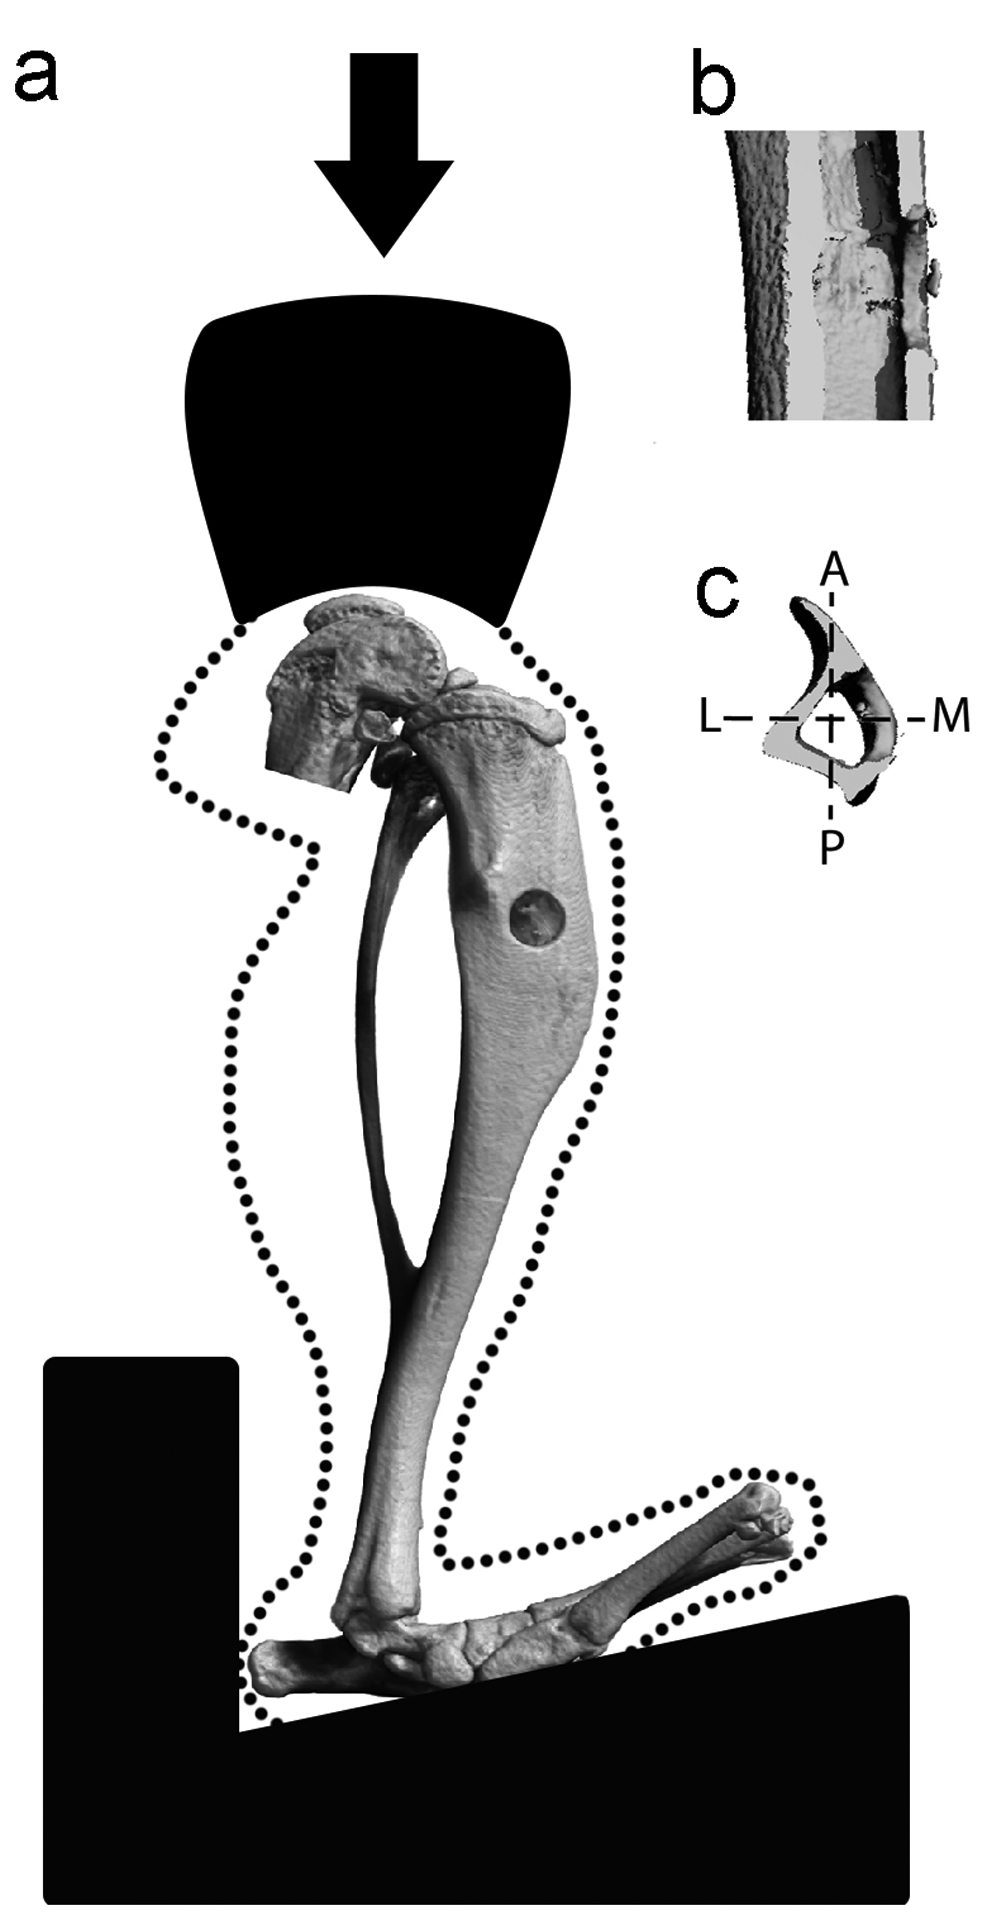
Axial compressive cyclic loading of a mouse tibia containing a monocortical defect. (a) Anteromedial, (b) sagittal, and (c) transverse views of the defect. Axes in the transverse view are A (anterior) – P (posterior) and L (lateral) – M (medial).
2.3. Finite element analysis with model validation
Linear elastic FE models of three individual tibiae at PSD 2, each containing a 1.0 mm cortical defect, were developed as representative experimental cases. We chose to run a model of the entire tibia to better understand the strain distribution throughout the tibia when it contained a defect. Following euthanasia, the tibial surfaces were exposed and single axis strain gages (EA-06-015DJ120, Micro-Measurements, Wendell, NC) were applied 1 mm proximal and distal from the defect, with orientation coincident with the long axis of the tibia (Figure 2a). Limbs were loaded in axial compression to peak loads of 1 to 10 N in 1 N increments, and the longitudinal strains were recorded. The tibia was then positioned and secured in custom 3D printed fixtures made of acrylonitrile butadiene styrene with identical dimensions as those used in the axial tibial loading protocol. The fixture contained a nylon thumbscrew to secure the tibia between the platens using minimal force. Prior to microCT scanning, aluminum foil inserts were placed at the center of the knee loading cup and on the hind paw loading fixture. MicroCT scans (Scanco vivaCT 40) of the entire limbs were used to create 3D solid models of the tibia in MIMICS (Materialise, Plymouth, MI). Scan sets were oriented in MIMICS such that the centroids of the proximal and distal foil markers were aligned in the longitudinal direction. In this way, the orientation of the scan set was consistent with the axial orientation in the loading fixture. Voxel-based finite element meshes were created (432,000 elements, 530,000 nodes) with 0.03mm edge length. Homogenous and isotropic material properties were assigned to the tibia with a 17 GPa elastic modulus and 0.3 Poisson’s ratio.[26] Linear elastic finite element analysis was performed in MSC Marc (MSC Software Co, Newport Beach, CA). Axial compressive loads were applied to small contact patches on the medial and lateral plateau regions proximally (Figure 2a). Distally, the tibia was fixed to prevent translation in x, y, and z directions with nodal ties applied to distal contact regions. In addition, translations in the x and y directions were prevented at one point (the centroid) of the proximal tibial surface. Overall, these boundary conditions allow rotation at the knee and bending of the tibia during axial compression [25]. For validation purposes, the measured longitudinal strains were compared to the finite element surface strains over the same surface area occupied by the gages (0.38mm × 0.5mm). Additionally, strains (longitudinal, minimum and maximum principal) and von Mises stresses were determined at four locations around the defect (Figure 2a, white stars) and on the medial periosteal surface on the opposing cortex (Figure 2a, red star); and maximum and minimum principal strain vector orientations were examined to confirm that they were consistent with the tibia undergoing compression and bending in response to an applied axial compressive load.
Figure 2.
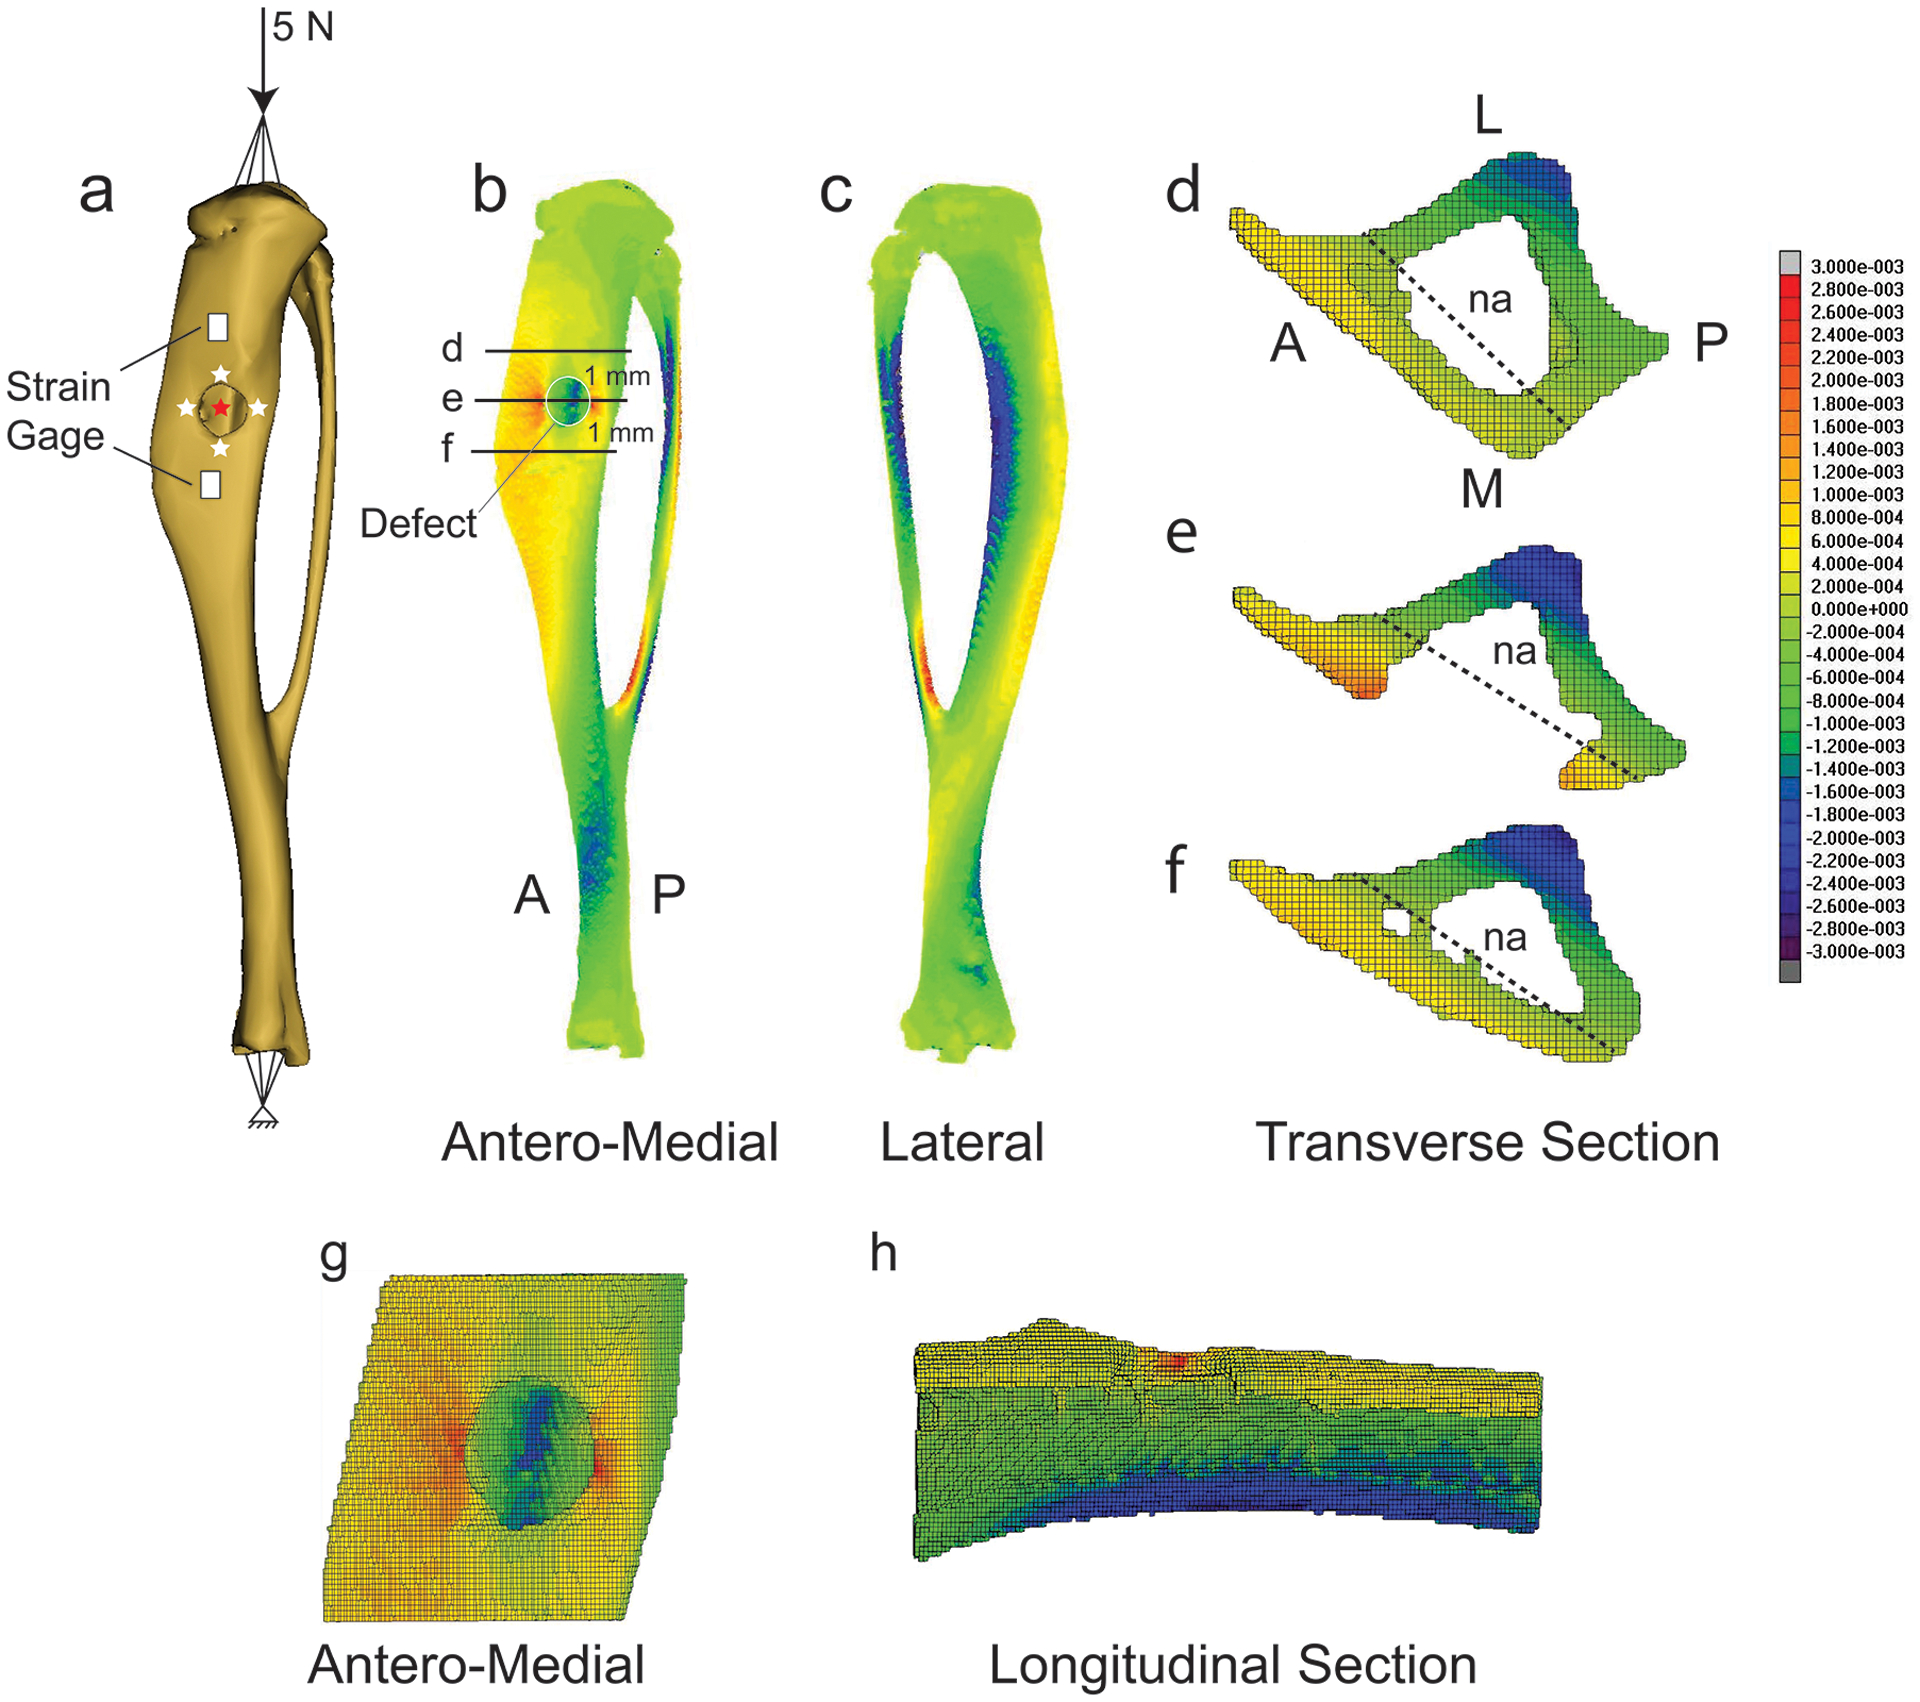
Distribution of longitudinal strain in a representative tibia containing a monocortical defect and in sections containing, or near, the defect. (a) Rendered tibia showing defect, applied compressive 5 N peak load, strain gage placement, and positions along the defect border (white stars), and opposing cortex (red star), where strain components were evaluated. (b) Antero-medial view. (c) Lateral view. Transverse section located: (d) 1 mm proximal to the center of the defect, (e) at the defect center, and (f) 1 mm distal to the defect. (g) Magnified antero-medial view of the bone segment containing the defect. (h) Longitudinal section of segment containing the defect. Red indicates tensile strain, blue indicates compressive strain. na = neutral axis.
2.4. In vivo tibial loading
Tibiae were subjected to four consecutive days of in vivo axial compressive cyclic loading (5 N peak load, 2 Hz, 60 cycles) via load feedback using an electromagnetic mechanical loading device (TA EnduraTEC 3200, Enduratec Systems Group). The tibia was secured at the flexed knee and ankle joints, and an axial load was applied through the knee creating bending and compressive strains throughout the tibia [22,25]. Loading began on PSD 2, 5, or 10, each of which corresponds to distinct stages of repair: (1) PSD 2 to 5, hematoma formation and inflammatory exudation; (2) PSD 5 to 8, bone matrix deposition; and (3) PSD 10 to 13, matrix mineralization.
2.5. In vivo longitudinal microCT
MicroCT scanning and analyses were performed in concordance with published guidelines [27]. Transverse high-resolution microCT images of bilateral defects were simultaneously acquired (210 slices, 55 kVp, 300 ms integration time, 10.5 μm isotropic voxel size) on PSD 2, 5, 8, 10, and 14 using an in vivo microCT scanner (vivaCT 40, Scanco USA, Inc.). The time from the onset of anesthesia to recovery was approximately 25 minutes, and the total scanning time was approximately 15 minutes. The region of interest (ROI) was centered at mid-defect and extended 50 slices beyond the defect edges in the proximal and distal directions. The ROI included the defect, regenerate (localized irregular tissue within the defect consisting of woven bone matrix, connective tissue, and cells), and surrounding cortices (Figure S1) selected through segmentation using a constant global threshold CT value of 171, which represents a percent of the CT value range based on the linear attenuation coefficient per the manufacturer’s recommendations and preliminary studies comparing the original and segmented scans side-by-side to ensure segmentation accuracy. Percent change in bone volume relative to PSD 2 for that particular was calculated for each defect at PSD 5, 10 and 14.
2.6. Tissue processing and histomorphometry
At PSD 2, 5, 10, and 14, tibiae were harvested and fixed in 4% paraformaldehyde overnight and decalcified in 19% EDTA for 14 days at room temperature. Fixed bones were processed for paraffin embedding and sectioned in the longitudinal direction into 6 μm serial sections. Consecutive sections at mid-defect were stained for: (1) aniline blue (every 9th slide) to evaluate new bone formation, (2) Movat’s pentachrome staining to visualize gross tissue appearance, (3) proliferating cell nuclear antigen (PCNA) to assess cellular proliferation (Santa Cruz Biotechnology, sc-9857, goat polyclonal antibody), (4) Runx2 (OriGene, TA309842, rabbit polyclonal antibody) to assess osteogenic differentiation, (5) alkaline phosphatase (ALP) to examine osteoblast activity, and (6) tartrate-resistant acid phosphatase (TRAP) to evaluate osteoclastic activity. Sections were imaged using a Leica DM5500 microscope at 5x, and images were evaluated using ImageJ. Formation of bone and cartilage within the tibial defects was assessed from aniline blue and pentachrome stained sections, respectively, by counting selected pixels as previously described [21]. Gross histological appearance of PCNA, Runx2, ALP, and TRAP staining, and quantified bone and cartilage area were compared between experimental groups.
2.7. Data analyses
Differences in (1) percent change in bone volume, (2) bone area, and (3) cartilage area on PSD 5, 10 and 14 were compared by a one-way ANOVA with loading group (control, PSD 2 to 5, PSD 5 to 8, and PSD 10 to 13) as the main factor (Prism 6 Statistical Software, GraphPad Software, Inc.). Data are presented as mean +/− standard deviation. Statistical significance was assumed for p < 0.05.
3.0. Results
3.1. FE model validation and strain distribution in cortical bone surrounding the defect
To better understand the mechanical environment of a monocortical tibial defect subjected to exogenous loading, we developed FE models of three separate tibiae each containing a single defect. Longitudinal tensile strains measured on the cortical surface (Figure 2a) in response to a 5 N peak load applied in axial compression through the knee joint were lower for the proximal gage (326±34 με) compared to the distal gage (598±312 με). Corresponding FE results for the proximal (311±83 με) and distal (608±155 με) gage locations corresponded with the measured experimental strain.
Bending at the proximal tibia was evident with tensile and compressive strains on the medial and lateral surfaces, respectively (Figure 2b, c). The neutral axis was parallel to the antero-medial aspect of the tibia, and shifted from the center of mass of the section (Figure 2e) indicative of a combination of compression and bending. Near the defect, there was a tensile strain concentration along the anterior and posterior borders (~2200 με), while the strain on the proximal and distal borders were much smaller (~50–100 με) (Table 1). Strain on the periosteal cortex opposing the defect had the highest strain magnitudes (~−2600 με) and were compressive in nature. The maximum principal strain vector orientation at the medial and lateral sides of the defect was aligned with the long axis of the tibia indicating tension on the antero-medial surface of the tibia. The minimum principal strain vector orientation at the cortex opposing the defect was aligned with the long axis of the tibia indicating compression. These results demonstrate that the tibia is undergoing both compression and bending in response to an applied axial compressive load. In sum, loading produces a strain field around the defect that is high on the anterior and posterior borders and low on the proximal and distal borders (Figure 2g, h).
Table 1.
Bone strain components at four positionsa around the monocortical tibial defect edge and on the opposing cortex at the posterior aspect of the tibia.
| εzzb (με) | εminc (με) | εmaxd (με) | von Mises Stress (MPa) | |
|---|---|---|---|---|
| Anterior | 2,353 ± 689 | −623 ± 112 | 2,140 ± 450 | 37.3 ± 9.7 |
| Posterior | 2,033 ± 503 | −540 ± 239 | 2,260 ± 589 | 35.9 ± 8.0 |
| Proximal | 93 ± 77 | −233 ± 188 | 155 ± 21 | 6.2 ± 1.7 |
| Distal | 44 ± 51 | −270 ± 61 | 50 ± 29 | 7.5 ± 0.9 |
| Opposing Cortex | −2,543 ± 450 | −2,657 ± 450 | 690 ± 69 | 42.9 ± 5.5 |
See Figure 2 for position information
Strain (ε) in the longitudinal direction (zz) and parallel to the long axis of the tibia in units of microstrain (με)
Minimum principal strain
Maximum principal strain
3.2. Sample-specific changes in bone volume during healing
To evaluate longitudinal changes in bone volume at the defect site, in vivo longitudinal microCT scanning of defects was performed at PSD 2, 5, 8, 10 and 14. Significant differences in percent change in bone volume between experimental groups at each time point were not detected, and high variability within groups was observed (Figure 3).
Figure 3.
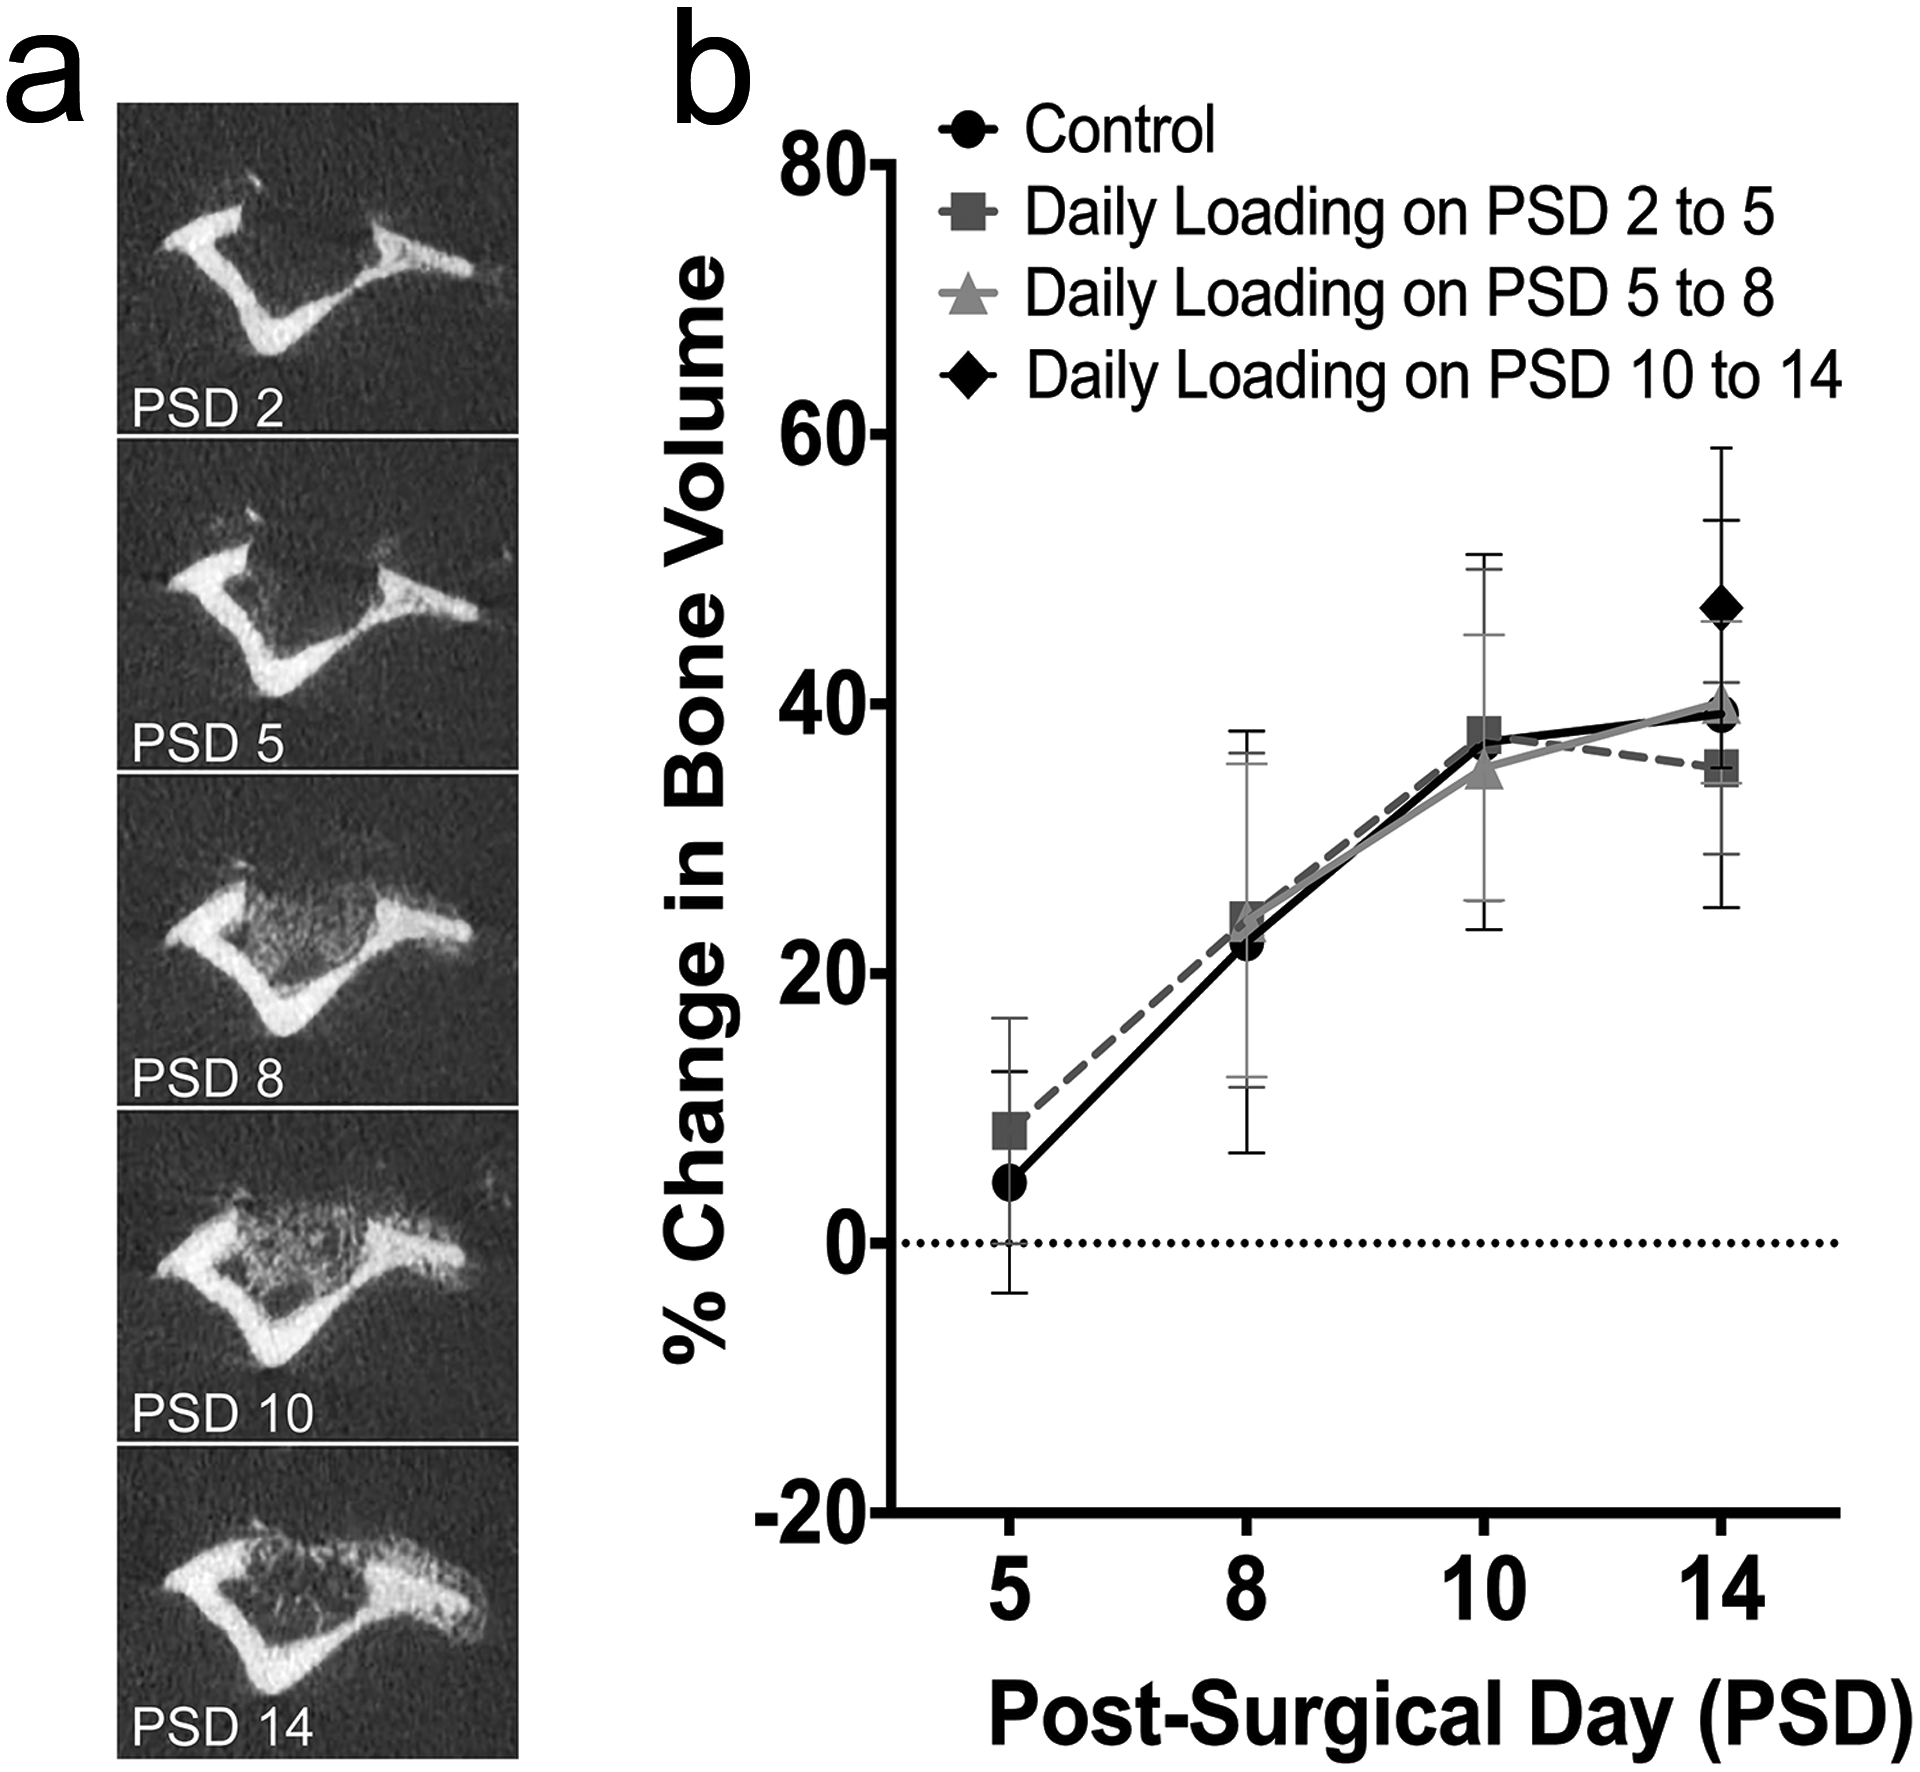
Percent change in bone volume in control and loaded tibiae during the course of healing by longitudinal microCT scanning. (a) Longitudinal microCT scans at PSD 2, 5, 8, 10 and 14 in a non-loaded control tibia show an increasingly mineralized regenerate at the defect site. (b) Percent change in bone volume relative to PSD 2 for all experimental groups increased at PSD 5, 8 and 10, and leveled-off by day 14. Data represent mean ± SD (n=8 control, n=16 loaded on PSD 2 to 5, n=10 loaded on PSD 5 to 8, n=9 loaded on PSD 10 to 13).
3.1. Daily loading during the inflammatory phase (PSD 2 to 5) delays hematoma clearance and bone matrix deposition, stimulates cellular proliferation and osteoclast activity, and promotes cartilage formation.
To gain insight into the effects of loading during the early stages of defect repair, defects were subjected to loading on PSD 2 to 5, when hematoma formation, inflammatory exudation, and granulation tissue formation are underway [20]. At PSD 2, control defects (Figure 4, Figure S2) were filled with a hematoma (Figure 4a) with robust cellular proliferation within the hematoma (Figure 4e) and at the periosteal surface (Figure 4i), and relatively low levels of osteogenic differentiation (Figure 4m) and osteoclast activity (Figure 4q) detected. At PSD 5, control defects showed bridging with woven bone and new bone formation at the periosteal surface (Figure 4b, j) with cellular proliferation evident within the defect (Figure 4f, j). Osteogenic differentiation (Figure 4n) peaked within the defect at PSD 5 and a small number of TRAP+ cells were evident (Figure 4r) within the defect suggesting the beginning of osteoclastic matrix remodeling. At PSD 10, an enlarged regenerate was present (Figure 4c) with osteoblast (ALP) and osteoclast (TRAP) activity underway (Figure 4o, s). At PSD 14, the regenerate was substantially remodeled (Figure 4d) with cellular proliferation detected in soft tissue above the periosteal surface (Figure 4l). Remodeling of the regenerate was still underway (Figure 4p, t).
Figure 4.
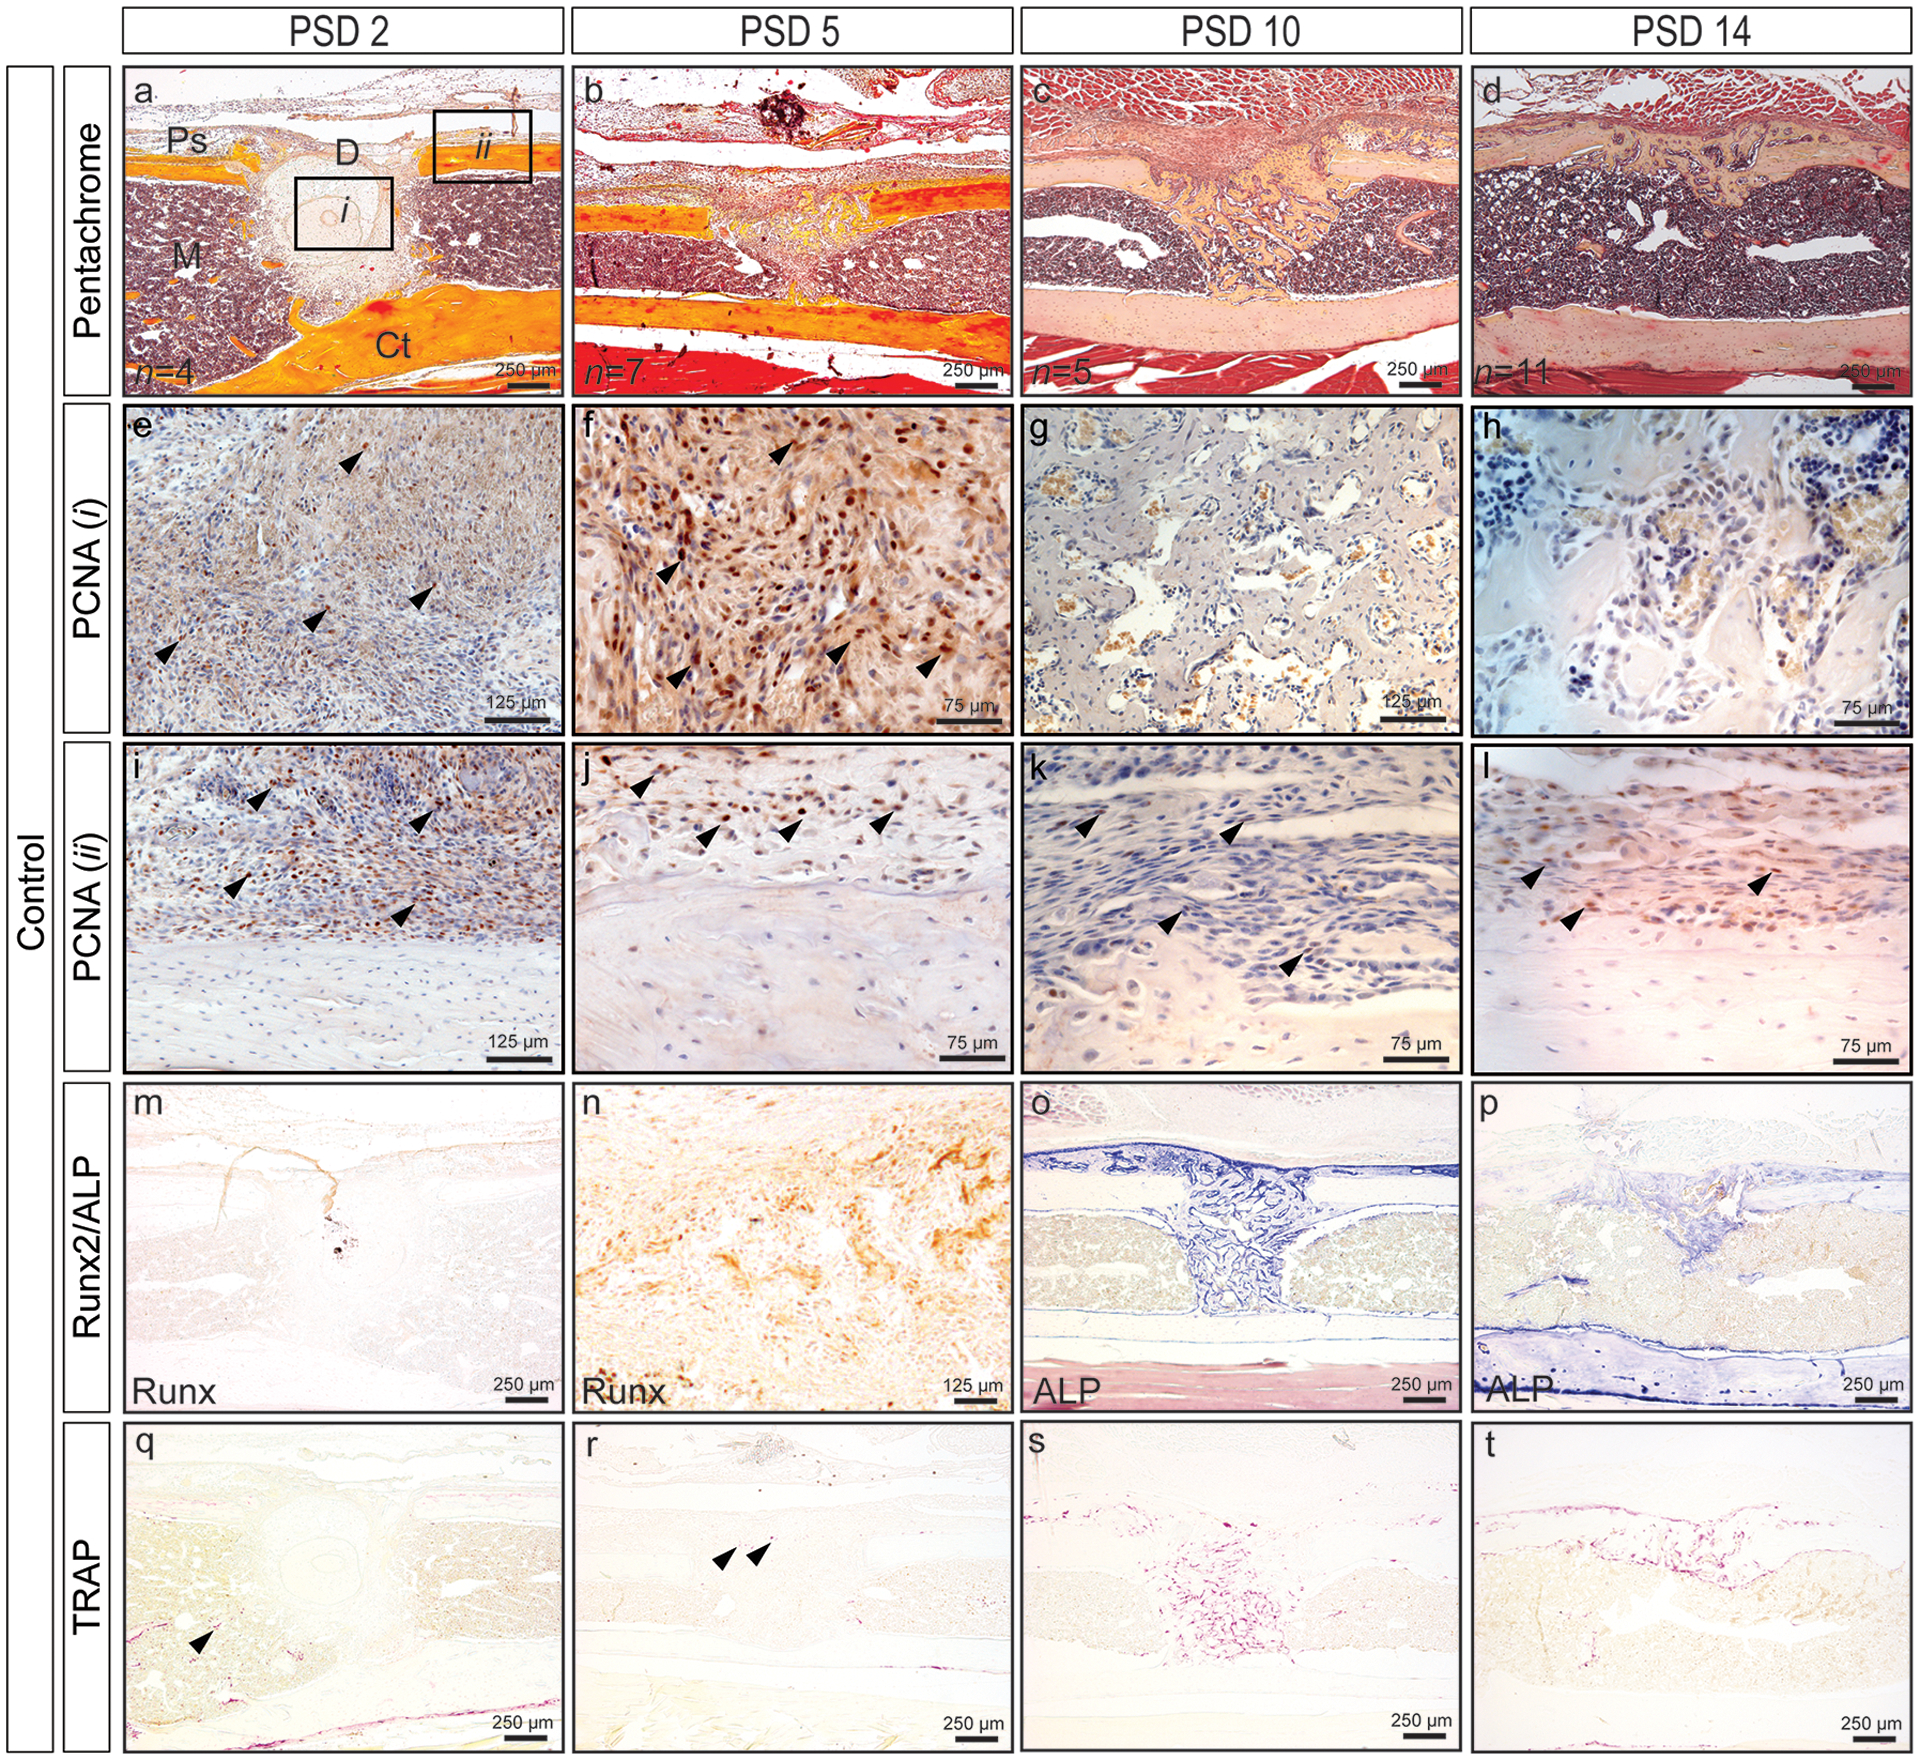
Time course of monocortical defect healing in control mouse tibia. (a-d) Pentachrome staining reveals defect healing through intramembranous bone formation. (e-l) Robust cellular proliferation (black arrows, PCNA+ cells are brown) within the defect (i) and at the periosteal surface (ii) up to PSD 5. Cellular proliferation in fibrous tissue above the periosteum (k, l), but not within the defect (g, h) at PSD 10 and 14. (m-p) Osteogenic differentiation (Runx2) (m, n) and osteoblast activity (ALP) (o, p). (q-t) Low levels of osteoclast activity are evident within the marrow cavity and defect at PSD 2 and 5 (black arrows), and increases at PSD 10 and 14 as the regenerate begins to remodel. Quantified bone and cartilage data for controls are presented in Figures 6 thru 8 alongside data for loading groups. D = defect; M = marrow; Ps = periosteal surface; Ct = cortical bone.
Defects subjected to daily loading from PSD 2 to 5 (Figure 5) exhibited a hematoma within the defect (Figure 5a, d) and an elevated periosteum consisting of proliferating cells (Figure 5g) at PSD 5. The hematoma likely resulted from either newly perforated blood vessels in response to loading and/or a delay in removal of the primary hematoma formed immediately after surgery. Proliferating cells were observed within the defect at all time points post-loading and within the elevated periosteum and surrounding cartilage nodules suggesting that loading activated proliferation even when strains were relatively low (50–100 με). Relative to controls at PSD 5, less osteogenic differentiation within the defect and more TRAP staining at the periosteal and endosteal envelopes were observed. Cartilage and fibrocartilage formation was observed above the defect and periosteal surface at PSD 10 (Figure 5b, p) indicating that loading during the inflammatory phase pushes osteochondroprogenitors into a cartilage phenotype. Finally, robust remodeling as assessed by ALP and TRAP staining was observed at PSD 14. Overall, mechanical loading during the early stages of repair appears to disrupt the injury site resulting in a prolonged healing program.
Figure 5.
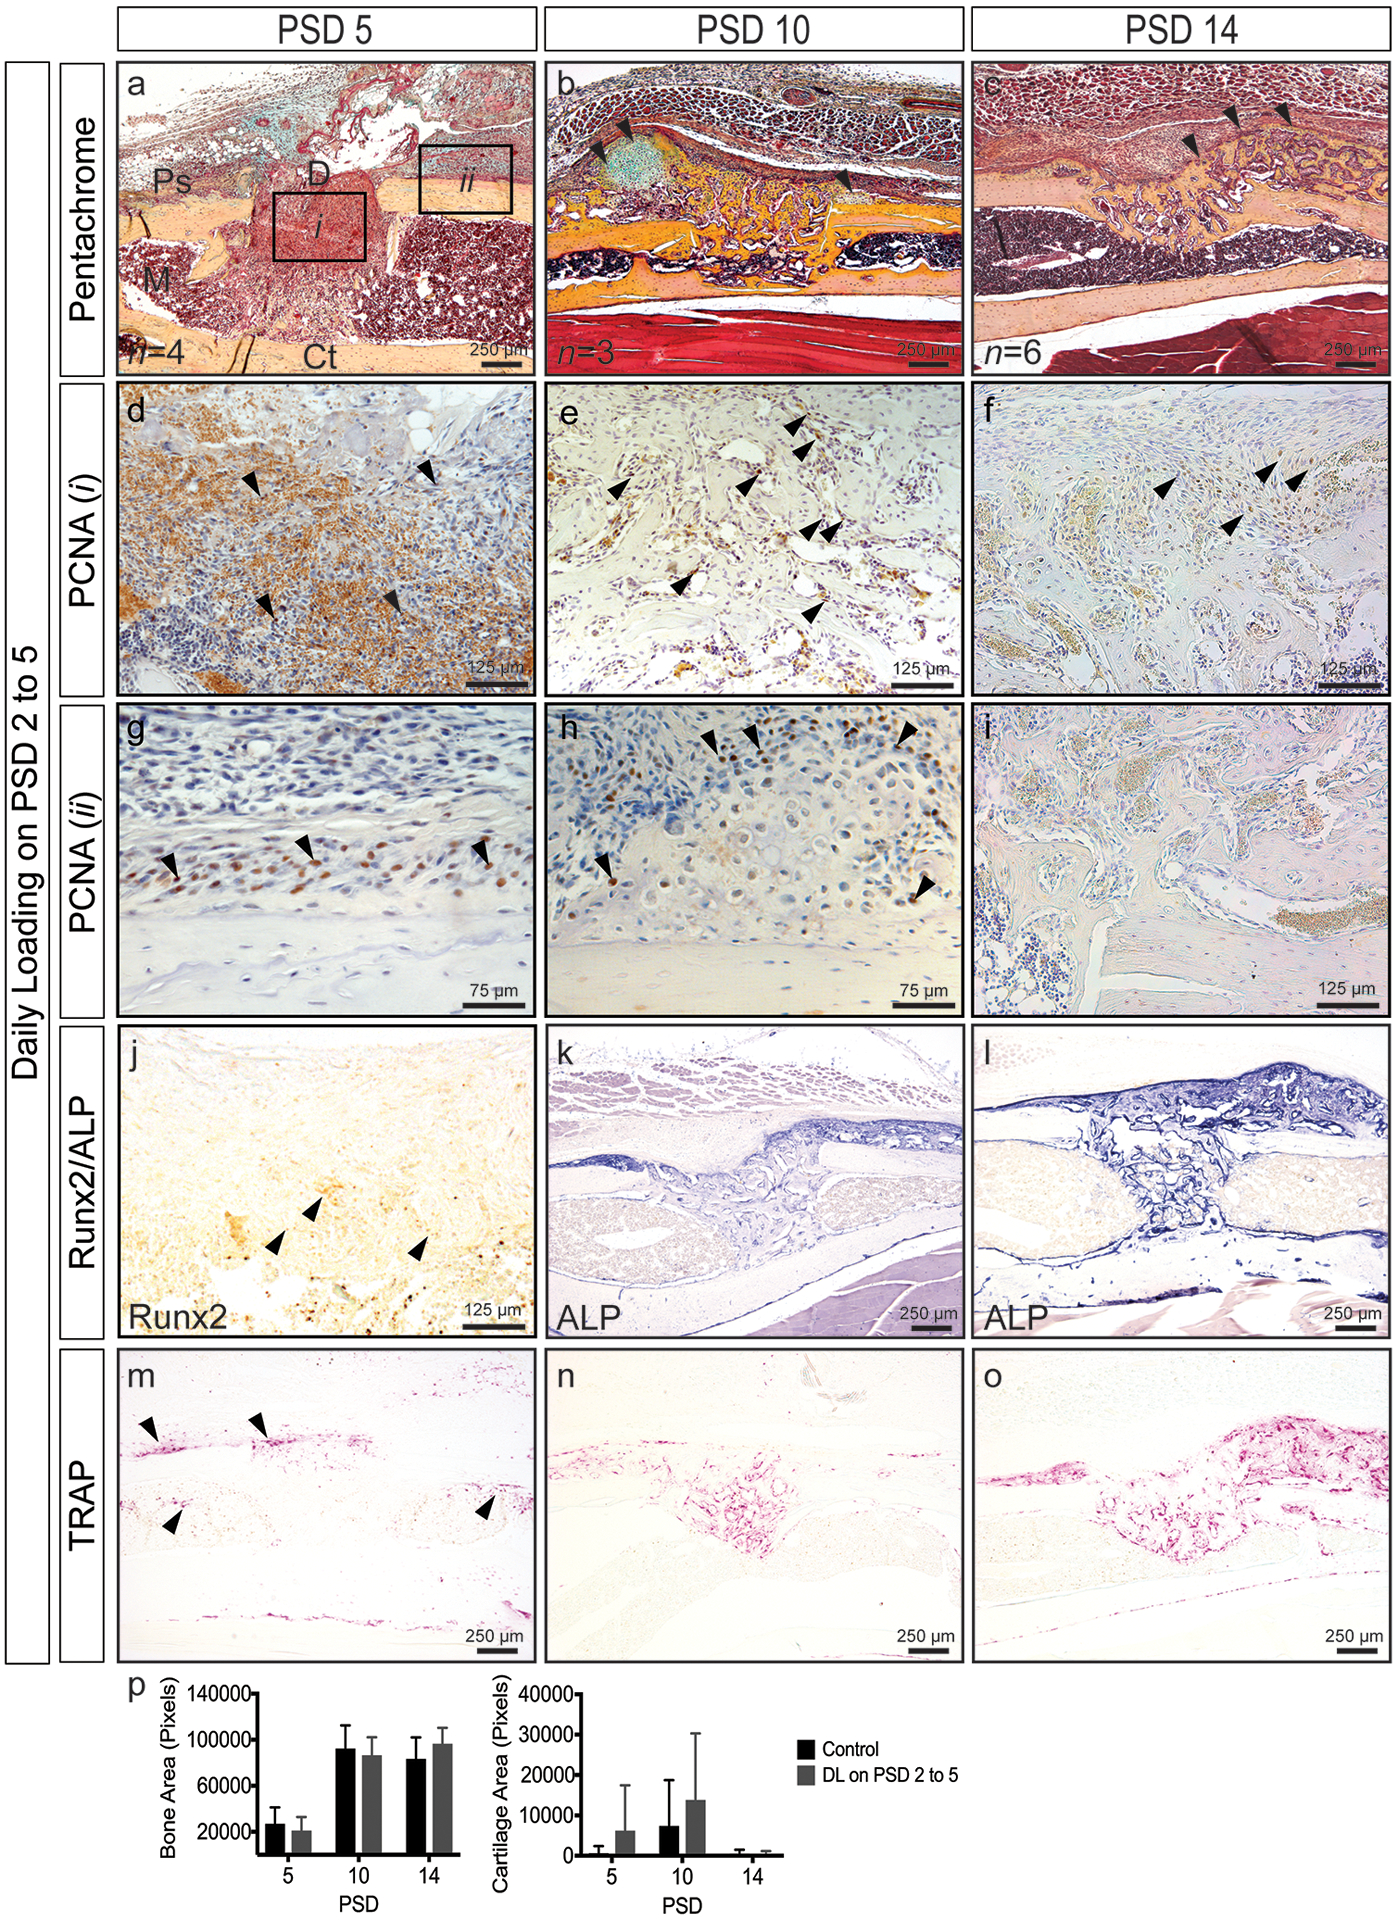
Time course of monocortical defect healing in response to daily loading at PSD 2 to 5 (see Figure 4 for control sections). (a-c) Pentachrome staining reveals robust cartilage formation (black arrows) at PSD 10 and the continued presence of woven bone (black arrows) at PSD 14. (d-i) Robust cellular proliferation (black arrows, PCNA+ cells are brown) within the defect (i) at all time points. An elevated periosteum (ii) containing proliferating cells (black arrows) at PSD 5. Proliferating cells (black arrows) at the cartilage periphery above the periosteal surface (h). (j-l) Osteogenic differentiation (Runx2, black arrows) and activity (ALP). (m-o) Enhanced osteoclast activity at PSD 5 (black arrows). (p) Quantified bone and cartilage area. Data represent mean ± SD. Differences between groups at each time point tested by one-way ANOVA. Significance accepted at α = 0.05. D = defect; M = marrow; Ps = periosteal surface; Ct = cortical bone.
3.2. Daily loading during the matrix deposition phase (PSD 5 to 8) stimulates cellular proliferation, promotes cartilage formation, and enhances bone formation.
To better understand the effects of mechanical loading during the matrix deposition phase, defects were subjected to loading on PSD 5 to 8. Histological evaluation (Figure 6) showed cartilage and fibrocartilage formation at or near the periosteal surface at PSD 10 (Figure 6a) and 14 (Figure 6b), though differences between groups did not reach significance (k). Exuberant cellular proliferation was observed within the defect (Figure 6c, d) and at the periphery of cartilage nodules (Figure 6e, f) above the periosteum. Loaded defects displayed significantly greater bone area (p = 0.02) at PSD 10 (k). This result together with enhanced proliferation within the defect suggests that loading activates proliferation. Remodeling, as assessed by osteoblast (Figure 6g, h) and osteoclast activity (Figure 6i, j), was evident throughout the regenerate and at the periosteal and endosteal surfaces at PSD 10 and 14. Thus, mechanical loading during matrix deposition activates additional bone formation and modest levels of cartilage formation.
Figure 6.
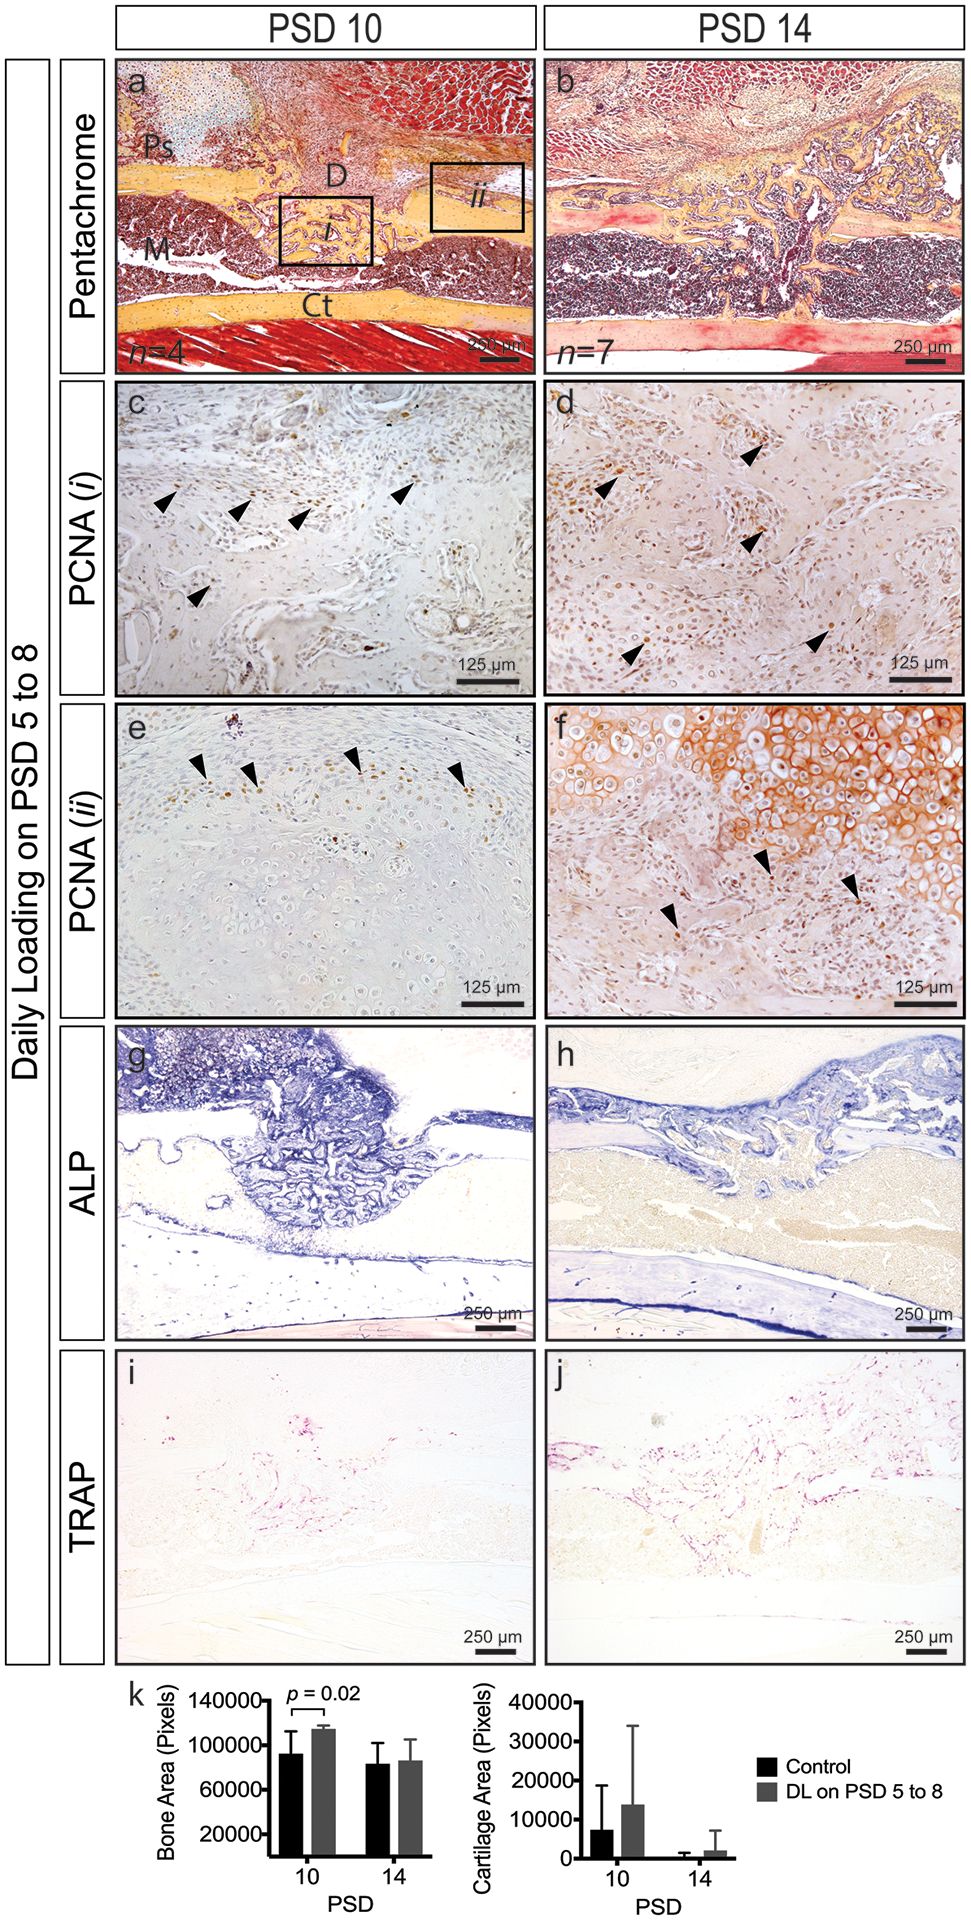
Time course of monocortical defect healing in response to daily loading at PSD 5 to 8 (see Figure 4 for control sections). (a, b) Pentachrome staining reveals cartilage formation (black arrows) at PSD 10 and the continued presence of woven bone and fibrocartilage (black arrows) at PSD 14. (c-f) Robust cellular proliferation (black arrows, PCNA+ cells are brown) within the defect (i) and above the periosteal surface near cartilage nodules (ii). (g-j) Osteoblast (ALP) and osteoclast (TRAP) activity throughout the regenerate. (k) Quantified bone and cartilage area; significantly greater bone area (p = 0.02) in loaded versus control defects at PSD 10. Data represent mean ± SD. Differences between groups at each time point tested by one-way ANOVA. Significance accepted at α = 0.05. D = defect; M = marrow; Ps = periosteal surface; Ct = cortical bone.
3.3. Daily loading during the remodeling phase (PSD 10 to 13) stimulates cellular proliferation and prolongs the remodeling phase.
To examine the effects of mechanical loading during the remodeling phase of repair, defects were subjected to loading on PSD 10 to 13 when the regenerate is undergoing rapid turnover. Relative to controls (Figure 3), loaded defects showed abundant amounts of woven bone within the defect and at the periosteal surface (Figure 7a), with proliferating cells dispersed throughout the regenerate (Figure 7b, c). Much of the regenerate was undergoing osteoblast- and osteoclast-driven remodeling as assessed by ALP and TRAP staining. Though abundant amounts of woven bone was present, cartilage formation was not observed at PSD 14 suggesting that the regenerate had reached a point of maturation at which fewer osteochondroprogenitors were present and the stiffening matrix reduced overall load-induced strain.
Figure 7.
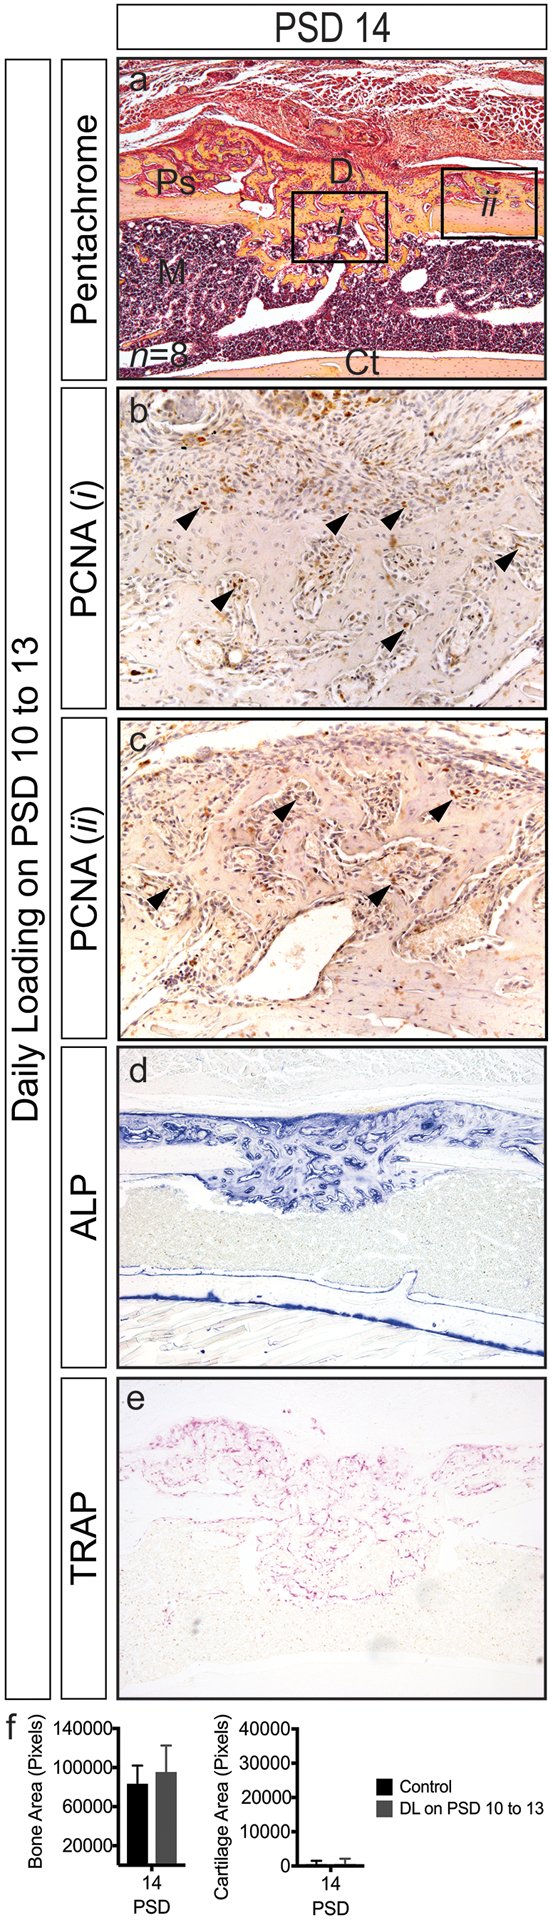
Monocortical defect healing in response to daily loading at PSD 10 to 13 (see Figure 4 for control sections). (a) Woven bone within the defect and at the periosteal surface at PSD 14 (b) Robust cellular proliferation (black arrows) within the defect (i) and in regions of woven bone above the periosteal surface (ii). (d, e) Osteoblast (ALP) and osteoclast (TRAP) activity are apparent throughout the regenerate. (f) Bone area is similar between control and loaded defects. Only small regions of cartilage formed in response to loading. Data represent mean ± SD. Differences between groups at each time point tested by one-way ANOVA. Significance accepted at α = 0.05. D = defect; M = marrow; Ps = periosteal surface; Ct = cortical bone.
4.0. Discussion
Compressive strain, tensile strain, hydrostatic pressure, shear strain, and fluid dynamics have all been implicated as important mechanical cues regulating bone regeneration [2,5,28], and there is a rapidly growing body of quantitative work describing relationships between mechanical factors, tissue formation, and tissue-specific differentiation during bone healing [5,6,9,11,12,17,29,30]. Overall, these studies have suggested that low stress and strain lead to direct intramembranous bone formation, compressive stress and strain lead to chondrogenesis, and high tensile strain leads to fibrous tissue formation [5,8,31]. We show that four consecutive days of cyclic axial compressive loading during the early stage of repair disrupts the regenerate, suppresses osteogenesis and enhances cartilage formation, whereas loading confined to the intermediate and late stages of repair results in robust cellular proliferation within the regenerate and at the periosteal surface, and augments both cartilage and bone formation.
Using a novel mechanobiological model, we found that loading during the earliest stages (PSD 2 to 5) of repair disturbs the injury site as evidenced by a persistent hematoma. Our analyses could not distinguish whether the persistent hematoma was because of a delay in clearance of the primary hematoma, or because the mechanical loading ruptured the newly forming microvasculature, which resulted in a secondary hematoma. We also found that loading activates a strong periosteal response near the defect rim resulting in enhanced cellular proliferation and cartilage formation, even at relatively low tensile strain (50–100 με). Cartilage and fibrocartilage formation ultimately delays healing of the defect as evidenced by persistence of a large woven bone regenerate two weeks after surgery when control regenerates have already undergone substantial remodeling. These data are consistent with other studies reporting that loading immediately after fracture inhibits vascular invasion and bone formation [8], and activates greater cartilage formation [12]. Whether vascular disruption or the presence of cartilage inhibits bone formation in unclear, though both hypoxia [21] and cartilage-specific anti-angiogenic factors [32–34] have been shown to favor chondrogenesis.
Loading during the matrix deposition stage (PSD 5 to 8), when the regenerate has bridged the defect, leads to a significant increase in bone formation by PSD 10, a result consistent with reports showing that loading during osteogenesis enhances bone formation [13]. A concomitant remodeling of the vasculature and larger vessels were also reported, which may be interpreted to mean that a more mature vascular bed and larger vessels allow for greater ingress of progenitors, thereby enhancing tissue formation and healing. Enhanced cellular proliferation and cartilage formation was observed with this loading regimen suggesting that resident osteochondroprogenitors, even at this later stage of healing, can be activated to proliferate and/or differentiate. Loading during the remodeling phase (PSD 10 to 14) lead to increased cellular proliferation throughout the regenerate, but not cartilage formation, suggesting that osteochondroprogenitors may have been fewer in number and that the stiffer matrix resisted deformation.
FEA showed that a monocortical defect in the mouse tibia acts as a stress concentrator resulting in high strains at the anterior and posterior defect edges and low strains at the proximal and distal defect edges. Histological assessment showed that periosteal surfaces adjacent to the proximal and distal edges of the defect, which experienced ~50–100 με, coincided with areas of exuberant chondrogenic differentiation in a model that typically heals through intramembranous bone formation [20]. These strain values fall at the low end of a range of values (300 to 24,000 με) reported to enhance cartilage formation at an injury site [9,12,13,17,35,36]. The chondrogenic response of the periosteum to low strain values may be due to its proximity to the local infammatory environment, which is a known regulator of stem cell function [37], and the proximity of the affected periosteal sheath to the defect and inflammatory environment may have sensitized periosteal resident progenitors to mechanical stimulation by altering gene expression and cell behavior. Additional work is required to understand the relationship between pro-inflammatory cytokines and stemness in the context of fracture repair and loading.
Even though a significant increase in bone volume was detected by aniline blue staining in bones loaded at PSD 5 to 8 relative to controls, this difference was not observed with longitudinal microCT analyses. One possible explanation is the heterogeneous nature of the regenerate with regard to structure and varying degrees of mineralization, and the challenge it presents with regard to thresholding and partial volume effects. In this sense, histological analyses provide an important complementary assessment of microCT outcomes, and both should be presented when possible. Movement artifacts may also have contributed to data variability.
A variety of in vivo models and computational analyses have been implemented to study mechanobiology of bone adaptation [22–25,38,39] and repair [8,14,28,29]. Of these, murine bone injury models are particularly attractive given their relatively low cost and the ability to genetically engineer transgenic and targeted knockout mouse lines, allowing study of molecular mechanisms governing bone repair. In this study we utilized an in vivo murine tibial loading model that is well characterized and widely used to study mechanical adaptation of bone [22,24,38,40]. In this regard, the model easily accommodates a variety of user-defined loading regimens that can be applied during distinct stages of defect healing. One key advantage of this model is the ability to correlate spatial strain distribution in response to loading with distinct tissue formation in the context of repair. Furthermore, the effects of a wide range of variables (load magnitude, cycle number, frequency, and latency period) on repair are testable using this model. Finally, its technical simplicity (reproducibility of the defect, does not require stabilization, permits normal ambulation immediately after surgery, confers minimal risk of failure post-surgery, is void of radio-opaque hardware permitting in vivo longitudinal skeletal imaging) makes it highly accessible. This model allows the study of distinct bone envelopes in response to controlled mechanical loading in an injury setting. In addition, the inhomogeneity in strain due to the asymmetry of the mouse tibia will be advantageous for evaluating the influence of a range of load-induced stress and strain values on bone repair.
One limitation with the presented model is, as a stable cortical bone repair model, the complexity of a full fracture environment is not realized; however, we believe this limitation is outweighed by the ability to apply controlled and highly reproducible loading protocols as well as simplifying development of FE models given the continuous cortical shell. A second limitation is that the CT-based FE analysis does not incorporate the contribution of the regenerate or bone marrow to the overall mechanical environment, particularly at later stages of healing when the regenerate begins to stiffen. These aspects of the model will be addressed in future work. A third limitation is that our FE models predict bone strain rather than strain in the periosteum. We took this approach given the unknowns about the behavior of the periosteum (e.g., mechanical properties of the periosteum, and the nature and mechanical behavior of the interface between periosteum and cortical bone) and our limited ability to experimentally measure strain in the periosteum. Thus, our ruling assumption is that bone strain dictates the amount of strain experienced by the periosteum, though this was not directly measured. Strain in the periosteum is an important consideration given it contains osteochondroprogenitors that serve as the effectors of repair [41] and are sensitive to mechanical signals [42].
In summary, our findings suggest that early loading disrupts the injury site and pushes periosteal-resident osteochondroprogenitors into a cartilage phenotype while loading during the bone matrix formation phase pushes progenitors into a bone phenotype. Due to its technical simplicity and spatially confined repair process, the described mechanobiological model may offer advantages for studying distinct bone envelopes in response to precisely controlled mechanical loading regimens in the absence of hardware fixation.
Supplementary Material
Acknowledgements
Funding:
This work was supported by the AO Foundation Award S-13-57C (ABC); and the Department of Veterans Affairs Career Development Award-II A6842W (ABC) and Merit Review Award I01RX001500 (ABC).
Footnotes
Competing Financial Interests
The authors declare no competing financial interests.
References
- [1].Baker AH, Non-Union in Fractures, Ulster Med J. 3 (1934) 277–283. [PMC free article] [PubMed] [Google Scholar]
- [2].Goodship AE, Kenwright J, The influence of induced micromovement upon the healing of experimental tibial fractures, J Bone Joint Surg Br. 67 (1985) 650–655. [DOI] [PubMed] [Google Scholar]
- [3].Goodship AE, Cunningham JL, Kenwright J, Strain rate and timing of stimulation in mechanical modulation of fracture healing, 355S (1998) S105–15. doi: 10.1097/00003086-199810001-00012. [DOI] [PubMed] [Google Scholar]
- [4].Klein P, Schell H, Streitparth F, Heller M, Kassi J-P, Kandziora F, et al. , The initial phase of fracture healing is specifically sensitive to mechanical conditions, J. Orthop. Res 21 (2003) 662–669. doi: 10.1016/S0736-0266(02)00259-0. [DOI] [PubMed] [Google Scholar]
- [5].Carter DR, Blenman PR, Beaupré GS, Correlations between mechanical stress history and tissue differentiation in initial fracture healing, J. Orthop. Res 6 (1988) 736–748. doi: 10.1002/jor.1100060517. [DOI] [PubMed] [Google Scholar]
- [6].Claes LE, Heigele CA, Neidlinger-Wilke C, Kaspar D, Seidl W, Margevicius KJ, et al. , Effects of mechanical factors on the fracture healing process, Clin. Orthop. Relat. Res (1998) S132–47. [DOI] [PubMed] [Google Scholar]
- [7].Brumback RJ, Toal TR, Murphy-Zane MS, Novak VP, Belkoff SM, Immediate weight-bearing after treatment of a comminuted fracture of the femoral shaft with a statically locked intramedullary nail, J Bone Joint Surg Am. 81 (1999) 1538–1544. [DOI] [PubMed] [Google Scholar]
- [8].Gardner MJ, van der Meulen MCH, Demetrakopoulos D, Wright TM, Myers ER, Bostrom MP, In vivo cyclic axial compression affects bone healing in the mouse tibia, 24 (2006) 1679–1686. doi: 10.1002/jor.20230. [DOI] [PMC free article] [PubMed] [Google Scholar]
- [9].Palomares KTS, Gleason RE, Mason ZD, Cullinane DM, Einhorn TA, Gerstenfeld LC, et al. , Mechanical stimulation alters tissue differentiation and molecular expression during bone healing, 27 (2009) 1123–1132. doi: 10.1002/jor.20863. [DOI] [PMC free article] [PubMed] [Google Scholar]
- [10].Morgan EF, Salisbury Palomares KT, Gleason RE, Bellin DL, Chien KB, Unnikrishnan GU, et al. , Correlations between local strains and tissue phenotypes in an experimental model of skeletal healing, J Biomech. 43 (2010) 2418–2424. doi: 10.1016/j.jbiomech.2010.04.019. [DOI] [PMC free article] [PubMed] [Google Scholar]
- [11].Miller GJ, Gerstenfeld LC, Morgan EF, Mechanical microenvironments and protein expression associated with formation of different skeletal tissues during bone healing, Biomech Model Mechanobiol. 14 (2015) 1239–1253. doi: 10.1007/s10237-015-0670-4. [DOI] [PMC free article] [PubMed] [Google Scholar]
- [12].Boerckel JD, Kolambkar YM, Stevens HY, Lin ASP, Dupont KM, Guldberg RE, Effects of in vivo mechanical loading on large bone defect regeneration, J. Orthop. Res 30 (2012) 1067–1075. doi: 10.1002/jor.22042. [DOI] [PMC free article] [PubMed] [Google Scholar]
- [13].Boerckel JD, Uhrig BA, Willett NJ, Huebsch N, Guldberg RE, Mechanical regulation of vascular growth and tissue regeneration in vivo, Proc. Natl. Acad. Sci. U.S.a 108 (2011) E674–80. doi: 10.1073/pnas.1107019108. [DOI] [PMC free article] [PubMed] [Google Scholar]
- [14].Boerckel JD, Dupont KM, Kolambkar YM, Lin ASP, Guldberg RE, In vivo model for evaluating the effects of mechanical stimulation on tissue-engineered bone repair, J Biomech Eng. 131 (2009) 084502. doi: 10.1115/1.3148472. [DOI] [PubMed] [Google Scholar]
- [15].Wawrzynski J, Gil JA, Goodman AD, Waryasz GR, Hypersensitivity to Orthopedic Implants: A Review of the Literature, Rheumatol Ther. 4 (2017) 45–56. doi: 10.1007/s40744-017-0062-6. [DOI] [PMC free article] [PubMed] [Google Scholar]
- [16].Zimmerli W, Clinical presentation and treatment of orthopaedic implant-associated infection, J Intern Med. 276 (2014) 111–119. doi: 10.1111/joim.12233. [DOI] [PubMed] [Google Scholar]
- [17].Gardner MJ, Putnam SM, Wong A, Streubel PN, Kotiya A, Silva MJ, Differential fracture healing resulting from fixation stiffness variability: a mouse model, J Orthop Sci. 16 (2011) 298–303. doi: 10.1007/s00776-011-0051-5. [DOI] [PMC free article] [PubMed] [Google Scholar]
- [18].Gómez-Benito MJ, García-Aznar JM, Kuiper JH, Doblaré M, A 3D computational simulation of fracture callus formation: influence of the stiffness of the external fixator, J Biomech Eng. 128 (2006) 290–299. doi: 10.1115/1.2187045. [DOI] [PubMed] [Google Scholar]
- [19].Wehner T, Claes L, Niemeyer F, Nolte D, Simon U, Influence of the fixation stability on the healing time--a numerical study of a patient-specific fracture healing process, Clin Biomech (Bristol, Avon). 25 (2010) 606–612. doi: 10.1016/j.clinbiomech.2010.03.003. [DOI] [PubMed] [Google Scholar]
- [20].Campbell TM, Wong WT, Mackie EJ, Establishment of a model of cortical bone repair in mice, Calcified Tissue International. 73 (2003) 49–55. doi: 10.1007/s00223-002-2120-4. [DOI] [PubMed] [Google Scholar]
- [21].Kim J-B, Leucht P, Lam K, Luppen C, Ten Berge D, Nusse R, et al. , Bone regeneration is regulated by wnt signaling, J Bone Miner Res. 22 (2007) 1913–1923. doi: 10.1359/jbmr.070802. [DOI] [PubMed] [Google Scholar]
- [22].De Souza RL, Matsuura M, Eckstein F, Rawlinson SCF, Lanyon LE, Pitsillides AA, Non-invasive axial loading of mouse tibiae increases cortical bone formation and modifies trabecular organization: a new model to study cortical and cancellous compartments in a single loaded element, Bone. 37 (2005) 810–818. doi: 10.1016/j.bone.2005.07.022. [DOI] [PubMed] [Google Scholar]
- [23].Fritton JC, Myers ER, MYERS E, Wright TM, et al. , Loading induces site-specific increases in mineral content assessed by microcomputed tomography of the mouse tibia, Bone. 36 (2005) 1030–1038. doi: 10.1016/j.bone.2005.02.013. [DOI] [PubMed] [Google Scholar]
- [24].Weatherholt AM, Fuchs RK, Warden SJ, Cortical and trabecular bone adaptation to incremental load magnitudes using the mouse tibial axial compression loading model, Bone. 52 (2013) 372–379. doi: 10.1016/j.bone.2012.10.026. [DOI] [PMC free article] [PubMed] [Google Scholar]
- [25].Yang H, Butz KD, Duffy D, Niebur GL, Nauman EA, Main RP, Characterization of cancellous and cortical bone strain in the in vivo mouse tibial loading model using microCT-based finite element analysis, Bone. 66 (2014) 131–139. doi: 10.1016/j.bone.2014.05.019. [DOI] [PubMed] [Google Scholar]
- [26].Schriefer JL, Robling AG, Warden SJ, Fournier AJ, Mason JJ, Turner CH, A comparison of mechanical properties derived from multiple skeletal sites in mice, J Biomech. 38 (2005) 467–475. doi: 10.1016/j.jbiomech.2004.04.020. [DOI] [PubMed] [Google Scholar]
- [27].Bouxsein ML, Boyd SK, Christiansen BA, Guldberg RE, Jepsen KJ, Müller R, Guidelines for assessment of bone microstructure in rodents using micro-computed tomography, J Bone Miner Res. 25 (2010) 1468–1486. doi: 10.1002/jbmr.141. [DOI] [PubMed] [Google Scholar]
- [28].Leucht P, Kim J-B, Wazen R, Currey JA, Nanci A, Brunski JB, et al. , Effect of mechanical stimuli on skeletal regeneration around implants, Bone. 40 (2007) 919–930. doi: 10.1016/j.bone.2006.10.027. [DOI] [PMC free article] [PubMed] [Google Scholar]
- [29].Lacroix D, Prendergast PJ, Li G, Marsh D, Biomechanical model to simulate tissue differentiation and bone regeneration: application to fracture healing, Med Biol Eng Comput. 40 (2002) 14–21. doi: 10.1007/bf02347690. [DOI] [PubMed] [Google Scholar]
- [30].McGarry JG, Klein-Nulend J, Mullender MG, Prendergast PJ, A comparison of strain and fluid shear stress in stimulating bone cell responses--a computational and experimental study, Faseb J. 19 (2005) 482–484. doi: 10.1096/fj.04-2210fje. [DOI] [PubMed] [Google Scholar]
- [31].Carter DR, Beaupré GS, Giori NJ, Helms JA, Mechanobiology of skeletal regeneration, Clin. Orthop. Relat. Res 355S (1998) S41–55. doi: 10.1097/00003086-199810001-00006. [DOI] [PubMed] [Google Scholar]
- [32].Caplan AI, Cartilage, Scientific American. 251 (1984) 84–&. [DOI] [PubMed] [Google Scholar]
- [33].Moses MA, Sudhalter J, Langer R, Identification of an Inhibitor of Neovascularization From Cartilage, Science. 248 (1990) 1408–1410. [DOI] [PubMed] [Google Scholar]
- [34].Moses MA, Wiederschain D, Wu IM, Fernandez CA, Ghazizadeh V, Lane WS, et al. , Troponin I is present in human cartilage and inhibits angiogenesis, Proceedings of the National Academy of Sciences. 96 (1999) 2645–2650. [DOI] [PMC free article] [PubMed] [Google Scholar]
- [35].Leucht P, Kim J-B, Currey JA, Brunski J, Helms JA, FAK-Mediated mechanotransduction in skeletal regeneration, PLoS ONE. 2 (2007) e390. doi: 10.1371/journal.pone.0000390. [DOI] [PMC free article] [PubMed] [Google Scholar]
- [36].Wazen RM, Currey JA, Guo H, Brunski JB, Helms JA, Nanci A, Micromotion-induced strain fields influence early stages of repair at bone-implant interfaces, Acta Biomater. 9 (2013) 6663–6674. doi: 10.1016/j.actbio.2013.01.014. [DOI] [PMC free article] [PubMed] [Google Scholar]
- [37].Zhang X, Schwarz EM, Young DA, Puzas JE, Rosier RN, O’Keefe RJ, Cyclooxygenase-2 regulates mesenchymal cell differentiation into the osteoblast lineage and is critically involved in bone repair, Journal of Clinical Investigation. 109 (2002) 1405–1415. doi: 10.1172/JCI15681. [DOI] [PMC free article] [PubMed] [Google Scholar]
- [38].Patel TK, Brodt MD, Silva MJ, Experimental and finite element analysis of strains induced by axial tibial compression in young-adult and old female C57Bl/6 mice, J Biomech. 47 (2014) 451–457. doi: 10.1016/j.jbiomech.2013.10.052. [DOI] [PMC free article] [PubMed] [Google Scholar]
- [39].Webster DJ, Morley PL, van Lenthe GH, Müller R, A novel in vivo mouse model for mechanically stimulated bone adaptation--a combined experimental and computational validation study, Comput Methods Biomech Biomed Engin. 11 (2008) 435–441. doi: 10.1080/10255840802078014. [DOI] [PubMed] [Google Scholar]
- [40].Lynch ME, Main RP, Xu Q, Schmicker TL, Schaffler MB, Wright TM, et al. , Tibial compression is anabolic in the adult mouse skeleton despite reduced responsiveness with aging, Bone. 49 (2011) 439–446. doi: 10.1016/j.bone.2011.05.017. [DOI] [PMC free article] [PubMed] [Google Scholar]
- [41].Colnot C, Skeletal cell fate decisions within periosteum and bone marrow during bone regeneration, J. Bone Miner. Res 24 (2009) 274–282. doi: 10.1359/jbmr.081003. [DOI] [PMC free article] [PubMed] [Google Scholar]
- [42].McBride SH, Dolejs S, Brianza S, Knothe U, Knothe Tate ML, Net change in periosteal strain during stance shift loading after surgery correlates to rapid de novo bone generation in critically sized defects, Ann Biomed Eng. 39 (2011) 1570–1581. doi: 10.1007/s10439-010-0242-9. [DOI] [PMC free article] [PubMed] [Google Scholar]
Associated Data
This section collects any data citations, data availability statements, or supplementary materials included in this article.