


Abstract
In 2017, we released GEPIA (Gene Expression Profiling Interactive Analysis) webserver to facilitate the widely used analyses based on the bulk gene expression datasets in the TCGA and the GTEx projects, providing the biologists and clinicians with a handy tool to perform comprehensive and complex data mining tasks. Recently, the deconvolution tools have led to revolutionary trends to resolve bulk RNA datasets at cell type-level resolution, interrogating the characteristics of different cell types in cancer and controlled cohorts became an important strategy to investigate the biological questions. Thus, we present GEPIA2021, a standalone extension of GEPIA, allowing users to perform multiple interactive analysis based on the deconvolution results, including cell type-level proportion comparison, correlation analysis, differential expression, and survival analysis. With GEPIA2021, experimental biologists could easily explore the large TCGA and GTEx datasets and validate their hypotheses in an enhanced resolution. GEPIA2021 is publicly accessible at http://gepia2021.cancer-pku.cn/.
Graphical Abstract
Graphical Abstract.
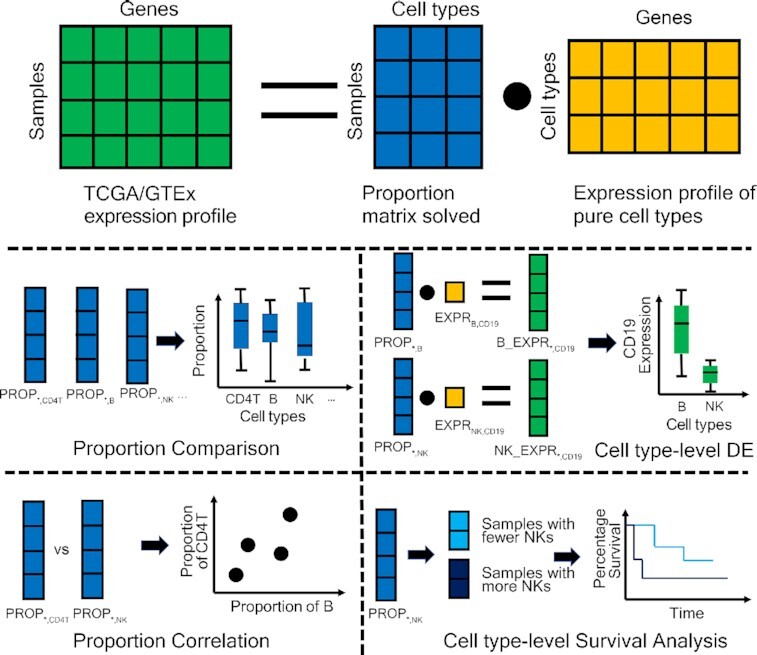
GEPIA2021 applied CIBERSORT/EPIC/quanTIseq to deconvolute the TCGA/GTEx bulk samples with the gene signature matrix of multiple cell types. Based on the cell proportions inferred, users can perform further analysis such as proportion comparison, proportion correlation, cell type-level differential expression and survival analysis.
INTRODUCTION
The TCGA (1) and the GTEx (2) projects have produced tremendous expression data for researchers to investigate the expression profiles across cancer and healthy patient cohorts. GEPIA series tools (3,4) leveraged the expression data and clinical data to enable the biologists to interrogate the important genes, such as the prognosis-related biomarkers (5), cancer-specific non-coding RNA (6) and the expression profile of the COVID-19 related gene ACE2 (7).
The natural deficiency in the resolution of bulk-RNA data limits the usage to a certain extent, that is, one cannot directly obtain the cell type-level information, such as the proportion and gene expression in each cell type. Recently, accumulated single cell sequencing data enabled researchers to analyze gene expression profiles at cell type-level. However, the costs of traditional single cell sequencing technologies limit their applications in screening the cell-type expression profiles across thousands of samples. Meanwhile, the relationship of the patient prognosis and cell type characteristics also cannot be analyzed due to the missing clinical follow-up data. Fortunately, the bulk expression data in the TCGA and GTEx provided us with the opportunity to analyze the cell types in these strategies.
Using the deconvolution tools CIBERSORT (8), EPIC (9) and quanTIseq (10) for accurately estimating the cell proportion by the gene signature matrix of multiple cell types, we can obtain the absolute cell proportions in each bulk sample. Specifically, with the deconvolution strategy, the cell type information with clinical data would be unleash for interrogating the relationship of the cell proportion and the prognosis. Based on the deconvolution result, users will be able to select which tool to use, compare the proportions of different cell types, calculate and compare the gene expression in bulk samples contributed by different cell types, and perform the survival analysis between two sample groups with different proportion of a certain cell type. Furthermore, compared to GEPIA1/2 which applied the static pictures for data visualization, GEPIA2021 enhanced the user experience by using interactive plots including boxplots, scatter plots and Kaplan–Meier survival plots, in which the key statistics are dynamically calculated and displayed.
MATERIALS AND METHODS
Data collecting and pre-processing
We downloaded tcga_RSEM_gene_tpm and gtex_RSEM_gene_tpm datasets from UCSC Xena project (11) as the input for each of the three deconvolution tools. The codes for pre-processing are included in the AVAILABILITY section.
Bulk data deconvolution
If we have R as the reference expression matrix of n genes and c cell types, the expression profile in a mixture M can be modeled by the deconvolution tool as M = R·P, where P is the proportion of c cell types in this mixture. This can be written as following:
 |
(1) |
For each GTEx/TCGA sample, we run CIBERSORT (absolute mode), EPIC or quanTIseq with the default parameters to obtain the absolute proportions of 22, 7 or 10 cell types, respectively. Multiple machine-learning regression algorithm were used to approximately deconvolute the mixtures because the number of equations (genes used) is even greater than the number of variables (cell types in the reference), as shown in formula (1). The feature selection procedure was applied by all three tools, where only the expression profile of s signature genes (s << n) was extracted from the complete reference matrix and then applied to estimate P in a more robust way:
 |
(2) |
As  (k = 1,2,…,c) is the absolute proportion, it is comparable in an intra-sample (same sample with different cell types) or inter-sample (same cell type with different samples) manner (8,10).
Sub-expression calculation
According to formula (1), the expression of gene j (j = 1,2,…,n) of the mixture M can be written as:
 |
(3) |
After obtaining P, then we define and calculate the ‘sub-expression’ as the gene j expression in the mixture M contributed by the cell type k as following:
 |
(4) |
Thus, the formula (3) can be re-written as:
 |
(5) |
With the given gene j,  (k = 1,2,…,c) is also comparable in an intra-sample manner like
  .
.
Survival analysis
We applied the python package lifelines (https://github.com/CamDavidsonPilon/lifelines) for the survival analysis, including fitting the Kaplan–Meier curve, calculating its 95% confidence interval and comparing two K-M curves with log-rank test.
Webserver architecture
The graphic abstract of the GEPIA2021 architecture is shown in Figure 1. We applied the MogoDB (https://www.mongodb.com/) database to store the processed TCGA/GTEx expression datasets, the deconvolution results and the TCGA clinical data migrated from the GEPIA1/2 database. The server-side software Apache2 (https://httpd.apache.org/) and Django (https://www.djangoproject.com/) were used to handle custom requests from users. Based on the frontend architecture of GEPIA1/2 (HTML5 + CSS3 + JavaScript), we enhanced the interactive interface by utilizing the plotly.js (https://plotly.com/javascript/) package for drawing dynamic plots where users can see detailed statistics by mouseover, zoom-in/out, hide/show sub-plots or save the currently modified plot into a PNG file.
Figure 1.
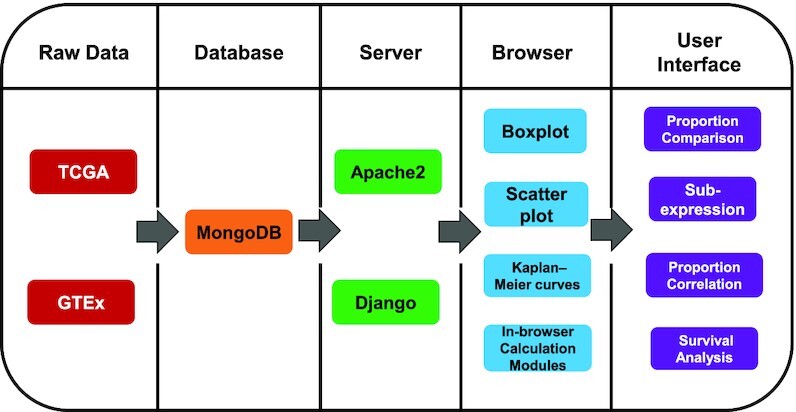
Schema describing the overall architecture of GEPIA2021.
RESULTS
Cell proportion comparison
This function (Figure 2A) allows users to filter samples in the sub-datasets (tissues from GTEx or cancer types from TCGA) they selected, and filter the cell types of interest. Then the interactive boxplot grouped by cell types and sub-datasets will be displayed. In addition, we also provide the re-normalization option for each sample. For example, users can visualize and compare the B cell proportion against all immune cells rather than against all cells in bulk samples, to obtain the relative cell type proportion.
Figure 2.

Examples of GEPIA2021 outputs. (A) Users can filter samples in the TCGA/GTEx sub-datasets they selected, visualize and compare the proportions of selected cell types by the interactive boxplot along with the in-browser ANOVA module. (B) By selecting two cell types, users can perform the correlation analysis with the interactive scatter plot. Samples from different TCGA/GTEx sub-datasets are colored differently. The Pearson Correlation Coefficient between the proportions of the two cell types are shown in the title. (C) Based on the pure cell proportions inferred and the gene expression in the reference, users can visualize and compare the gene expression contributed by different cell types in each TCGA/GTEx sample. The interactive boxplot with the ANOVA module is also available. (D) By splitting the samples according to the cell type proportion into two groups, users can perform the survival analysis with the log-rank test between their corresponding Kaplan-Meier curves. The 95% confidence interval is plotted by the dotted lines and the right censored samples are represented with the cross mark.
Furthermore, ANOVA (analysis of variance) module has been integrated into the boxplot, allowing users to have a quantitative comparison of the cell proportions or sub-expressions. This functionality also shows the F-statistic and the significance (p-value) for each group of boxplots, and users can change their filtering conditions of sub-datasets and cell types to obtain customized results.
Cell proportion correlation analysis
This function (Figure 2B) allows users to keep samples in the sub-datasets, and select two cell types of interest to perform the correlation analysis across bulk samples. The interactive scatter plot will be shown, with cell proportion information from different sub-datasets in different colors. In addition, the PCC (Pearson correlation coefficient) calculation module has been integrated into the scatter plot.
Cell type-level differential expression
This function enables users to visualize and compare the sub-expression in a dynamical and interactive manner, along with the in-browser ANOVA module. For example, users can filter all stomach samples (TCGA tumor/normal and GTEx normal), input the gene CD3D and visualize the expression contributed by different cell types. In the boxplots, each data point represents one sample in the selected dataset (Figure 2C).
Survival analysis
Users can first choose the range of sub-datasets, and then separate the selected samples kept into two groups, according to the proportion of the cell type selected. For example, based on the proportion of macrophages in each TCGA liver cancer sample, we can divide the samples into a macrophages-proportion-high group and a macrophages-proportion-low group. Then two Kaplan–Meier curves of both groups will be available, along with their confidential intervals, respectively. Additionally, we also provide the quantitative measurement, log-rank test, to test whether the two Kaplan–Meier curves are statistically different (Figure 2D).
DISCUSSIONS
We have developed multiple useful functionalities for GTEx/TCGA expression data analysis in GEPIA1, and released the GEPIA2 upgraded version with the novel modules, such as isoform-level analysis and cancer subtype analysis. Up to date, GEPIA + GEPIA2 have been cited for 2871 + 368 times according to Google Scholar (GEPIA as the most-cited in 2017 NAR webserver issue), and have totally processed ∼1 300 000 analysis requests for ∼300 000 users worldwide according to Google Analytics. The key feature of GEPIA series is to provide the users with the convenient, comprehensive and interactive analysis functionalities for tumor and normal samples from TCGA and GTEx. Based on the feedbacks and suggestions, we then decided to develop GEPIA2021 to expand the strategy to cell type-level analysis for tumor and normal samples. Although there is the very functional TIMER2.0 (13) as the platform for TCGA deconvolution analysis, there are still strong but unmet needs from users on the tumor-normal comparison and other practical functionalities such as the differential analysis in the cell type level. In addition to facilitating the analysis modules for bulk data in the cell type-level, the interactive plots in GEPIA2021 would further improve the user experience. For example, users can not only inspect the key parameters in the boxplots such as upper quantile, but also obtain the percentage survival in any given time in the Kaplan–Meier curves. With the extending functions and characteristics, we believe GEPIA series would be more powerful for the expression data analysis and visualization.
We included 3 different deconvolution tools in GEPIA2021 to meet a variety of user needs, here we compare the key features of the three tools (Table 1) in order to provide a guidance for selecting the best tool under different scenarios. CIBERSORT is recommended when users want to investigate the immune cell types with high resolution (providing cell sub-types such as T.cells.CD4.memory.activated). EPIC provides the reference with two non-immune cell types but the least immune cell types. The strategies to estimate the absolute proportion of all three tools are basically similar. For example, CIBERSORT estimates the proportion of each cell type against the total immune cell content first, and then estimates the immune cell content in the mixture by the median gene expression of the s signature genes (in formula 2) against the median of all genes, based on the assumption that the signature gene expression cannot be contributed by other cell types beyond the reference. Notably, the absolute proportion output is natively supported by EPIC and quanTIseq, while the absolute_mode in CIBERSORT is still a beta version. The numbers of genes available for sub-expression analysis differ in three tools, which depend on the references provided by the tools. According to the publications of the 3 tools, CIBERSORT was designed for multiple types of tissues, while EPIC and quanTIseq were orginally designed for tumor samples. Therefore, we would recommend CIBERSORT as the first choice for the tumor-normal comparison. However, as all three tools were extensively validated on normal blood and tumor samples, there is still potential applicability for the usage of EPIC/quanTIseq on the blood cell deconvolution on GTEx samples. In addition, EPIC/quanTIseq also achieved high performance in a comprehensive evaluation study (12).
Table 1.
The comparison of different tools used in GEPIA2021
| CIBERSORT | EPIC | quanTIseq | |
|---|---|---|---|
| Key algorithm | Support Vector Regression | Constrained weighted least square regression | Constrained Least Squares Regression |
| Cell types in the default reference | 22 immune cell sub-types | 5 immune cell types, epithelia and fibroblasts | 10 immune cell types |
| Number of signature genes used | 547 | 98 | 170 |
| Ability to output absolute proportions | Yes (beta version) | Yes | Yes |
| Number of genes available for sub-expression analysis | 11 277 | 21 756 | 18 839 |
| Applicability | No limitation | Designed For tumor samples and validated on normal blood and tumor samples | Designed For tumor samples and validated on normal blood and tumor samples |
DATA AVAILABILITY
GEPIA2021 is publicly accessible at http://gepia2021.cancer-pku.cn/. The codes for bulk data deconvolution are accessible at https://github.com/zwj-tina/GEPIA2021.
Supplementary Material
ACKNOWLEDGEMENTS
We thank National Teaching Center for Experimental Biology, Peking University and the Computing Platform of the CLS (Peking University).
Author contributions: F.L. supervised this study; C.L. and Z.T. designed the analysis modules and the user interface; C.L. and W.Z., implemented the frontend and backend software; C.L., Z.T., Z.Y. and F.L. wrote the manuscript.
Contributor Information
Chenwei Li, School of Life Sciences, BIOPIC and Peking-Tsinghua Center for Life Sciences, Peking University, Beijing, China; Analytical Biosciences Limited, Beijing, China.
Zefang Tang, IBM China Research Lab, Beijing, China.
Wenjie Zhang, School of Life Sciences, Peking University, Beijing, China.
Zhaochen Ye, School of Life Sciences, Peking University, Beijing, China.
Fenglin Liu, School of Life Sciences, Peking University, Beijing, China.
SUPPLEMENTARY DATA
Supplementary Data are available at NAR Online.
FUNDING
National Teaching Center for Experimental Biology, Peking University. Funding for open access charge: National Teaching Center for Experimental Biology, Peking University.
Conflict of interest statement. C. Li is an intern of Analytical Biosciences Limited. Z. Tang is an employee of IBM Research China Lab. The remaining authors declare no competing interests.
REFERENCES
- 1. Cancer Genome Atlas Research Network Weinstein J.N., Collisson E.A., Mills G.B., Shaw K.R.M., Ozenberger B.A., Ellrott K., Shmulevich I., Sander C., Stuart J.M.. The Cancer Genome Atlas Pan-Cancer analysis project. Nat. Genet. 2013; 45:1113–1120. [DOI] [PMC free article] [PubMed] [Google Scholar]
- 2. Lonsdale J., Thomas J., Salvatore M., Phillips R., Lo E., Shad S., Hasz R., Walters G., Garcia F., Young N.et al.. The Genotype-Tissue Expression (GTEx) project. Nat. Genet. 2013; 45:580–585. [DOI] [PMC free article] [PubMed] [Google Scholar]
- 3. Tang Z., Li C., Kang B., Gao G., Li C., Zhang Z.. GEPIA: a web server for cancer and normal gene expression profiling and interactive analyses. Nucleic Acids Res. 2017; 45:W98–W102. [DOI] [PMC free article] [PubMed] [Google Scholar]
- 4. Tang Z., Kang B., Li C., Chen T., Zhang Z.. GEPIA2: an enhanced web server for large-scale expression profiling and interactive analysis. Nucleic Acids Res. 2019; 47:W556–W560. [DOI] [PMC free article] [PubMed] [Google Scholar]
- 5. Pan J., Zhou H., Cooper L., Huang J., Zhu S., Zhao X., Ding H., Pan Y., Rong L.. LAYN is a prognostic biomarker and correlated with immune infiltrates in gastric and colon cancers. Front. Immunol. 2019; 10:6. [DOI] [PMC free article] [PubMed] [Google Scholar]
- 6. Wu X., Zhang P., Zhu H., Li S., Chen X., Shi L.. Long noncoding RNA FEZF1-AS1 indicates a poor prognosis of gastric cancer and promotes tumorigenesis via activation of Wnt signaling pathway. Biomed. Pharmacother. 2017; 96:1103–1108. [DOI] [PubMed] [Google Scholar]
- 7. Cheng H., Wang Y., Wang G.. Organ-protective effect of angiotensin-converting enzyme 2 and its effect on the prognosis of COVID-19. J. Med. Virol. 2020; 92:726–730. [DOI] [PMC free article] [PubMed] [Google Scholar]
- 8. Newman A.M., Liu C.L., Green M.R., Gentles A.J., Feng W., Xu Y., Hoang C.D., Diehn M., Alizadeh A.A.. Robust enumeration of cell subsets from tissue expression profiles. Nat. Methods. 2015; 12:453–457. [DOI] [PMC free article] [PubMed] [Google Scholar]
- 9. Racle J., de Jonge K., Baumgaertner P., Speiser D.E.. Simultaneous enumeration of cancer and immune cell types from bulk tumor gene expression data. eLife. 2017; 6:e26476. [DOI] [PMC free article] [PubMed] [Google Scholar]
- 10. Finotello F., Mayer C., Plattner C., Laschober G., Rieder D., Hackl H., Krogsdam A., Loncova Z., Posch W., Wilflingseder D.et al.. Molecular and pharmacological modulators of the tumor immune contexture revealed by deconvolution of RNA-seq data. Genome Med. 2019; 11:34. [DOI] [PMC free article] [PubMed] [Google Scholar]
- 11. Goldman M.J., Craft B., Hastie M., Repečka K., McDade F., Kamath A., Banerjee A., Luo Y., Rogers D., Brooks A.N.et al.. Visualizing and interpreting cancer genomics data via the Xena platform. Nat. Biotechnol. 2020; 38:675–678. [DOI] [PMC free article] [PubMed] [Google Scholar]
- 12. Sturm G., Finotello F., Petitprez F., Zhang J.D., Baumbach J., Fridman W.H., List M., Aneichyk T.. Comprehensive evaluation of transcriptome-based cell-type quantification methods for immuno-oncology. Bioinformatics. 2019; 35:i436–i445. [DOI] [PMC free article] [PubMed] [Google Scholar]
- 13. Li T., Fu J., Zeng Z., Cohen D., Li J., Chen Q., Li B., Liu X.S.. TIMER2.0 for analysis of tumor-infiltrating immune cells. Nucleic Acids Res. 2020; 48:W509–W514. [DOI] [PMC free article] [PubMed] [Google Scholar]
Associated Data
This section collects any data citations, data availability statements, or supplementary materials included in this article.
Supplementary Materials
Data Availability Statement
GEPIA2021 is publicly accessible at http://gepia2021.cancer-pku.cn/. The codes for bulk data deconvolution are accessible at https://github.com/zwj-tina/GEPIA2021.