


Abstract
Alternative splicing results in multiple transcripts of the same gene, possibly encoding for different protein isoforms with different domains. Whereas it is possible to manually determine the effect of alternative splicing on the domain composition for a single event, the process requires the tedious integration of several data sources; it is error prone and not feasible for genome-wide characterization of domains affected by differential splicing. To fulfill the need for an automated solution, we developed the Domain Change Presenter (DoChaP, https://dochap.bgu.ac.il/), a web server for the visualization of exon–domain associations. DoChaP visualizes all transcripts of a given gene, the encoded proteins and their domains, and enables a comparison between the transcripts and between their protein products. The colors and organization make the structural effect of alternative splicing events on protein structures easily identified. To enable the study of the conservation of exons structure, alternative splicing, and the effect of alternative splicing on protein domains, DoChaP also provides a two-species comparison of exon–domain associations. DoChaP thus provides a unique and easy-to-use visualization of the exon–domain association and conservation, and will facilitate the study of the structural effects of alternative splicing in health and disease.
Graphical Abstract
Graphical Abstract.
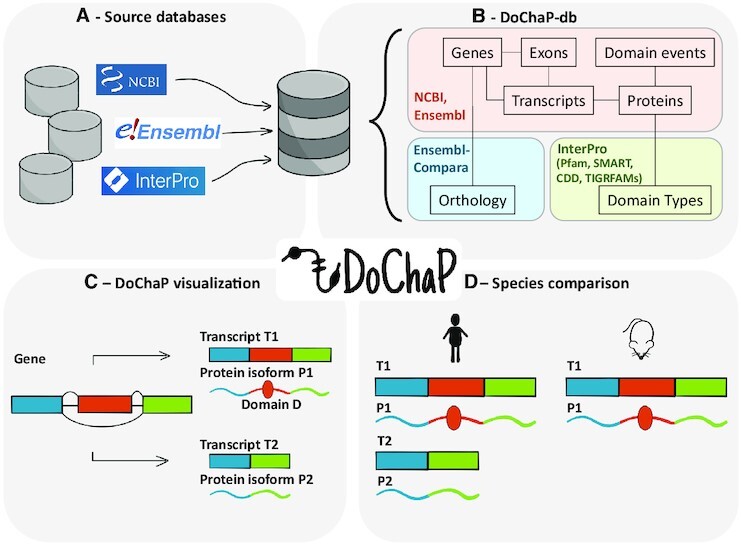
Overview. (A) The DoChaP-database (DoChaP-db) integrates information on transcripts and protein domains from several sources into a single SQLite database. (B) Genes, transcripts, exons, proteins and domain events data was taken from NCBI and Ensembl. Orthology information was taken from Ensembl Compara. Domain types and the mapping of the domain accessions from different sources (Pfam, SMART, CDD and TIGRFAMs) was inferred from InterPro. (C) A simple visualization of the information collected into the DoChaP-db is presented in the DoChaP webserver for a user selected gene. The visualization presents the genomic context of the transcripts (Gene) and the exon structure of the coding region of the mature mRNA of all the transcripts (T1, T2) and their encoded protein domain composition (P1, P2). Exons are represented in different colors, and their encoded protein domains are represented by the corresponding colors. (D) The 'species comparison' feature allows the user to select a gene and a species and visualize the orthologous genes so as to enable a comparison of transcripts and their protein domain organization.
INTRODUCTION
Alternative splicing creates multiple transcripts from a single gene, with the transcripts possibly coding for different protein isoforms, and it therefore increases the functional complexity of the eukaryotic proteome (1–4). Proteins, in turn, are composed of structural domains, each of which may have an independent function (5). Protein domains can be encoded entirely from a single exon or from several consecutive exons. In both cases, alternative splicing can cause either the loss of the domain or a change in the length and composition of the RNA sequence that codes for the amino acids sequence that folds into the domain. Hence, the functionality of the domain or even of the entire protein may be affected by alternative splicing. Indeed, it has previously been reported that alternative splicing changes protein functionality in tissue-specific splicing (6), protein interactions (7), cancer (8,9), resistance to biological therapeutics (10), and the immune response to viral infections (11). The use of high-throughput RNA sequencing (RNA-seq) data to study genome wide alternative and differential splicing is becoming more and more common (12). However, determining the functional implications of alternative splicing at the protein level involves a tedious manual process for each case of alternative splicing.
Manual determination of the effect of alternative splicing on protein domains in a single gene includes the following steps:
Identify the transcripts of the gene (from RefSeq and/or Ensembl).
Find the protein isoforms that are encoded by the identified transcripts (from RefSeq and/or Ensembl).
Predict the domains in each isoform separately (e.g. by Pfam or SMART) or look for the domains of the isoform in databases (e.g., NCBI’s CDD).
Manually compare the type, position, and length of the protein domains found between each pair of isoforms.
For each domain whose properties have changed, translate the positions of the domain in the two protein isoforms into positions in the transcripts, translate positions in the transcripts into genomic positions, and examine which exon(s) of the transcripts that encode the pair of isoforms are in this position and how this(these) exon(s) has(have) changed between the transcripts.
For each domain that is missing in one of the isoforms, translate the position in the protein that carries the domain into the position in the transcript, translate the position in the transcript into the genomic position, and examine which exon is in this position and how this exon has changed between the transcripts.
Furthermore, at present, experimental biologists who are studying specific cases of different functionalities of alternative protein isoforms do not have a tool for exploring the different isoforms of the protein alongside their domains. Currently available domain prediction tools [e.g., SMART (13), Pfam (14), NCBI’s Conserved Domains Database (CDD; 15)], and TIGRFAMs (16)] predict protein domains either from the amino acid sequence of known proteins or from user supplied query sequences. Such tools provide the domains' annotation and visualization for the protein of interest, and some even specify the location of the introns (13), but they only present a single protein isoform (encoded by a single transcript) at a time, regardless of the other known isoforms and their domain compositions. Several database tools have thus attempted to address the problem of studying the effect of alternative splicing on protein domains, e.g. ExDom (17), ProSAS (18) and ASPicDB (19). However, ExDom (17) and ProSAS (18) were built around a decade ago on much smaller source databases, and at present they are down and no longer maintained. ASPicDB (19) is limited to the human genome and does not show the transcript to isoform association or the exon to domain association. Therefore, the gap between the quantity of existing information about the effect of alternative splicing on protein domains and the ability of researchers to visualize this effect remains to be bridged.
To close this gap and thereby to provide researchers with an intuitive visualization of alternative splicing and information on protein domains, we built the Domain Change Presenter (DoChaP) web server. DoChaP provides a user-friendly, simple and intuitive gene-centric visualization of all the transcripts of a gene and the domains that they encode. DoChaP covers five species and presents the genes in their genomic context, alongside their transcripts and protein domains, thereby highlighting potential connections between exons and the protein domains that they encode.
METHODS
Data sources
DoChaP integrates information for transcripts and protein domains from several sources (Table 1) into a single SQLite database. Transcripts of RefSeq (20) and Ensembl (21), gene coding regions (CDSs) and exon annotations were extracted from GFF (general feature format) files, downloaded directly from the ftp sites of NCBI’s Genome (https://ftp.ncbi.nlm.nih.gov/genomes/refseq/) and Ensembl (ftp://ftp.ensembl.org/pub/current_gff3/). Protein information, connections of transcripts to protein isoforms, and domain annotations, descriptions and external identifiers were taken from two sources: (I) RefSeq: GenPept flat files (.gpff), downloaded from NCBI’s RefSeq ftp site (ftp://ftp.ncbi.nih.gov/refseq/{species}/mRNA_Prot/); and (II) Ensembl: BioMart data mining tool (22) (https://m.ensembl.org/biomart/martview/), using xml queries (templates can be found in the GitHub repository).
Table 1.
DoChaP data sources.
| Source | Download path | File/table names | Obtained information |
|---|---|---|---|
| NCBI’s Genomes | https://ftp.ncbi.nlm.nih.gov/genomes/refseq/ | Gff file | RefSeq's transcripts, genes CDS and exons annotations |
| NCBI’s RefSeq | ftp://ftp.ncbi.nih.gov/refseq/{species}/mRNA_Prot/ | All GPFF files per species | RefSeq's proteins and protein domains data |
| Ensembl | ftp://ftp.ensembl.org/pub/current_gff3/ | Gff3 file | Ensembl's transcripts, genes CDS and exons annotations |
| Ensembl | https://m.ensembl.org/biomart/martview/ | Xml query templates are to be found in the GitHub | Ensembl's protein domains data |
| Ensembl | https://m.ensembl.org/biomart/martview/ | Xml query templates are to be found in the GitHub | Ensembl-compara, Orthology information |
| InterPro | https://www.ebi.ac.uk/interpro/entry/InterPro/#table | Entries_table | Connection between domains accession from different sources |
| NCBI’s Gene | ftp://ftp.ncbi.nih.gov/gene/DATA/ | Gene2ensembl | Transition from RefSeq to Ensembl identifiers |
RefSeq and Ensembl use domain predictions from multiple sources, of which DoChaP presents NCBI’s CDD (15), Pfam (14), SMART (13), TIGRFAMs (16) and InterPro (23). Only domains that are associated with an entry of type ‘domain’ or ‘repeat’ (not ‘family’) from InterPro (23) are presented. Also excluded are InterPro domains that are not associated with any of the other domain sources of DoChaP. For DoChaP, the connection between domain accessions from different sources was inferred from InterPro entries that were downloaded directly from InterPro (23) (https://www.ebi.ac.uk/interpro/entry/InterPro/#table). The association between RefSeq and Ensembl accession numbers was taken from the Gene2ensembl table downloaded from NCBI’s Gene ftp site (ftp://ftp.ncbi.nih.gov/gene/DATA/). Orthology data for each pair of species in the DoChaP database was downloaded from Ensembl Compara via the BioMart data mining tool, using xml queries (xml templates can be found in the GitHub repository). For each species, DoChaP uses the latest genome build from RefSeq and Ensembl. In two species, rat and frog, the latest assembly from RefSeq was higher than the one from Ensembl. For those species, only the data from the source with higher version (RefSeq) is used. More detailed description of the data collection method can be found in the Supplementary note.
Database content
The DoChaP database currently includes information for five species: human (Homo sapiens, hg38), mouse (Mus musculus, mm39), rat (Rattus norvegicus, rn7), zebrafish (Danio rerio, danRer11) and frog (Xenopus tropicalis, xenTro10). The database content is detailed in Table 2 (relevant to March 2021), and the database schema is detailed in Supplementary Figure S1.
Table 2.
DoChaP database content for five species (as of February 2021)
| Species | Gene IDs | Transcript- isoform pairs | Unique exons | Protein domain types |
|---|---|---|---|---|
| Homo sapiens (hg38) | 20 272 | 177 531 | 425 709 | 11 167 |
| Mus musculus (mm39) | 23 161 | 157 623 | 390 326 | 10 676 |
| Rattus norvegicus (rn7) a | 22 063 | 74 270 | 275 677 | 7206 |
| Danio rerio (danRer11) | 29 633 | 71 205 | 361 335 | 9831 |
| Xenopus tropicalis (xenTro10) a | 21 683 | 44 877 | 248 980 | 7759 |
| Total | 116 812 | 525 506 | 1 702 027 | 46 639 |
aOnly includes RefSeq data because Ensembl current version is older than RefSeq current version.
Implementation
The DoChaP database was built using Python 3. The Ftplib package (https://docs.python.org/3/library/ftplib.html) was used for downloading from ftp sites. The Bio.SeqIO module of the Biopython (24) package was used for parsing the GFF and GPFF; the pandas (25) package was used for data parsing; and the SQLite3 package (https://docs.python.org/3/library/sqlite3.html) was used for building the database. The DoChaP web server is implemented with an Express.js on the Node.js environment and is distributed via XAMPP. The website is controlled by AngularJS and uses an HTML5 canvas for visualization.
RESULTS
Features and input
The DoChaP web server currently includes two visualization options for the exon–domain relationship. The first option is the ‘single species transcript comparison’ which provides genomic, transcript, and domain composition visualization of all the known RefSeq and Ensembl transcripts of a gene of interest in a specified species. The second visualization option is the ‘species comparison’ which provides the same information for a gene of interest in a selected species and its orthologous gene in one of the other available species.
The search term for DoChaP can be in any of the following formats: gene, transcript or protein identifiers (gene symbol; NCBI’s Gene ID or RefSeq transcript or protein ID; Ensembl gene, transcript or protein ID). In the single species transcript comparison, the species of interest must be specified. In the species comparison feature, the user is required to select a gene and species of interest; DoChaP will then search for all the orthologs of the gene in the other species and allow the user to select which species and ortholog to present. Orthologous genes are taken from Ensembl Compara. As some genes with identical gene symbols from different species are not defined as orthologs in Ensembl Compara (e.g. A2ml1 in human and mouse), comparison of such genes is also enabled in DoChaP.
Graphical visualization
DoChaP provides an intuitive, informative and straight-forward way of exploring the association of exons and domains. In the results page, all the transcripts of the gene of interest are shown with the following elements:
Genomic visualization
The genomic visualization provides the genomic context of the shown transcript, including the loci, strand direction, introns, exons and coding region. Exons are represented in different colors that are consistent across all the transcripts of the gene and through all the visualizations. Information on the start and end positions of the exon and its ordinal number in the transcript may be obtained by mouse hovering on each exon. Each transcript can be manually hidden from the view by clicking the ‘hide transcript’ button (another click will show it). The user can adjust the genomic range shown so as to focus on a specific set of exons. For genes that are coded on the reverse strand, the genomic visualization will be reversed (horizontally flipped), so that, regardless of the coding strand, the location of first exon is the left-most and that of the last exon is the right-most.
Transcript visualization
For each transcript in the genomic visualization, the exon structure of the coding region of the mature mRNA (without the untranslated regions) is provided. Exons are represented in different colors, corresponding to the relevant colors in the genomic visualization and remaining consistent across transcripts. The length and ordinal number of the exon in the transcript are available by mouse hovering over the exon. Transcript RefSeq and/or Ensembl IDs are shown above each transcript. The user can adjust the genomic range displayed so as to focus on a specific set of exons and domains.
Protein composition visualization
Protein domains are shown on a black line below the mRNA exon structure, and are represented as ellipses. The colors and positions of the domains are consistent with the encoding exon/s. Different colors within the same domain indicate that more than one exon codes for the domain (in-domain junction). The domain name is shown below the filled ellipse representing the domain. By mouse hovering over the domain, additional details such as the full name, position on the protein, length in amino acids and link to the external domain source are displayed. For simplicity, overlapping domains are grouped and represented as an ellipse with a double frame. Mouse hovering will show how many domains are represented within this shape and a click on the shape will expand the visualization to show all the grouped overlapping domains. Protein RefSeq and/or Ensembl IDs are shown above each protein isoform visualization.
Color guide to the exons
A key to the exon colors is presented in table form at the bottom of the results page. Each color assigned to an exon in that page is shown, and the start and end positions as well as the IDs of all the transcripts in which the exon is included are detailed in the table.
The ‘change display option’ allows the user to choose the type of visualization that is shown: all views, genomic alone, transcript alone, protein composition alone, or transcript and protein composition together. The default view displays all views. The ‘hide predicted records’ option enables removal of all RefSeq's predicted transcripts and proteins (prefix XM_ and XP_), and only curated RefSeq (prefix NM_ and NP) and Ensembl (prefix ENS) records will be displayed in the results. In the species comparison tab, all transcripts of the relevant gene from both species are shown in similar format, side by side. Each result page can be exported to a PDF by using the ‘Save as PDF’ button.
Example and biological impact
To demonstrate how the visualization of DoChaP can promote the understanding of the functional effect of alternative splicing, we use the tumor suppressor breast cancer gene 1 (BRCA1) as a model gene. BRCA1 is one of the most commonly mutated genes in breast and ovarian cancer (26). In Figure 1, we present the DoChaP view of human BRCA1 (3 representative transcripts out of 32). BRCA1 is encoded on the reverse DNA strand and consists of 24 exons (Figure 1A). Alternative splice variants of BRCA1, mainly focused in the first non-coding exon, and the coding exons 3 and 10 (E3, E10, respectively; Figure 1B and C), have been previously reported and widely studied in different contexts (27–29). The frequency of the alternative transcripts of BRCA1 changes between tissues (29), and might play a role in the tumorigenesis of breast cancer (30). For example, exon number 3 is skipped in BRCA1 transcript NM_007297 (E3, Figure 1A left and zoom in Figure 1B). Since this exon encodes part of a RING finger motif (Figure 1A, right panel), the resulting protein product lacks the RING finger domain (‘RING-HC_BRCA1’), and this, in turn, might affect the cell cycle regulatory function of this protein isoform (29). The largest exon of the BRCA1 gene is exon E10 (3426 bp; Figure 1A left and zoom in Figure 1C). Strangely, this exon is sometimes referred to as exon 11, because of an upstream Alu element that was inserted into BRCA1 clone (historically referred to mistakenly as exon 4) (26). Two of the presented transcripts (NM_007297 and NM_007300) include the full-length E10 (3426 bp, Figure 1C). However, in transcript NM_007298, an alternative 5' splice site is used and only the first 117 bp of this exon remain in the mature mRNA (E10117, Figure 1C). The use of the alternative 5' splice site of exon 10 which leads to the expression of E10117 causes the loss of specific protein binding sites [such as RB, p53, MYC, RAD50, TUBG (γ-tubulin) and angiopoietin-1] and the loss of a nuclear localization signal, and therefore affects the functionality of the translated protein (27). At least some of those changes may be due to the loss of the ‘BRCT_assoc’ domain, which is a serine-rich domain associated with the BRCA1 C-terminus, and is encoded from the full version of exon 10 (Figure 1A, right panel) and is seen only in the protein products of the transcripts that include the full-length exon 10 (Figure 1A). In the case of BRCA1, DoChaP provides a clear and intuitive visualization of the complex pieces of information that have been collected over many years in several different studies and of all the known domains that exist (or not) according to the annotation of all transcripts.
Figure 1.

Sample output of DoChaP for the human breast cancer susceptibility gene BRCA1. (A) Left, genomic visualization of the transcripts in their genomic context (genomic region, genomic range and strand are on the top). The sliding scale and zoom buttons control the genomic region displayed. The genomic range shown is chr17:43 127,790–43 044 294 which is the genomic region coding for the displayed transcripts of the gene BRCA1. Right, mRNA and protein domain composition for each transcript. Different colors represent different exons and are consistent across all the visualizations of the same gene. Domains are shown as circular shapes and are colored according to the exons that encode for them. In BRCA1, the top transcript encodes for four domains. The BRCT domain exists in all three isoforms shown. The x-axis is the position in the protein and coding region, as shown on top. Sliding scale and zoom buttons control the transcript and protein region shown, and double click on an exon in a transcript in the genomic visualization will zoom in to the relevant region of the corresponding transcript in the mRNA and protein domain composition visualization. (B) In the second transcript, the third exon (E3) is skipped and therefore the RING protein domain is missing (‘RING-HC_BRCA1’). (C) The third protein isoform does not include the serine rich domain (‘BRCT_assoc’), encoded by exon 10 (E10), as its associated transcript has a shorter exon 10 (E10117) due to an alternative 5’ splice site event. For the sake of simplicity, only three representative transcripts of BRCA1 are shown.
Limitations
The public databases used as sources for DoChaP include redundancies and inconsistencies. To overcome this problem, we currently use the RefSeq – Ensembl conversion table gene2ensembl (from NCBI’s ftp, see Methods). In cases where matched RefSeq and Ensembl protein records have different lengths (of more than one amino acid), the records are separated into two transcripts in the visualization. For example, the protein isoform NP_001351656.1 (RefSeq) and ENSP00000498543.1 (Ensembl) of the gene AGRN have different lengths of 1944 and 1940 amino acids, respectively), and thus appear as two transcripts even though they are mapped to each other. In all other cases, matched records are merged into one transcript to avoid redundancies.
Different data sources may indicate slightly different start and end positions of the domains in the protein, probably due to differences in domain prediction methods. For example, in the protein isoform NP_000236.2 of the human gene Met, Pfam locates the Sema domain between amino acids 57–491 (pfam01403) and SMART locates the same Sema domain at 52–496 (smart00630). In such cases, we present the coordinates of all the overlapping domains and show the source from which the coordinates of each domain occurrence were taken. Overlapping domains are shown as a single ellipse with a double frame that can be expanded upon a click.
Finally, some very long transcripts and transcripts with many exons make the genomic visualization of an entire gene less efficient in terms of colors and relative exon sizes. In such cases, the user is advised to zoom in and explore the gene in several consecutive windows.
CONCLUSIONS AND FUTURE EXTENSIONS
Improved sequencing technologies are leading to increased interest in the connection between exons and domains and in the evolution of the regulatory mechanisms of alternative and differential splicing. Previously, to explore exon–domain associations, researchers had to search manually and then integrate and interpret textual data from several sources in a tedious and error-prone process. With the development of DoChaP (made possible by the increasing quantities of freely available data in the public domain), the research community has access to a fast, intuitive and easy-to-use visualization tool for exploring the exon–domain relationship.
DoChaP is an ongoing project, and we plan to add new features and visualization capabilities and to increase the database in updates. Specifically, we intend to add additional species and other types of functional features of proteins, such as signal peptides. In addition, we will integrate into DoChaP a method for comparison of transcripts that will allow the transcripts to be ordered according to their genomic similarity and domain organization and that will present similarity scores for transcripts of the same gene and between orthologs.
Given the increased interest in the effect of alternative splicing on functionality in health and disease, we believe that DoChaP will allow researchers from the biological, medical and computational biology fields to interpret the structural effect of splicing changes toward new functional findings.
DATA AVAILABILITY
The DoChaP web server is freely available at https://DoChaP.bgu.ac.il. The latest DoChaP database may be downloaded under ‘Downloads’ tab in the DoChaP website. The source code is available on GitHub (https://github.com/Tal-Shay-Group/DoChaP).
Supplementary Material
ACKNOWLEDGEMENTS
The authors would like to thank Yehuda Barouch for his continuous valuable support during DoChaP server development, and Eran Lachs and Yossi Gross from the Technologies, Innovation & Digital Division at Ben-Gurion University of the Negev for the technical support during server setup.
Contributor Information
Shani T Gal-Oz, Department of Life Sciences, Ben-Gurion University of the Negev, Beer-Sheva 8410501, Israel.
Nimrod Haiat, Department of Software and Information Systems Engineering, Ben-Gurion University of the Negev, Beer-Sheva 8410501, Israel.
Dana Eliyahu, Department of Software and Information Systems Engineering, Ben-Gurion University of the Negev, Beer-Sheva 8410501, Israel.
Guy Shani, Department of Software and Information Systems Engineering, Ben-Gurion University of the Negev, Beer-Sheva 8410501, Israel.
Tal Shay, Department of Life Sciences, Ben-Gurion University of the Negev, Beer-Sheva 8410501, Israel; Department of Software and Information Systems Engineering, Ben-Gurion University of the Negev, Beer-Sheva 8410501, Israel.
SUPPLEMENTARY DATA
Supplementary Data are available at NAR Online.
FUNDING
Israel Science Foundation [500/15, 1210/18]; National Institute of Allergy and Infectious Diseases of the National Institutes of Health [R24AI072073]; the content is solely the responsibility of the authors and does not necessarily represent the official views of the National Institutes of Health; S.T.G.-O. was supported by a Hi-Tech, Bio-Tech and Chemo-tech fellowship and the Negev fellowship of Ben-Gurion University of the Negev. Funding for open access charge: Israel Science Foundation [500/15].
Conflict of interest statement. None declared.
REFERENCES
- 1. Irimia M., Rukov J.L., Penny D., Roy S.W.. Functional and evolutionary analysis of alternatively spliced genes is consistent with an early eukaryotic origin of alternative splicing. BMC Evol. Biol. 2007; 7:188. [DOI] [PMC free article] [PubMed] [Google Scholar]
- 2. Ast G. How did alternative splicing evolve?. Nat. Rev. Genet. 2004; 5:773–782. [DOI] [PubMed] [Google Scholar]
- 3. Lander E.S., Linton L.M., Birren B., Nusbaum C., Zody M.C., Baldwin J., Devon K., Dewar K., Doyle M., FitzHugh W.et al.. Initial sequencing and analysis of the human genome. Nature. 2001; 409:860–921. [DOI] [PubMed] [Google Scholar]
- 4. Liu Y., Gonzàlez-Porta M., Santos S., Brazma A., Marioni J., Aebersold R., Venkitaraman A., Wickramasinghe V.O.. Impact of alternative splicing on the human proteome. Cell Rep. 2017; 20:1229–1241. [DOI] [PMC free article] [PubMed] [Google Scholar]
- 5. Chothia C., Gough J., Vogel C., Teichmann S.A.. Evolution of the protein repertoire. Science. 2003; 300:1701–1703. [DOI] [PubMed] [Google Scholar]
- 6. Buljan M., Chalancon G., Eustermann S., Wagner G., Fuxreiter M., Bateman A., Babu M.. Tissue-specific splicing of disordered segments that embed binding motifs rewires protein interaction networks. Mol. Cell. 2012; 46:871–883. [DOI] [PMC free article] [PubMed] [Google Scholar]
- 7. Yang X., Coulombe-Huntington J., Kang S., Sheynkman G., Hao T., Richardson A., Sun S., Yang F., Shen Y., Murray R.et al.. Widespread expansion of protein interaction capabilities by alternative splicing. Cell. 2016; 164:805–817. [DOI] [PMC free article] [PubMed] [Google Scholar]
- 8. Climente-González H., Porta-Pardo E., Godzik A., Eyras E.. The functional impact of alternative splicing in cancer. Cell Rep. 2017; 20:2215–2226. [DOI] [PubMed] [Google Scholar]
- 9. Au W.W.Y., Henderson B.R.. The BRCA1 RING and BRCT domains cooperate in targeting BRCA1 to ionizing radiation-induced nuclear foci. J. Biol. Chem. 2005; 280:6993–7001. [DOI] [PubMed] [Google Scholar]
- 10. Poulikakos P.I., Persaud Y., Janakiraman M., Kong X., Ng C., Moriceau G., Shi H., Atefi M., Titz B., Gabay M.T.et al.. RAF inhibitor resistance is mediated by dimerization of aberrantly spliced BRAF(V600E). Nature. 2011; 480:387–390. [DOI] [PMC free article] [PubMed] [Google Scholar]
- 11. Shemer-Avni Y., Kundu K., Shemesh A., Brusilovsky M., Yossef R., Meshesha M., Solomon-Alemayehu S., Levin S., Gershoni-Yahalom O., Campbell K.S.et al.. Expression of NKp46 splice variants in nasal lavage following respiratory viral infection: Domain 1-negative isoforms predominate and manifest higher activity. Front. Immunol. 2017; 8:161. [DOI] [PMC free article] [PubMed] [Google Scholar]
- 12. Mehmood A., Laiho A., Venäläinen M.S., McGlinchey A.J., Wang N., Elo L.L.. Systematic evaluation of differential splicing tools for RNA-seq studies. Brief. Bioinform. 2020; 21:2052–2065. [DOI] [PMC free article] [PubMed] [Google Scholar]
- 13. Letunic I., Bork P.. 20 years of the SMART protein domain annotation resource. Nucleic. Acids. Res. 2018; 46:D493–D496. [DOI] [PMC free article] [PubMed] [Google Scholar]
- 14. El-Gebali S., Mistry J., Bateman A., Eddy S.R., Luciani A., Potter S.C., Qureshi M., Richardson L.J., Salazar G.A., Smart A.et al.. The pfam protein families database in 2019. Nucleic Acids Res. 2019; 47:D427–D432. [DOI] [PMC free article] [PubMed] [Google Scholar]
- 15. Lu S., Wang J., Chitsaz F., Derbyshire M.K., Geer R.C., Gonzales N.R., Gwadz M., Hurwitz D.I., Marchler G.H., Song J.S.et al.. CDD/SPARCLE: the conserved domain database in 2020. Nucleic Acids Res. 2020; 48:D265–D268. [DOI] [PMC free article] [PubMed] [Google Scholar]
- 16. Haft D.H., Selengut J.D., Richter R.A., Harkins D., Basu M.K., Beck E.. TIGRFAMs and genome properties in 2013. Nucleic Acids Res. 2013; 41:387. [DOI] [PMC free article] [PubMed] [Google Scholar]
- 17. Bhasi A., Philip P., Manikandan V., Senapathy P.. ExDom: an integrated database for comparative analysis of the exon-intron structures of protein domains in eukaryotes. Nucleic Acids Res. 2009; 37:703. [DOI] [PMC free article] [PubMed] [Google Scholar]
- 18. Birzele F., Küffner R., Meier F., Oefinger F., Potthast C., Zimmer R.. ProSAS: a database for analyzing alternative splicing in the context of protein structures. Nucleic Acids Res. 2008; 36:63. [DOI] [PMC free article] [PubMed] [Google Scholar]
- 19. D’Antonio M., Castrgnanò T., Pallocca M., D’Erchia A.M., Picardi E., Pesole G.. ASPicDB: a database web tool for alternative splicing analysis. Methods Mol. Biol. 2015; 1269:365–378. [DOI] [PubMed] [Google Scholar]
- 20. O’Leary N.A., Wright M.W., Brister J.R., Ciufo S., Haddad D., McVeigh R., Rajput B., Robbertse B., Smith-White B., Ako-Adjei D.et al.. Reference sequence (RefSeq) database at NCBI: current status, taxonomic expansion, and functional annotation. Nucleic Acids Res. 2016; 44:733. [DOI] [PMC free article] [PubMed] [Google Scholar]
- 21. Yates A.D., Achuthan P., Akanni W., Allen J., Allen J., Alvarez-Jarreta J., Amode M.R., Armean I.M., Azov A.G., Bennett R.et al.. Ensembl 2020. Nucleic Acids Res. 2020; 48:D682–D688. [DOI] [PMC free article] [PubMed] [Google Scholar]
- 22. Kinsella R.J., Kähäri A., Haider S., Zamora J., Proctor G., Spudich G., Almeida-King J., Staines D., Derwent P., Kerhornou A.et al.. Ensembl BioMarts: a hub for data retrieval across taxonomic space. Database. 2011; 2011:bar030. [DOI] [PMC free article] [PubMed] [Google Scholar]
- 23. Mitchell A.L., Attwood T.K., Babbitt P.C., Blum M., Bork P., Bridge A., Brown S.D., Chang H., El-Gebali S., Fraser M.I.et al.. InterPro in 2019: Improving coverage, classification and access to protein sequence annotations. Nucleic Acids Res. 2019; 47:D351–D360. [DOI] [PMC free article] [PubMed] [Google Scholar]
- 24. Cock P.J.A., Antao T., Chang J.T., Chapman B.A., Cox C.J., Dalke A., Friedberg I., Hamelryck T., Kauff F., Wilczynski B.et al.. Biopython: Freely available python tools for computational molecular biology and bioinformatics. Bioinformatics. 2009; 25:1422–1423. [DOI] [PMC free article] [PubMed] [Google Scholar]
- 25. McKinney W. Data structures for statistical computing in python. Proceedings of the 9th Python in Science Conference. 2010; 56–61. [Google Scholar]
- 26. Miki Y., Swensen J., Shattuck-Eidens D., Futreal P.A., Harshman K., Tavtigian S., Liu Q., Cochran C., Bennett L.M., Ding W.. A strong candidate for the breast and ovarian cancer susceptibility gene BRCA1. Science. 1994; 266:66–71. [DOI] [PubMed] [Google Scholar]
- 27. Li D., Harlan-Williams L.M., Kumaraswamy E., Jensen R.A.. BRCA1—no matter how you splice it. Cancer Res. 2019; 79:2091–2098. [DOI] [PMC free article] [PubMed] [Google Scholar]
- 28. Xiping Z., Qingshan W., Shuai Z., Hongjian Y., Xiaowen D.. A summary of relationships between alternative splicing and breast cancer. Oncotarget. 2017; 8:51986–51993. [DOI] [PMC free article] [PubMed] [Google Scholar]
- 29. Orban T.I., Olah E.. Emerging roles of BRCA1 alternative splicing. Mol. Pathol. 2003; 56:191–197. [DOI] [PMC free article] [PubMed] [Google Scholar]
- 30. Lixia M., Zhijian C., Chao S., Chaojiang G., Congyi Z.. Alternative splicing of breast cancer associated gene BRCA1 from breast cancer cell line. J. Biochem. Mol. Biol. 2007; 40:15–21. [DOI] [PubMed] [Google Scholar]
Associated Data
This section collects any data citations, data availability statements, or supplementary materials included in this article.
Supplementary Materials
Data Availability Statement
The DoChaP web server is freely available at https://DoChaP.bgu.ac.il. The latest DoChaP database may be downloaded under ‘Downloads’ tab in the DoChaP website. The source code is available on GitHub (https://github.com/Tal-Shay-Group/DoChaP).