


Abstract
Large biomolecular structures are being determined experimentally on a daily basis using established techniques such as crystallography and electron microscopy. In addition, emerging integrative or hybrid methods (I/HM) are producing structural models of huge macromolecular machines and assemblies, sometimes containing 100s of millions of non-hydrogen atoms. The performance requirements for visualization and analysis tools delivering these data are increasing rapidly. Significant progress in developing online, web-native three-dimensional (3D) visualization tools was previously accomplished with the introduction of the LiteMol suite and NGL Viewers. Thereafter, Mol* development was jointly initiated by PDBe and RCSB PDB to combine and build on the strengths of LiteMol (developed by PDBe) and NGL (developed by RCSB PDB). The web-native Mol* Viewer enables 3D visualization and streaming of macromolecular coordinate and experimental data, together with capabilities for displaying structure quality, functional, or biological context annotations. High-performance graphics and data management allows users to simultaneously visualise up to hundreds of (superimposed) protein structures, stream molecular dynamics simulation trajectories, render cell-level models, or display huge I/HM structures. It is the primary 3D structure viewer used by PDBe and RCSB PDB. It can be easily integrated into third-party services. Mol* Viewer is open source and freely available at https://molstar.org/.
Graphical Abstract
Graphical Abstract.
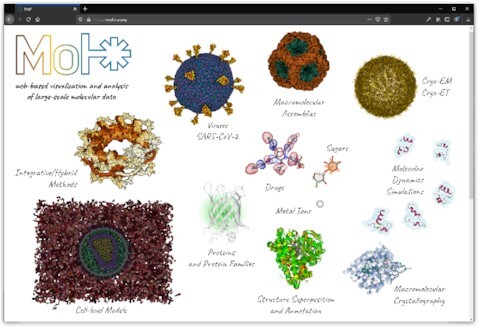
Overview of the large array of entities and systems that can be visualized and be manipulated with by the Mol* Viewer.
INTRODUCTION
Experimental methods to determine the three-dimensional (3D) structures of biomolecules are continuously improved and produce molecular complexes from models with various resolutions that span multiple scales and can be dynamic throughout an experiment. By combining data from complementary experimental techniques including macromolecular crystallography (MX), nuclear magnetic resonance (NMR), 3D electron microscopy (3DEM), small-angle scattering (SAS), chemical crosslinking, or integrative/hybrid methods (I/HM), 3D structural models of large macromolecular systems can be determined (1,2). Such models include large macromolecular machines (3), dynamic assemblies, membrane organization (4), genome architecture (5,6) or even whole organelles (7). Access, visualization and analysis of these structures is a central part of structural biology and structural bioinformatics. However, as macromolecular data sets grow ever larger and more complex, it becomes challenging to create software tools to access, visualize, and manipulate them.
Web platforms, both mobile and desktop, have become an increasingly popular and essential tool for performing these tasks. Embracing advances in web browser technology provides the means for creating scalable molecular graphics and analysis tools with near-instant access to any available data. Web-based tools are platform-independent and require little or no local software installation, making them available to virtually everyone in both the scientific and non-scientific community, reaching an audience larger than ever before. Moreover, these technologies (most notably JavaScript, HTML and WebGL https://www.khronos.org/webgl/) and their surrounding ecosystem (including NPM https://www.npmjs.com/, Node.js https://nodejs.org/, TypeScript https://www.typescriptlang.org/, GitHub https://github.com/) offer good support for the development of modular libraries and components. In summary, the web provides a unique opportunity to develop a common library and a set of tools for accessing, analysing, and visualizing macromolecular data.
Here, we introduce Mol* (/’mol-star/) Viewer, part of the Mol* open source project (8) developed by an international group of contributors and supported by RCSB Protein Data Bank (RCSB PDB) (9) and Protein Data Bank in Europe (PDBe) (10) with the goal of developing a common library and tools for web-based molecular graphics and analyses. The Mol* project includes modules for data storage, in-memory representation, a query language, UI state management, visualization, and tools for efficient data access in a collaborative ecosystem. Collaborative development also helps with anticipating and keeping up with developments in structural biology and related fields as well as long-term sustainability.
The purpose of Mol* Viewer is to enable web-based molecular visualization and analyses by providing a common library for the rapid and efficient development of tools and services for the structural biology/bioinformatics community. Examples include showing experimental/validation-related data for macromolecular models; displaying various annotations for macromolecular models providing biological context, including SCOP (11), PFAM (12), UniProt (13); the creation of visually interesting, engaging, and interactive educational materials; or visualizing results from structural bioinformatics or computer-aided drug design efforts. The project builds on the code and knowledge the authors gained from developing web-based molecular viewers, analysis tools, and compressed file formats, including the LiteMol Suite (14), the NGL Viewer (15,16), PatternQuery (17), MMTF (18,19) and BinaryCIF (20). Mol* Viewer is developed as an open source project and hosted on GitHub (https://github.com/molstar).
DESCRIPTION OF THE WEB APPLICATION
Visualization capabilities
Mol* Viewer can visualize markedly larger molecular systems than other currently available web visualization tools. Due to built-in BinaryCIF (20), decompression support, and advanced techniques for model and volume/experimental data streaming (14), even large structures are interactively renderable over limited bandwidth. As such, Mol* Viewer is able to render many types of large systems, including ribosomes, virus capsids, collections of superimposed macromolecules (e.g. a comparison of individual members of the same protein family), or MD simulation systems. Additionally, it is able to visualize mesoscopic models such as cellPACK models, as illustrated in Figure 1.
Figure 1.

cellPACK model of enveloped HIV capsid in blood serum (67 870 140 atoms) with smooth browser-based visualization using nVidia RTX 2060 graphics card.
Overview of Mol* Viewer's new and improved features
Mol* inherits many LiteMol suite and NGL Viewer features, as described in their respective articles. Here, we highlight some of its new and improved features:
Advanced User Interface: access to many capabilities of the underlying Mol* library for fully creating molecular scenes with custom visuals and colourings.
High-quality rendering: advanced rendering options for beautiful images and improved perception of details, such as lighting (matte, metallic, glossy, plastic), outlines, fog/depth cue, and ambient occlusion ‘shadows’ which darken crevices occluded from ambient light (Figure 2).
Sequence view and molecular component focus tools: integrated sequence view and component (e.g. ligand or polymer) selection menu to help with navigating the structure and making selections.
Alignment of molecules: sequence-guided pairwise alignment of two or more structures and ligand alignment by manual selection of corresponding atoms.
Measurements and labels: geometric measurements (distances, angles, dihedrals) and their labelling.
Session state saving: save the current molecular scene to reload it later.
Animation export: video export of molecular dynamics simulations, rotating molecules, and 3D state transitions (such as zooming to a binding site).
Screenshots: custom-sized, high-resolution, anti-aliased screenshots with preview, automatic cropping, and transparent background support.
Built-in data loading and annotations: includes support for loading data from RCSB PDB and PDBe MX and 3DEM density servers, wwPDB validation reports, and RCSB PDB assembly symmetry.
Figure 2.

The effect of lighting modes and representations on the clarity of the visualization. PDB entries (left to right) 4ktc, 5fj5 and 1upn rendered using different lighting modes and representations. Top row: screen-space ambient occlusion and outline. Bottom row: direct light and ambient light. An interactive version of this figure is available at the Mol* Viewer web page (https://molstar.org/).
Data formats accepted by Mol* Viewer
Mol* Viewer is currently able to load and visualize many file formats with 3D structures:
Structures (21): PDBx/mmCIF (https://mmcif.wwpdb.org/pdbx-mmcif-home-page.html) (including BinaryCIF encoded), pdb (ftp://ftp.wwpdb.org/pub/pdb/doc/format_descriptions/Format_v32_letter.pdf), pdbqt (http://autodock.scripps.edu/faqs-help/faq/what-is-the-format-of-a-pdbqt-file), gro (https://manual.gromacs.org/documentation/2018/user-guide/file-formats.html#gro), sdf (https://discover.3ds.com/sites/default/files/2020–08/biovia_ctfileformats_2020.pdf), mol (https://discover.3ds.com/sites/default/files/2020–08/biovia_ctfileformats_2020.pdf), mol2 (http://chemyang.ccnu.edu.cn/ccb/server/AIMMS/mol2.pdf), CIF-core (small molecule/crystallographic cif) (https://www.iucr.org/resources/cif/dictionaries/cif_core).
Volumes: ccp4/mrc/map (22), dsn6/brix (http://svn.cgl.ucsf.edu/svn/chimera/trunk/libs/VolumeData/dsn6/brix-1.html), cube (http://paulbourke.net/dataformats/cube/), dx (https://www.ics.uci.edu/∼dock/manuals/apbs/html/user-guide/x2674.html), BinaryCIF (20).
Trajectories: xtc (https://manual.gromacs.org/documentation/5.1/user-guide/file-formats.html#xtc), dcd (https://www.ks.uiuc.edu/Research/namd/2.14/ug.pdf), psf (topology) (http://www.ks.uiuc.edu/Training/Tutorials/namd/namd-tutorial-win.pdf).
Generic triangle geometries: ply (e.g., coloured surfaces calculated by external tools) (http://gamma.cs.unc.edu/POWERPLANT/papers/ply.pdf).
Adding support for additional formats is usually a straightforward process.
Implementation
TypeScript (https://www.typescriptlang.org/) was used for the development of the web application, WebGL (https://www.khronos.org/webgl/) for hardware-accelerated 3D rendering, and the standards of the open web platform (https://www.w3.org/standards/) for the whole tool. The React framework (https://reactjs.org/) was used to implement the application's UI.
RESULTS
Mol* Viewer offers a wide variety of visualization aspects that are required by current structural biology needs. It can show one structure, a few structures, or a large set of structures (e.g. a whole protein family). The structures can be static or dynamic (e.g. a molecular dynamic trajectory). It can visualize large mesoscopic models (e.g. Genome3D (6), cellPACK models (23)), hybrid models (e.g. from PDB-Dev (1)), protein assemblies, but also residues at atomic resolution. All the levels of detail can be seamlessly navigated within one Mol* session (provided the availability of the data). Various visualization models of structure coordinates can be applied, specifically: surfaces and volumes (Gaussian surface, Gaussian volume, molecular surface, etc.), secondary structure (e.g. cartoon, ribbon), ligands (labels, glycan 3D-SNFG symbols (24), etc.), atoms (balls and sticks, lines, points, etc.). These visualization models can be coloured not only according to many types of atom properties (including occupancy, uncertainty, etc.), residue properties (including hydrophobicity and accessible surface area) and chain properties but also based on annotations (e.g. quality criteria annotations loaded from wwPDB validation reports (25)). Mol* also supports the rendering of electron densities and Cryo-EM maps. Further molecular characteristics, for example, molecular orbitals, non-covalent interactions, and membrane orientation, can be shown. Figure 3 shows the user interface of the Mol* Viewer and Figure 4 points to interactive practical demonstrations of Mol* Viewer's capabilities.
Figure 3.

Mol* Viewer user interface. The 3D Canvas shows the beta2 adrenergic receptor-Gs protein complex (PDB entry 3sn6) with a molecular surface coloured by the relative solvent accessible surface area. The inset shows an exploded view of the deeply buried binding interface of the beta2 adrenergic receptor with the Gs-alpha subunit.
Figure 4.

Practical demonstrations of Mol* Viewer visualization capabilities. We prepared several use cases that can be accessed from the Mol* web page (https://molstar.org). (A) Enveloped HIV capsid in blood serum. Originates from cellPACK and includes more than 13 million atoms. It is a simplified interactive version of Figure 1. (B) Superimposition of cytochromes P450. The superimposed structures are coloured according to a structure quality annotation based on wwPDB validation reports. (C) Villin un/folding simulation. A set of molecular dynamics trajectories for Markov state model analysis along villin headpiece folding and unfolding pathways. (D) SARS-CoV-2 Virion. The coarse-grained model composed of glycosylated S-proteins, M-proteins, E-proteins, and a lipid bilayer. (E) GAIN domain tethered agonist exposure simulation. Molecular dynamics trajectory. (F) Nuclear pore complex. Hybrid model originating from PDB-dev and including 238 288 unique residues. (G) Zika virus assembly including its Cryo-EM density. The original size of the data is about 1.6 GB. (H) Molecular orbitals and electron density of atorvastatin. Visualization of molecular orbitals and the electron density obtained using semiempirical GFN1-xTB method (34,35) (used at https://envision.entos.ai). (I) DNA binding protein assembly. A protein assembly is showcasing the RCSB PDB assembly symmetry annotation.
The high quality and applicability of Mol* Viewer was shown by a large number of integrations of it into scientific tools and databases. Mol* Viewer was integrated into PDBe and RCSB PDB as the primary 3D viewer where it is actively used by thousands of users daily. Moreover, Mol* Viewer was incorporated into many other resources, including PDBe-KB (26), PDB-Dev, EMDataResource (27), PED (28), MobiDB (29) and HARP (30).
CONCLUSION
Mol* Viewer is a powerful web application for the visualization and analysis of molecular data. Its visualization capabilities far exceed other currently available web visualization tools. Mol* Viewer's speed and robustness allow the fast and intuitive visualization of molecular data ranging from atomistic models from PDB or MD simulations up to hybrid models with hundreds of thousands of residues, mesoscale cellPACK with tens of millions of atoms, or 3D Genome data. Furthermore, Mol* Viewer offers advanced selection and superimposition functionalities. It also offers a rich set of visualization models and colouring types. Last but not least, Mol* Viewer can save a visualization state operated by this web app.
Mol* Viewer can be used from its webpage https://molstar.org/ or can be integrated into other web applications. Its source codes are available on GitHub at https://github.com/molstar.
DATA AVAILABILITY
Mol* Viewer is available for free at https://molstar.org/, under the MIT license, a permissive Open Source license, to facilitate code sharing and collaboration. The code is available on GitHub at https://github.com/molstar. Mol* Viewer can be readily embedded into any scientific web application.
Data for Figure 4C are available at https://doi.org/10.6084/m9.figshare.12040257.v1 and (31). Data for Figure 4D are available at (32). Data for Figure 4E are available at (33).
ACKNOWLEDGEMENTS
We wish to thank Dr Ludovic Autin for his contributions to the cellPACK support, Aron Kovacs for improvements in 3D rendering, Dr Daniel Smith for help with molecular orbitals rendering, and specifically Dr Shuchismita Dutta for providing the basis of the User documentation. We gratefully acknowledge contributions from past and present members of the RCSB PDB and PDBe and our other wwPDB partners.
Contributor Information
David Sehnal, CEITEC - Central European Institute of Technology, Masaryk University, Brno 625 00, Czech Republic; National Centre for Biomolecular Research, Faculty of Science, Masaryk University, Brno 602 00, Czech Republic; Protein Data Bank in Europe (PDBe), European Molecular Biology Laboratory, European Bioinformatics Institute (EMBL–EBI), Wellcome Genome Campus, Hinxton CB10 1SD, UK.
Sebastian Bittrich, Research Collaboratory for Structural Bioinformatics (RCSB), San Diego Supercomputer Center, University of California San Diego, San Diego, CA 92093-0743, USA.
Mandar Deshpande, Protein Data Bank in Europe (PDBe), European Molecular Biology Laboratory, European Bioinformatics Institute (EMBL–EBI), Wellcome Genome Campus, Hinxton CB10 1SD, UK.
Radka Svobodová, CEITEC - Central European Institute of Technology, Masaryk University, Brno 625 00, Czech Republic; National Centre for Biomolecular Research, Faculty of Science, Masaryk University, Brno 602 00, Czech Republic.
Karel Berka, Department of Physical Chemistry, Faculty of Science, Palacký University Olomouc, Olomouc 771 46, Czech Republic.
Václav Bazgier, Department of Physical Chemistry, Faculty of Science, Palacký University Olomouc, Olomouc 771 46, Czech Republic.
Sameer Velankar, Protein Data Bank in Europe (PDBe), European Molecular Biology Laboratory, European Bioinformatics Institute (EMBL–EBI), Wellcome Genome Campus, Hinxton CB10 1SD, UK.
Stephen K Burley, Research Collaboratory for Structural Bioinformatics Protein Data Bank (RCSB PDB), Institute for Quantitative Biomedicine and Department of Chemistry and Chemical Biology, Rutgers, The State University of New Jersey, Piscataway, NJ 08854-8076, USA; Rutgers Cancer Institute of New Jersey, Rutgers, The State University of New Jersey, New Brunswick, NJ 08903-2681, USA; Research Collaboratory for Structural Bioinformatics Protein Data Bank (RCSB PDB), San Diego Supercomputer Center and Skaggs School of Pharmacy and Pharmaceutical Sciences, University of California San Diego, San Diego, CA 92093-0654, USA.
Jaroslav Koča, CEITEC - Central European Institute of Technology, Masaryk University, Brno 625 00, Czech Republic; National Centre for Biomolecular Research, Faculty of Science, Masaryk University, Brno 602 00, Czech Republic.
Alexander S Rose, Research Collaboratory for Structural Bioinformatics (RCSB), San Diego Supercomputer Center, University of California San Diego, San Diego, CA 92093-0743, USA.
FUNDING
Ministry of Education, Youth and Sports of the Czech Republic under the following projects: ELIXIR-CZ research infrastructure project [LM2018131]; European Regional Development Fund – Project ELIXIR-CZ [CZ.02.1.01/0.0/0.0/16_013/0001777]; Protein Data Bank in Europe is supported by the European Molecular Biology Laboratory – European Bioinformatics Institute and the Wellcome Trust [104948]; RCSB Protein Data Bank is jointly funded by grants from the National Science Foundation [DBI-1832184 to S. K. B.]; National Institutes of Health [R01GM133198 to S. K. B.]; United States Department of Energy [DE-SSC0019749 to S. K. B.]; D.S. was supported through a partnership between Entos, Inc. and Schmidt Futures aimed at developing software tools for chemical discovery and education. Funding for open access charge: ELIXIR-CZ research infrastructure project [LM2018131] granted by the Ministry of Education, Youth and Sports of the Czech Republic.
Conflict of interest statement. None declared.
REFERENCES
- 1. Burley S.K., Kurisu G., Markley J.L., Nakamura H., Velankar S., Berman H.M., Sali A., Schwede T., Trewhella J.. PDB-Dev: a prototype system for depositing integrative/hybrid structural models. Structure. 2017; 25:1317–1318. [DOI] [PMC free article] [PubMed] [Google Scholar]
- 2. Sali A., Berman H.M., Schwede T., Trewhella J., Kleywegt G., Burley S.K., Markley J., Nakamura H., Adams P., Bonvin A.M.J.J.et al.. Outcome of the first wwPDB hybrid/integrative methods task force workshop. Structure. 2015; 23:1156–1167. [DOI] [PMC free article] [PubMed] [Google Scholar]
- 3. Kummer E., Ban N.. Structural insights into mammalian mitochondrial translation elongation catalyzed by mtEFG1. EMBO J. 2020; 39:e104820. [DOI] [PMC free article] [PubMed] [Google Scholar]
- 4. Chavent M., Duncan A.L., Rassam P., Birkholz O., Hélie J., Reddy T., Beliaev D., Hambly B., Piehler J., Kleanthous C.et al.. How nanoscale protein interactions determine the mesoscale dynamic organisation of bacterial outer membrane proteins. Nat. Commun. 2018; 9:2846. [DOI] [PMC free article] [PubMed] [Google Scholar]
- 5. Jung J., Nishima W., Daniels M., Bascom G., Kobayashi C., Adedoyin A., Wall M., Lappala A., Phillips D., Fischer W.et al.. Scaling molecular dynamics beyond 100,000 processor cores for large-scale biophysical simulations. J. Comput. Chem. 2019; 40:1919–1930. [DOI] [PMC free article] [PubMed] [Google Scholar]
- 6. Asbury T.M., Mitman M., Tang J., Zheng W.J.. Genome3D: a viewer-model framework for integrating and visualizing multi-scale epigenomic information within a three-dimensional genome. BMC Bioinformatics. 2010; 11:444. [DOI] [PMC free article] [PubMed] [Google Scholar]
- 7. Singharoy A., Maffeo C., Delgado-Magnero K.H., Swainsbury D.J.K., Sener M., Kleinekathöfer U., Vant J.W., Nguyen J., Hitchcock A., Isralewitz B.et al.. Atoms to phenotypes: molecular design principles of cellular energy metabolism. Cell. 2019; 179:1098–1111. [DOI] [PMC free article] [PubMed] [Google Scholar]
- 8. Sehnal D., Rose A.S., Koča J., Burley S.K., Velankar S.. Byška J., Krone M., Sommer B.. Mol*: Towards a common library and tools for web molecular graphics. Proceedings of the Workshop on Molecular Graphics and Visual Analysis of Molecular Data. 2018; 29–33. [Google Scholar]
- 9. Berman H.M., Westbrook J., Feng Z., Gilliland G., Bhat T.N., Weissig H., Shindyalov I.N., Bourne P.E.. The Protein Data Bank. Nucleic Acids Res. 2000; 28:235–242. [DOI] [PMC free article] [PubMed] [Google Scholar]
- 10. Mir S., Alhroub Y., Anyango S., Armstrong D.R., Berrisford J.M., Clark A.R., Conroy M.J., Dana J.M., Deshpande M., Gupta D.et al.. PDBe: towards reusable data delivery infrastructure at protein data bank in Europe. Nucleic Acids Res. 2018; 46:D486–D492. [DOI] [PMC free article] [PubMed] [Google Scholar]
- 11. Andreeva A., Kulesha E., Gough J., Murzin A.G.. The SCOP database in 2020: expanded classification of representative family and superfamily domains of known protein structures. Nucleic Acids Res. 2020; 48:D376–D382. [DOI] [PMC free article] [PubMed] [Google Scholar]
- 12. Mistry J., Chuguransky S., Williams L., Qureshi M., Salazar G.A., Sonnhammer E.L.L., Tosatto S.C.E., Paladin L., Raj S., Richardson L.J.et al.. Pfam: The protein families database in 2021. Nucleic Acids Res. 2021; 49:D412–D419. [DOI] [PMC free article] [PubMed] [Google Scholar]
- 13. The Uniprot Consortium UniProt: the universal protein knowledgebase in 2021. Nucleic Acids Res. 2021; 49:D480–D489. [DOI] [PMC free article] [PubMed] [Google Scholar]
- 14. Sehnal D., Deshpande M., Svobodová Vařeková R., Mir S., Berka K., Midlik A., Pravda L., Velankar S., Koča J.. LiteMol suite: interactive web-based visualization of large-scale macromolecular structure data. Nat. Methods. 2017; 14:1121–1122. [DOI] [PubMed] [Google Scholar]
- 15. Rose A.S., Hildebrand P.W.. NGL Viewer: a web application for molecular visualization. Nucleic Acids Res. 2015; 43:W576–W579. [DOI] [PMC free article] [PubMed] [Google Scholar]
- 16. Rose A.S., Bradley A.R., Valasatava Y., Duarte J.M., Prlić A., Rose P.W.. Web-based molecular graphics for large complexes. Web3D ’16: Proceedings of the 21st International Conference on Web3D Technology. 2016; 185–186. [Google Scholar]
- 17. Sehnal D., Pravda L., Svobodová Vařeková R., Ionescu C.-M., Koča J.. PatternQuery: web application for fast detection of biomacromolecular structural patterns in the entire Protein Data Bank. Nucleic Acids Res. 2015; 43:W383–W388. [DOI] [PMC free article] [PubMed] [Google Scholar]
- 18. Bradley A.R., Rose A.S., Pavelka A., Valasatava Y., Duarte J.M., Prlić A., Rose P.W.. MMTF—an efficient file format for the transmission, visualization, and analysis of macromolecular structures. PLoS Comput. Biol. 2017; 13:e1005575. [DOI] [PMC free article] [PubMed] [Google Scholar]
- 19. Valasatava Y., Bradley A.R., Rose A.S., Duarte J.M., Prlić A., Rose P.W.. Towards an efficient compression of 3D coordinates of macromolecular structures. PLoS One. 2017; 12:e0174846. [DOI] [PMC free article] [PubMed] [Google Scholar]
- 20. Sehnal D., Bittrich S., Velankar S., Koča J., Svobodová R., Burley S.K., Rose A.S.. BinaryCIF and CIFTools—lightweight, efficient and extensible macromolecular data management. PLoS Comput. Biol. 2020; 16:e1008247. [DOI] [PMC free article] [PubMed] [Google Scholar]
- 21. Westbrook J.D., Fitzgerald P.M.D. Gu J., Bourne P.E.. Chapter 10 The PDB format, mmCIF formats, and other data formats. Structural Bioinformatics. 2009; Hoboken, New Jersey: Wiley-Blackwell; 271–291. [Google Scholar]
- 22. Cheng A., Henderson R., Mastronarde D., Ludtke S.J., Schoenmakers R.H.M., Short J., Marabini R., Dallakyan S., Agard D., Winn M. MRC2014: extensions to the MRC format header for electron cryo-microscopy and tomography. J. Struct. Biol. 2015; 192:146–150. [DOI] [PMC free article] [PubMed] [Google Scholar]
- 23. Johnson G.T., Autin L., Al-Alusi M., Goodsell D.S., Sanner M.F., Olson A.J.. cellPACK: a virtual mesoscope to model and visualize structural systems biology. Nat. Methods. 2015; 12:85–91. [DOI] [PMC free article] [PubMed] [Google Scholar]
- 24. Sehnal D., Grant O.C.. Rapidly display glycan symbols in 3D structures: 3D-SNFG in LiteMol. J. Proteome Res. 2019; 18:770–774. [DOI] [PubMed] [Google Scholar]
- 25. wwPDB consortium Protein Data Bank: the single global archive for 3D macromolecular structure data. Nucleic Acids Res. 2019; 47:D520–D528. [DOI] [PMC free article] [PubMed] [Google Scholar]
- 26. PDBe-KB consortium PDBe-KB: a community-driven resource for structural and functional annotations. Nucleic Acids Res. 2020; 48:D344–D353. [DOI] [PMC free article] [PubMed] [Google Scholar]
- 27. Lawson C.L., Patwardhan A., Baker M.L., Hryc C., Garcia E.S., Hudson B.P., Lagerstedt I., Ludtke S.J., Pintilie G., Sala R.et al.. EMDataBank unified data resource for 3DEM. Nucleic Acids Res. 2016; 44:D396–D403. [DOI] [PMC free article] [PubMed] [Google Scholar]
- 28. Lazar T., Martínez-Pérez E., Quaglia F., Hatos A., Chemes L.B., Iserte J.A., Méndez N.A., Garrone N.A., Saldaño T.E., Marchetti J.et al.. PED in 2021: a major update of the protein ensemble database for intrinsically disordered proteins. Nucleic Acids Res. 2021; 49:D404–D411. [DOI] [PMC free article] [PubMed] [Google Scholar]
- 29. Piovesan D., Necci M., Escobedo N., Monzon A.M., Hatos A., Mičetić I., Quaglia F., Paladin L., Ramasamy P., Dosztányi Z.et al.. MobiDB: intrinsically disordered proteins in 2021. Nucleic Acids Res. 2021; 49:D361–D367. [DOI] [PMC free article] [PubMed] [Google Scholar]
- 30. Vedithi S.C., Malhotra S., Skwark M.J., Munir A., Acebrón-García-De-Eulate M., Waman V.P., Alsulami A., Ascher D.B., Blundell T.L.. HARP: a database of structural impacts of systematic missense mutations in drug targets of Mycobacterium leprae. Comput. Struct. Biotechnol. J. 2020; 18:3692–3704. [DOI] [PMC free article] [PubMed] [Google Scholar]
- 31. Doerr S., Harvey M.J., Noé F., De Fabritiis G.. HTMD: high-throughput molecular dynamics for molecular discovery. J. Chem. Theory Comput. 2016; 12:1845–1852. [DOI] [PubMed] [Google Scholar]
- 32. Yu A., Pak A.J., He P., Monje-Galvan V., Casalino L., Gaieb Z., Dommer A.C., Amaro R.E., Voth G.A.. A multiscale coarse-grained model of the SARS-CoV-2 virion. Biophys. J. 2021; 120:1097–1104. [DOI] [PMC free article] [PubMed] [Google Scholar]
- 33. Beliu G., Altrichter S., Guixà-González R., Hemberger M., Brauer I., Dahse A.-K., Scholz N., Wieduwild R., Kuhlemann A., Batebi H.et al.. Tethered agonist exposure in intact adhesion/class B2 GPCRs through intrinsic structural flexibility of the GAIN domain. Mol. Cell. 2021; 81:905–921. [DOI] [PubMed] [Google Scholar]
- 34. Grimme S., Bannwarth C., Shushkov P.. A robust and accurate tight-binding quantum chemical method for structures, vibrational frequencies, and noncovalent interactions of large molecular systems parametrized for all spd-block elements (Z = 1-86). J. Chem. Theory Comput. 2017; 13:1989–2009. [DOI] [PubMed] [Google Scholar]
- 35. Manby F.R., Miller T.F. III, Bygrave P.J., Ding F., Dresselhaus T., Batista-Romero F.A., Buccheri A., Bungey C., Lee S.J.R., Meli R.et al.. entos: a quantum molecular simulation package. 2019; ChemRxiv doi:26 February 2019, preprint: not peer reviewed 10.26434/chemrxiv.7762646.v2. [DOI]
Associated Data
This section collects any data citations, data availability statements, or supplementary materials included in this article.
Data Availability Statement
Mol* Viewer is available for free at https://molstar.org/, under the MIT license, a permissive Open Source license, to facilitate code sharing and collaboration. The code is available on GitHub at https://github.com/molstar. Mol* Viewer can be readily embedded into any scientific web application.
Data for Figure 4C are available at https://doi.org/10.6084/m9.figshare.12040257.v1 and (31). Data for Figure 4D are available at (32). Data for Figure 4E are available at (33).