Abstract
Near-infrared diffuse correlation spectroscopy (DCS) is increasingly used to study relative changes in skeletal muscle blood flow. However, most diffuse correlation spectrometers assume that tissue optical properties—such as absorption (μa) and reduced scattering (μ′s) coefficients—remain constant during physiological provocations, which is untrue for skeletal muscle. Here, we interrogate how changes in tissue μa and μ′s affect DCS calculations of blood flow index (BFI). We recalculated BFI using raw autocorrelation curves and μa/μ′s values recorded during a reactive hyperemia protocol in 16 healthy young individuals. First, we show that incorrectly assuming baseline μa and μ′s substantially affects peak BFI and BFI slope when expressed in absolute terms (cm2/s, P < 0.01), but these differences are abolished when expressed in relative terms (% baseline). Next, to evaluate the impact of physiologic changes in μa and μ′s, we compared peak BFI and BFI slope when μa and μ′s were held constant throughout the reactive hyperemia protocol versus integrated from a 3-s rolling average. Regardless of approach, group means for peak BFI and BFI slope did not differ. Group means for peak BFI and BFI slope were also similar following ad absurdum analyses, where we simulated supraphysiologic changes in μa/μ′s. In both cases, however, we identified individual cases where peak BFI and BFI slope were indeed affected, with this result being driven by relative changes in μa over μ′s. Overall, these results provide support for past reports in which μa/μ′s were held constant but also advocate for real-time incorporation of μa and μ′s moving forward.
NEW & NOTEWORTHY We investigated how changes in tissue optical properties affect near-infrared diffuse correlation spectroscopy (NIR-DCS)-derived indices of skeletal muscle blood flow (BFI) during physiological provocation. Although accounting for changes in tissue optical properties has little impact on BFI on a group level, individual BFI calculations are indeed impacted by changes in tissue optical properties. NIR-DCS calculations of BFI should therefore account for real-time, physiologically induced changes in tissue optical properties whenever possible.
Keywords: absorption coefficient, near-infrared diffuse correlation spectroscopy, reactive hyperemia, scattering coefficient, tissue optical properties
INTRODUCTION
Over the past decade, near-infrared diffuse correlation spectroscopy (NIR-DCS) has emerged as a powerful tool for measuring changes in skeletal muscle blood flow during physiological provocations such as exercise and clinical tests of vascular function. For example, Tucker et al. (1) recently demonstrated myogenic autoregulation of skeletal muscle perfusion during handgrip exercise under conditions of reduced perfusion pressure. Others have used NIR-DCS to demonstrate that microvascular reperfusion hemodynamics can be affected by sympathetic vasoconstriction (2, 3) or tissue perfusion pressure (4). However, despite the expanded use of NIR-DCS to measure skeletal muscle blood flow (2, 5–12), there are several technical aspects of NIR-DCS that need to be investigated and/or validated before the technique reaches widespread use among clinical and exercise physiologists.
In short, NIR-DCS is an optical, statistical-based methodology that uses the normalized light intensity autocorrelation of laser speckles to determine a relative blood flow index (BFI; units of cm2/s), a term used to describe fold changes in microvascular blood flow relative to a resting baseline (13–15). When light from a long coherence length laser is directed into a tissue, luminance is greatest at the point of contact and then decreases exponentially with increasing distance traveled. The rate of decrease in light intensity per unit area depends on optical properties including absorption (μa) and reduced scattering (μ′s) coefficients. Importantly, if light is collected from a very small spatial area (about the size of the laser speckle), light intensity will fluctuate temporally due to the movement of photon scatterers, including red blood cells. Thus, NIR-DCS leverages this principle by using high-speed (up to ∼1,000,000 Hz) photon counting detectors (such as avalanche photo diodes) to record temporal fluctuations in light intensity from small laser speckles, and then quantitates BFI by using normalized autocorrelation functions to calculate the magnitude by which moving tissue scatterers, such as red blood cells, affect temporal fluctuations in laser speckle light intensity, with faster red blood cell velocities causing the temporal autocorrelation to decay more quickly and rapidly.
Importantly, NIR-DCS measures of BFI are not absolute (i.e., mL/kg/min) and are instead expressed as a fold change relative to the mean BFI observed during a baseline, resting period. Consequently, one potential limitation of NIR-DCS in skeletal muscle is how calculations of BFI are affected by physiologically induced changes in μa and μ′s, as this may alter the shape of the autocorrelation curve that is used to derive BFI, and therefore alter the relationship between BFI calculated at baseline and BFI calculated under physiologic provocation. Although it is generally assumed that μa and μ′s do not change within a given subject or experiment, several studies have shown that this assumption is not true for skeletal muscle during reactive hyperemia (16), exercise (17), or passive heat stress (18). Indeed, Hammer et al. (16) demonstrated that assuming constant μ′s during reactive hyperemia testing can affect NIRS calculations of muscle deoxy-heme content and oxygenation by as much as ∼100% and ∼12%, respectively.
To address this methodological gap in NIR-DCS literature, we investigated how changes in μa and μ′s affect calculations of BFI during reactive hyperemia by refitting the raw light-intensity autocorrelation curves with varying sets of μa and μ′s, and assessed differences by comparing: 1) baseline BFI values (in cm2/s), 2) peak BFI values observed during reperfusion in both absolute (cm2/s) and relative (% or fold change above baseline) units, and 3) mean BFI slopes observed during reperfusion in both absolute and relative units.
METHODS
Ethical Statement
All experimental procedures were approved by the Institutional Review Board of the University of Texas at Arlington (IRB 2020-0039) and conformed to the standards set forth by the Declaration of Helsinki, apart from registration in a database.
Experimental Design
To examine how changes in μa and μ′s affect measures of skeletal muscle BFI, we reanalyzed raw NIR-DCS data from a recently published reactive hyperemia study (4). Briefly, 16 healthy young adults (eight females) who were free of overt cardiovascular, pulmonary, metabolic, or musculoskeletal disease underwent standardized reactive hyperemia testing. We chose this test because previous work has already shown it produces changes in μa and μ′s that are large enough to affect NIRS measures of skeletal muscle heme content and oxygenation (16). We collected NIR-DCS measures of BFI continuously for 2 min of rest, 6 min of cuff ischemia, and 3 min of recovery using a commercially available near-infrared diffuse correlation spectrometer (MetaOx; ISS Inc.). Throughout each test, the MetaOx logged raw NIR-DCS data, including the DCS autocorrelation curves and tissue optical property values (i.e., μa and μ′s), at each timepoint. These data were subsequently downloaded and postprocessed using a custom-written program that recalculated BFI according to interindividual values/changes in μa and μ′s, rather than assuming that μa and μ′s are equal to 0.2 and 5.0 in every subject (the assumption made during initial testing).
Our analysis was divided into four parts. In part 1, we examined how absolute differences in μa and μ′s affect both absolute (cm2/s) and relative (% or fold change above resting baseline) calculations of BFI. Part 2 examined whether the changes in μa and μ′s observed during a 6-min reactive hyperemia test were sufficient to affect calculations of BFI. In part 3, we simulated the impact of supraphysiological changes in optical properties to determine the magnitude by which μa and μ′s need to change before they alter calculations of BFI and interpretations of postischemic reperfusion kinetics. Finally, in part 4, we examined the differential effects of μa or μ′s by simulating how changes in only one optical property affect calculations of BFI.
Experimental Setup
All tests were performed in a temperature (∼22°C) and ambient light-controlled room with the subjects positioned supine on an examination bed, as described previously (4). Forearm skinfold thickness was measured from the proximal, medial, and distal forearm using calipers, with mean ½ skinfold thickness (mm) calculated as ½ the mean thickness observed across all three sites.
Forearm optical properties (μa and μ′s) and microvascular blood flow index (BFI) were measured continuously using a commercially available frequency-domain near-infrared diffuse correlation spectrometer (MetaOx; ISS Inc., Champaign, IL). A single NIR-DCS probe that contained multiple source-detector pairs for near-infrared and DCS measures was positioned longitudinally over the flexor digitorum profundus and secured in place using self-adhering wrap. The near-infrared component of the probe consisted of 4 sets of 8 laser diodes operating at wavelengths of 670, 690, 700, 730, 750, 785, 808, and 830 nm separated from a single detector by distances of 2.0, 2.5, 3.5, and 4.5 cm. Only the three shortest distances were used during the present study, to avoid signal decay in the most distant detector during cuff ischemia. The DCS component of the probe consisted of four photon-counting detectors located 2.4 cm away from a long coherence laser operating at a wavelength of 850 nm.
Throughout all testing procedures, NIR-DCS measurements were collected at a sampling frequency of 5 Hz and the experimental limb was kept motionless to avoid inducing motion artifacts. Importantly, the MetaOx code assumed μa and μ′s equaled 0.2 and 5.0 at baseline, respectively, and remained constant throughout the reactive hyperemia test. Consequently, to determine whether changes in μa and μ′s values affect calculations of BFI, we downloaded the raw light-intensity autocorrelation curves and μa/μ′s values measured at each experimental timepoint, which were logged in separate .csv files, to postprocess calculations of BFI according to measured changes in μa and μ′s (described in detail in the section Data Postprocessing and Analysis for Calculations of BFI).
Data Postprocessing and Analysis for Calculations of BFI
At each experimental timepoint (i.e., 5 Hz or 0.2 s), the light-intensity autocorrelation values (i.e., G1) and autocorrelation times (τ), from each of the diffuse correlation spectrometer’s four detectors, as well as μa and μ′s values calculated for each of the eight wavelengths measured by the near-infrared spectrometer, were recorded in a .csv file by the MetaOx. After testing was completed, the .csv files were downloaded and BFI was recalculated at each timepoint using a custom-written postprocessing script (freely downloadable on GitHub) coded in Julia [Julia Language; www.julialang.org (19)] that refit each light-intensity autocorrelation curve with the corresponding μa and μ′s values observed at that same corresponding timepoint from the 830 nm wavelength. The μa and μ′s values from the 830 nm wavelength were used because the MetaOx did not measure/log μa and μ′s values at the 850 nm wavelength used by the diffuse correlation spectrometer. However, given the close wavelength proximity, this substitution seems reasonable. Mean μa and μ′s values from all 16 subjects are reported for all eight of the NIRS wavelengths in Table 1.
Table 1.
Forearm tissue optical properties at baseline
| μa |
μ′s |
||||
|---|---|---|---|---|---|
| Wavelength | Means ± SD | Range | Means ± SD | Range | |
| 670 | 0.0125 ± 0.05 | 0.069–0.229 | 8.59 ± 3.92 | 4.84–16.97 | |
| 690 | 0.117 ± 0.05 | 0.066–0.211 | 8.35 ± 3.72 | 4.81–16.26 | |
| 700 | 0.110 ± 0.04 | 0.064–0.190 | 7.82 ± 3.46 | 4.53–15.41 | |
| 730 | 0.108 ± 0.04 | 0.064–0.182 | 7.75 ± 3.65 | 4.34–15.88 | |
| 750 | 0.129 ± 0.05 | 0.074–0.214 | 7.33 ± 3.09 | 4.13–14.16 | |
| 785 | 0.127 ± 0.05 | 0.073–0.209 | 7.04 ± 3.05 | 3.87–13.92 | |
| 808 | 0.139 ± 0.05 | 0.078–0.224 | 6.58 ± 2.77 | 3.59–12.88 | |
| 830* | 0.146 ± 0.06 | 0.081–0.236 | 6.49 ± 2.78 | 3.45–12.75 | |
The group means ± SD and range of baseline μa and μ′s values from all eight wavelengths are reported. *μa and μ′s values from the 830 nm wavelength were used to recalculate BFI. μa, absorption coefficient; μ′s, scattering coefficient.
Analysis part 1—impact of different μa and μ′s values on calculations of BFI.
Part 1 of the analysis examined how different μa and μ′s values affect absolute (cm2/s) and relative (fold change above resting baseline) calculations of BFI. For each subject, we calculated the mean μa and μ′s observed over the 120-s baseline period. These baseline μa and μ′s values were then multiplied by either ×0.25, ×0.5, ×1 (i.e., the mean baseline value, used here as a control), ×2, ×4, or ×8 and subsequently held constant at each timepoint throughout the duration of the reactive hyperemia trial when recalculating BFI.
Analysis part 2—impact of μa and μ′s changes during ischemia and reperfusion.
Here, we examined whether the changes in μa and μ′s observed during the 6 min of cuff occlusion and 3 min of reperfusion were sufficiently large enough to alter the normalized light intensity autocorrelation relationship that calibrates measures of BFI to the photoelectric field, the latter of which is affected by μa and μ′s. To achieve this aim, μa and μ′s were calculated for each subject in two ways. First, because most diffuse correlation spectrometers assume μa and μ′s remain constant during experimentation, we calculated the mean μa and μ′s observed over the first 3 s of baseline and then held μa and μ′s at these constant values throughout the duration of the reactive hyperemia trial when recalculating BFI. This calculation not only mimicked the “constant” μa and μ′s that is typically seen in DCS machines, but also allowed us to account for interindividual differences in baseline μa and μ′s. Second, measured μa and μ′s values observed at each timepoint were recalculated using a 3-s (i.e., 15 data points) rolling average, allowing us to account for changes in μa and μ′s observed in each subject throughout the reactive hyperemia trial.
Analysis part 3—impact of supraphysiological changes in μa and μ′s.
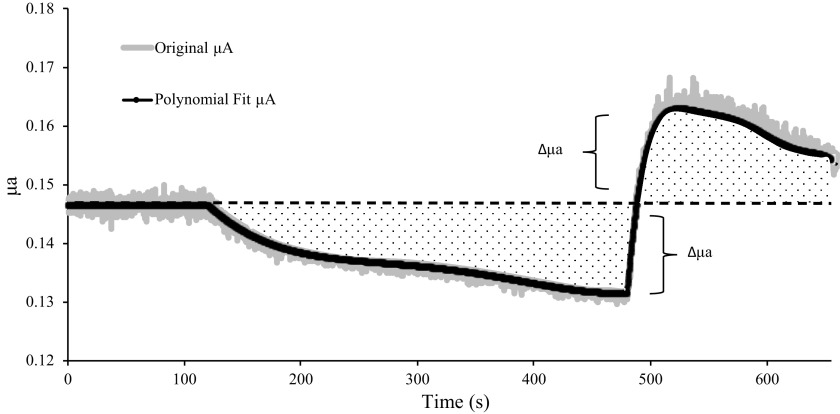
In part 3, we investigated the magnitude by which μa and μ′s would need to change to substantially alter the normalized light-intensity autocorrelation relationship. This process involved three steps, which are illustrated in Fig. 1. First, baseline μa and μ′s were held constant at the mean value observed over the 120-s resting period. Second, to eliminate any possibility of small, noisy fluctuations in μa and μ′s from affecting calculations of BFI, we fit the changes in μa and μ′s observed over the 6-min ischemia and 3-min reperfusion periods with fourth- and sixth-order polynomials, respectively. The third step calculated the difference between baseline μa and μ′s and the polynomial-fitted μa and μ′s value at each timepoint, and then recalculated supraphysiological values for μa and μ′s at each timepoint as:
Figure 1.
Simulating supraphysiological changes in μa and μ′s. To simulate supraphysiological changes in μa and μ′s, we eliminated noisy fluctuations in μa and μ′s by fitting the 6-min period of ischemia with a fourth-order polynomial and the 3-min period of reperfusion with a sixth-order polynomial. The mean polynomial fit for μa from all 16 subjects is illustrated by the black bold line, with the mean original μa values at each timepoint illustrated by the gray shaded region surrounding the polynomial fit. Next, for each participant, we fixed baseline μa to the mean value observed over the 120-s resting period. We then calculated the change in μa at each timepoint (Δμa) during ischemia and reperfusion (dotted regions) as the difference between baseline μa (black dashed line) and the polynomial fitted μa at each timepoint. Subsequently, supraphysiological changes in μa were simulated by recalculating μa at each timepoint as described in Eq. 1. These procedures were also performed for calculating supraphysiological changes in μ′s (illustration omitted to avoid redundancy). μa, absorption coefficient; μ′s, scattering coefficient.
| (1) |
where SPμa (t) is the supraphysiological μa calculated at timepoint “t,” baseline μa is the mean μa calculated over the 120-s baseline period, Δμa (t) is the difference between baseline μa, and the polynomial-fitted μa at timepoint “t,” and X is a multiplication factor that augmented the Δμa by either ×1 (i.e., the measured values, used here as control values), ×2, ×4, or ×8 to simulate supraphysiological changes in optical properties. Importantly, although we chose to describe/illustrate these mathematical procedures using μa as an example in Eq. 1 and Fig. 1, the exact same procedure was also performed to simulate supraphysiological changes in μ′s (i.e., SPμ′s). The supraphysiologically calculated values for μa and μ′s were then used to recalculate BFI at each timepoint.
Analysis part 4—individual effects of μa versus μ′s on calculations of BFI.
In part 4, we separately simulated how different values of μa or μ′s affect calculations of BFI. Consistent with analysis part 1, we calculated the mean μa and μ′s observed over the 120-s baseline period in each subject. To simulate how different μa values affect baseline calculations of BFI, μ′s was held constant at the baseline value for all timepoints, whereas the baseline μa value was multiplied by either ×0.25, ×0.5, ×1 (i.e., the mean baseline value, used here as a control), ×2, ×4, or ×8 and subsequently held constant at each timepoint throughout the duration of the reactive hyperemia trial. Accordingly, to simulate how different μ′s values affect baseline calculations of BFI, μa was held constant at the baseline value for all timepoints, whereas the baseline μ′s value was multiplied by either ×0.25, ×0.5, ×1, ×2, ×4, or ×8 and subsequently held constant at each timepoint throughout the duration of the reactive hyperemia trial.
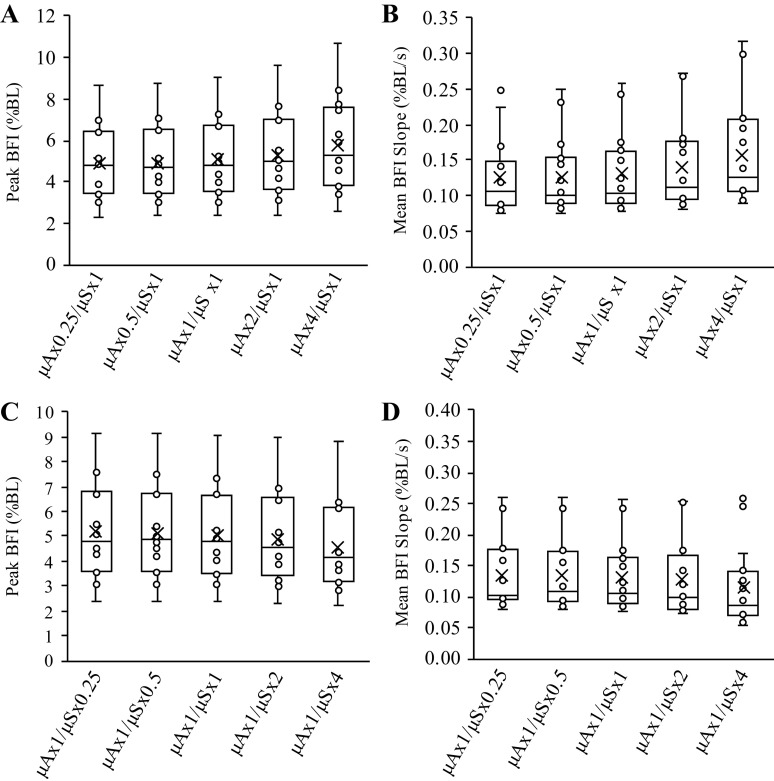
We also examined how augmenting changes in just one optical property (i.e., only μa or μ′s) affects calculations of peak BFI and mean BFI slope during reperfusion. For this analysis, we repeated analysis part 3 (illustrated in Fig. 1), with one exception: instead of scaling changes in both μa and μ′s (i.e., both optical properties scaled by ×0.25, ×0.5, ×1, ×2, or ×4 at the same time), we only scaled one optical property at a time. Specifically, when changes in μa were not scaled, changes in μ′s were scaled by ×0.25, ×0.5, ×1, ×2, or ×4; and when changes in μ′s were not scaled, changes in μa were scaled by ×0.25, ×0.5, ×1, ×2, or ×4. Importantly, this analysis allowed us to directly examine how relatively larger changes in μa or μ′s affect estimations of peak BFI and BFI slope during reperfusion.
Recalculating BFI from the raw DCS-derived light-intensity autocorrelations.
Blood flow index (BFI) was recalculated at each timepoint using the Siegert relation to establish the relationship between the normalized light intensity autocorrelation function, g2(τ), to relative changes in microvascular blood flow (14, 20):
| (2) |
where τ is the autocorrelation time (s), β is the estimated laser coherence, and g1(τ) is the normalized light intensity autocorrelation at each τ-point, which is calculated as:
| (3) |
In the diffusion approximation, the light intensity at position r within the photoelectric field of a theoretically infinite media can be estimated as (20):
| (4) |
where G1(τ) is the measured light intensity at autocorrelation timepoint (τ), v is the speed of light in the media, Dph is the photon diffusion coefficient taken as v/(3μ′s), r is the source-detector separation distance, and K(τ) is the mathematical component that relates the autocorrelation curve of the DCS probe signal intensity [i.e., g2(τ)] to the microvascular BFI and measured tissue optical properties:
| (5a) |
where α is the fraction of scattering events from moving particles (i.e., primarily red blood cells), k0 is the wavenumber of the measurement light (i.e., 2π/λ, where λ is wavelength in units of 1/cm), and Δr2 is the mean squared displacement of the scatters. Assuming Δr2 is well modeled by a Brownian diffusion coefficient, then Δr2 = 6 Db and BFI can be estimated as α·Db, leaving the final equation for K as:
| (5b) |
where BFI is the NIR-DCS-derived blood flow index (BFI) in units of cm2/s and [6·BFI] is substituted for α and Δr2. Consequently, at each experimental timepoint (t), we recalculated BFI by fitting Eq. 2 to the G1(τ) values measured/logged by the MetaOx and the corresponding μa and μ′s values described for parts 1–4 of our analysis. During the fitting procedure, we constrained β and BFI to 0 ≤ β ≤ 1 and 0 ≤ BFI ≤ 1 × 10⁶, respectively.
Calculating BFI slope during reperfusion.
The mean rate of microvascular reperfusion (i.e., BFI slope) was calculated as described previously (4). Briefly, the SLOPE function in Excel was used to fit BFI values starting ∼1 s after cuff release to the timepoint corresponding to peak BFI. The first ∼1 s of reactive hyperemia was excluded from the BFI slope calculation to eliminate motion artifact and nonperfusion-related changes in BFI that occur immediately at cuff release.
Statistics
All statistical analyses were conducted using SPSS v26.0 (IBM Statistics, Armonk, NY). For all analyses, n = 16 subjects. Data are presented as means ± SD, with P < 0.05 considered statistically significant. Prior to conducting any statistical comparisons, data were tested for normal distribution using the Shapiro–Wilk test. Normally distributed data were analyzed by paired t tests or repeated measures ANOVAs. If a significant main effect was observed, post hoc comparisons were analyzed using the estimated marginal means. For non-normally distributed data, paired t tests were replaced by the nonparametric equivalent Wilcoxon signed-rank test, and repeated measures ANOVAs were replaced by the nonparametric Friedman’s tests. In the event of a significant Friedman’s test, post hoc comparisons were analyzed using individual Wilcoxon signed-rank tests. We also conducted linear regressions to analyze the relationship between mean forearm skinfold thickness and baseline μa and μ′s at the 830 nm wavelength, as well as the relationship between relative changes in peak BFI from part 2 of our analysis and relative changes in μ′s versus μa.
RESULTS
Mean Tissue Optical Properties and ½ Skinfold Thickness
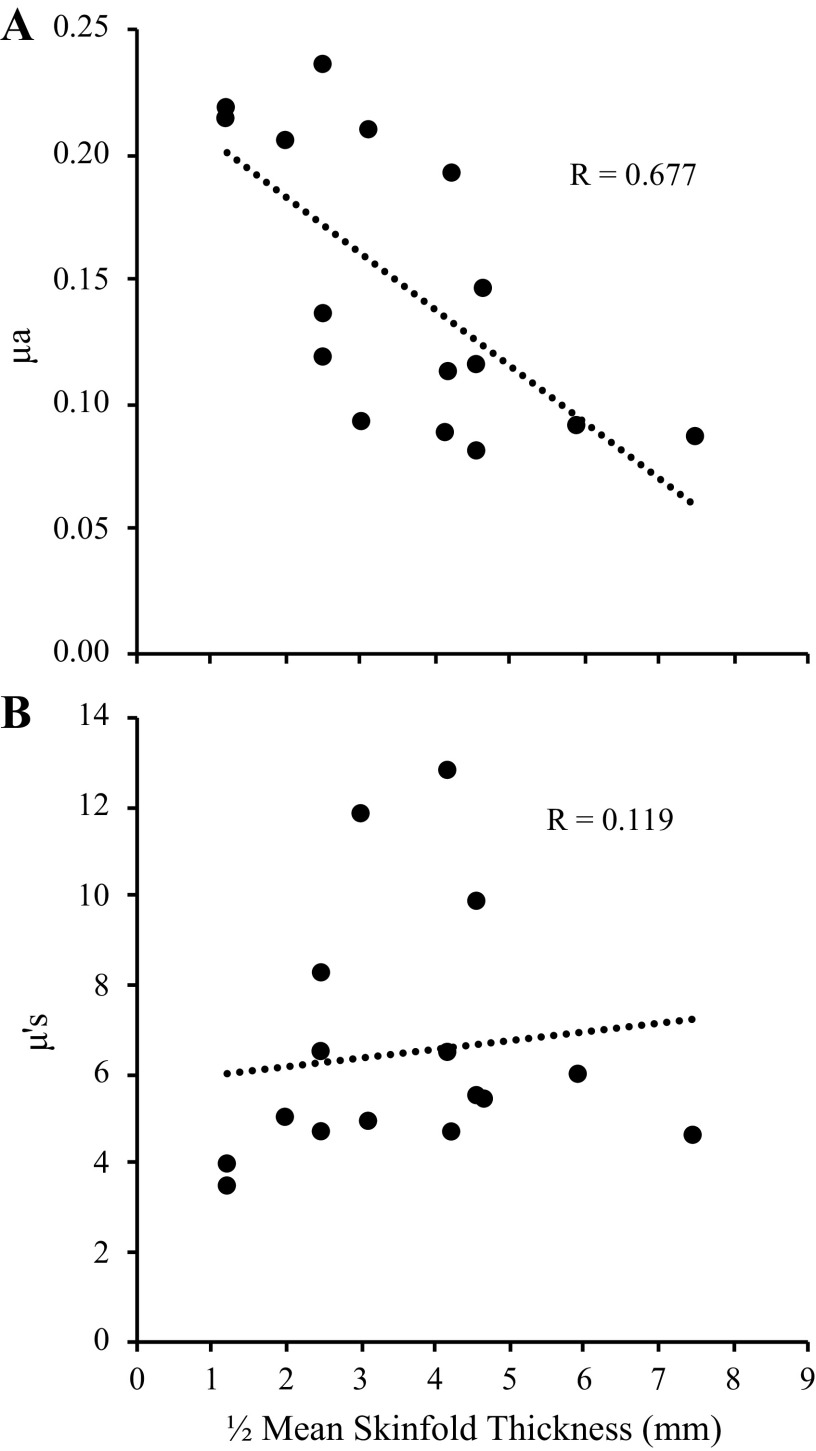
The mean age, height, and weight, and ½ skinfold thickness of the 16 subjects were 23.6 ± 3.5 yr, 168.7 ± 8.9 cm, 78.5 ± 17.4 kg, and 3.62 ± 1.69 mm, respectively. A more comprehensive description of the subject characteristics is presented elsewhere (4). Mean values for μa and μ′s at all eight of the NIRS wavelengths measured in the present study are presented in Table 1, with the relative (%) changes observed during the ischemia and reperfusion periods shown in Table 2. Of note, a significant relationship between ½ mean skinfold thickness and baseline μa at the 830 nm wavelength was observed (P = 0.004, R = 0.677), but no relationship between ½ mean skinfold thickness and baseline μ′s (P = 0.662, Fig. 2).
Table 2.
Minimum and maximum μa and μ′s values observed during ischemia and reperfusion
| μa |
μ′s |
|||
|---|---|---|---|---|
| Wavelength | Minimum | Maximum | Minimum | Maximum |
| 670 | 0.89 ± 0.08 | 1.43 ± 0.32 | 0.96 ± 0.04 | 1.15 ± 0.11 |
| 690 | 0.90 ± 0.08 | 1.41 ± 0.23 | 0.97 ± 0.03 | 1.14 ± 0.10 |
| 700 | 0.92 ± 0.06 | 1.41 ± 0.21 | 0.97 ± 0.03 | 1.12 ± 0.08 |
| 730 | 0.96 ± 0.05 | 1.34 ± 0.15 | 0.98 ± 0.02 | 1.10 ± 0.06 |
| 750 | 0.98 ± 0.04 | 1.28 ± 0.14 | 0.98 ± 0.03 | 1.08 ± 0.05 |
| 785 | 1.02 ± 0.02 | 1.15 ± 0.05 | 0.98 ± 0.02 | 1.04 ± 0.03 |
| 808 | 0.94 ± 0.04 | 1.13 ± 0.04 | 0.97 ± 0.02 | 1.03 ± 0.02 |
| 830* | 0.93 ± 0.04 | 1.13 ± 0.04 | 0.96 ± 0.03 | 1.04 ± 0.02 |
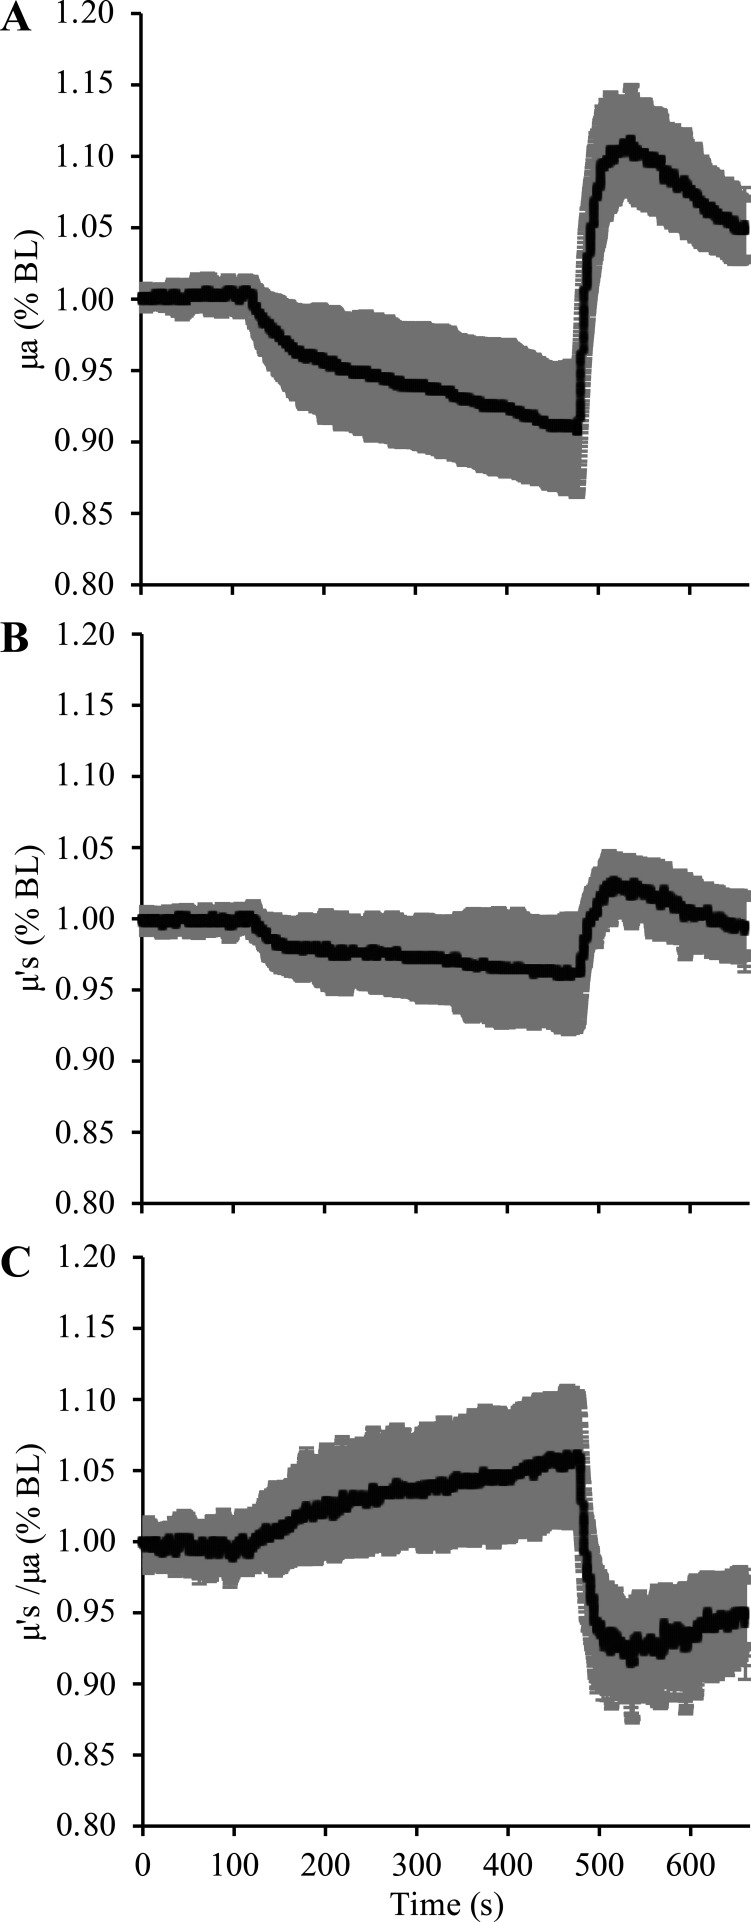
Consistent with the illustration in Fig. 5, μa and μ′s from all eight wavelengths decreased during ischemia and then increased during reperfusion. The changes in μa and μ′s are expressed as values normalized to baseline, with data presented as means ± SD. *μa and μ′s values from the 830 nm wavelength were used to recalculate BFI. μa, absorption coefficient; μ′s, scattering coefficient.
Figure 2.
Relationship between baseline optical properties and skinfold thickness. Mean ½ skinfold thickness (mm) was taken as the average ½ skinfold thickness measured from the proximal, medial, and distal forearm using calipers. As expected, there was a significant relationship between μa and ½ skinfold thickness (A) because thinner cutaneous + subcutaneous adipose tissue layers result in a greater volume of muscle beneath the probe, which causes μa to decrease due to greater photon attenuation by hemoglobin + myoglobin. In contrast, there was no relationship between ½ skinfold thickness and μ′s (B). μa, absorption coefficient; μ′s, scattering coefficient.
Analysis Part 1—Impact of Different μa and Μ’s Values
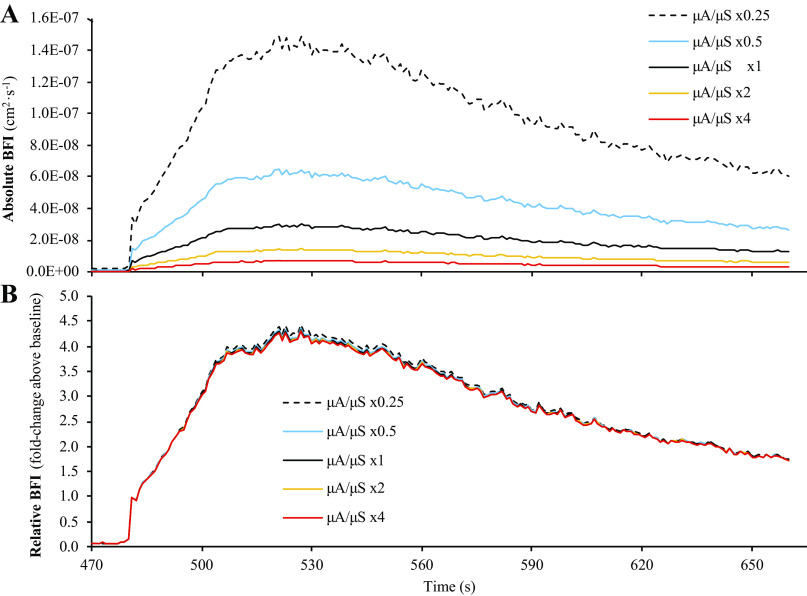
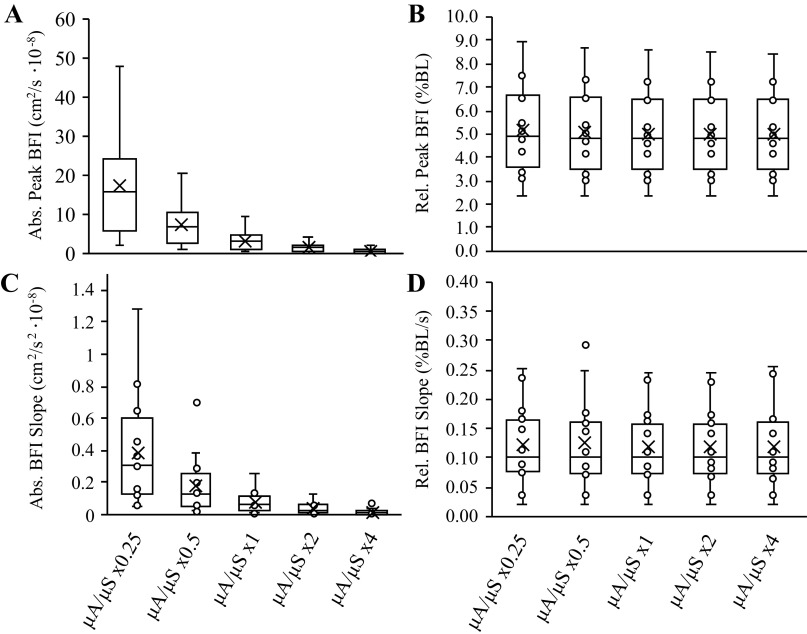
Comparisons of BFI calculations from the six sets of simulated μa and μ′s values are shown in Fig. 3. When BFI calculations were expressed in absolute units (cm2/s), there was a main effect of μa/μ′s value for baseline BFI (P = 0.001), peak BFI during reperfusion (P = 0.001), and mean BFI slope during reperfusion (P = 0.001), with post hoc analyses revealing that all six sets of μa and μ′s values were different from one another for each outcome measure (Fig. 4; P < 0.01, all). However, mean BFI slope was not significantly different across the six sets of μa and μ′s values when BFI was expressed in relative units (% or fold change above baseline; main effect P = 0.138), though we did observe a main effect μa/μ′s for peak BFI during reperfusion when expressed in relative units (P = 0.001; all six sets of μa and μ′s values different from one another, P < 0.05), which appeared to be a function of the statistical analysis rather than a physiologically significant phenomenon.
Figure 3.
Analysis part 1: impact of different μa and μ′s values on calculations of BFI during reperfusion. Part 1 of the analysis examined the impact that different values of μa and μ′s have on calculations of BFI during postocclusive reperfusion. Specifically, baseline values for μa and μ′s from each subject were multiplied by ×0.25, ×0.5, ×1 (i.e., control values), ×2, or ×4, before recalculating BFI. As shown in A, different values of μa and μ′s can have a large impact on BFI calculations when expressed in absolute units of cm2/s. However, when BFI values are expressed in relative units (i.e., normalized to baseline), these differences are almost completely abolished (B). Data are presented as means (n = 16) with standard error bars omitted to maintain illustrative clarity. BFI, blood flow index; μa, absorption coefficient; μ′s, scattering coefficient.
Figure 4.
Analysis part 1: impact of different μa and μ′s values on peak BFI and mean BFI slope observed during reperfusion. Box and whisker plots are shown for peak BFI in absolute (A) and relative (B) terms, as well as mean BFI slope in absolute (C) and relative (D) terms across the 5-scaling factors investigated in analysis part 1. Peak BFI and mean BFI were different across scaling factors when compared in absolute terms (cm2/s·10−8), but these differences were abolished when compared in relative terms (normalized to baseline; %BL). BFI, blood flow index; μa, absorption coefficient; μ′s, scattering coefficient.
Analysis Part 2—Impact of Accounting for Changes in μa and μ′s during Ischemia and Reperfusion
Given that part 1 of the analysis demonstrated that absolute calculations of BFI are affected by different values for μa and μ′s, we investigated whether or not the changes in μa and μ′s observed during reactive hyperemia would be sufficient to significantly alter absolute (cm2/s) and/or relative (% or fold increase above baseline) calculations of BFI. The means ± SD changes in optical properties observed at the 830 nm wavelength are depicted in Fig. 5. At the 830 nm wavelength, forearm μa decreased by ∼7% (range: 1.32%–16.62%) from 0.146 ± 0.06 to 0.135 ± 0.05 during ischemia (P < 0.01) and then increased to 0.167 ± 0.07 during the reperfusion period (∼13% above baseline, range: 7.29%–20.73%, P < 0.01), whereas μ′s decreased by ∼4% (range: 0.50%–10.07%) from 6.49 ± 2.78 to 6.27 ± 2.77 during ischemia (P < 0.01) and then increased to 6.74 ± 2.83 during the reperfusion period (∼4% above baseline, range: 1.20%–8.35%, P < 0.01).
Figure 5.
Relative changes in μa and μ′s during 6 min of ischemia and 3 min of reperfusion. A and B illustrate the relative (i.e., normalized to baseline) changes in μa and μ′s observed in the 16 subjects studied in the present investigation. Changes in μa and μ′s were significant at both the end of ischemia and the peak of reperfusion. C shows the ratio of relative changes in μ′s vs. μa. Relative changes in μa were always greater than that of μ′s, and as a result, the ratio of μ′s (as a percentage of the baseline value; %BL) vs. μa (as a %BL) increased during ischemia and then rapidly decreased during reperfusion. Data are presented as means ± SD. μa, absorption coefficient; μ′s, scattering coefficient.
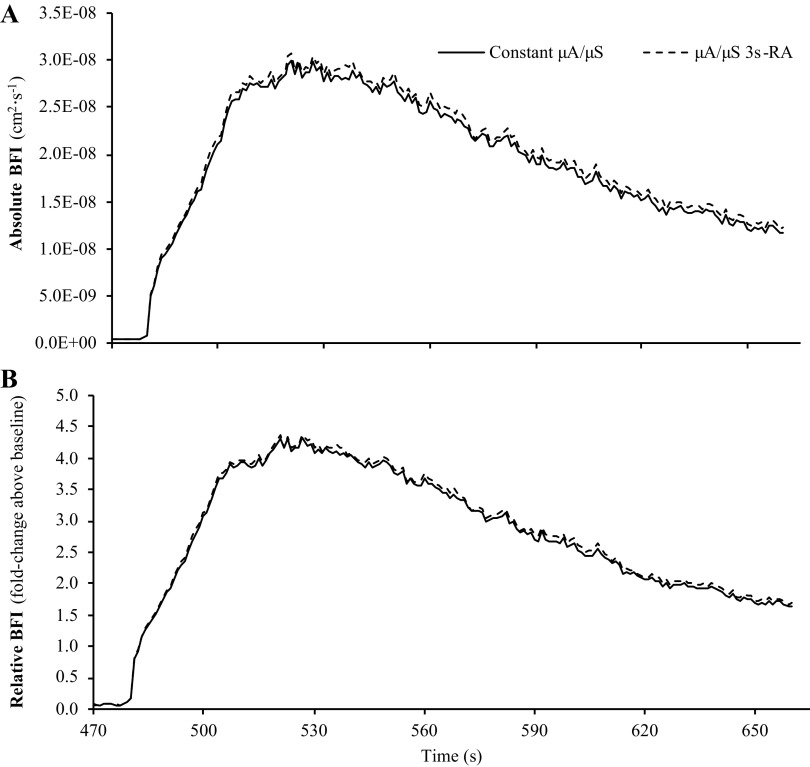
As shown in Fig. 6, despite these changes in tissue optical properties, BFI calculations that assumed constant μa/μ′s versus BFI calculations that accounted for changes in μa/μ′s using a 3-s rolling average were not different at baseline (0.690 ± 0.449 vs. 0.693 ± 0.451 cm2/s; P = 0.138) or the peak of reperfusion (3.47 ± 2.55 vs. 3.56 ± 2.71 cm2/s; P = 0.077). Mean BFI slope was also not different between the two calculation methods when expressed in absolute terms (P = 0.244). Accordingly, no differences were observed between the two calculation methods for peak BFI (P = 0.151) or mean BFI slope (P = 0.445) when expressed in relative units (% or fold change above baseline).
Figure 6.
Impact of assuming constant μa and μ′s vs. accounting for changes in μa and μ′s on calculations of BFI. Part 2 of our analysis compared BFI calculations that assumed constant μa and μ′s throughout the reactive hyperemia test vs. calculations that accounted for changes in μa and μ′s using a 3-s rolling average (3sRA). Regardless of whether BFI was expressed in absolute (A) or relative units (B), there were no differences between calculation methods for baseline BFI, peak BFI during reperfusion, or mean BFI slope during reperfusion. Data are presented as means (n = 16) with standard error bars omitted to maintain illustrative clarity. BFI, blood flow index; μa, absorption coefficient; μ′s, scattering coefficient.
Analysis Part 3—Impact of Supraphysiological Changes in μa and μ′s
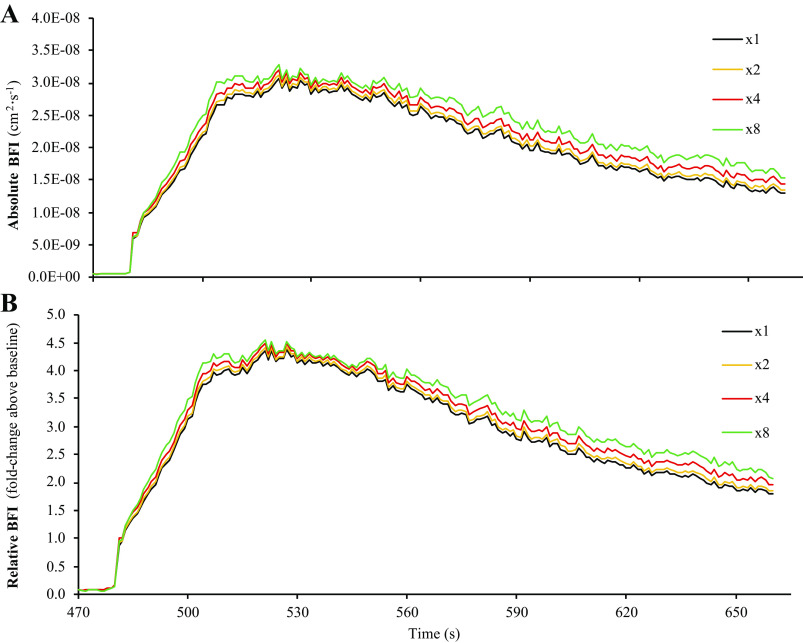
Comparisons of BFI calculations when simulating supraphysiological changes in μa and μ′s are shown in Fig. 7. No main effects were observed for peak BFI (P = 0.752) or mean BFI slope (P = 0.580) when expressed in absolute units (cm2/s). Accordingly, no main effects were observed for peak BFI (P = 0.752) or mean BFI slope (P = 0.331) when normalized to baseline and expressed in relative units (% or fold change above baseline).
Figure 7.
Simulating the effects of supraphysiological changes in μa and μ′s on calculations of BFI during postocclusive reperfusion. Part 3 of our analysis simulated the effect(s) that supraphysiological changes in μa and μ′s have on calculations of BFI. Briefly, changes in μa and μ′s observed during ischemia and reperfusion were augmented by scaling factors of 1 (i.e., control values), 2, 4, or 8 (see Fig. 1 for illustrated description), which allowed us to determine whether the magnitude of changes in μa and μ′s can affect absolute and relative BFI calculations, or put another way, whether or not BFI calculations across subjects could be affected by how great of a change in μa and μ′s was observed. As shown in A and B, at the group mean level, supraphysiological changes in μa and μ′s tend to have a small impact on calculations of BFI. Data are presented as means (n = 16) with standard error bars omitted to maintain illustrative clarity. BFI, blood flow index; μa, absorption coefficient; μ′s, scattering coefficient.
Analysis Part 4—Individual Effects of μa versus μ′s on Calculations of BFI
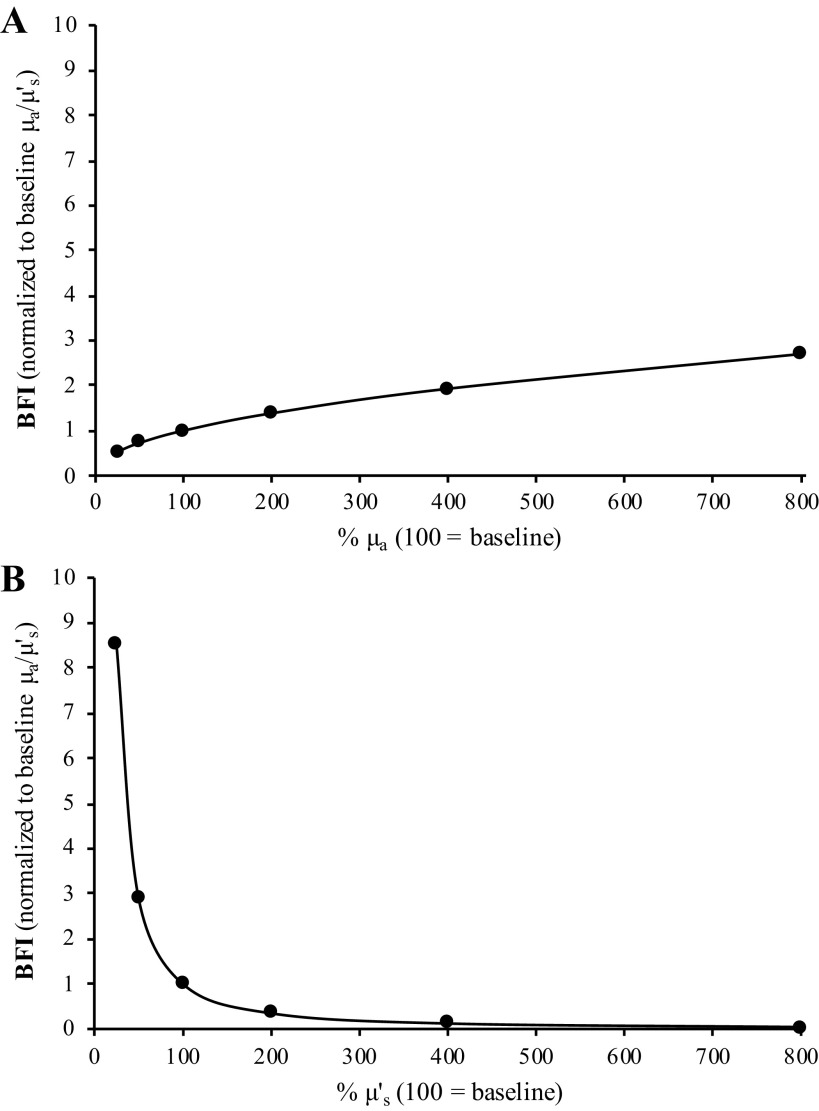
Part 4 of the analysis simulated how changes in just one optical property (i.e., changing only μa or μ′s at a time) affect calculations of BFI. As shown in Fig. 8, an eightfold increase in μa causes an approximately threefold increase in BFI, whereas only a 50% decrease in μ′s is needed to obtain the same effect. For both μa and μ′s, there was a main effect of % change in optical property value on calculations of BFI (P < 0.001, both), with post hoc analysis indicating that all six BFI calculations were different from one another for both μa and μ′s (P < 0.01, all).
Figure 8.
Differential impact of changes in μa and μ′s on calculations of BFI. Part 4 of our analysis examined how changes in only one optical property (i.e., μa or μ′s) affect relative calculations of BFI. In both A and B, “100” indicates 100% of the baseline value for the respective optical property (i.e., the measured value). As shown in A, an 800% increase in μa causes a threefold increase in BFI, whereas an 800% increase in μ′s causes BFI to decline by ∼96%. Alternatively, just a 50% decrease in μ′s causes BFI to increase threefold, whereas a 50% decrease in μa causes BFI to only decline by only 28%. Thus, these simulations highlight the fact that changes in μ′s have a greater relative impact on BFI calculations than changes in μa. In addition, A and B demonstrate that changes in μa and μ′s have opposing effects on BFI calculations, with decreases in μa leading to decreases in BFI but decreases in μ′s causing BFI to increase. Mean data from the 16 subjects presented. BFI, blood flow index; μa, absorption coefficient; μ′s, scattering coefficient.
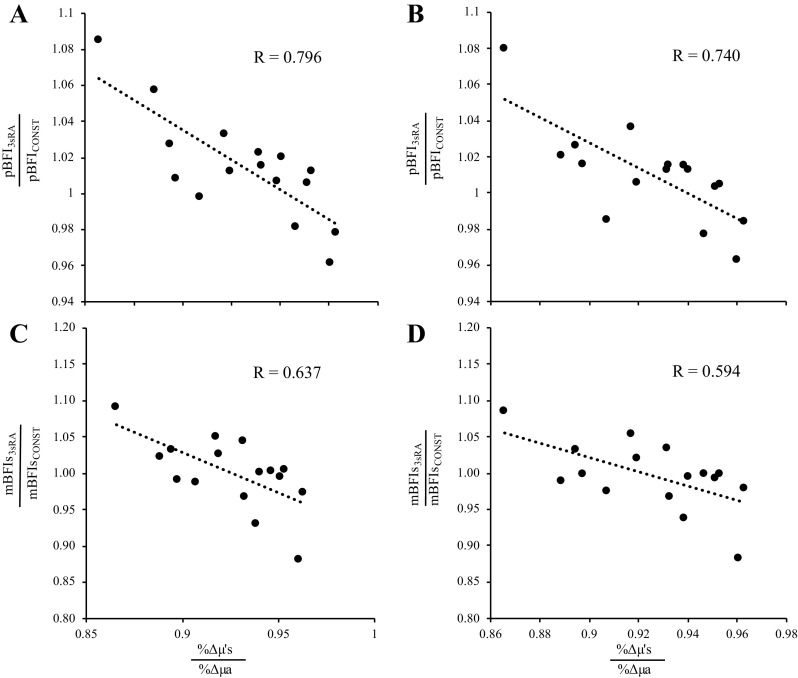
Given that: 1) we observed a strong relationship between baseline μa and mean ½ skinfold thickness, and 2) changes in μ′s have a relatively larger impact on BFI calculations than changes in μa, we investigated how the relative change in μ′s versus μa (i.e., %Δμ′s/%Δμa) affected changes in peak BFI during reperfusion. As shown in Fig. 9, the relative change in peak BFI from analysis part 2 was strongly related to the relative change in μ′s versus μa, regardless of whether BFI was expressed in absolute (P = 0.001, R = 0.796) or relative (P = 0.001, R = 0.740) units. The relative change in mean BFI slope from analysis part 2 was also strongly related to the relative change in μ′s versus μa, regardless of whether BFI was expressed in absolute (P = 0.008, R = 0.637) or relative (P = 0.015, R = 0.594) units.
Figure 9.
Peak BFI is affected by the relative change in μ′s compared to the relative change in μa. Regardless of whether BFI was expressed in absolute (cm2/s, A) or relative (% baseline, B) units, the relative change in peak BFI from analysis part 2 was a function of the relative change in μ′s vs. μa. Specifically, relative changes in μ′s and μa (%Δμ′s and %Δμa, respectively) were calculated in each subject as the peak value observed during reperfusion divided by the value observed at baseline. To compare how relative changes in %Δμ′s vs. %Δμa affect calculations of BFI, we divided the peak BFI observed during reperfusion when using a 3-s rolling average of μ′s and μa to calculate BFI (pBFI3sRA) by the peak BFI observed during reperfusion when using the constant values of μ′s and μa (pBFICONST) observed in each subject at baseline. In all subjects, the relative change in μa was greater than that of μ′s, which is why all x-axis values are less than 1. However, as shown by the dashed trendline, when comparing peak BFI from the 3sRA simulation to the peak BFI from the constant μa and μ′s simulation, the change in peak BFI was strongly related to the relative change in μ′s vs. μa (P = 0.001 for both C and D). Thus, although peak BFI increased by 6%–8% in some subjects, it decreased by 3%–4% in others, resulting in a 12% swing/change in peak BFI across all subjects. Similarly, the change in mean BFI slope (mBFIs; i.e., the rate of microvascular reperfusion after cuff release) was also strongly related to the relative change in μ′s vs. μa, regardless of whether mBFIs was calculated in absolute (C, P = 0.008) or relative (D, P = 0.015) terms. BFI, blood flow index; μa, absorption coefficient; μ′s, scattering coefficient.
Consequently, we performed one final analysis in part 4, where we only scaled changes in one optical property at a time (i.e., μa or μ′s). When changes in μa were scaled, but changes in μ′s were not, there was a main effect of % change in μa for absolute peak BFI (Fig. 10; main effect P = 0.001) and relative peak BFI (main effect P = 0.001), with all comparisons being different from one another (P < 0.05, all) except for ×0.25 versus ×0.5 in absolute terms (cm2/s; P = 0.126) and relative terms (% baseline; P = 0.232). There was also a main effect for mean BFI slope in both absolute (P = 0.002) and relative (P = 0.001) terms, with all comparisons being different from one another (P < 0.05, all) except for ×0.25 versus ×0.5 in absolute terms (cm2/s; P = 0.146).
Figure 10.
Augmenting the relative change in only μa or μ′s affects peak BFI and mean BFI slope observed during postocclusive reperfusion. For analysis part 4, we scaled changes in only one optical property at a time (i.e., μa or μ′s). Scaling only μa significantly affected both peak BFI (A) and mean BFI slope (B), even when expressed in relative terms (i.e., % baseline; %BL). Similarly, scaling only μ′s also affected both peak BFI (C) and mean BFI slope (D), even when expressed in relative terms. Because only one optical property was scaled at a time, these data highlight that it is the relative change in μa vs. μ′s that dictates how changes in tissue optical properties will affect calculations of BFI. BFI, blood flow index; μa, absorption coefficient; μ′s, scattering coefficient.
Similarly, when changes in μ′s were scaled, but changes in μa were not, there was a main effect of % change in μ′s for absolute peak BFI (Fig. 10; main effect P = 0.001) and relative peak BFI (main effect P = 0.001), with all comparisons being different from one another (P < 0.05, all) except for ×0.25 versus ×0.5 in absolute terms (cm2/s; P = 0.307) and relative terms (% baseline; P = 0.398). There was also a main effect for mean BFI slope in both absolute (P = 0.001) and relative (P = 0.001) terms, with all comparisons being different from one another (P < 0.05, all).
DISCUSSION
The purpose of this investigation was to examine how changes in tissue optical properties, μa and μ′s, affect calculations of tissue BFI during reactive hyperemia testing. The critical findings of this comprehensive analysis are fourfold. First, large changes and/or differences in μa and μ′s values can affect calculations of BFI when expressed in absolute unit of cm2/s, but these differences are almost entirely abolished by normalizing the absolute BFI values to the mean resting baseline value. Second, group mean calculations of BFI are similar when integrated using constant values for μa and μ′s that are measured at baseline versus μa and μ′s values that are continuously measured and updated using a 3-s rolling average. Third, consistent with our second observation, group mean BFI and reperfusion kinetics remain similar to control conditions, even when the change in μa and μ′s during the reactive hyperemia is doubled. Lastly, we show that individual changes in μa versus μ′s markedly impact the calculation of peak BFI and BFI reperfusion slopes.
Baseline μa and μ′s values measured at the 690 and 830 nm wavelengths in the present study are consistent with those previously reported for healthy young men and women by Hammer et al., as are the relative changes in μa and μ′s observed at the 830 nm wavelength during the 6 min of ischemia and 3 min of reperfusion (16). The time course and peak BFI values observed during part 2 of our analysis were also consistent with other studies that have used NIR-DCS to measure microvascular reperfusion hemodynamics in forearm tissue (2, 3, 7).
When calculating BFI in real time, many diffuse correlation spectrometers assume that μa and μ′s are consistent across subjects and do not change during a given physiological investigation. In contrast to this assumption, interindividual μa and μ′s values at the 830 nm wavelength can vary considerably. Importantly, intersubject differences in baseline μa were strongly related to ½ skinfold thickness, which is to be expected given that a thinner cutaneous and subcutaneous thickness should lead to a greater muscle volume beneath the NIR-DCS probe, and therefore, a greater volume occupied by photon-absorbing chromophores such as hemoglobin and myoglobin. Accordingly, Part 1 of our analysis demonstrated that incorrectly assuming constant values for μa and μ′s can have a substantial effect on calculations of BFI when expressed in absolute units of cm2/s. However, these differences are almost entirely abolished after normalizing calculations of BFI to baseline (i.e., expressed in relative units). These data suggest that a priori knowledge of an individual subject’s μa/μ′s is not required when using constant values of μa and μ′s to quantify BFI, as long as measures of BFI during the physiological provocations (i.e., reactive hyperemia, exercise) are normalized to the BFI observed during the resting baseline period.
This latter conclusion, however, assumes that tissues μa and μ′s remain constant throughout the duration of a given physiological provocation. That μa and μ′s changed significantly during both the cuff ischemia and reperfusion phases of the present investigation refutes this assumption. Consequently, parts 2 and 3 of our analysis examined whether the changes in μa and μ′s observed during ischemia and reperfusion were sufficient to alter absolute and relative calculations of BFI. Although changes in μa and μ′s do affect calculations of BFI when expressed in absolute units of cm2/s, the differences were statistically nonsignificant at the group mean level. Part 3 of our analysis further demonstrated that even supraphysiological changes in μa and μ′s tend to have a relatively small effect on group mean values for absolute and relative calculations of BFI.
However, the group mean responses from parts 2 and 3 masked large intersubject variations. Specifically, when BFI calculations accounted for changes in μa and μ′s, peak BFI increased in some subjects but decreased in others. Thus, group means for peak BFI and mean BFI slope were similar for the constant–μa/μ′s and rolling average–μa/μ′s methods because intersubject variations averaged each other out. The reason for this effect is illustrated in Fig. 8. When changes in μa and μ′s are directionally similar (i.e., both increase and decrease), their mathematical effects on BFI calculations oppose one another. Therefore, with regard to how changes in μa and μ′s affect NIR-DCS calculations of BFI, what is truly important is the magnitude by which μa changes relative to μ′s. Accordingly, we observed a strong relationship between the relative change in peak BFI and the relative change in μ′s/μa (Fig. 9), which further indicates that accounting for changes in μa and μ′s can shift calculations of peak BFI by as much as 12% across subjects. Mean BFI slope was also affected by as much as 20% across subjects. Moreover, when only one optical property (μa or μ′s) was allowed to change in the simulated calculations of BFI (analysis part 4), peak BFI and mean BFI slope observed during reperfusion were both markedly different across simulations, regardless of whether they were expressed in absolute or relative terms (Fig. 10). With that being said, although a 12%–20% shift in peak BFI or mean BFI slope is certainly biologically relevant, we cannot conclude that accounting for changes in μa and μ′s improved the accuracy of NIR-DCS BFI measurements because we did not obtain simultaneous measures of muscle perfusion from a gold standard method, such as arterial spin labeling MRI (21). Future studies are therefore needed to address this remaining gap in skeletal muscle NIR-DCS literature. Although NIR-DCS measures of cerebral blood flow have indeed been validated several times (22–25), to the best of our knowledge, only one study has directly validated the use of NIR-DCS in human skeletal muscle using a direct microvascular perfusion approach (21).
Limitations
This study is not without limitation. First, although our DCS device calculated BFI at the 850 nm wavelength, changes in tissue μa and μ′s were estimated from NIRS measurements of μa and μ′s at the 830 nm wavelength. Given the close wavelength proximity and that neither wavelength is substantially affected by changes in oxy- or deoxy-heme content, we do not think this substitution significantly impacted our results. In contrast, other DCS instruments have calculated BFI using long coherence lasers that emit photons in the 785 nm wavelength region (2, 5, 6, 21, 26). Our results suggest that changes in tissue μa and μ′s are similar for wavelengths in the 785–830 nm region, but more direct work using raw DCS data (i.e., G1 values and/or normalized light intensity autocorrelations) measured at shorter wavelengths will be necessary to validate this conclusion. In contrast, changes in μa and μ′s were much greater in the 670–750 nm region, presumably because those wavelengths are more affected by changes in oxy- and deoxy-heme content. Once again, although our results suggest that not accounting for changes in μa and μ′s can affect BFI calculations at these shorter wavelengths, further investigation is necessary to confirm or refute this conclusion.
Conclusions
In summary, our results demonstrate that baseline optical properties vary considerably across subjects, as do the relative changes in optical properties during physiological provocation. Although accounting for changes in μa and μ′s did not appear to affect BFI calculations at the group mean level, there was indeed marked intersubject variability. Overall, these results provide support for past reports in which μa/μ′s were held constant and calculations of BFI were expressed in relative terms. However, the intersubject variability in the magnitude by which changes in μa/μ′s affected BFI calculations suggests that accounting for changes in μa/μ′s in real time may be necessary moving forward.
GRANTS
This work was supported by the generous contributions made by the Potratz Family, the Nagy Family Endowment, the NIH (R15HL140989), and the University of Arlington Kinesiology Department.
DISCLOSURES
D.M. Hueber is employed by ISS Inc., the manufacturer of the near-infrared diffuse correlation spectroscopy device used in this investigation. We confirm that we have read the journal’s position on issues involved in ethical publication and affirm that this report is consistent with those guidelines. None of the other authors has any conflicts of interest, financial or otherwise, to disclose.
AUTHOR CONTRIBUTIONS
M.F.B., S.M.J., D.M.H., and M.D.N. conceived and designed research; M.F.B. performed experiments; M.F.B., S.M.J., and M.D.N. analyzed data; M.F.B., S.M.J., D.M.H., and M.D.N. interpreted results of experiments; M.F.B. prepared figures; M.F.B., S.M.J., D.M.H., and M.D.N. drafted manuscript; M.F.B., S.M.J., D.M.H., and M.D.N. edited and revised manuscript; M.F.B., S.M.J., D.M.H., and M.D.N. approved final version of manuscript.
ACKNOWLEDGMENTS
We thank Andrew Oneglia, Manall Jaffery, and Shayla Manitowabi-Huebner for help with data collections.
REFERENCES
- 1.Tucker WJ, Rosenberry R, Trojacek D, Chamseddine H, Arena-Marshall C, Zhu Y, Wang J, Kellawan J, Haykowsky M, Tian F, Nelson M. Studies into the determinants of skeletal muscle oxygen consumption: novel insight from near-infrared diffuse correlation spectroscopy. J Physiol 597: 2887–2901, 2019. doi: 10.1113/JP277580. [DOI] [PMC free article] [PubMed] [Google Scholar]
- 2.Ichinose M, Nakabayashi M, Ono Y. Difference in the integrated effects of sympathetic vasoconstriction and local vasodilation in human skeletal muscle and skin microvasculature. Physiol Rep 7: e14070, 2019. doi: 10.14814/phy2.14070. [DOI] [PMC free article] [PubMed] [Google Scholar]
- 3.Ichinose M, Nakabayashi M, Ono Y. Sympathoexcitation constrains vasodilation in the human skeletal muscle microvasculature during postocclusive reactive hyperemia. Am J Physiol Heart Circ Physiol 315: H242–H253, 2018. doi: 10.1152/ajpheart.00010.2018. [DOI] [PubMed] [Google Scholar]
- 4.Bartlett M, Oneglia A, Jaffery M, Manitowabi-Huebner S, Hueber D, Nelson M. Kinetic differences between macro- and microvascular measures of reactive hyperemia. J Appl Physiol 129: 1183–1192, 2020.doi: 10.1152/japplphysiol.00481.2020. [DOI] [PMC free article] [PubMed] [Google Scholar]
- 5.Baker WB, Li Z, Schenkel SS, Chandra M, Busch DR, Englund EK, Schmitz KH, Yodh AG, Floyd TF, Mohler ER. 3rd.. Effects of exercise training on calf muscle oxygen extraction and blood flow in patients with peripheral artery disease. J Appl Physiol (1985) 123: 1599–1609, 2017. doi: 10.1152/japplphysiol.00585.2017. [DOI] [PMC free article] [PubMed] [Google Scholar]
- 6.Bangalore-Yogananda C-G, Rosenberry R, Soni S, Liu H, Nelson MD, Tian F. Concurrent measurement of skeletal muscle blood flow during exercise with diffuse correlation spectroscopy and Doppler ultrasound. Biomed Opt Express 9: 131–141, 2018. doi: 10.1364/BOE.9.000131. [DOI] [PMC free article] [PubMed] [Google Scholar]
- 7.Didier KD, Hammer SM, Alexander AM, Caldwell JT, Sutterfield SL, Smith JR, Ade CJ, Barstow TJ. Microvascular blood flow during vascular occlusion tests assessed by diffuse correlation spectroscopy. Exp Physiol 105: 201–210, 2020. doi: 10.1113/EP087866. [DOI] [PubMed] [Google Scholar]
- 8.Gurley K, Shang Y, Yu G. Noninvasive optical quantification of absolute blood flow, blood oxygenation, and oxygen consumption rate in exercising skeletal muscle. J Biomed Opt 17: 075010, 2012. doi: 10.1117/1.JBO.17.7.075010. [DOI] [PMC free article] [PubMed] [Google Scholar]
- 9.Rosenberry R, Tucker WJ, Haykowsky MJ, Trojacek D, Chamseddine HH, Arena-Marshall CA, Zhu Y, Wang J, Kellawan JM, Tian F, Nelson MD. Determinants of skeletal muscle oxygen consumption assessed by near-infrared diffuse correlation spectroscopy during incremental handgrip exercise. J Appl Physiol 127: 698–706, 2019. doi: 10.1152/japplphysiol.00273.2019. [DOI] [PMC free article] [PubMed] [Google Scholar]
- 10.Shang Y, Gurley K, Symons B, Long D, Srikuea R, Crofford LJ, Peterson CA, Yu G. Noninvasive optical characterization of muscle blood flow, oxygenation, and metabolism in women with fibromyalgia. Arthritis Res Ther 14: R236, 2012. doi: 10.1186/ar4079. [DOI] [PMC free article] [PubMed] [Google Scholar]
- 11.Shang Y, Gurley K, Yu G. Diffuse correlation spectroscopy (dcs) for assessment of tissue blood flow in skeletal muscle: recent progress. Anat Physiol 3: 128, 2013. doi: 10.4172/2161-0940.1000128. [DOI] [PMC free article] [PubMed] [Google Scholar]
- 12.Tucker WJ, Rosenberry R, Trojacek D, Sanchez B, Bentley RF, Haykowsky MJ, Tian F, Nelson MD. Near-infrared diffuse correlation spectroscopy tracks changes in oxygen delivery and utilization during exercise with and without isolated arterial compression. Am J Physiol Regul Integr Comp Physiol 318: R81–R88, 2020. doi: 10.1152/ajpregu.00212.2019. [DOI] [PMC free article] [PubMed] [Google Scholar]
- 13.Boas DA, Yodh AG. Spatially varying dynamical properties of turbid media probed with diffusing temporal light correlation. J Opt Soc Am A 14: 192–215, 1997. doi: 10.1364/JOSAA.14.000192. [DOI] [Google Scholar]
- 14.Durduran T, Choe R, Baker WB, Yodh AG. Diffuse optics for tissue monitoring and tomography. Rep Prog Phys 73: 0766701, 2010. doi: 10.1088/0034-4885/73/7/076701. [DOI] [PMC free article] [PubMed] [Google Scholar]
- 15.Durduran T, Yodh AG. Diffuse correlation spectroscopy for non-invasive, micro-vascular cerebral blood flow measurement. NeuroImage 85 Pt 1: 51–63, 2014. doi: 10.1016/j.neuroimage.2013.06.017. [DOI] [PMC free article] [PubMed] [Google Scholar]
- 16.Hammer SM, Hueber DM, Townsend DK, Huckaby LM, Alexander AM, Didier KD, Barstow TJ. Effect of assuming constant tissue scattering on measured tissue oxygenation values during tissue ischemia and vascular reperfusion. J Appl Physiol (1985) 127: 22–30, 2019. doi: 10.1152/japplphysiol.01138.2018. [DOI] [PubMed] [Google Scholar]
- 17.Ferreira L, Hueber D, Barstow T. Effects of assuming constant optical scattering on measurements of muscle oxygenation by near-infrared spectroscopy during exercise. J Appl Physiol (1985) 102: 358–367, 2007. doi: 10.1152/japplphysiol.00920.2005. [DOI] [PubMed] [Google Scholar]
- 18.Koga S, Poole DC, Kondo N, Oue A, Ohmae E, Barstow TJ. Effects of increased skin blood flow on muscle oxygenation/deoxygenation: comparison of time-resolved and continuous-wave near-infrared spectroscopy signals. Eur J Appl Physiol 115: 335–343, 2015. doi: 10.1007/s00421-014-3019-2. [DOI] [PubMed] [Google Scholar]
- 19.Bezanson J, Edelman A, Karpinski S, Shah VB. Julia: a fresh approach to numerical computing. SIAM Rev 59: 65–98, 2017. doi: 10.1137/141000671. [DOI] [Google Scholar]
- 20.Lin W, Busch D, Goh C, Barsi J, Floyd T. Diffuse correlation spectroscopy analysis implemented on a field programmable gate array. IEEE Access 7: 122503–122512, 2019. doi: 10.1109/ACCESS.2019.2938085. [DOI] [PMC free article] [PubMed] [Google Scholar]
- 21.Yu G, Floyd TF, Durduran T, Zhou C, Wang J, Detre JA, Yodh AG. Validation of diffuse correlation spectroscopy for muscle blood flow with concurrent arterial spin labeled perfusion MRI. Opt Express 15: 1064–1075, 2007. doi: 10.1364/OE.15.001064. [DOI] [PubMed] [Google Scholar]
- 22.Durduran T, Yu G, Burnett MG, Detre JA, Greenberg JH, Wang J, Zhou C, Yodh AG. Diffuse optical measurement of blood flow, blood oxygenation, and metabolism in a human brain during sensorimotor cortex activation. Opt Lett 29: 1766, 2004. doi: 10.1364/OL.29.001766. [DOI] [PubMed] [Google Scholar]
- 23.Durduran T, Zhou C, Buckley EM, Kim MN, Yu G, Choe R, Gaynor JW, Spray TL, Durning SM, Mason SE, Montenegro LM, Nicolson SC, Zimmerman RA, Putt ME, Wang J, Greenberg JH, Detre JA, Yodh AG, Licht DJ. Optical measurement of cerebral hemodynamics and oxygen metabolism in neonates with congenital heart defects. J Biomed Opt 15: 037004, 2010. doi: 10.1117/1.3425884. [DOI] [PMC free article] [PubMed] [Google Scholar]
- 24.Jain V, Buckley EM, Licht DJ, Lynch JM, Schwab PJ, Naim MY, Lavin NA, Nicolson SC, Montenegro LM, Yodh AG, Wehrli FW. Cerebral oxygen metabolism in neonates with congenital heart disease quantified by MRI and optics. J Cereb Blood Flow Metab 34: 380–388, 2014. [DOI] [PMC free article] [PubMed] [Google Scholar]
- 25.Kim MN, Durduran T, Frangos S, Edlow BL, Buckley EM, Moss HE, Zhou C, Yu G, Choe R, Maloney-Wilensky E, Wolf RL, Grady MS, Greenberg JH, Levine JM, Yodh AG, Detre JA, Kofke WA. Noninvasive measurement of cerebral blood flow and blood oxygenation using near-infrared and diffuse correlation spectroscopies in critically brain-injured adults. Neurocrit Care 12: 173–180, 2010. doi: 10.1007/s12028-009-9305-x. [DOI] [PMC free article] [PubMed] [Google Scholar]
- 26.Li Z, Baker WB, Parthasarathy AB, Ko TS, Wang D, Schenkel S, Durduran T, Li G, Yodh AG. Calibration of diffuse correlation spectroscopy blood flow index with venous-occlusion diffuse optical spectroscopy in skeletal muscle. J Biomed Opt 20: 125005, 2015. doi: 10.1117/1.JBO.20.12.125005. [DOI] [PMC free article] [PubMed] [Google Scholar]


