

Abstract
Elucidating the effects of mechanical stimulation on bone repair is crucial for optimization of the healing process. Specifically, the regulatory role that mechanical loading exerts on the osteogenic stem cell pool and vascular morphology during healing is incompletely understood. As dynamic loading has been shown to enhance osteogenesis and repair, we hypothesized that loading induces the expansion of the osteoprogenitor cell population within a healing bone defect, leading to an increased presence of osteogenic cells. We further hypothesized that loading during the repair process regulates vascular and collagen matrix morphology and spatial interactions between vessels and osteogenic cells. To address these hypotheses, we used a mechanobiological bone repair model, which produces a consistent and reproducible intramembranous repair response confined in time and space. Bilateral tibial defects were created in adult C57BL/6 mice, which were subjected to axial compressive dynamic loading either during the early cellular invasion phase on post-surgical days (PSD) 2–5 or during the matrix deposition phase on PSD 5–8. Confocal and two-photon microscopy was used to generate high-resolution 3D renderings of longitudinal thick sections of the defect on PSD 10. Endomucin (EMCN)-positive vessels, Prrx1+ Sca-1+ primitive osteoprogenitors (OPCs), and Osx+ preosteoblasts were visualized and quantified using deep tissue immunohistochemistry. New bone matrix was visualized with second harmonic generation autofluorescence of collagen fibers. We found that mechanical loading during the matrix deposition phase (PSD 5–8) increased vessel volume and number, and aligned vessels and collagen fibers to the load-bearing direction of bone. Furthermore, loading led to a significant increase in the proliferation and number of Prrx1+ Sca-1+ primitive OPCs, but not Osx+ preosteoblasts within the defect. Together, these data illustrate the adaptation of both collagen matrix and vascular morphology to better withstand mechanical load during bone repair, and that the mechanoresponsive cell population consists of the primitive osteogenic progenitors.
Keywords: Bone repair, mechanobiology, stem cells, osteoprogenitors, angiogenesis
Introduction
Bone fractures reduce quality of life, increase mortality, and are associated with an economic burden of $19 billion/year in the US(1). A common complication of fractures is non-union resulting from poor vascularization(2). Angiogenesis, the process by which new vessels emerge from existing vessels, is critical for normal skeletal development, homeostasis, and repair. Inhibition of angiogenesis completely abolished new bone formation at the fracture site in rats(3). Conversely, biochemical enhancement of angiogenesis accelerated fracture healing in mice(4,5). Mechanical stimulation has been shown to regulate angiogenic sprouting (6) and morphogenesis of the vascular network (7) in vitro. In vivo, high strains imposed early in the bone repair process have been shown to disrupt the vascular network (8).
In bone, mechanical loading regulates bone structure(9) as well as collagen fiber orientation(10) under homeostatic conditions. In a healing defect, mechanical loading in the form of weight-bearing(8) and cyclic axial compressive loading(11) have been shown to enhance repair when applied during the matrix deposition phase, while loading at the hematoma and cell invasion phases of bone repair inhibit the healing process(8,12). In addition, mechanical cues can directly influence the assembly, composition and architecture of the extracellular matrix,(13) which can have a significant impact cell-matrix interactions.
Bone is a load-bearing organ, and understanding how mechanical stimulation affects the repair process is crucial for successful post-operative rehabilitation. The time-dependent effect of mechanical loading on a bone formation and the process of angiogenesis in a healing defect suggest the processes of angiogenesis and osteogenesis are coupled. Previous work has shown a connection between angiogenesis and the mechanical environment of the extracellular matrix (14). Also, hemodynamic forces have been shown to regulate bone growth during development (15). However, the mechanisms governing interactions between OPCs and ECs within the regenerate, and morphological changes of both the newly formed collagen matrix and the vascular network that is perfused throughout this transient tissue, is incompletely understood in the context of mechanical loading.
At the cellular level, osterix positive (Osx+) preosteoblasts are associated with vessels expressing high levels of CD31 and EMCN (type H vessels), which mediate angiogenesis in the bone marrow(16). Recent studies have shown that Osx+ cells migrate to the site of injury together with vascular infiltration(17). When the potent pro-angiogenic factor VEGF is genetically deleted in Osx+ cells, bone repair is greatly diminished, but was not completely absent(18), suggesting there are additional factors that support angiogenesis in its absence. During tissue repair, OPCs from a variety of tissues induce angiogenesis and are incorporated into blood vessels(19). A subset of OPCs are positive for the Paired related homeobox 1 (Prrx1+) and stem cell antigen-1 positive (Sca-1+), which give rise to Osx+ osteoblast precursors(20,21). Prrx1+ cells, which are primarily located in the periosteum, infiltrate the bone fracture regenerate and differentiate into osteogenic cells(22). This population plays a significant role in bone repair, as ablation of Prrx1+ cells led to impaired fracture healing (23). From a tissue transplant study, progenitors from the periosteum and endosteum have shown differences in their differentiation capacity during bone repair(24). More than 50% of periosteal cells are Sca-1+; they showed osteogenic differentiation potential in vitro, and pro-angiogenic ability in vivo(25). In addition, mice with global knockout of Sca1+ had an osteoporotic phenotype(26). Within a healing long bone defect, the distribution of these key progenitor populations is still unclear. In addition, their responses to mechanical loading are virtually unknown.
In this study, we used an intramembranous long bone repair model which produces a consistent repair response in time and space(27). Bone formation is first observed 5–7 days after surgery with complete mineralized bridging by day 14. This model also allows for controlled dynamic compressive mechanical loading(12). We utilized a three-dimensional (3D), high-resolution imaging platform to observe and quantify the spatiotemporal profile of vascular and osteogenic progenitor cell distributions during healing in 3D space. The volumetric approach is essential to accurately assess the distribution of blood vessels in relation to osteogenic cells during the dynamic process of bone repair. This imaging modality has already provided insights into the distribution of marrow stem cells in relation to blood vessels in physiological conditions (28). This experimental approach allows quantification of 3D vessel geometry, the distribution of osteoprogenitors in relation to vessels, and osteo- and endothelial-progenitor proliferation at the site of repair. Here we utilize an established mechanobiological model of bone repair that makes use of sinusoidal compressive force in the osteogenic range(12). We hypothesize that mechanical loading induces expansion of the OPC population within the healing bone defect, leading to greater numbers of osteogenic cells, which preferentially co-localize with vessels during the long bone repair process.
Materials and methods
Animals
The NYU School of Medicine Institutional Animal Care and Use Committee approved all procedures. Fifty female C57BL/6 mice at 23 weeks of age were purchased from The Jackson Laboratory. They were allowed to acclimate to the NYU animal care facility for 3 weeks before beginning experiments. The mice were group-housed in ventilated cages with bedding and cotton pads, which were changed once per week. Mice were provided with ad libitum access to pelleted feed and water. The mouse facility had 12-hour light/dark cycle at temperature of 65–75 °F, 40–60% humidity. The investigators were not blinded during animal allocation.
Long bone repair model with dynamic mechanical loading
Bilateral tibial cortical defects were created in all mice. This repair model produces a consistent pattern of angiogenesis and revascularization(29,30) in addition to bone matrix deposition(12). This model consists of a 1 mm diameter circular defect on the anterior medial surface of the tibia, created with a precision surgical drill at 23,000 rpm. The defect is between the tibia tuberosity and the distal end of the crest of tibia, 4.3 mm below the articulating surface of the tibia. After washing with saline, the soft tissue was closed over the defect with 5–0 nylon sutures. The mice were kept on 37 °C heating pad until regaining consciousness. In one experiment, mice (N = 3) were euthanized at post-surgical day (PSD) 2, 3, 5, 7, and 10. In a second experiment, compressive dynamic mechanical loading (6 N peak force, 2 Hz sinusoidal, 120 cycles/day) was applied to the right tibia of mice (N = 3) along the long axis as previously described(31), using an ElectroForce horizontal loading system (New Castle, Delaware). Loading was applied either from PSD 2–5 or PSD 5–8 (Fig. 1a), corresponding to the period of cell and vessel invasion, and bone matrix deposition respectively. All tibiae were collected on PSD 10. Strain within cortical bone surrounding the defect is tensile in nature, is oriented in the direction of the long-axis of the bone (direction of loading), and has been estimated to be 400–1000 microstrain(12).
Figure 1. Experiment approached to study the effect of mechanical loading on the repair of monocortical tibial defect.
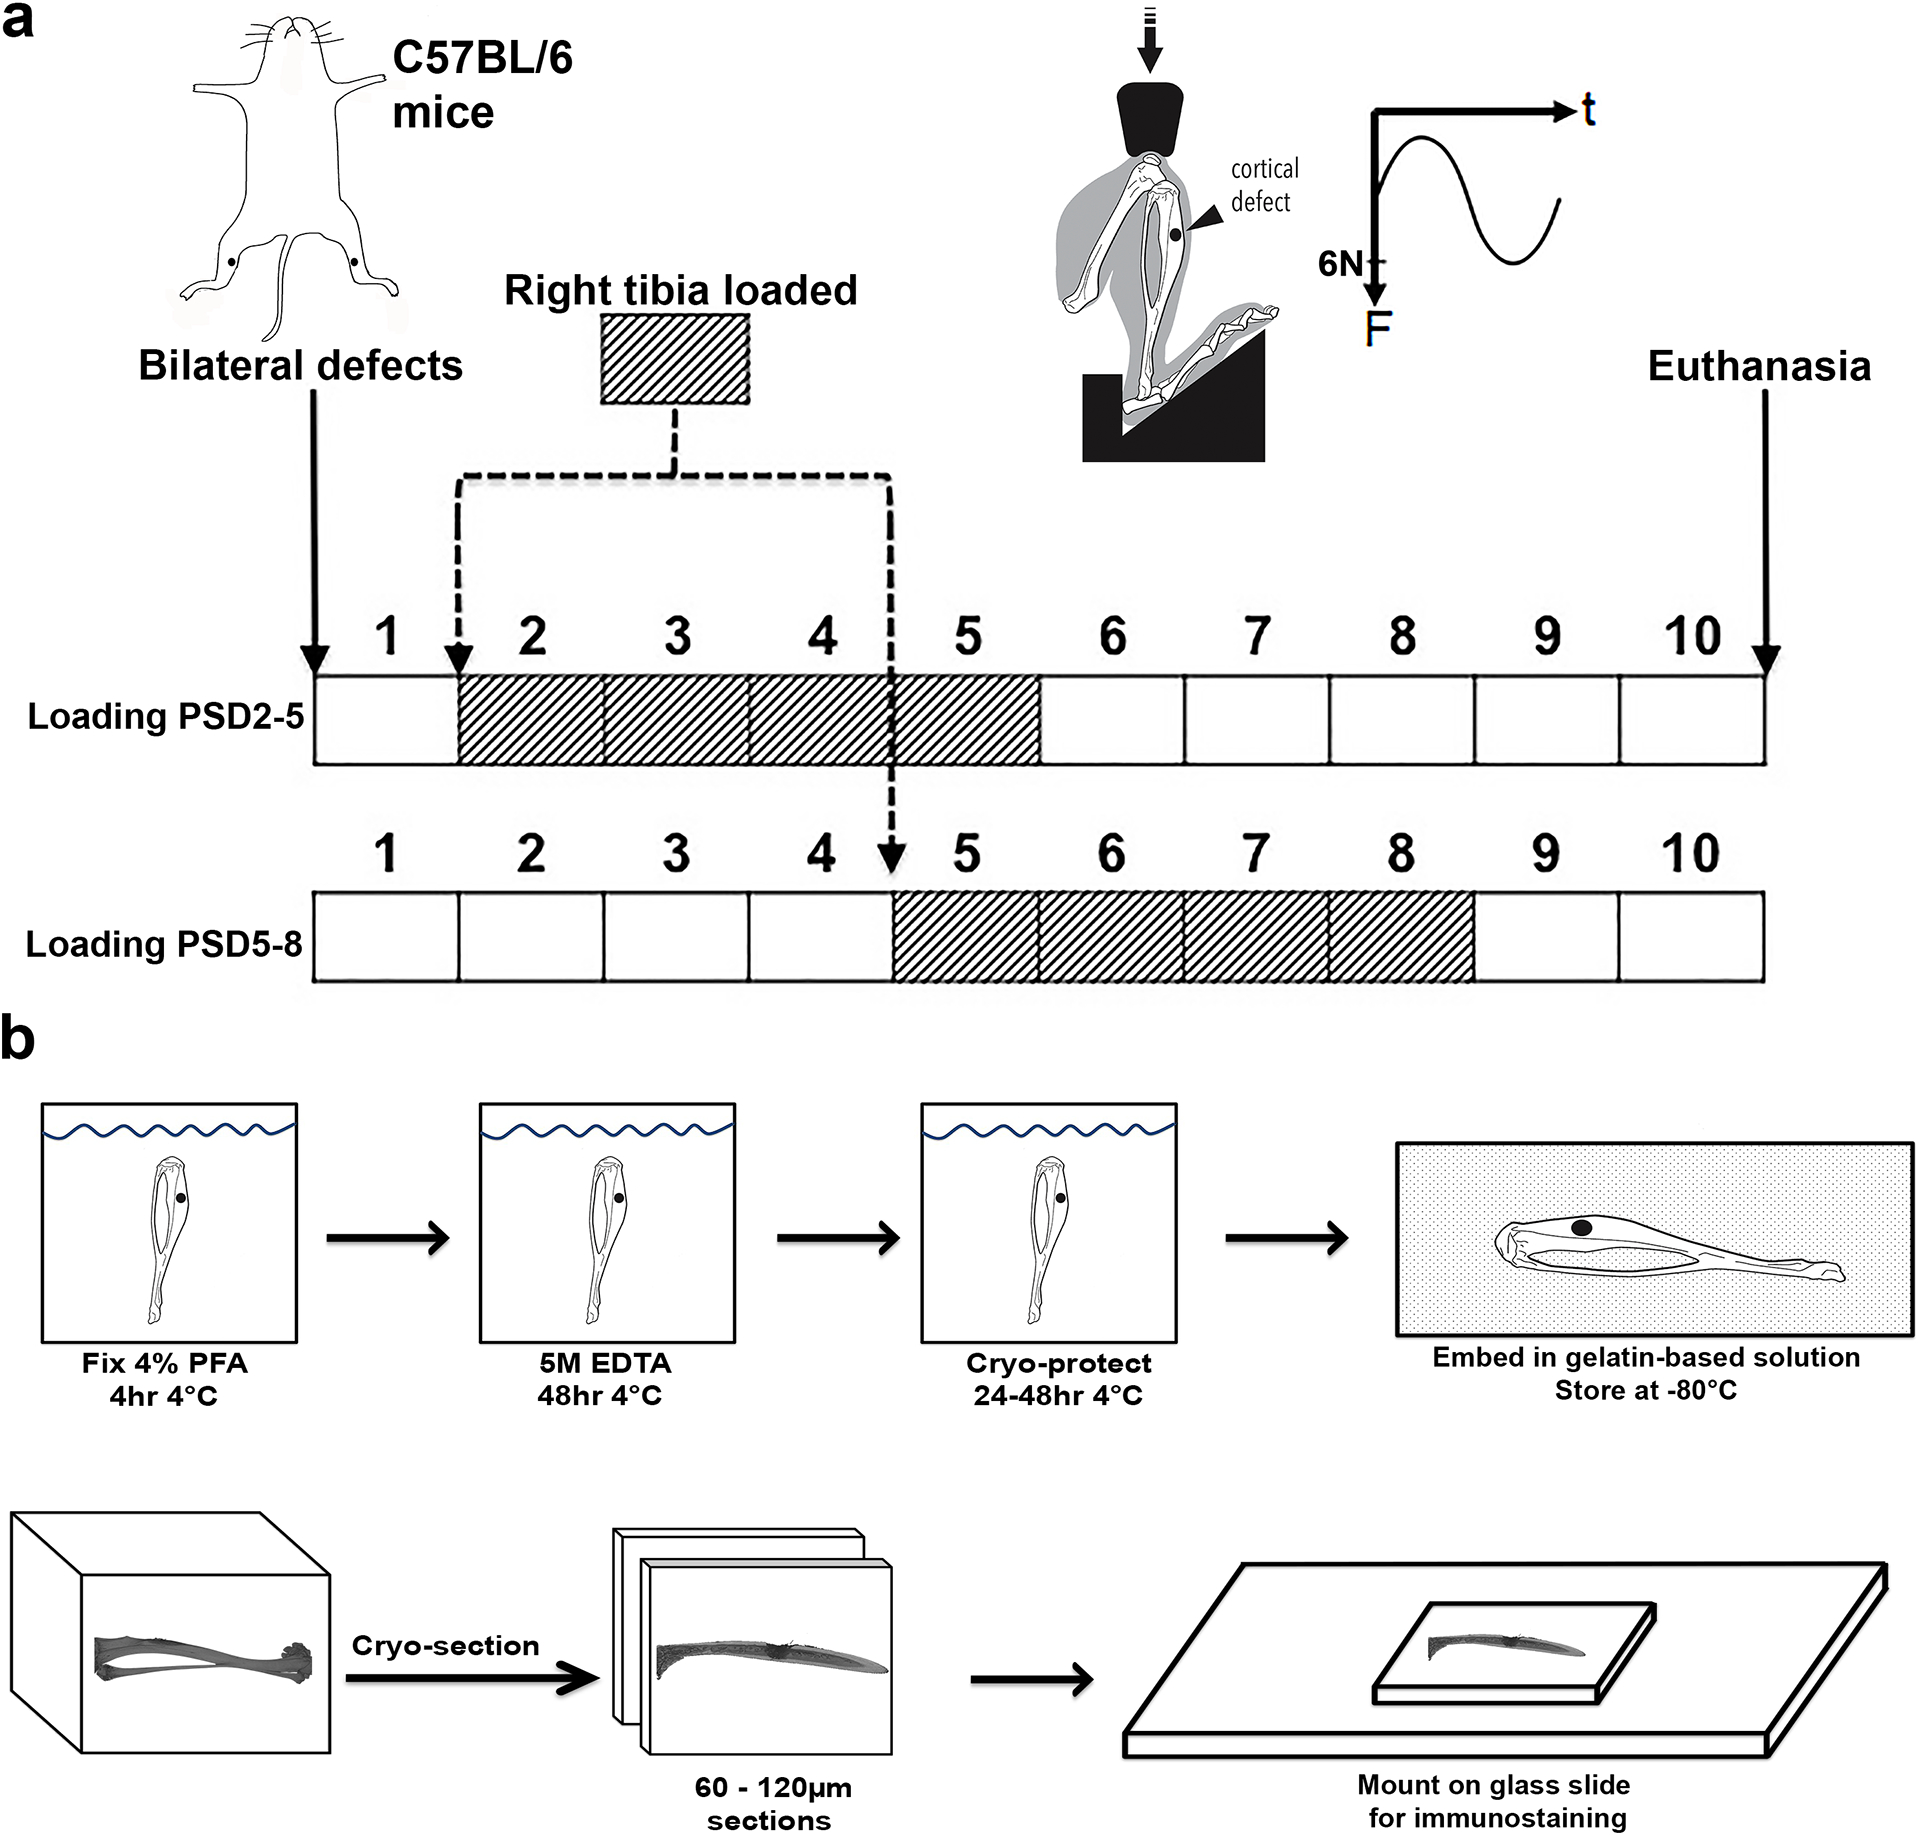
(a) Under anesthesia, bilateral monocortical defects were made in the tibia of C57BL/6 mice. Compressive mechanical loading of 6 N, 2 Hz was applied to the right tibia, with the left serving as control. One group of mice received loaded from post-surgical day (PSD) 2–5, while a separate group received loading on PSD 5–8. Both groups were euthanized on PSD 10. (b) Each tibia was cryo-embedded after fixation and brief decalcification. Then cryo-sections was attached to glass slides for immunostaining.
Immunofluorescent staining of thick sections for cell type markers
Freshly dissected tibiae were fixed in 4% paraformaldehyde at 4°C for 4 hours and decalcified in 0.5 M EDTA, pH 7.5 at 4°C for 36 hours (Fig. 1b). Samples were cryoembedded, thick-sectioned, and stained with primary antibodies against osteoprogenitor marker Osx (1:100, sc-22536-R, Santa Cruz Bio, Dallas, Texas), proliferation marker Ki-67 (1:100, M-19, Santa Cruz, AF7649, R&D Systems), stem cells antigen-1 (Sca-1) (1:100, 14-5981-82, eBioscience, San Diego, California), Paired Related Homeobox 1 (Prrx1) (1:100, ab211292, Abcam, Cambridge, Massachusetts), and endothelial marker EMCN (1:100, V.7C7, Santa Cruz Bio). After three washes with PBS, the samples were stained with Alexa Fluor secondary antibodies from Donkey (1:400, ThermoFisher, Waltham, Massachusetts). Nuclei were stained with DAPI (0.5 μg/ml). The slides were mounted with Fluoromount-G and coverslipped before imaging.
Confocal and two-photon imaging
Three-dimensional fluorescent images were acquired with Zeiss LSM710 laser scanning microscope with both confocal and 2-photon imaging capabilities. A 20x numerical aperture 1.00, Water-immersion Plan-Apochromat objective was used due to its long working distance (1.7 mm). Z-stacks of 110 μm height were taken with a non-descanned detector at a size of 1024×1024 pixels, x–y resolution of 0.415 μm with z-step of 2 μm. The 1 mm defect is imaged by tiling 3 z-stacks, spanning 1275 μm along the long axis of the tibia, from one side of the intact cortical bone to the other. The 2-photon mode was used to image the second harmonic generation of collagen fibers (420–465 nm filter), DAPI (465–500 nm filter), Osx, Prrx1 (520–555 nm filter), and Sca-1 (575–645 nm filter), all using 830 nm excitation provided by a Mai Tai Sapphire laser. The confocal mode was used to image EMCN (650–735 nm filter) with 633 nm excitation provided by a HeNe laser.
3D Image analysis
The z-stacks obtained from two-photon microscopy were rendered in 3D using Bitplane Imaris v7.4.1 and Fiji installed on a HP Z240 Workstation with Intel Xenon E3–1240 Quad-Core processor, 16 GB of RAM, and NVIDIA Quadro K620 graphics card. A volume of interest (VOI) of 600×200×52 μm, and centered within the defect, was selected for analyses. This VOI was chosen to analyze the effect of mechanical loading on multiple tissue types and progenitor cell populations within the healing defect, while excluding interfaces between existing cortical bone and the regenerate, which would have complex mechanical properties that could not be reliably estimated. 3D volumes generated from the VOI were used to segment and quantify vessels (EMCN+), proliferating cells (Ki-67+), osteogenic progenitors (Prrx1+ Sca-1+), and osteoblast precursors (Osx+). The cells were quantified by generating 3D surfaces based on local intensity thresholding. Cells with nuclear staining (Prrx1, Osx, Ki-67) that have overlap in fluorescence signal due to proximity were segmented using the watershed method(32), which effectively separated individual cells, and identified objects with size of 5 microns (i.e. the size of a nucleus). A similar method was used to quantify cells with membrane staining (Sca-1), using a 7-micron cutoff for watershed segmentation. Cells co-expressing Prrx1, Sca-1, Osx and/or Ki-67 were identified when a positive fluorescence signal from corresponding channels was observed. Location, size, surface area, and volume of cells were computed by generating 3D rendered surfaces from immunofluorescence and co-localization data (Supplemental Fig S1, S2). Surfaces were similarly generated for vascular structure, but individual endothelial cells were not segmented. Bone tissue was segmented by thresholding the second harmonic generation data using the same algorithm as that used for vessels.
Quantification of vessel and collagen fiber orientation
A custom MATLAB program was created to quantify the orientation of blood vessels and collagen fibers in the plane that is parallel to the long axis of the tibia. For the EMNC+ blood vessel data set, 3D surfaces were first generated from the maximum intensity projection (MIP). Then a grey-scale z-projection was created from the 3D surfaces at 50% transparency in order to preserve the orientation information of the overlapping vessel. For the collagen fibers, the MIP from the second harmonic generation autofluorescence(33,34) was used to create the grey-scale z-projections. The program first detects the edges within the z-projections to create a binary image. Then a convolution with the Sobel operator(35) was used to compute the orientation of each edge pixel, represented by a value of +90° to −90° in a matrix that has the same dimension as the binary image. From this matrix, a heat map of the pixel-wise orientation could be plotted. In addition to the Sobel operator, which measures the local orientation, the global orientations of EMCN+ vessels and collagen fibers were calculated with a fast Fourier transform method(36) in FIJI (ImageJ2)(37). The distribution of angles was evaluated by sorting angle data into 5° partitions from −90° to 90°, taking the absolute value of each angle due to symmetry of the VOI, and re-sorting into respective groups (0° to 90°). The sum of the length of vessels oriented in a range of directions (0° to 5°, 5° to 10°,…, 85° to 90°) was then reported. The longitudinal direction is of particular importance as it is the direction of principle stress in the tibia during normal loading (See “Finite element analysis” section below). The strength of the regenerate in this direction dictates the strength of bone in resisting physiological loads; therefore, the length of vessels and collagen fibers aligned in the 0° ± 5° direction were compared.
Quantification of distances between segmented features in 3D image datasets
An approach to measure the distance between segmented features in 3D image datasets was developed to quantify the distance between Osx+ cells and EMCN+ vessels, as well as between the EMCN+ vessels and collagen fibers as detected by the SHG signal. Throughout our analyses, we did not quantify single collagen fibers, but have used a rendering of the second harmonic generation to represent intact bulk woven bone trabeculae. Within a segmented 3D rendered image for a specific channel (e.g., EMCN), Imaris was used to generate a distance mask that encodes the distance of each pixel to the nearest surface of the channel as the brightness value of the pixel. The distance to segmented features in another channel was then obtained by mapping the encoded distance value to the spatial coordinate of these features.
Finite element analysis (FEA)
A specimen-specific three-dimensional linear elastic finite element model of an individual tibia with a 1.0 mm cortical defect was developed. The model included the cortical bone, marrow, and regenerate. The model was loaded in axial compression, and axial stresses and strains were investigated. The model used the same geometry as presented in our previous publication, and was validated using strain values against the model, as well as strain values generated from gauges on the physical test specimen (12). The cortical bone, marrow and regenerate were modeled as homogenous and isotropic. The cortical bone was modeled with a 17 GPa elastic modulus and 0.3 Poisson ratio (12,38). The marrow was modeled with a 50 kPa elastic modulus and 0.3 Poisson ratio, which is within the range of reported values for marrow (39,40). The regenerate was modeled in three parametric volumes, such that material properties could be individually assigned to each section. The three components were constrained together at all interfacing surfaces in all degrees of freedom. The model was meshed using quadratic 10-node tetrahedral elements. Mesh sensitivity studies were performed to ensure adequate mesh density values for the cortical bone, marrow, and the regenerate. The finite element model was analyzed using a non-linear, full Newton direct solver in Abaqus/Standard 2016.
Statistical analyses
A Two-Way ANOVA with loading status (control vs. loaded) and loading time (PSD 2–5 vs. PSD 5–8) as the main factors was performed to test significance at an alpha level of 0.05 and a beta level of 0.2. Post-hoc analyses for multiple comparisons between group means were performed using Tukey’s method. Individual data points and the mean ± standard deviation are plotted unless noted otherwise.
Results
Cells, vessels, and bone structure in a cortical defect
To elucidate the relationship between the osteoblast precursors, blood vessel and new bone tissue within a healing defect, we utilized deep tissue imaging with laser scanning microscopy with single and multi-photon fluorescence in thick sections. The resulting dataset allowed for the quantification of vascular structures and cellular distribution in 3D space. On post-surgical day (PSD) 10, non-loaded monocortical tibial defects contained a sub-population of Osx+ osteoblast precursors (Fig. 2a). The Osx+ (Fig. 2c) and Ki-67+ (Fig. 2d) cells show distinct co-localization with EMCN+ blood vessels (Fig. 2b, f) relative to the total cell population (DAPI+ cells in Fig. 2a). Collagen matrix was visualized by capturing the second harmonic generation (SHG) signal of collagen fibers (Fig. 2e) within the same sample. The SHG signal correlates with bone matrix as verified with histological staining (Supplemental Fig. S3). To quantify the cellular distribution and vascular geometry, 3D surfaces were created from the immunofluorescence data for EMCN, Osx, and Ki-67 (Fig. 2f), as well as the autofluorescence signal from collagen fiber SHG (Fig. 2g). The side view of each VOI (Fig. 2a–g, small images to the right of each panel) shows the distribution of cells, vessels and collagen fibers along the depth of the sample.
Figure 2. The structures of blood vessels, collagen I fibers and cell distribution were visualized within a long bone defect.
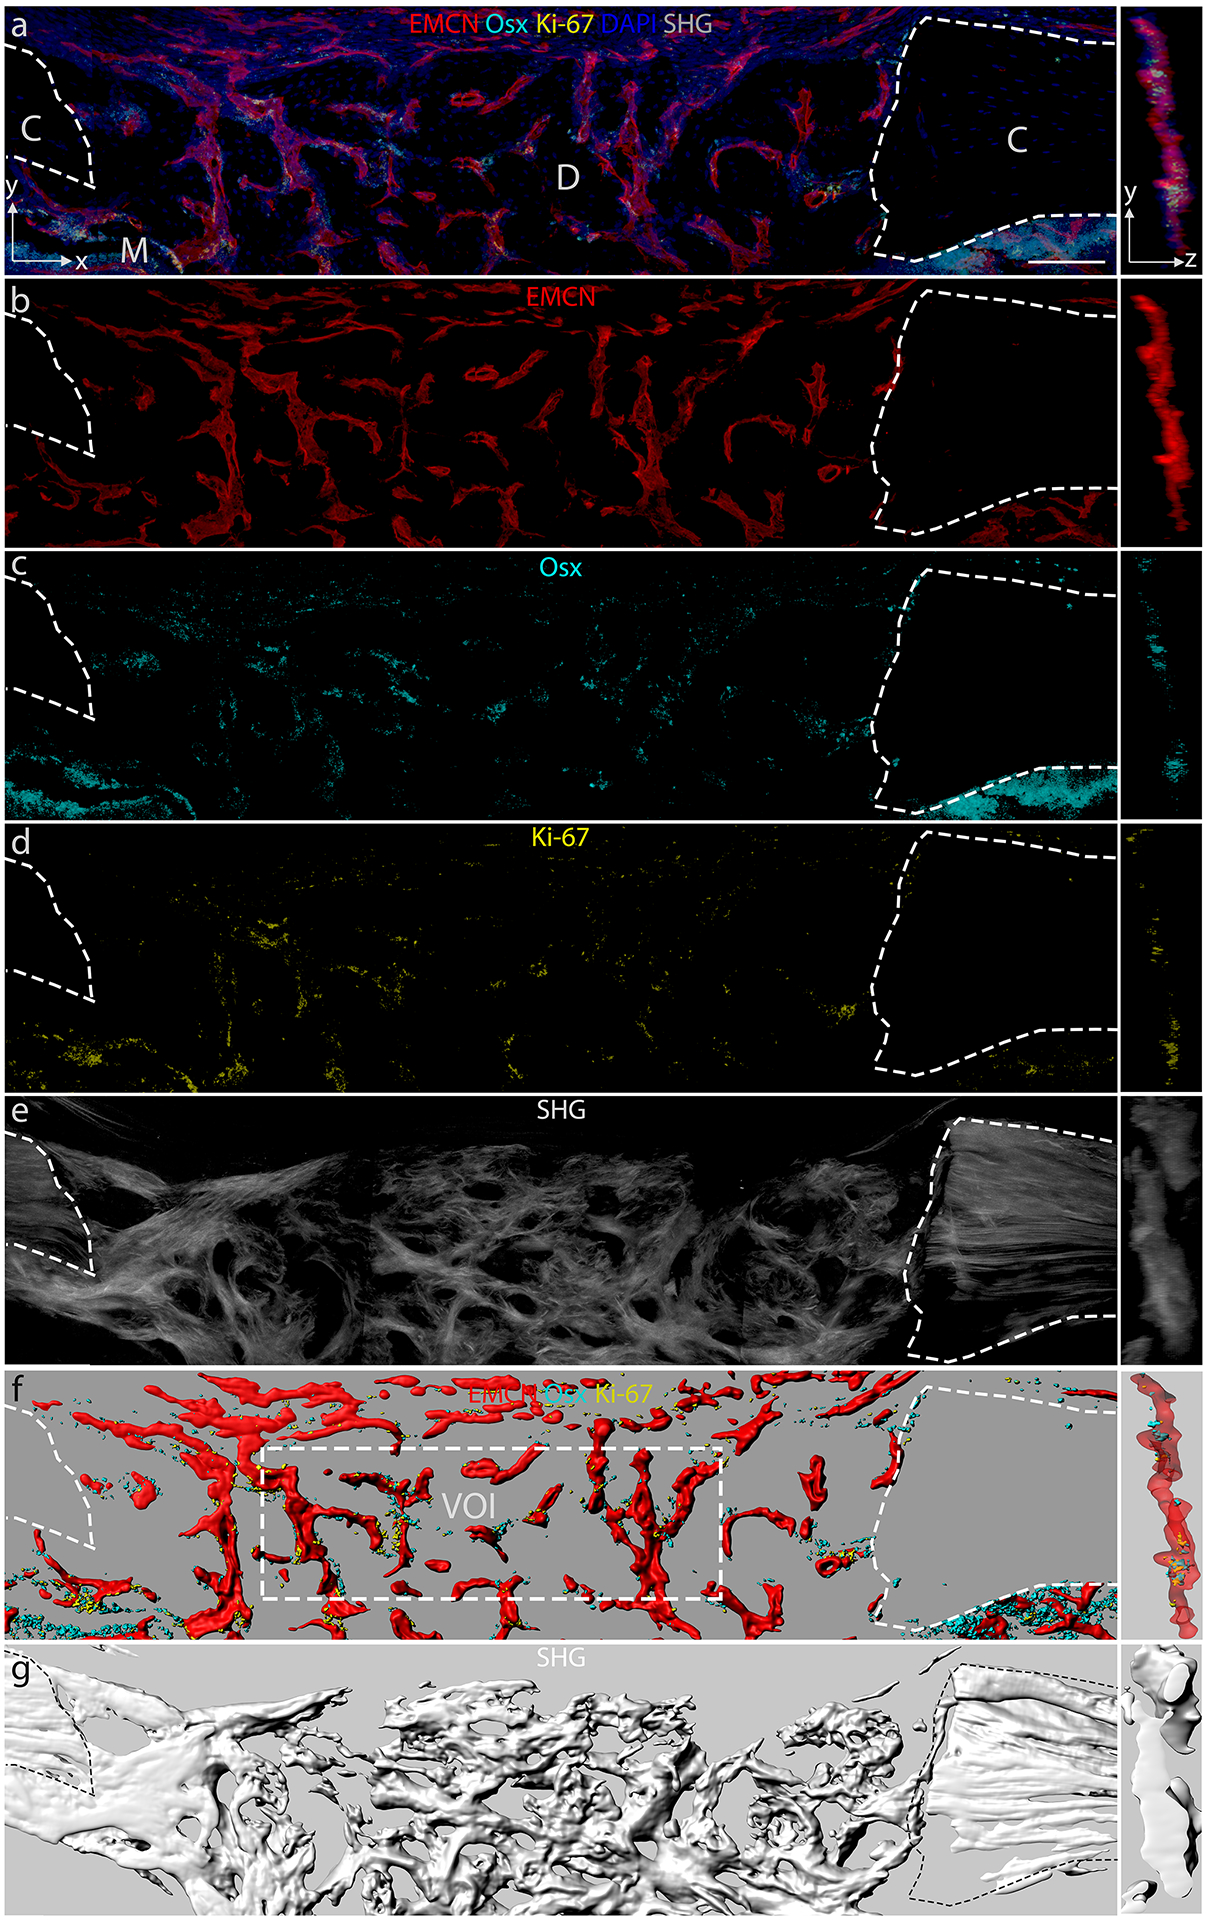
Thick (50–80 μm) longitudinal sections of a monocortical tibial defect stained for endomucin (EMCN), osterix (Osx), Ki-67, and DAPI, with second harmonic generation (SHG) auto-fluorescence from collagen fibers that make up the bone. Cortical bones (C), with marrow (M) below, flank the defect (D). Maximum intensity projection (MIP) in the x–y direction of (a) composite MIP of EMCN, Osx, Ki-67, and DAPI, (b) MIP of EMCN, (c) Osx, (d) Ki-67, (e) SHG of collagen fibers. Rendered 3D surfaces of (f) EMCN, Osx, Ki-67 and (g) SHG of collagen fibers. The panels on the right show a 30 μm thick slice in the y–z direction. A volume of interest (VOI) of 600 × 200 × 52 μm was selected for analysis. N = 5. Scale bar = 100 μm.
Vessel invasion precedes bone formation within the defect
The temporal dynamics of blood vessel invasion and how it relates to bone matrix deposition have not been studied in a healing cortical defect. To characterize the time progression of vessel invasion and bone matrix deposition, the distribution of EMCN+ vessel and bone-associated collagen fibers was visualized on PSD 2, 3, 5, 7, and 10 (Fig. 3). Blood vessels invaded the defect as early as PSD 2 (Fig. 3a). A well-organized vascular network was observed by PSD 5 (Fig. 3c). At this time, a small amount of tissue with organized collagen fibers can be seen within the defect (Fig. 3c). PSD 7 and 10 show continued re-organization of the vascular network and deposition of collagen fibers (Fig. 3d, e).
Figure 3. Time line of blood vessel invasion and bone matrix formation within the defect site during bone repair.
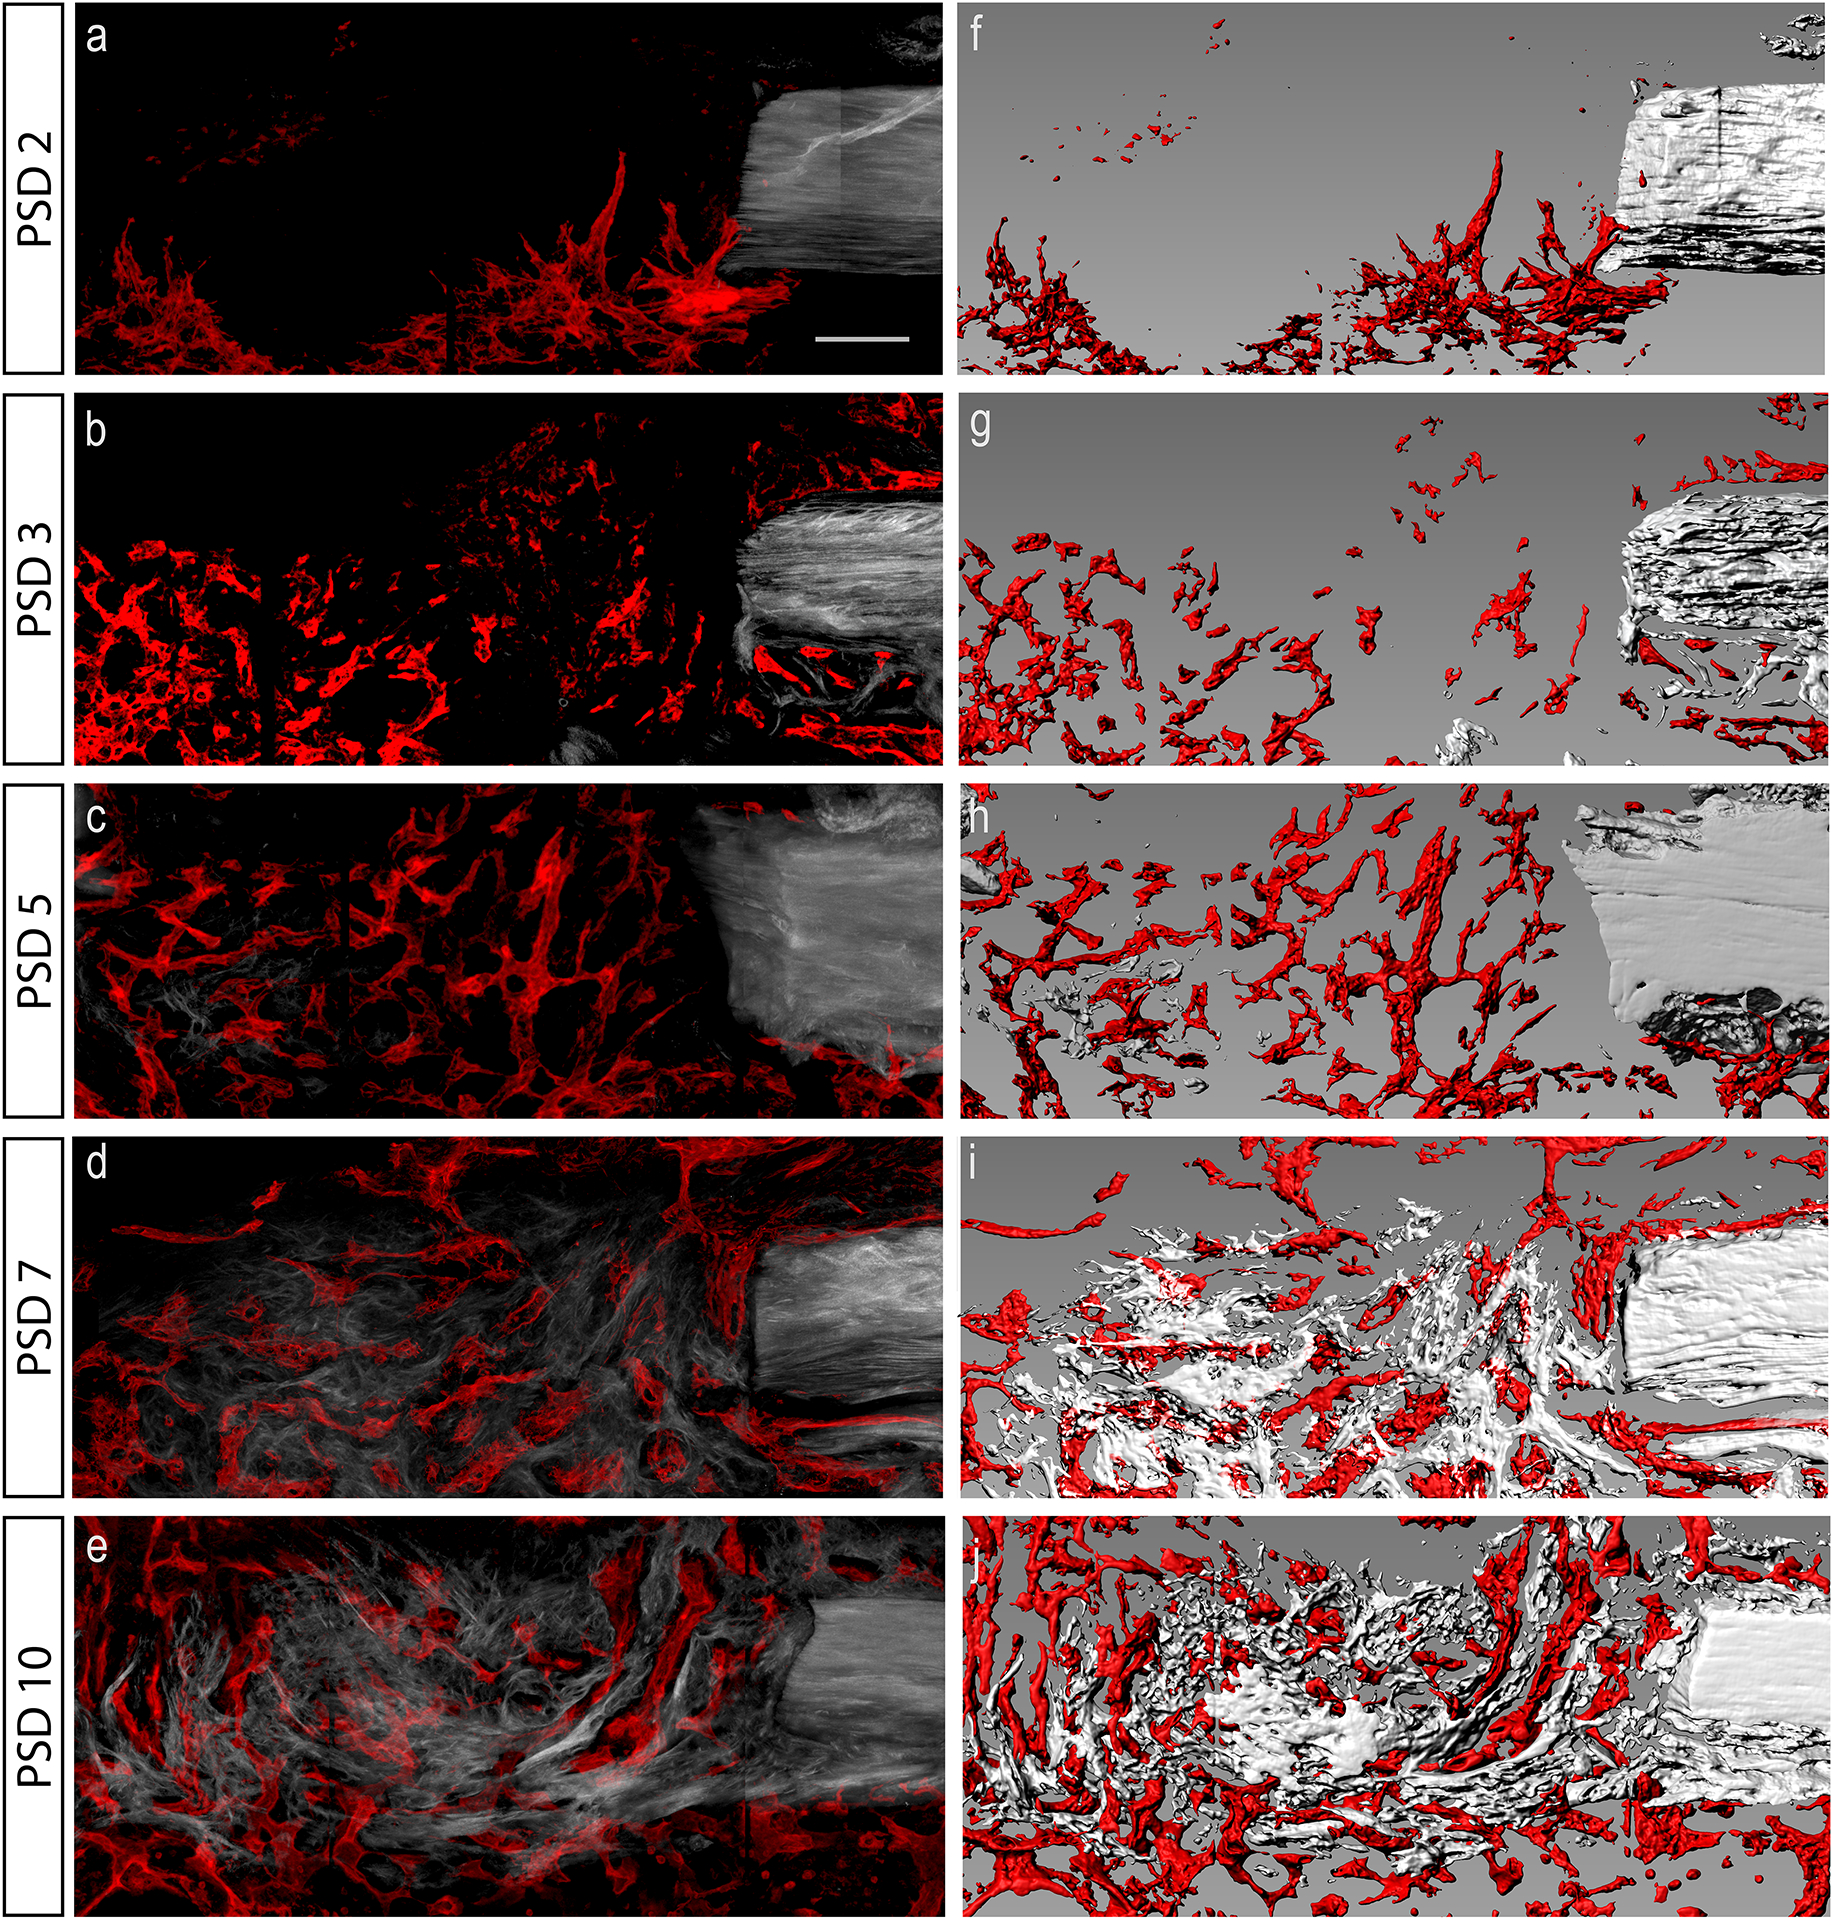
(a–e) Maximum intensity projection of longitudinal thick sections of tibial monocortical defect over the course of repair from post-surgical day (PSD) 2 to 10. Mature collagen fibers that are associated with bone were visualized with second harmonic generation (SHG) autofluorescence. Blood vessels were imaged by EMCN antibody staining (red). (f–j) Computer generated surfaces corresponding to SHG (grey) and EMCN (red) signal at each time point. N = 5. Scale bar = 100 μm.
FEA estimate of the mechanical environment
To understand the mechanical forces acting on cells within the defect, the time-dependent stress and strain fields within the regenerate have been estimated with a multiphasic model, which incorporates the stiffness of the bone, marrow, and the regenerate (Fig. 4a, b). The geometry of the model was based on microCT scans of tibiae each containing a monocortical defect (Supplemental Fig. S4). The stress within the regenerate is principally tensile and oriented in the long axis of the tibia (Fig. 4c). The regenerate tissue connecting the existing cortical bone experiences increasing stress; while the regenerate within the marrow cavity experience reduced stress as the regenerate stiffens (Fig. 4d). These analyses suggest that upon creation of the defect, the stress on the marrow dramatically increases in the surrounding volume. Specifically, the high stress is localized to where the bone was removed, as well as a “canopy” region within the marrow, which we define as a hemispherical region directly below the defect that bears load during the early stages of repair. As the regenerate forms, it appears to fill in these volumes of high stress. Once the regenerate begins to stiffen, the “canopy” region no longer bears significant load, and consequently the stress is reduced within the canopy. Thus, our model of increasing the stiffness of the high-stress region of the regenerate resulted in a process that closely mimics what is physically observed during the healing process.
Figure 4. Finite element analysis of a multiphasic model of the monocortical tibial defect.
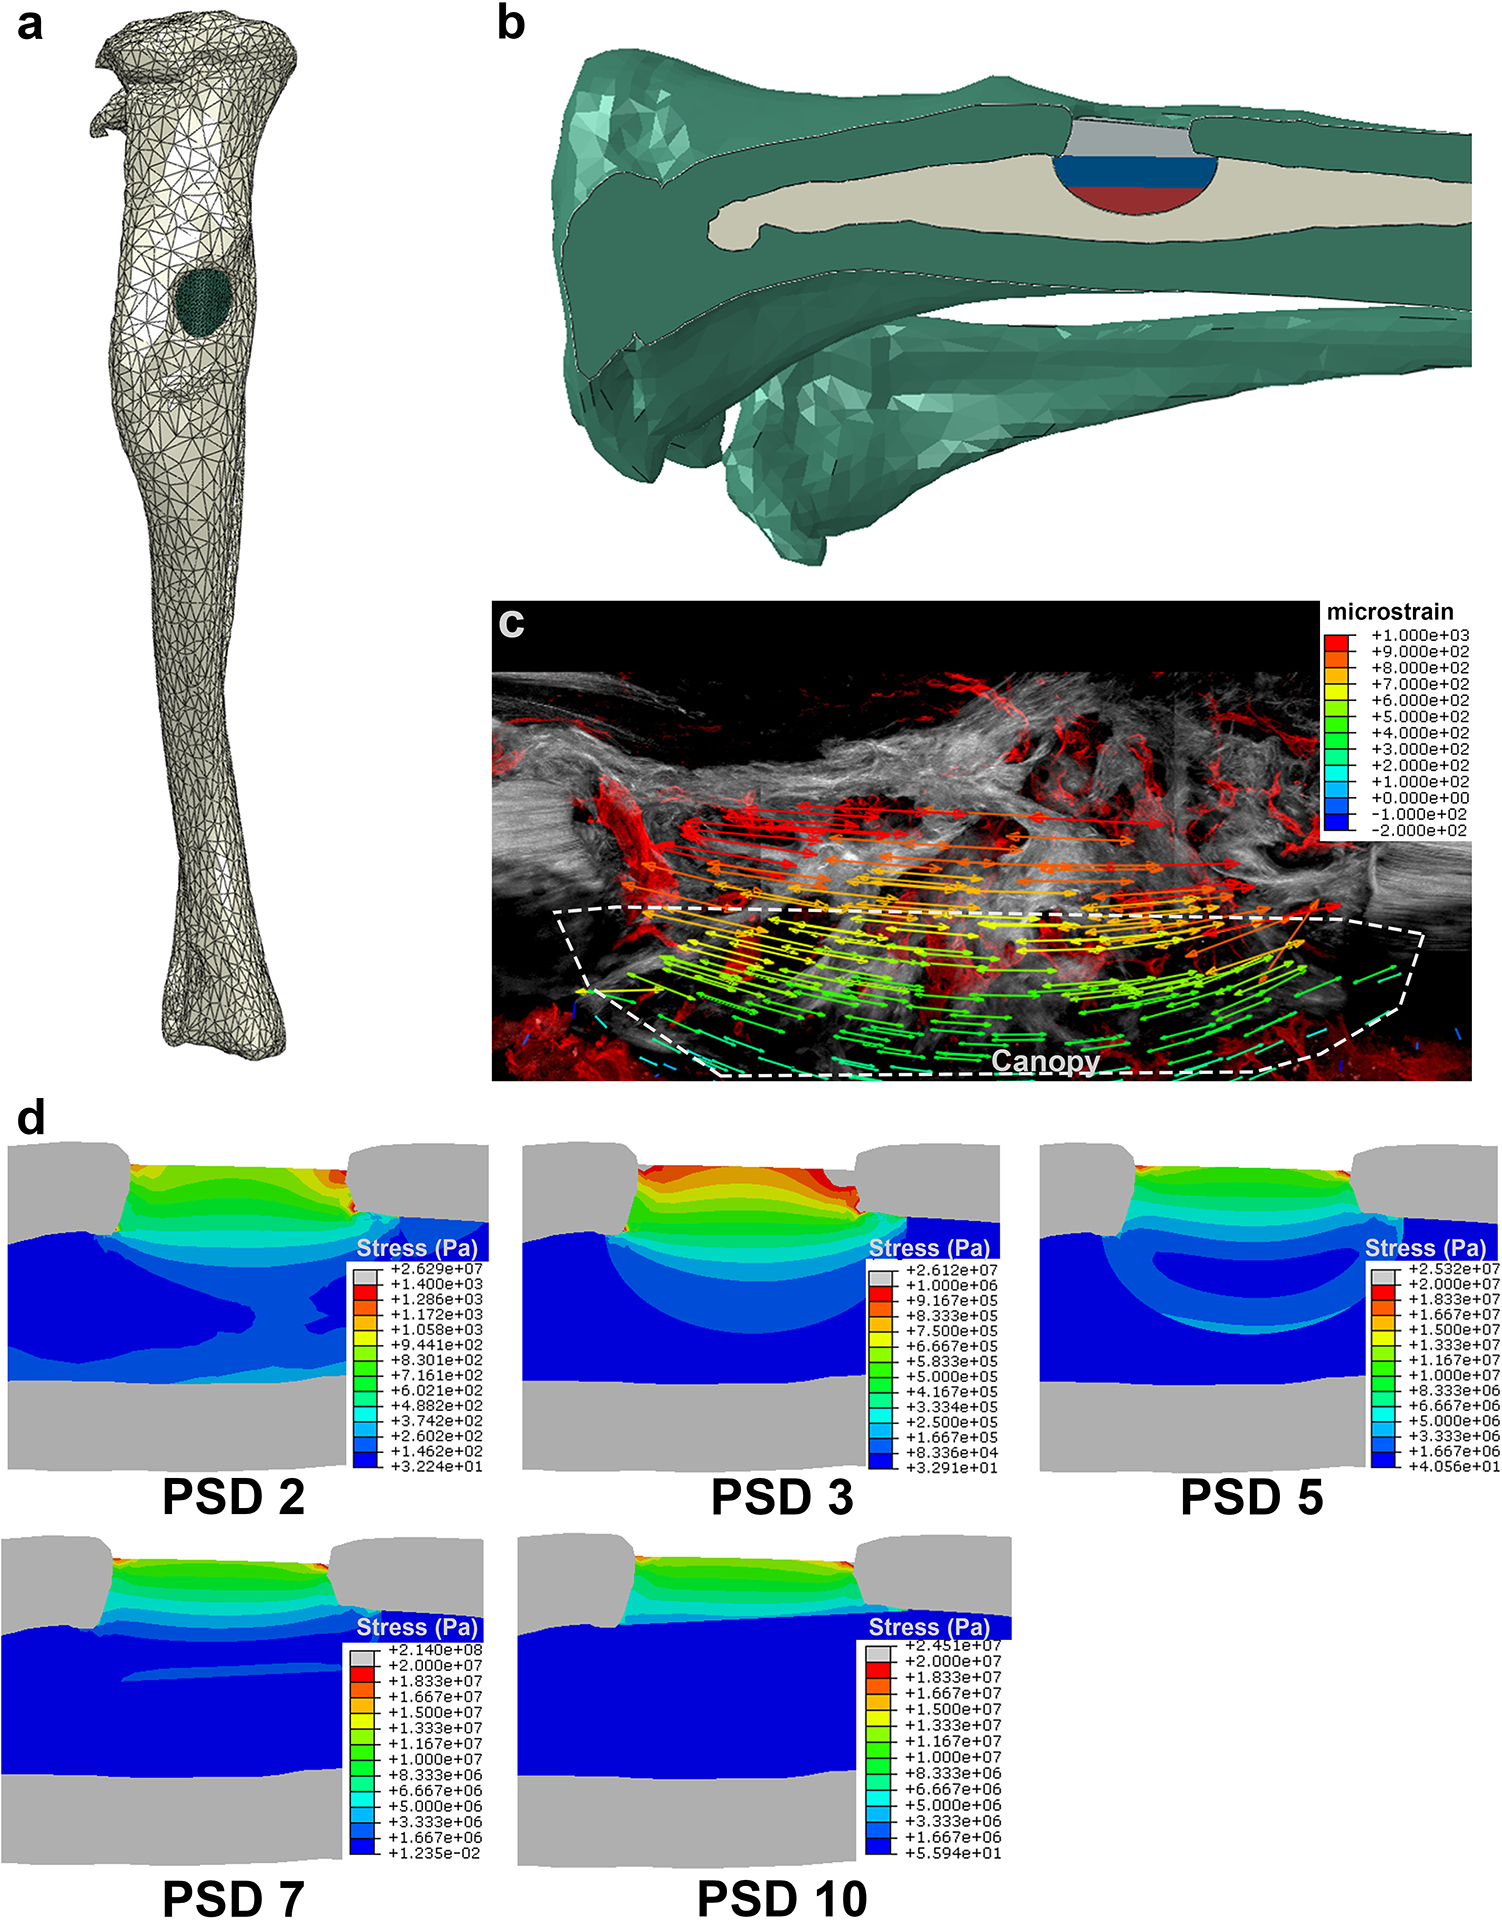
(a) A polygonal 3D model of the tibia with a defect was generate from microCT scans. (b) The defect cavities was segmented into 3 volumes, for which the stiffness could be changed independently. (c) The principle strain field is displayed over a representative longitudinal section of the defect showing SHG+ collagen fibers of the bone matrix in grey and EMCN+ vessels in red. (d) The stress distribution of the defect space and the marrow was estimated by changing the stiffness of the defect over time.
Mechanical regulation of vessel morphology
The vascular network is regulated by mechanical stimuli in addition to biochemical signals. To understand how vessels respond to mechanical forces within maturing bone matrix, we imaged EMCN+ vessels within the tibial defect (Fig. 5a–d) on PSD 10 following mechanical stimulation during either the cell invasion (PSD 2–5) (Fig. 5a, b) or matrix deposition (PSD 5–8) (Fig. 5c, d) phase. We generated 3D surfaces (Fig. 5a’–d’) matching the EMCN+ immunofluorescence data to quantify vascular geometry. Mechanical loading during the matrix deposition phase, but not during the cell invasion phase, resulted in increased total vessel volume by 64% (Fig. 5e), number by 71% (Fig. 5f), and exhibited overall smaller but more numerous vessels (Fig. 5g, h).
Figure 5. Mechanical loading altered vascular structure within a bone defect regenerate.
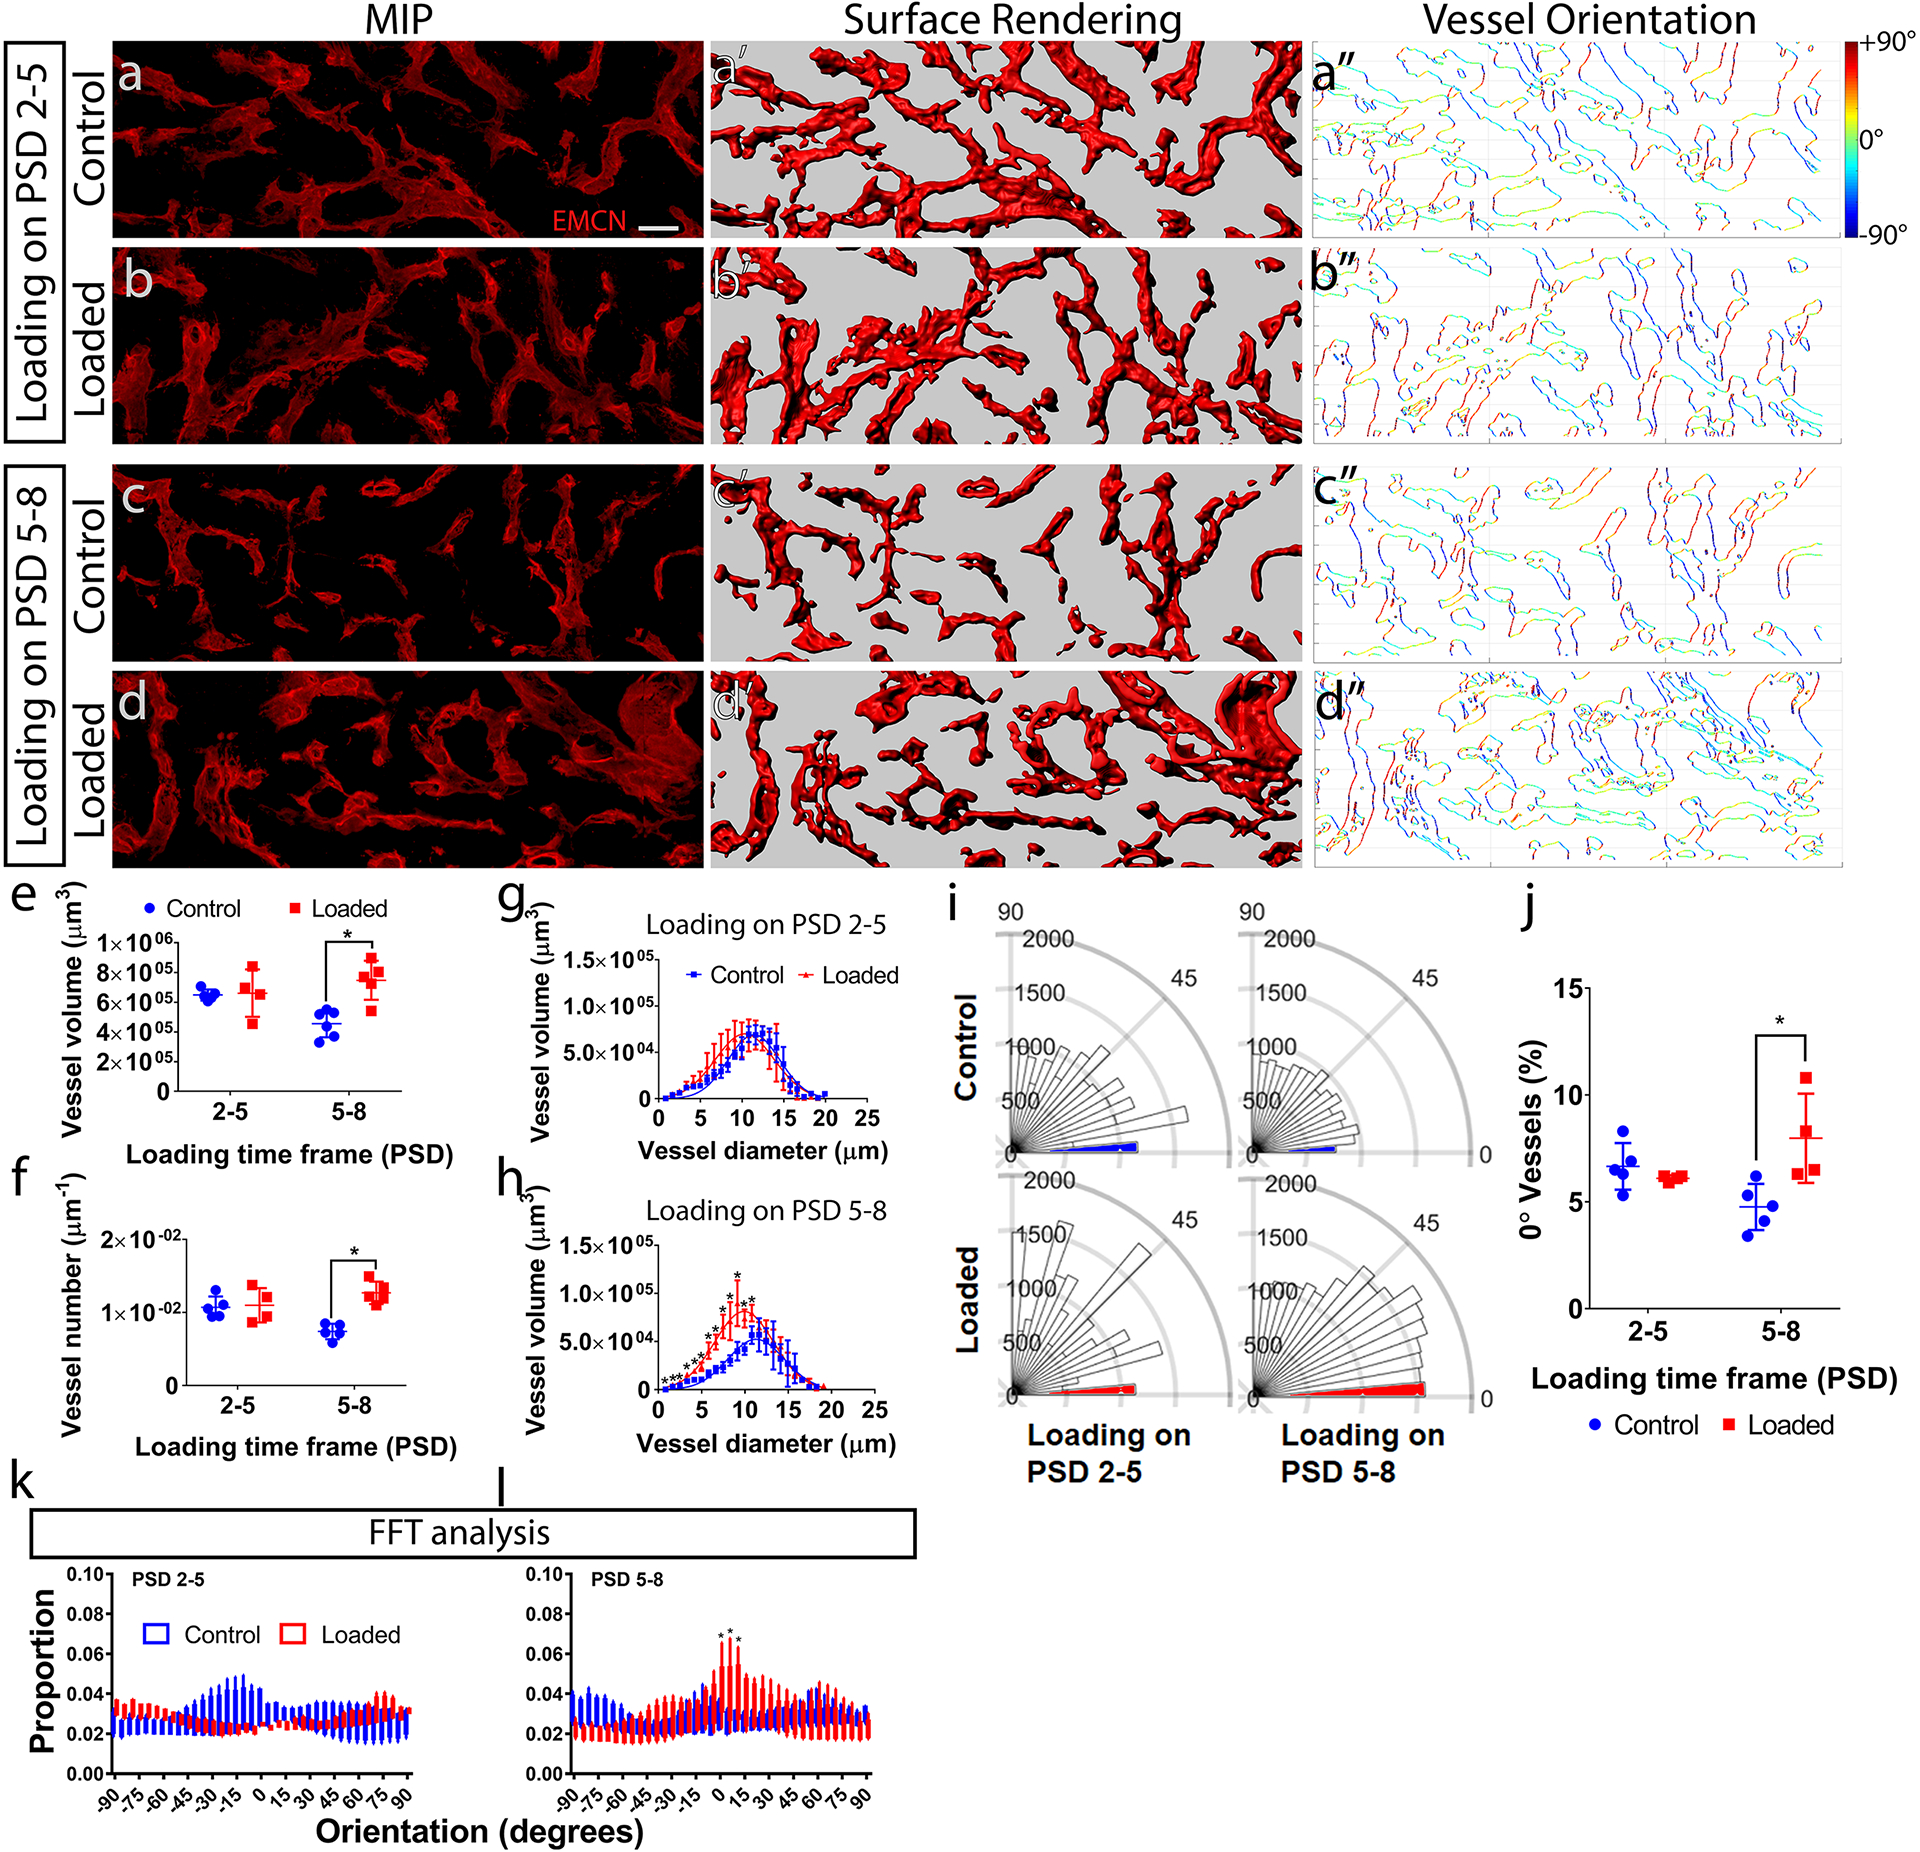
(a–d) Maximum intensity projection (MIP) of endomucin (EMCN) positive vessels within a defect regenerate at post-surgical day (PSD) 10, with and without daily mechanical compressive loading (6N, 2Hz, 120 cycles) on PSD 2–5 or PSD 5–8. The thickness of the VOI (52 μm) is more than 2x of the maximum vessel diameter (see g, h), allowing for the quantification of vessel volume and number by creating (a’–d’) 3D surface rendering from the confocal microscopy data. Quantification of (e) the vessel volume, (f) number, and (g–h) the distribution of vessel diameter vs. volume showed loading on PSD 5–8 resulted in greater vessel volume and number, and shifted the distribution to smaller but more numerous vessel. (a”–d”) The orientation of vessel surfaces was quantified between 0°–90°. (i) Polar plots of a representative set of samples. The 0° ± 5° edges predominates, with PSD 5–8 loading showing an increase. (j) Loading on PSD5–8 resulted in greater vessel length and at 0°. (k) Quantification of the orientation using the fast Fourier transform (FFT) method showed similar increase around the longitudinal (0°) direction in the PSD 5–8 but not PSD 2–5 loaded groups. Error bars show standard deviations. N = 5. *P < 0.05 Scale bar = 40 μm.
The orientation of the vessels was quantified by a custom program in MATLAB that computed the pixel-wise direction of the vessel edges over the range of ± 90° (Fig. 5a”–d”). Mechanical loading altered the distribution of vessels in terms of their orientation (Fig. 5i). Loading during the matrix deposition phase (PSD 5–8) significantly increased the length of vessels aligned in the long axis (0 ± 5°) of tibia aligned by 68% (Fig. 5j). Orientations calculated from the FFT method also corroborated this result, with significantly higher proportions of EMCN+ vessels aligned in the long axis of tibia after loading on PSD 5–8 (Fig. 5k). This direction-specific difference in vessel orientation was not detected using the Mean Intercept Length (MIL) approach (Supplemental Fig. S6) to calculate anisotropy.
Mechanical regulation of bone matrix structure during repair
The coordination of blood vessels and new bone matrix deposition drives the bone repair process. As the tibia is a load-bearing long bone, and is adaptive to mechanical stimuli, the repair process of a tibia defect is likely to be affected by mechanical forces as well. To measure the effect of mechanical loading on bone matrix deposition within the tibial defect, we imaged the collagen fibers that are associated with bone using second harmonic generation (SHG) on PSD 10 (Fig. 6a–d), as there is a network of mature collagen fibers observed from at time point (Fig. 3). The SHG signal correlates with bone tissue as observed using histological methods (Supplemental Fig. S3). The total SHG+ matrix geometry was quantified by generating 3D surfaces (Fig. 6a’–d’) that match the multi-photon microscopy images. Interestingly, mechanical loading did not alter the total volume or surface area of the collagen matrix (Supplemental Fig. S5).
Figure 6. Mechanical loading resulted in the alignment of collagen fibers in the direction of loading along the long axis of the bone, which is correlated with the vessels.
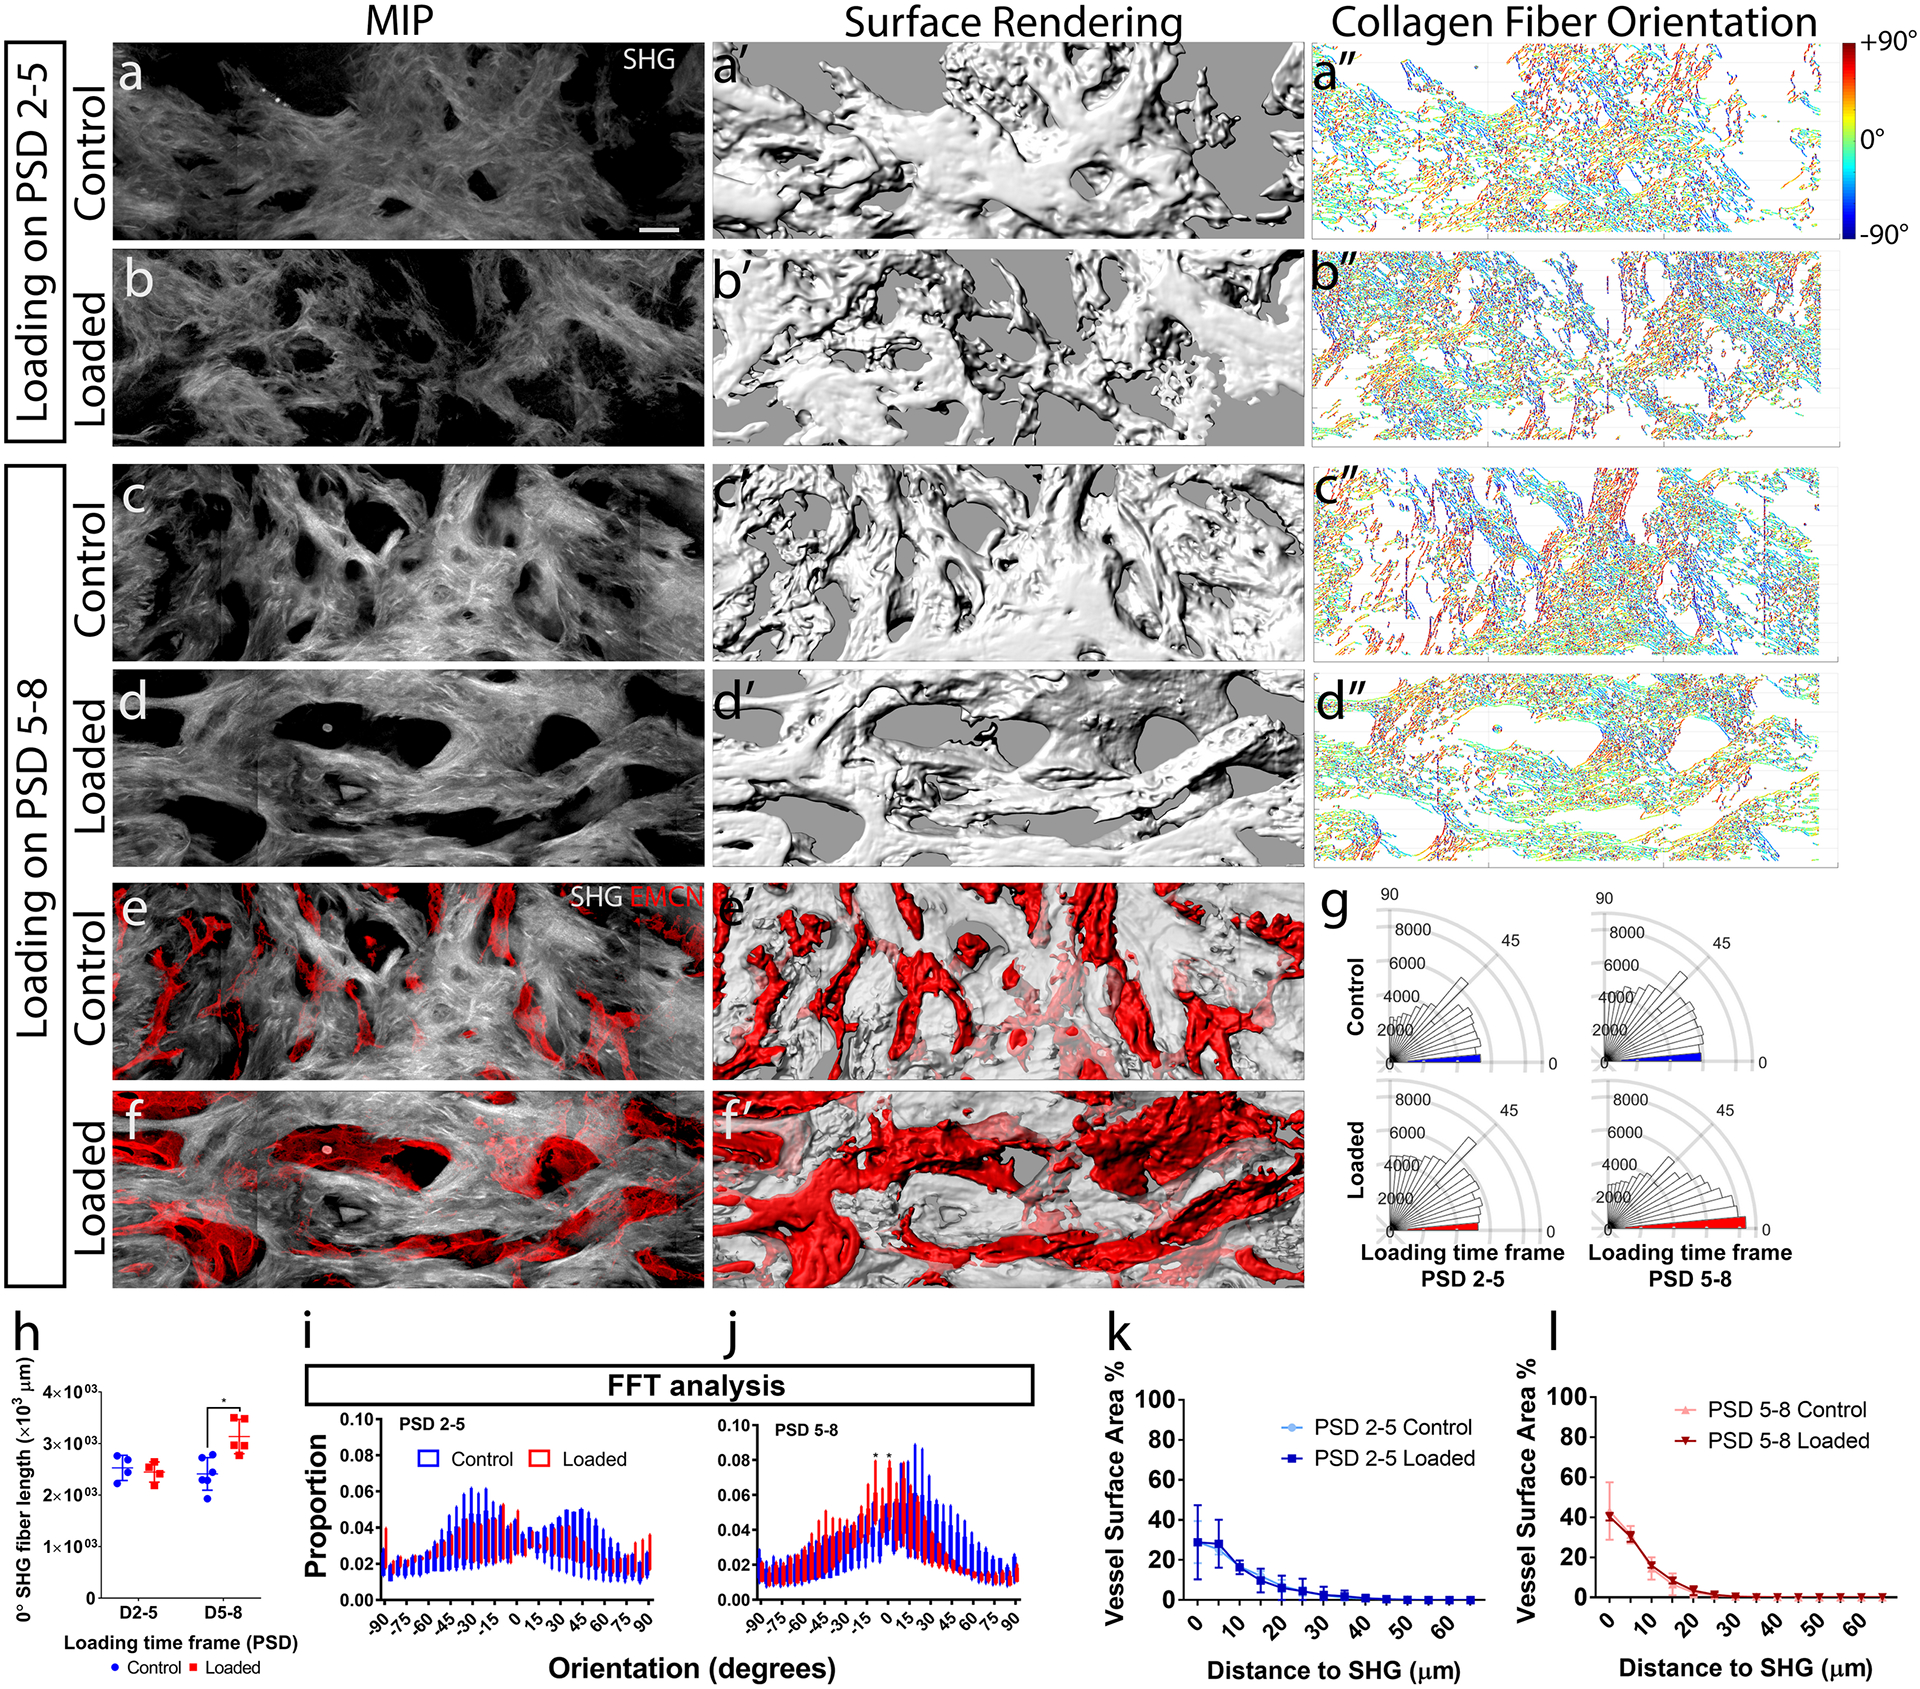
(a–d) Maximum intensity projection (MIP) of second harmonic generation (SHG) of collagen fibers at post-surgical day (PSD) 10, with and without daily mechanical compressive loading (6N, 2Hz, 120 cycles) on PSD 2–5 and PSD 5–8. (a’–d’) 3D surface renderings generated from confocal microscopy data. (a”–d”) Individual collagen fibers color-coded (red +90°, blue −90°) for spatial orientation relative to the long axis of the tibia (0°). (e, f) An overlay of EMCN+ vessels and collagen fibers (MIP); and (e’, f’) 3D surface rendering showing intertwined morphology. (g) Polar plots of collagen fiber orientation in a representative set of sample from PSD 5–8. (h) Quantifications of collagen fiber length orientated along the long axis (0° ± 5°) of the tibia. (i, j) Quantification of orientation using the fast Fourier transform (FFT) method also showed increased proportion of SHG signals in the long axis of tibia in the PSD 5–8 but not the PSD 2–5 loaded groups. The distance distributions of EMCN+ vessel surface area to collagen fibers were quantified for the (k) PSD 2–5 loaded and (l) PSD 5–8 loaded groups. Error bars show standard deviations. N = 5. *P < 0.05 Scale bar = 40 μm.
The orientation of collagen fibers was quantified in MATLAB to compute the pixel-wise direction of fibers over the range of ± 90° (Fig. 6a”–d”). Mechanical loading did not affect the total length of collagen fibers. Mechanical loading during the matrix deposition phase (PSD 5–8) altered the distribution of fiber orientations (Fig. 6g). Quantification shows significantly increased length of fibers that were aligned to the long axis (0°) of the tibia by 25% (Fig. 6h). FFT analysis also showed significant increase in the proportion of collagen fibers aligned in the long axis of tibia (Fig. 6i, j). However, the MIL anisotropy values do not capture this direction-specific difference in collagen fiber orientation (Supplemental Fig. S6).
Next we determined whether vessels and collagen matrix were aligned after mechanical loading. Voids in the bulk SHG+ structure correlated with EMCN+ vessels when it is superimposed (Fig. 6e, f). Computer-generated 3D surfaces with translucent SHG+ matrix and solid EMCN+ vessels further demonstrate this spatial correlation. The 3D distance between EMCN+ vessels and the nearest collagen fiber did not change with early (Fig. 6k) or delayed (Fig. 6l) mechanical loading. Estimation of mechanical strength using the collagen fiber distribution also showed similar trend (Supplemental S7).
Mechanical regulation of stem cell populations during repair
The effects of mechanical loading on the primitive osteogenic (Prrx1+ Sca-1+) progenitor distribution and proliferation (Ki-67+) were assessed with multiplex immunofluorescence staining in thick sections. Samples from each experimental group were simultaneously stained for Prrx1, Sca-1 and Ki-67 (Fig. 7a), and vessels and SHG+ matrix structure could be compared in consecutive sections (Fig. 7a’). We measured the number of Sca-1+ cells (Fig. 7b–e), Prrx1+ cells (Fig. 7b’–e’), and Ki-67+ proliferating cells (Fig. 7b”–e”), as well as cells that are co-expressing combinations of these markers. Mechanical loading during the matrix deposition phase (PSD 5–8) resulted in increased total number of Sca-1+ cells within the defect by 70% (Fig. 7f). Mechanical loading during both the cell invasion phase (PSD 2–5) and matrix deposition phase (PSD 5–8) resulted in increased the total number of Prrx1+ cells by 76% and 78%, respectively (Fig. 7g). Mechanical loading during PSD 5–8, but not PSD 2–5, increased the total number of Ki-67+ proliferating cells by 66% (Fig. 7h). Loading during both PSD 2–5 and 5–8 increased the number of Prrx1+ Sca-1+ primitive osteoprogenitors by 109% and 95% respectively (Fig. 7i). The number of proliferating primitive osteoprogenitors (Prrx1+ Sca-1+ Ki-67+) increased in response to mechanical loading during both PSD 2–5 and 5–8 by 116% and 114% respectively (Fig. 7j). In stem cell populations defined as either Sca-1+ or Prrx1+, increased proliferation was observed in response to mechanical loading during PSD 2–5 (73%, 70%) and PSD 5–8 (105%, 55%) (Fig. 7k). The total number of Sca-1+ cells and Ki-67+ proliferating Sca-1+ cells, but not Sca-1+ Prrx1− or Sca-1− Prrx1+ cells (Supplemental Fig. S8), also increased in response to mechanical loading during the matrix deposition phase.
Figure 7. Proliferating (Ki-67+) primitive osteogenic (Prrx1+ Sca-1+) stem cell number increased in response to mechanical loading.
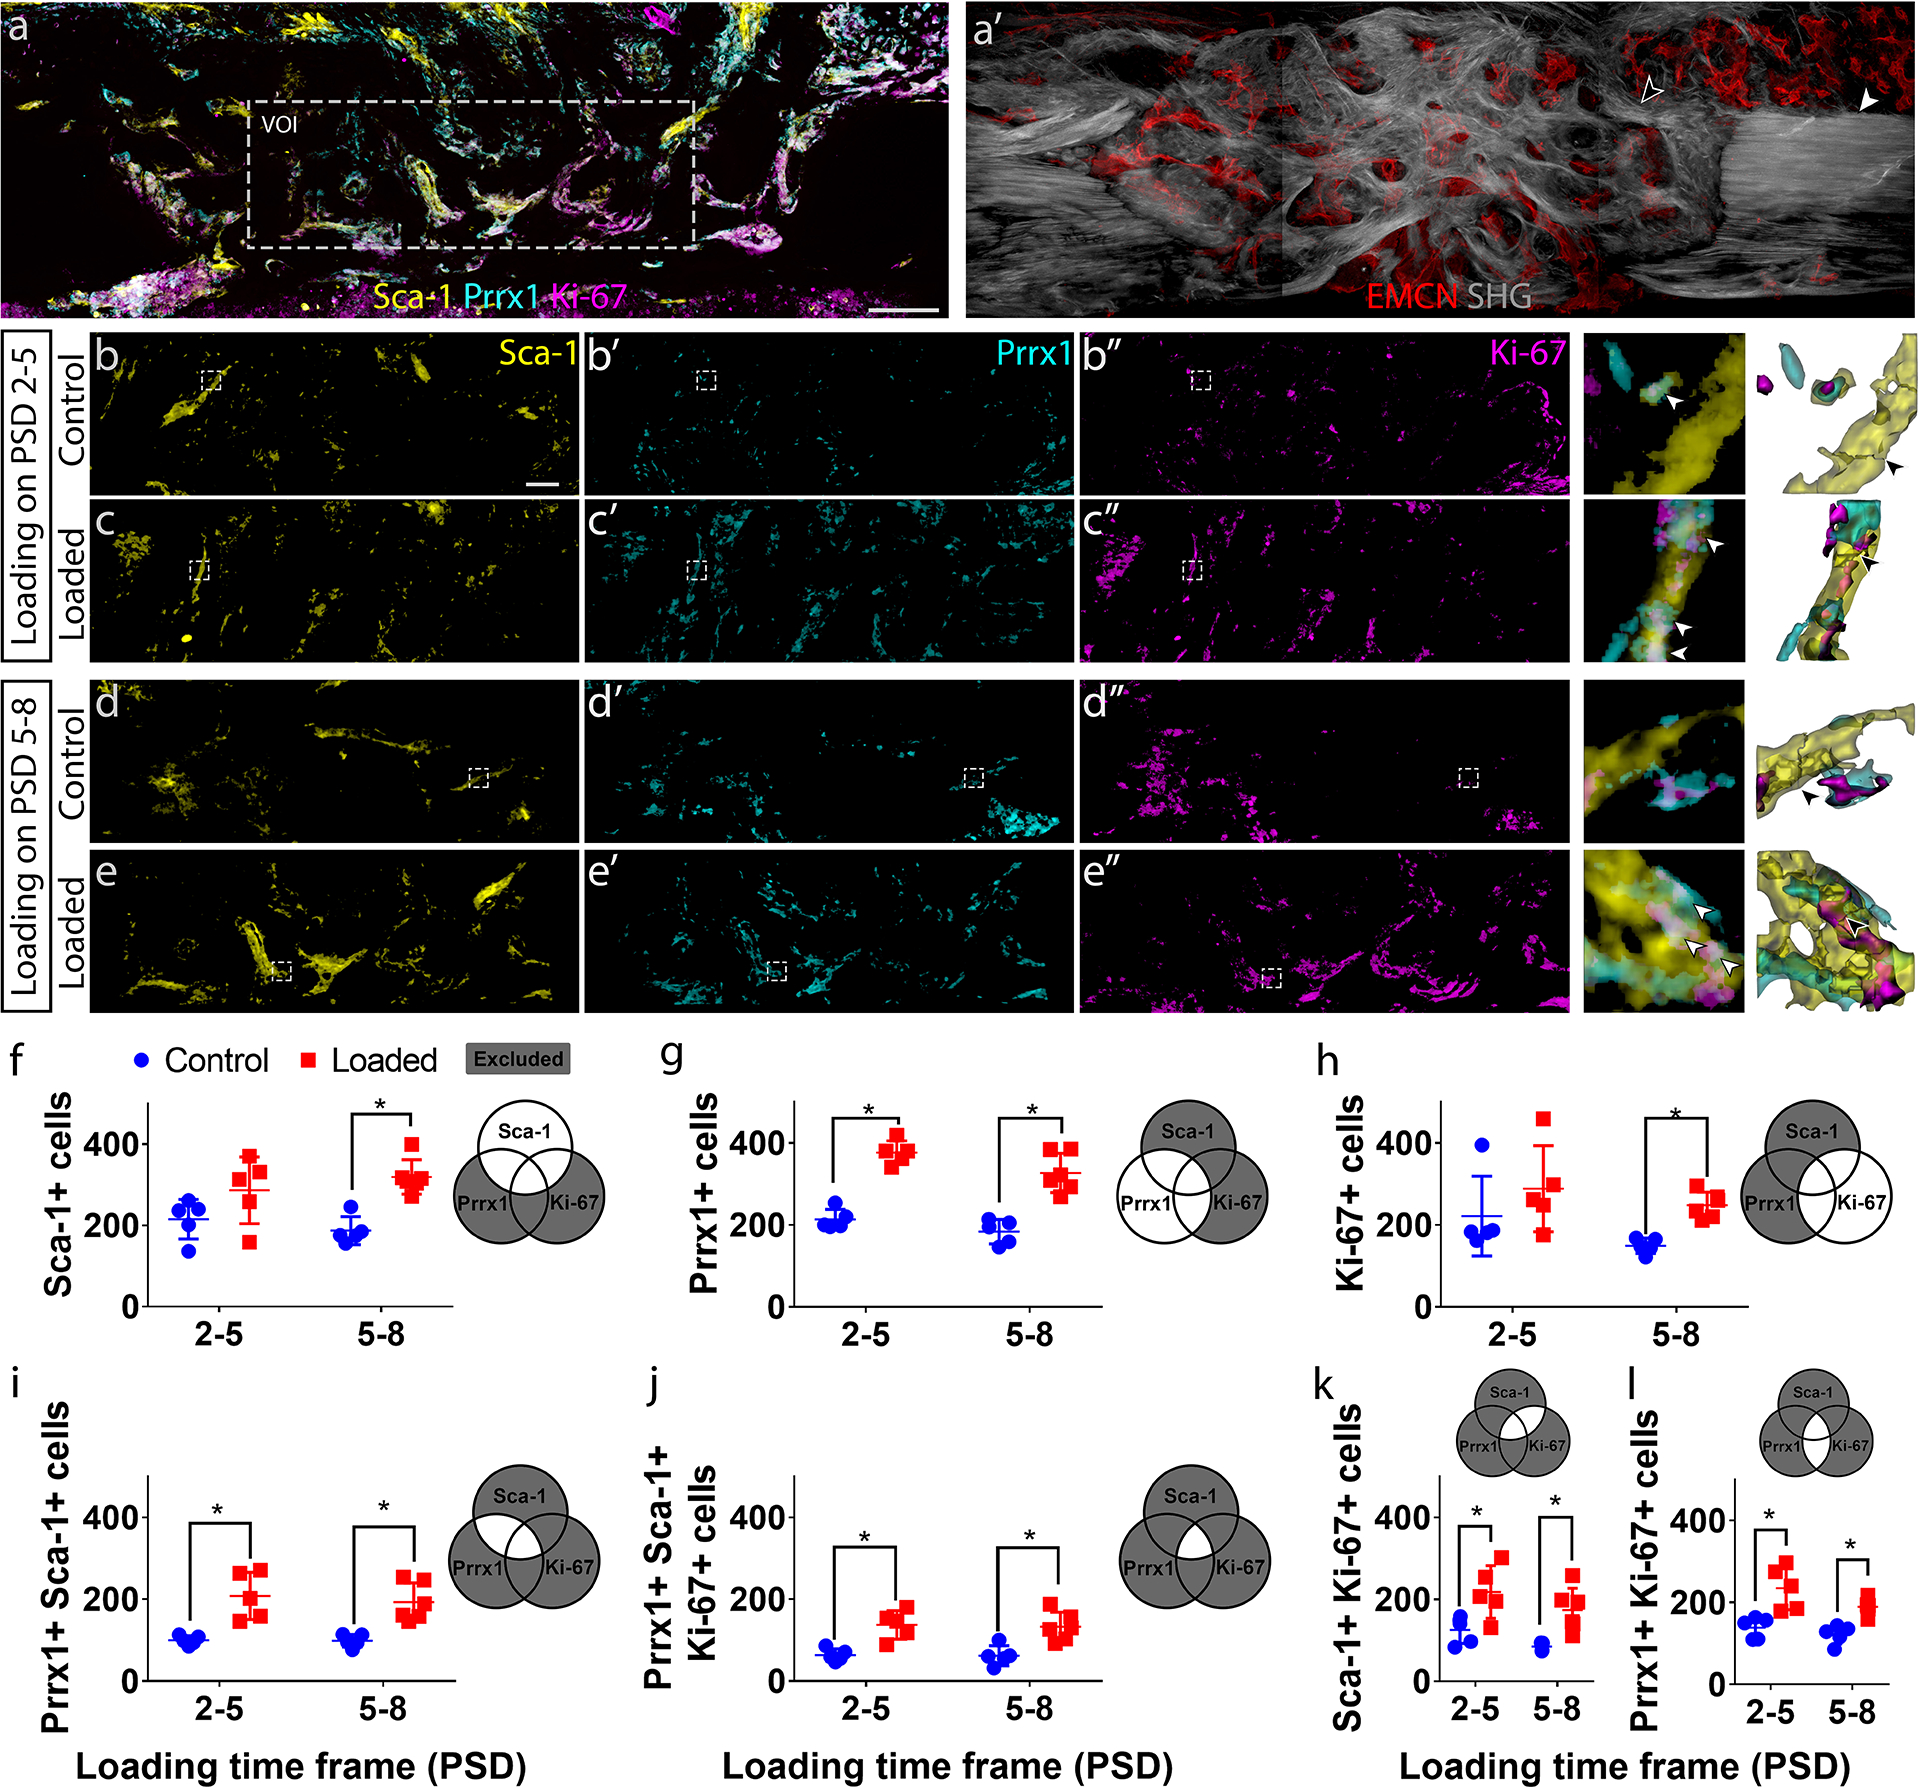
(a) Maximum intensity projection (MIP) of a representative longitudinal thick section from post-surgical day (PSD) 10 stained for Sca-1, Prrx1, and Ki-67, showing the volume of interest (VOI) selected for quantification. (a’) Sequential section to (a) showing the vascular (EMCN+) network, existing cortical bone (white arrowhead) and newly formed bone (black arrowhead) by second harmonic generation. MIP of (b – e) Sca-1, (b’ – e’) Prrx1, and (b” – e”) Ki-67 staining within a representative VOI from control groups, and mechanically stimulated groups (6 N compressive, 2 Hz, 120 cycles/day) from PSD 2–5 and PSD 5–8. Sca-1+ cells highlight a subset of vessel within the defect (arrowhead in b – e). Mechanical loading resulted in expression of Prrx1 (arrowhead in c’, e’) and Ki-67 (arrowhead in c”, e”) in Sca-1+ cells (arrowhead in c’, e’). The regions enclosed by the dotted lines in (b–e) are enlarged to the right of the respective groups, followed by segmented surfaces. The white arrows indicate Sca-1+ Prrx1+ Ki-67+ cells. The black arrows indicate cell boundaries as determined by the watershed algorithm. Quantifications show the effect of mechanical loading on (f) the number of Sca-1+ cells, (g) Prrx1+ cells, (h) Ki-67+ cells, (i) primitive osteogenic Prrx1+ Sca-1+ cells, (j) proliferating (Ki-67+) primitive osteogenic (Prrx1+, Sca-1+) cells, (i) proliferating (Ki-67+) Sca-1+ cells, and (l) proliferating (Ki-67+) Prrx1 cells. Scale bar in (a, a’) = 100 μm, scale bar in (b – e, b’ – e’, b” – e”) = 40 μm. Error bars show standard deviations. N = 5. *P < 0.05
Mechanical regulation of osteoblast precursors during repair
The effects of mechanical loading on the Osx+ osteoblast precursor distribution with respect to EMCN+ blood vessels, and the number of Osx+ cells that were also Ki-67+, indicating a proliferative phase, were assessed with multiplex immunofluorescence staining in thick longitudinal sections. Samples from each experimental group were simultaneously stained for Osx, Ki-67 and EMCN (Fig. 8a). The bulk SHG+ structure could be compared in the same sections (Fig. 8a’). We measured the number of Osx+ cells (Fig. 8b–e), Ki-67+ cells (Fig. 8b’–e’), as well as cells that are co-expressing combinations of these markers. We also measured the association of these cell populations with EMCN+ vessels (Fig. 8b”–e”). Quantifications show mechanical loading during the cell invasion phase (PSD 2–5) and matrix deposition phase (PSD 5–8), resulted in an increase in the number of Osx+ osteoblast precursors in contact with EMCN+ vessels (Fig. 8h); however, mechanical loading did not affect the total number of Osx+ cells undergoing proliferating (Fig. 8g) nor the proportion of Osx+ cells that were co-localized with vessels (Fig. 8h). Over 60% of Osx+ osteoblast precursors at the endosteal surface co-localize with vessels during the early phases of healing (Supplemental Fig. S9). In addition, greater numbers of Osx+ cells were observed at the endosteal compared to the periosteal surface, and this difference was maintained throughout the healing process. Furthermore, the tissue boundary between cortical bone and the regenerate exhibited a significantly lower number of Osx+ cells and fewer EMCN+ vessels (Supplemental S10).
Figure 8. Increased number of osteogenic cells (Osx+) were co-localized with vessels (EMCN+) in response to mechanical loading during the matrix deposition phase.
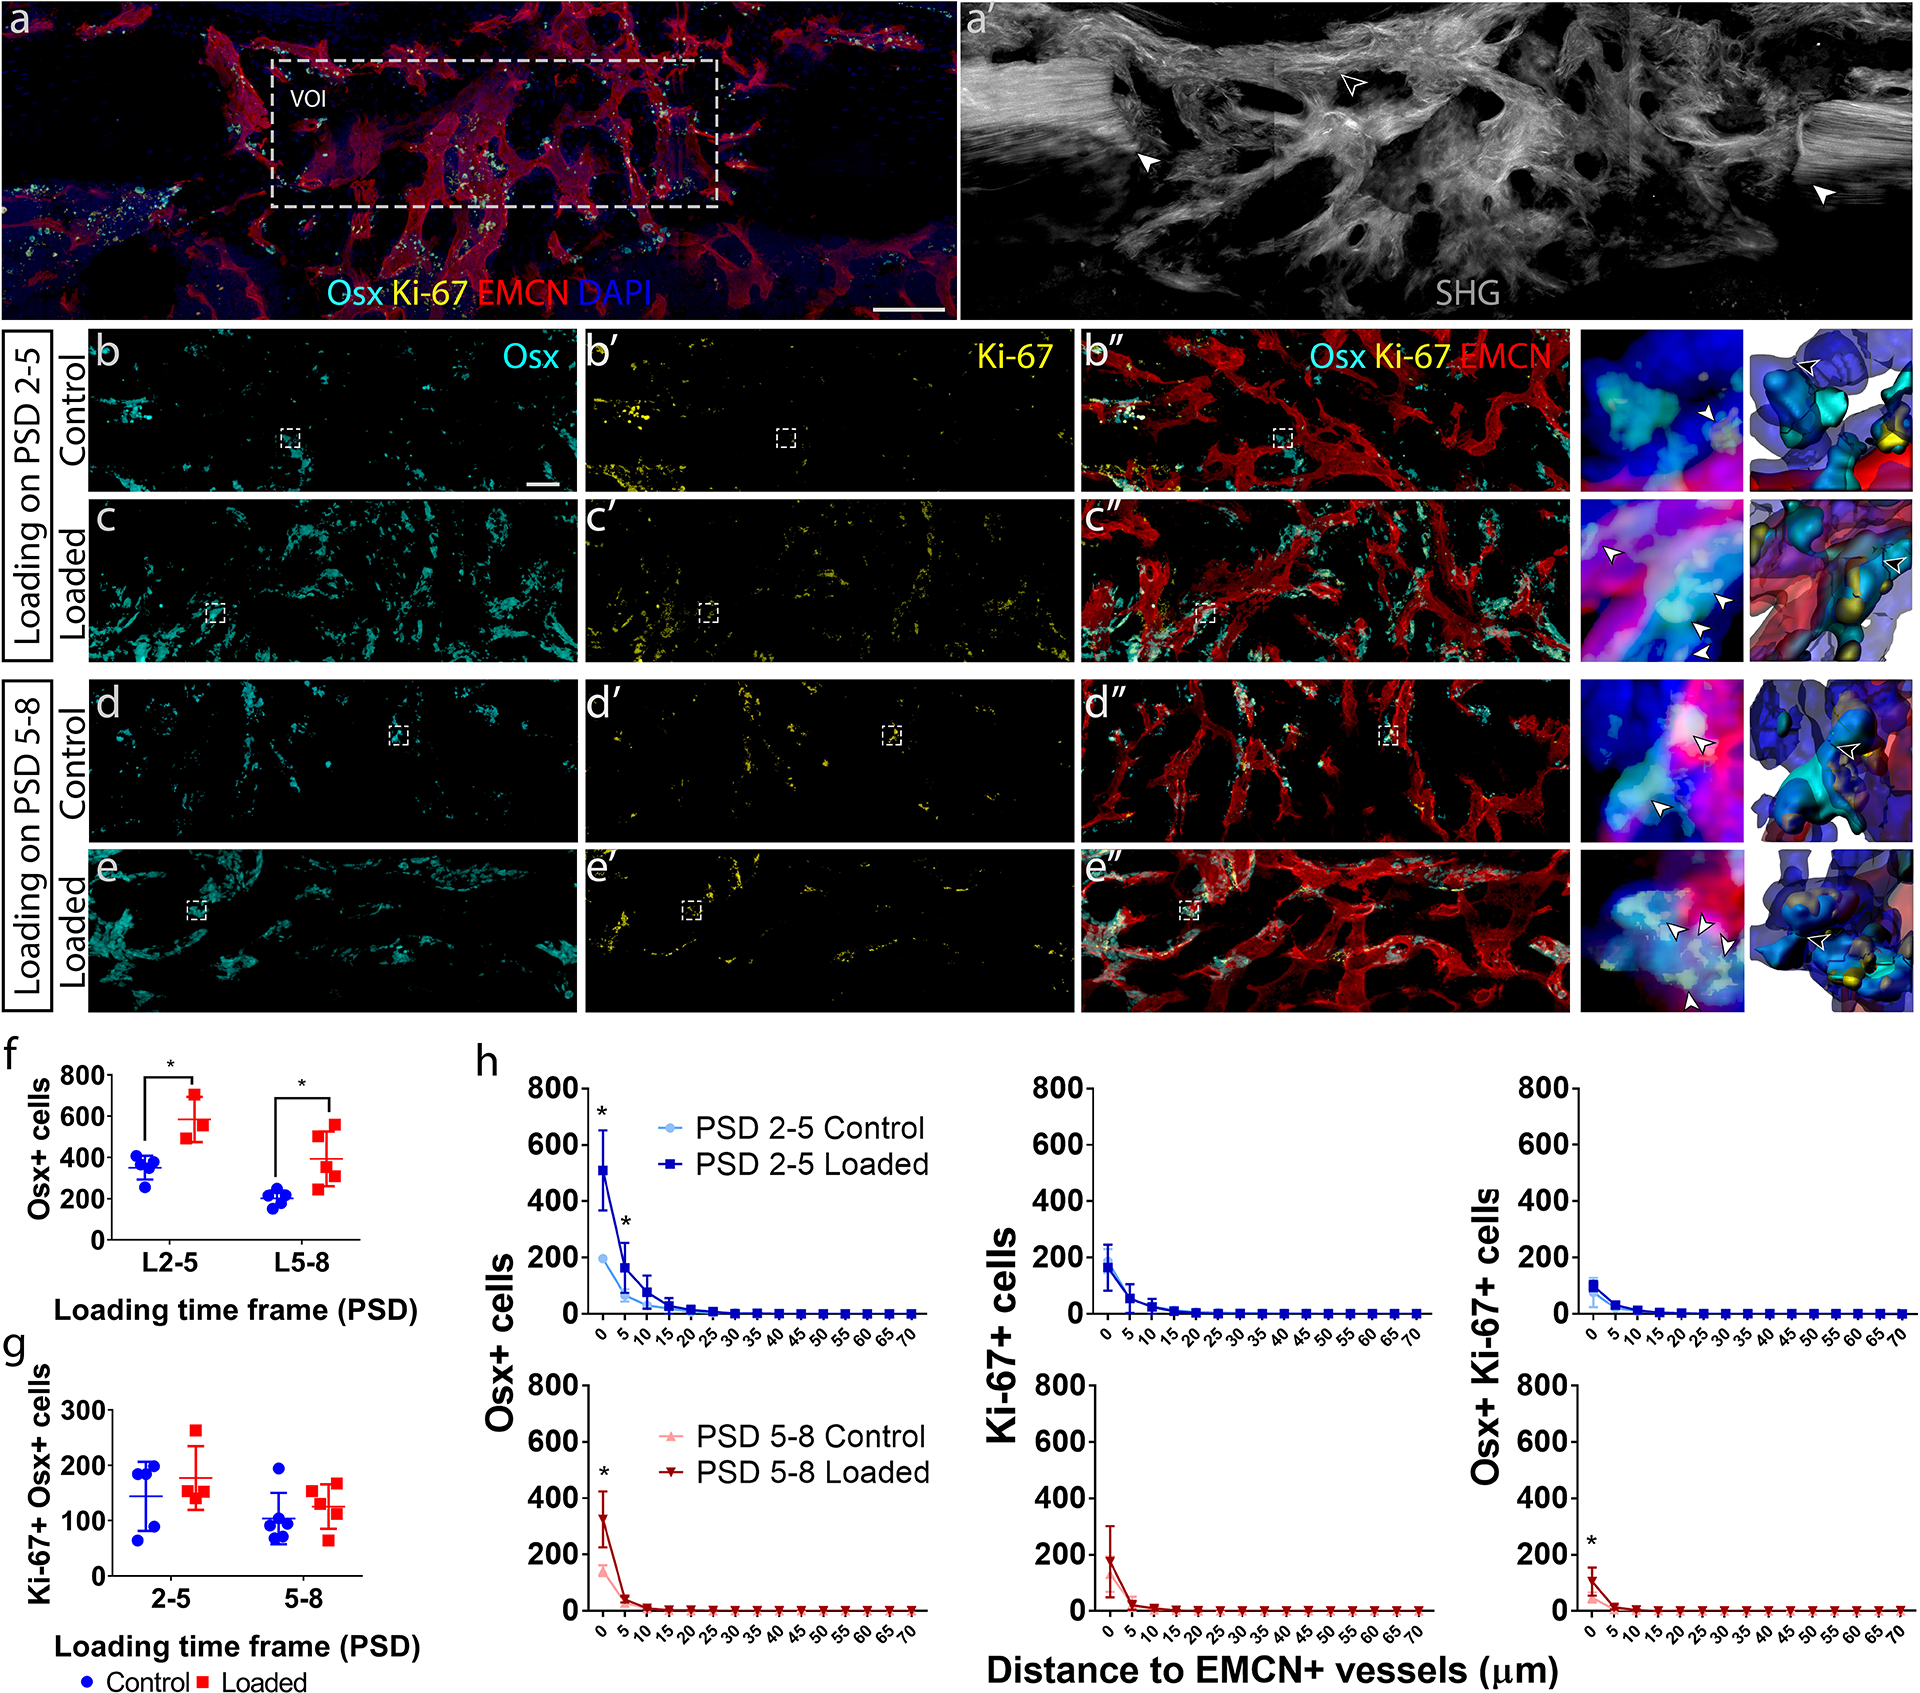
(a) Maximum intensity projection (MIP) of a representative longitudinal thick section from post-surgical day (PSD) 10 immunostained for Osx, EMCN, Ki-67 and DAPI, showing the volume of interest (VOI) selected for quantification. (a’) Sequential section to (a) showing existing cortical bone at the defect edge (white arrowhead) and newly formed bone within the defect (black arrowhead), which were imaged by second harmonic generation (SHG). MIP of (b – e) Osx+ cells, (b’ – e’) Ki-67+ cells, and (b” – e”) composite showing Osx, EMCN, and Ki-67 staining within representative VOI’s from control groups and mechanically stimulated groups (6 N compressive, 2 Hz, 120 cycles/day) from PSD 2–5 and PSD 5–8. Osx, Ki-67 and EMCN staining was done on the same section for each sample. The regions enclosed by the dotted lines in b–e are enlarged to the right of the respective group, followed by segmented surfaces. The white arrows indicate Osx+ Ki-67+ cells. The black arrows indicate cell boundaries as determined by the watershed algorithm. Quantifications show the effect of mechanical loading on the number of (f) osteogenic (Osx+) cells and (g) proliferating (Ki-67+) cells, and (h) the distance distribution of Osx+, Ki-67, and Osx+ Ki-67+ cells to EMCN+ vessels. *P < 0.05, scale bar in (a, a’) = 100 μm, scale bar in (b – e, b’ – e’, b” – e”) = 40 μm. Error bars show standard deviations. N = 5. *P < 0.05
Discussion
In this study, we utilized a stable long bone cortical defect model in mice to investigate the effects of dynamic compressive mechanical loading applied before and after the start of matrix deposition during the repair process. The skeletal progenitor population with osteogenic capacity has been defined as Prrx1+ Sca-1+(20). Our results show an increase in this progenitor population as a result of mechanical loading during the matrix deposition phase of healing. Our results suggest that this expansion was the result of increased proliferation of the Prrx1+ Sca-1+ within the defect site, as indicated by the increased population of Prrx1+ Sca-1+ cells that are also Ki-67+. Proliferation is a key measurement, as it has been shown to correlate with an age-related decline in bone healing(41). We did not observe an increase in proliferating Osx+ cells; therefore, during bone repair, the mechanoresponsive cells appear to be the more primitive Prrx1+ Sca-1+ osteogenic progenitors, compared to the less primitive Prrx1+ Sca-1− cells and Osx+ cells. This may explain why the periosteum, which is a rich source of Sca-1+(25), and Prrx1+(22) cells, is vital in bone repair.
Blood vessel formation and skeletal development are coupled during growth(42,43); and the vascular network acts as a template for bone deposition(44). The association of Osx+ osteogenic cells and blood vessels persist into adulthood(16). Work from our lab has shown that osteoblasts regulate angiogenic activities of vascular endothelial cells after mechanical loading in vitro.(45) Work by Maes et al.(17) has shown Osx+ cells (but not mature osteoblast) invade a bone defect with the vessels. We show that Prrx1+ cells may also co-invade the regenerate with vessels. Thus, while the number of Osx+ cells follows as increase in vascular due to loading, our results suggest their increase is due to proliferation and/or differentiation of primitive cells invading the regenerate.
Osteogenic progenitors and precursor cells are located in the periosteum, endosteum and marrow cavity, with relatively greater numbers in the endosteum vs the periosteum (Fig. S9). The question remains as to which of these sources may contribute to repair. Colnot and colleagues have shown that Prrx1+ osteogenic progenitors invade the injury site and contribute to new bone formation(46). The presence of Prrx1+ Sca-1+ osteogenic progenitors within the regenerate at PSD 10 corroborates with this finding. Though the primary origin of these progenitors is still unclear, as they are also found in large numbers in the marrow (Fig. S9). The Osx+ osteogenic precursors also invade a fracture site with blood vessels (17). We have observed higher distribution of vessels and more Osx+ cells at the endosteum at PSD 2 compared to the periosteum, suggesting the endosteal niche is a contributor of osteogenic cells during repair, though the question of primary progenitor and precursor origins can only be confirmed with real-time in vivo observations.
Collagen fibers within the defect were spatially complementary to blood vessels and are aligned to the long axis of the tibia as a result of dynamic compressive loading during the matrix deposition phase of healing, indicating a profound effect of mechanical forces on matrix organization during repair. But what were the forces that the cells were responding to? Though mechanical stimulation used in this study was compressive in nature with respect to the entire tibia, the tissue-level strain at anterior medial face of the tibia, where the defect is located, has been shown, (12,47) and we have confirmed, to be tensile. Therefore, the vessel and collagen fiber alignment, as well as the cellular responses we observed in this study were presumably in response to this tensile force, though additional data are required for confirmation. In addition, fluid flow shear stress dominates at the cellular level in the marrow(39,40,48) and bone(49–51). The estimation of the fluid flow around the trabecular bone is especially challenging due to the wide range of mechanical properties, interfaces and geometries of bone, marrow and vessels(40,48). Characterization of the healing defect presents a similar challenge, as it is a porous composite of hard and soft tissues and is perfused with vessels. In this study, we have presented an FEA model that simulates the healing process in a cortical defect, which we used to estimate principal directions of stress in a stiffening regenerate. However, we made a number of assumptions such as linear elasticity and an isotropic material, which limited the accuracy of the predictions. Nevertheless, material strength in the longitudinal direction is of particular importance as it is the direction of principle stress under our regime of applied mechanical loading. Within the regenerate, we found longitudinal alignment of both the collagen fibers and EMCN+ blood vessels in response to loading after the start of matrix deposition (PSD 5–8), suggesting that remodeling of both the bone matrix and vascular occur in unison. Also, this re-alignment increased the stiffness of the regenerate to better resist the principle stress (Supplemental S7). However, the coupling of matrix-depositing cells and vascular cells is a key process during bone regeneration that is still poorly understood. The combination of computational models with higher spatial resolution, and imaging methods with greater temporal resolution will be needed to better understand osteo-angio coupling.
Traditionally, bone formation in a cortical defect is studied using microCT and histology(52), and vascular morphology is studied using immunohistochemistry(52) or radio-opaque contrast agents (8). These modalities have lacked the resolution at the cellular and sub-cellular scale. Only recently has immunofluorescence and confocal microscopy been able to image sites such as calvaria defects(53) due to their accessibility. However, calvaria cells have different embryonic origins and calvaria are not typically load-bearing. Though the observation of long bone repair is still challenging, a recent paper described a method to image immunofluorescently stained vessels in femoral defects in mouse with a custom confocal microscope and optical fiber light-guide setup(54). However, this type of equipment has not been accessible to most researchers. In this study, we used an established confocal and multi-photon microscope protocol(55) with readily accessible tools, and a long bone defect model with a well-defined healing process(24), which also allows for controlled mechanical loading(12). We investigated the vessel and bone collagen fiber geometry at the tissue level, and osteogenic progenitors and osteoblast precursors using immunofluorescence and second harmonic generation autofluorescence. We were able to multiplex as many as 5 channels (e.g. EMCN, Osx, Ki-67, DAPI, and SHG) to investigate cell populations at distinct stages of osteogenic differentiation, their activity such as proliferation, and their spatial relationships with blood vessels and newly formed bone matrix. A caveat of this approach, and similar techniques based on immunofluorescence, is the specificity of the antibodies. Evaluating nuclear versus cytoplasmic localization by comparison with DAPI staining is an effective validation method (Supplemental Fig. S11). The fine resolution in our model is especially useful for investigating the cellular response of mechanical loading, which could have significant effects at this length scale. At the same time, we were able to investigate changes in matrix and vascular structure in response to mechanical stimulation.
One limitation in our study is the snap-shot nature of the observation. We chose PSD 10 to measure the effect of anabolic mechanical loading on long bone repair, which should be applied after the start of matrix deposition(8,12). Though we have measured the effect of mechanical loading during the hematoma and cell invasion phase, the dynamics of cell migration and differentiation still need to be elucidated this phase using real-time in vivo imaging. An imaging modality with increased temporal resolution is especially important in studying initial vessel invasion through sprouting angiogenesis, as vessels invade the hematoma as soon as PSD 2, and a primitive vessel network is established by PSD 3.
A second limitation of this study is the specificity of the bone repair model. Though our defect model has the advantage of a well-defined healing program with defined cortical stress and strain patterns, it is repaired through intramembranous ossification, which does not recapitulate the endochondral repair process observed in many orthopedic trauma cases. During endochondral ossification, the stiffness of the entire regenerate is changing throughout the healing process. Existing technology cannot fully characterize mechanical properties in bone, tissue and cell level throughout the healing process. A recent study used stiff and compliant fixators to vary the mechanical load during endochondral ossification in a segmental defect(8). However, tissue and cellular strain during the course of the repair was not addressed, nor is it addressed in our current work. Finite element modeling has provided insights into the mechanical properties of a healing callus(56,57), but direct measurement of the movement of bone fragments is required to characterize strains at the cellular level. Emerging technologies such as miniaturization of sensors, optical detection of strain in deep tissue, and 3D printed fixators with defined mechanical properties, will enable estimation of load-induced stress and stress in an injury undergoing endochondral ossification.
In sum, increasing evidence supports applying controlled mechanical loading as a therapeutic treatment in musculoskeletal repair(58). Understanding the effect of mechanical loading on the spatiotemporal distribution and activities of angiogenic and osteogenic progenitors during bone repair is essential for developing and optimizing treatments for injuries in load-bearing bone, particularly for complications relating to diminished vascularization, such as delayed unions and non-unions. Here we show that within a healing cortical defect, blood vessels, progenitor cell populations, and the growing bone matrix are intimately organized in time and space, suggesting tightly orchestrated remodeling events. We also show that these processes are sensitive to mechanical forces. The new bone matrix is deposited by osteoblasts around a dynamic network of blood vessels. In the space between vessels and bone, osteogenic progenitors proliferate and differentiate. Whether mechanical stimulation directly alter cellular activities within the regenerate, or whether mechanically-induced changes in matrix and vessel organization secondarily regulate cellular activities still needs to be investigated. It is likely a combination of both effects and involves multiple feedback loops between progenitors, vascular endothelial cells, and bone matrix. Taken together, our results advance our fundamental understanding of bone repair and will help optimize therapeutic approaches to enhance fracture healing.
Supplementary Material
Acknowledgements
We thank Emily Fang for assistance in vessel quantification methodology development; Ralph Adams and his laboratory for assistance in immunofluorescence deep tissue imaging methodology; the NYU Microscopy Core for the confocal and two-photon microscopy; the NYU Histopathology Core for assistance in cryo-sectioning.
Footnotes
Supplemental data
This manuscript includes supplementary methods and 11 supplemental figures
Disclosure Page
The authors have no conflicts of interests.
References
- 1.Burge R, Dawson-Hughes B, Solomon DH, Wong JB, King A, Tosteson A. Incidence and economic burden of osteoporosis-related fractures in the United States, 2005–2025. Journal of bone and mineral research. 2007;22(3):465–75. [DOI] [PubMed] [Google Scholar]
- 2.Panagiotis M Classification of non-union. Injury. 2005;36(4):S30–S7.16291321 [Google Scholar]
- 3.Hausman M, Schaffler M, Majeska R. Prevention of fracture healing in rats by an inhibitor of angiogenesis. Bone. 2001;29(6):560–4. [DOI] [PubMed] [Google Scholar]
- 4.Herath SC, Lion T, Klein M, Stenger D, Scheuer C, Holstein JH, et al. Stimulation of angiogenesis by cilostazol accelerates fracture healing in mice. Journal of Orthopaedic Research. 2015;33(12):1880–7. [DOI] [PubMed] [Google Scholar]
- 5.Youngstrom DW, Senos R, Zondervan RL, Brodeur JD, Lints AR, Young DR, et al. Intraoperative delivery of the Notch ligand Jagged-1 regenerates appendicular and craniofacial bone defects. NPJ Regenerative medicine. 2017;2(1):32. [DOI] [PMC free article] [PubMed] [Google Scholar]
- 6.Yung YC, Chae J, Buehler MJ, Hunter CP, Mooney DJ. Cyclic tensile strain triggers a sequence of autocrine and paracrine signaling to regulate angiogenic sprouting in human vascular cells. Proceedings of the National Academy of Sciences. 2009:pnas. 0905891106. [DOI] [PMC free article] [PubMed] [Google Scholar]
- 7.Rosenfeld D, Landau S, Shandalov Y, Raindel N, Freiman A, Shor E, et al. Morphogenesis of 3D vascular networks is regulated by tensile forces. Proceedings of the National Academy of Sciences. 2016;113(12):3215–20. [DOI] [PMC free article] [PubMed] [Google Scholar]
- 8.Boerckel JD, Uhrig BA, Willett NJ, Huebsch N, Guldberg RE. Mechanical regulation of vascular growth and tissue regeneration in vivo. Proceedings of the National Academy of Sciences. 2011;108(37):E674–E80. [DOI] [PMC free article] [PubMed] [Google Scholar]
- 9.Frost HM. Skeletal structural adaptations to mechanical usage (SATMU): 1. Redefining Wolff’s law: The bone modeling problem. Anatomical Record. 1990;226(4):403–13. [DOI] [PubMed] [Google Scholar]
- 10.Riggs CM, Vaughan L, Evans GP, Lanyon L, Boyde A. Mechanical implications of collagen fibre orientation in cortical bone of the equine radius. Anatomy and embryology. 1993;187(3):239–48. [DOI] [PubMed] [Google Scholar]
- 11.Gardner MJ, van der Meulen MC, Demetrakopoulos D, Wright TM, Myers ER, Bostrom MP. In vivo cyclic axial compression affects bone healing in the mouse tibia. Journal of orthopaedic research. 2006;24(8):1679–86. [DOI] [PMC free article] [PubMed] [Google Scholar]
- 12.Liu C, Carrera R, Flamini V, Kenny L, Cabahug-Zuckerman P, George BM, et al. Effects of mechanical loading on cortical defect repair using a novel mechanobiological model of bone healing. Bone. 2018/03/01/ 2018;108:145–55. [DOI] [PMC free article] [PubMed] [Google Scholar]
- 13.Kubow KE, Vukmirovic R, Zhe L, Klotzsch E, Smith ML, Gourdon D, et al. Mechanical forces regulate the interactions of fibronectin and collagen I in extracellular matrix. Nature communications. 2015;6:8026. [DOI] [PMC free article] [PubMed] [Google Scholar]
- 14.Mammoto A, Connor KM, Mammoto T, Yung CW, Huh D, Aderman CM, et al. A mechanosensitive transcriptional mechanism that controls angiogenesis. Nature. 2009;457(7233):1103. [DOI] [PMC free article] [PubMed] [Google Scholar]
- 15.Ramasamy SK, Kusumbe AP, Schiller M, Zeuschner D, Bixel MG, Milia C, et al. Blood flow controls bone vascular function and osteogenesis. Nature communications. 2016;7:13601. [DOI] [PMC free article] [PubMed] [Google Scholar]
- 16.Kusumbe AP, Ramasamy SK, Adams RH. Coupling of angiogenesis and osteogenesis by a specific vessel subtype in bone. Nature. 2014;507(7492):323–8. [DOI] [PMC free article] [PubMed] [Google Scholar]
- 17.Maes C, Kobayashi T, Selig MK, Torrekens S, Roth SI, Mackem S, et al. Osteoblast precursors, but not mature osteoblasts, move into developing and fractured bones along with invading blood vessels. Developmental cell. 2010;19(2):329–44. [DOI] [PMC free article] [PubMed] [Google Scholar]
- 18.Hu K, Olsen BR. Osteoblast-derived VEGF regulates osteoblast differentiation and bone formation during bone repair. The Journal of clinical investigation. 2016;126(2):0-. [DOI] [PMC free article] [PubMed] [Google Scholar]
- 19.Sacchetti B, Funari A, Remoli C, Giannicola G, Kogler G, Liedtke S, et al. No identical “mesenchymal stem cells” at different times and sites: human committed progenitors of distinct origin and differentiation potential are incorporated as adventitial cells in microvessels. Stem cell reports. 2016;6(6):897–913. [DOI] [PMC free article] [PubMed] [Google Scholar]
- 20.Takarada T, Nakazato R, Tsuchikane A, Fujikawa K, Iezaki T, Yoneda Y, et al. Genetic analysis of Runx2 function during intramembranous ossification. Development. 2016;143(2):211–8. [DOI] [PubMed] [Google Scholar]
- 21.Lu X, Beck GR Jr, Gilbert LC, Camalier CE, Bateman NW, Hood BL, et al. Identification of the homeobox protein Prx1 (MHox, Prrx-1) as a regulator of osterix expression and mediator of tumor necrosis factor α action in osteoblast differentiation. Journal of Bone and Mineral Research. 2011;26(1):209–19. [DOI] [PMC free article] [PubMed] [Google Scholar]
- 22.Kawanami A, Matsushita T, Chan YY, Murakami S. Mice expressing GFP and CreER in osteochondro progenitor cells in the periosteum. Biochemical and biophysical research communications. 2009;386(3):477–82. [DOI] [PMC free article] [PubMed] [Google Scholar]
- 23.Wilk K, Yeh S-CA, Mortensen LJ, Ghaffarigarakani S, Lombardo CM, Bassir SH, et al. Postnatal calvarial skeletal stem cells expressing PRX1 reside exclusively in the calvarial sutures and are required for bone regeneration. Stem cell reports. 2017;8(4):933–46. [DOI] [PMC free article] [PubMed] [Google Scholar]
- 24.Colnot C Skeletal cell fate decisions within periosteum and bone marrow during bone regeneration. Journal of Bone and Mineral Research. 2009;24(2):274–82. [DOI] [PMC free article] [PubMed] [Google Scholar]
- 25.van Gastel N, Torrekens S, Roberts SJ, Moermans K, Schrooten J, Carmeliet P, et al. Engineering vascularized bone: osteogenic and proangiogenic potential of murine periosteal cells. Stem Cells. 2012;30(11):2460–71. [DOI] [PubMed] [Google Scholar]
- 26.Kiernan J, Hu S, Grynpas MD, Davies JE, Stanford WL. Systemic Mesenchymal Stromal Cell Transplantation Prevents Functional Bone Loss in a Mouse Model of Age-Related Osteoporosis. Stem cells translational medicine. 2016;5(5):683–93. [DOI] [PMC free article] [PubMed] [Google Scholar]
- 27.Bradaschia-Correa V, Josephson A, Mehta D, Mizrahi M, Neibart S, Liu C, et al. The Selective Serotonin Re-Uptake Inhibitor Fluoxetine Directly Inhibits Osteoblast Differentiation and Mineralization During Fracture Healing in Mice. Journal of Bone and Mineral Research. 2016. [DOI] [PMC free article] [PubMed] [Google Scholar]
- 28.Acar M, Kocherlakota KS, Murphy MM, Peyer JG, Oguro H, Inra CN, et al. Deep imaging of bone marrow shows non-dividing stem cells are mainly perisinusoidal. Nature. 2015;526(7571):126–30. [DOI] [PMC free article] [PubMed] [Google Scholar]
- 29.Carrera R, Flamini V, George B, Hunter D, Liu B, Helms JA, et al. Low magnitude mechanical loading regulates repair events in cortical bone defect healing. J Bone Miner Res 30 (Suppl 1). 2015. [Google Scholar]
- 30.Campbell T, Wong W, Mackie E. Establishment of a model of cortical bone repair in mice. Calcified tissue international. 2003;73(1):49–55. [DOI] [PubMed] [Google Scholar]
- 31.Fritton J, Myers E, Wright T, Van der Meulen M. Loading induces site-specific increases in mineral content assessed by microcomputed tomography of the mouse tibia. Bone. 2005;36(6):1030–8. [DOI] [PubMed] [Google Scholar]
- 32.Mangan AP, Whitaker RT. Partitioning 3D surface meshes using watershed segmentation. IEEE Transactions on Visualization and Computer Graphics. 1999;5(4):308–21. [Google Scholar]
- 33.Cox G, Kable E. Second-harmonic imaging of collagen. Cell Imaging Techniques: Springer; 2006. p. 15–35. [DOI] [PubMed] [Google Scholar]
- 34.Friedl P, Wolf K, Harms G, von Andrian UH. Biological second and third harmonic generation microscopy. Current Protocols in Cell Biology. 2007:4.15. 1–4.. 21. [DOI] [PubMed] [Google Scholar]
- 35.Kanopoulos N, Vasanthavada N, Baker RL. Design of an image edge detection filter using the Sobel operator. IEEE Journal of solid-state circuits. 1988;23(2):358–67. [Google Scholar]
- 36.Liu Z-Q. Scale space approach to directional analysis of images. Applied optics. 1991;30(11):1369–73. [DOI] [PubMed] [Google Scholar]
- 37.Schindelin J, Arganda-Carreras I, Frise E, Kaynig V, Longair M, Pietzsch T, et al. Fiji: an open-source platform for biological-image analysis. Nature methods. 2012;9(7):676. [DOI] [PMC free article] [PubMed] [Google Scholar]
- 38.Schriefer JL, Warden SJ, Saxon LK, Robling AG, Turner CH. Cellular accommodation and the response of bone to mechanical loading. Journal of biomechanics. 2005;38(9):1838–45. [DOI] [PubMed] [Google Scholar]
- 39.Metzger TA, Kreipke TC, Vaughan TJ, McNamara LM, Niebur GL. The in situ mechanics of trabecular bone marrow: the potential for mechanobiological response. Journal of Biomechanical Engineering. 2015;137(1):011006. [DOI] [PubMed] [Google Scholar]
- 40.Birmingham E, Grogan J, Niebur G, McNamara L, McHugh P. Computational modelling of the mechanics of trabecular bone and marrow using fluid structure interaction techniques. Annals of biomedical engineering. 2013;41(4):814–26. [DOI] [PubMed] [Google Scholar]
- 41.Hebb JH, Ashley JW, McDaniel L, Lopas LA, Tobias J, Hankenson KD, et al. Bone healing in an aged murine fracture model is characterized by sustained callus inflammation and decreased cell proliferation. Journal of Orthopaedic Research. 2017. [DOI] [PMC free article] [PubMed] [Google Scholar]
- 42.Ramasamy SK, Kusumbe AP, Wang L, Adams RH. Endothelial Notch activity promotes angiogenesis and osteogenesis in bone. Nature. 2014;507(7492):376–80. [DOI] [PMC free article] [PubMed] [Google Scholar]
- 43.Langen UH, Pitulescu ME, Kim JM, Enriquez-Gasca R, Sivaraj KK, Kusumbe AP, et al. Cell–matrix signals specify bone endothelial cells during developmental osteogenesis. Nature cell biology. 2017;19(3):189. [DOI] [PMC free article] [PubMed] [Google Scholar]
- 44.Shoham AB, Rot C, Stern T, Krief S, Akiva A, Dadosh T, et al. Deposition of collagen type I onto skeletal endothelium reveals a new role for blood vessels in regulating bone morphology. Development. 2016;143(21):3933–43. [DOI] [PMC free article] [PubMed] [Google Scholar]
- 45.Liu C, Cui X, Ackermann TM, Flamini V, Chen W, Castillo AB. Osteoblast-derived paracrine factors regulate angiogenesis in response to mechanical stimulation. Integrative Biology. 2016;8(7):785–94. [DOI] [PMC free article] [PubMed] [Google Scholar]
- 46.De Lageneste OD, Julien A, Abou-Khalil R, Frangi G, Carvalho C, Cagnard N, et al. Periosteum contains skeletal stem cells with high bone regenerative potential controlled by Periostin. Nature communications. 2018;9(1):773. [DOI] [PMC free article] [PubMed] [Google Scholar]
- 47.Pereira AF, Javaheri B, Pitsillides A, Shefelbine S. Predicting cortical bone adaptation to axial loading in the mouse tibia. Journal of the Royal Society Interface. 2015;12(110):20150590. [DOI] [PMC free article] [PubMed] [Google Scholar]
- 48.Coughlin TR, Niebur GL. Fluid shear stress in trabecular bone marrow due to low-magnitude high-frequency vibration. Journal of Biomechanics. 8/31/2012;45(13):2222–9. [DOI] [PubMed] [Google Scholar]
- 49.Cowin SC, Gailani G, Benalla M. Hierarchical poroelasticity: movement of interstitial fluid between porosity levels in bones. Philosophical Transactions of the Royal Society A: Mathematical, Physical and Engineering Sciences. 2009;367(1902):3401–44. [DOI] [PubMed] [Google Scholar]
- 50.Wang L, Ciani C, Doty SB, Fritton SP. Delineating bone’s interstitial fluid pathway in vivo. Bone. 2004;34(3):499–509. [DOI] [PMC free article] [PubMed] [Google Scholar]
- 51.You L, Cowin SC, Schaffler MB, Weinbaum S. A model for strain amplification in the actin cytoskeleton of osteocytes due to fluid drag on pericellular matrix. Journal of biomechanics. 2001;34(11):1375–86. [DOI] [PubMed] [Google Scholar]
- 52.Carvalho RS, Einhorn TA, Lehmann W, Edgar C, Al-Yamani A, Apazidis A, et al. The role of angiogenesis in a murine tibial model of distraction osteogenesis. Bone. 5//2004;34(5):849–61. [DOI] [PubMed] [Google Scholar]
- 53.Huang C, Ness VP, Yang X, Chen H, Luo J, Brown EB, et al. Spatiotemporal analyses of osteogenesis and angiogenesis via intravital imaging in cranial bone defect repair. Journal of Bone and Mineral Research. 2015;30(7):1217–30. [DOI] [PMC free article] [PubMed] [Google Scholar]
- 54.Reismann D, Stefanowski J, Günther R, Rakhymzhan A, Matthys R, Nützi R, et al. Longitudinal intravital imaging of the femoral bone marrow reveals plasticity within marrow vasculature. Nature communications. 2017;8(1):2153. [DOI] [PMC free article] [PubMed] [Google Scholar]
- 55.Kusumbe AP, Ramasamy SK, Starsichova A, Adams RH. Sample preparation for high-resolution 3D confocal imaging of mouse skeletal tissue. Nature protocols. 2015;10(12):1904. [DOI] [PubMed] [Google Scholar]
- 56.Shefelbine SJ, Simon U, Claes L, Gold A, Gabet Y, Bab I, et al. Prediction of fracture callus mechanical properties using micro-CT images and voxel-based finite element analysis. Bone. 2005;36(3):480–8. [DOI] [PubMed] [Google Scholar]
- 57.Miller GJ, Gerstenfeld LC, Morgan EF. Mechanical microenvironments and protein expression associated with formation of different skeletal tissues during bone healing. Biomechanics and modeling in mechanobiology. 2015;14(6):1239–53. [DOI] [PMC free article] [PubMed] [Google Scholar]
- 58.Guo XE, Hung CT, Sandell LJ, Silva MJ. Musculoskeletal mechanobiology: A new era for MechanoMedicine. Journal of Orthopaedic Research®. 2018;36(2):531–2. [DOI] [PubMed] [Google Scholar]
Associated Data
This section collects any data citations, data availability statements, or supplementary materials included in this article.