

Abstract
Background
Cape Town, a South African city with high levels of economic inequality, has gone through two COVID-19 waves. There is evidence globally that low-income communities experience higher levels of morbidity and mortality during the pandemic.
Methods
Age-standardized COVID-19 mortality in the eight sub-districts of Cape Town was compared by economic indicators taken from the most recent Census (unemployment rate, monthly income).
Results
The overall Standardized Death Rate (SDR) for COVID-19 in Cape Town was 1 640 per million, but there was wide variation across the different sub-districts. A linear relationship was seen between sub-districts with high poverty and high COVID-19 SDRs.
Conclusions
Low-income communities in Cape Town experienced higher levels of COVID-19 mortality. As we continue to contend with COVID-19, these communities need to be prioritized for access to quality health care.
Keywords: COVID-19, mortality, low-income
Introduction
South Africa is the most unequal country in the world, with a Gini Coefficient of 0.63 1, 2, and within its cities the same inequities prevail. Post-apartheid Cape Town is a highly divided and unequal city, with socio-economic characteristics still differing along geographic lines 3. In 2016, the city’s population was 4 232 276 and the Gini coefficient was 0.61 4.
Since SARS-CoV-2 reached Cape Town in March 2020, the city has experienced two waves of COVID-19. The first wave peaked in June-July 2020, and the second more severe wave peaked in December 2020 – January 2021, and was driven largely by the new 501.YV2 (B1.351) variant 5, 6.
Data from the United States (USA) has shown that low socio-economic status, and race as its proxy, were significantly associated with COVID-19 incidence and mortality 7. Similar findings have been reported in the United Kingdom (UK) 8– 10. Data from Brazil and Mexico further support the idea that the poorest population groups have lower survival from COVID-19 9, 10.
Cape Town Metro has eight geographic sub-districts. Due to the city’s apartheid history, inequity tends to follow these geographic boundaries and the majority of the population resides in the historically Black African and Coloured (mixed ancestry) areas towards the southeast of the city (see Figure 1 map) 11. There is, however, still some heterogeneity within sub-districts. These low-income communities also tend to be overcrowded and denser, with less access to services like running water and electricity 2. The populations in these areas are also younger, with for instance 1.6% of the population in Khayelitsha being over 65 years of age, compared to 7.3% in Northern 3.
Figure 1. Map of Cape Town Metro, with socio-economic index and population size taken from the 2011 Census 3.

Graphic courtesy of the Western Cape Department of Health.
Since older age is the strongest risk factor for COVID-19 mortality 12, crude mortality rates may mask inequities in COVID-19 outcomes as poorer populations tend to be younger. We therefore aimed to compare the age- and sex-standardized mortality in different geographical areas of Cape Town known to have different income levels.
Methods
This descriptive ecological study was done using aggregate data routinely reported as part of the Western Cape Department of Health’s COVID-19 Surveillance Response, from 1 March 2020 to 28 February 2021. The main outcome of interest was the COVID-19 standardized death rate (SDR) and the main exposures were the economic indicators, for each sub-district. COVID-19 deaths include all deaths ascertained by the services, or through linkage to the national population register in patients with civil identifiers available, in individuals with laboratory confirmed COVID-19 (either PCR or antigen positive). This is limited to deaths within 28-days of a COVID-19 diagnosis or within 14-days of being discharged following admission due to COVID-19, and excludes deaths manually flagged as incidental by case managers or identified as non-natural deaths on the population register.
COVID-19 tests are performed in either the public National Health Laboratory Service or in various private laboratories. The Standardized Death Rate (SDR) is calculated by adjusting for the age and sex breakdown of each sub-district in the province, using the Western Cape Province as the standard population, using Microsoft Excel.
Data on economic indicators was taken from the latest Census in 2011, which is publicly available online 3. Unemployment was defined as “persons who did not work, but who looked for work and were available to work in the reference period”, and the labor force was defined as persons aged 15–64 years 3. The 2011 Census classified households with monthly incomes below ZAR3200, which when converted at the average 2011 exchange rate is around US$ 440 13.
The co-morbidities amongst public sector patients are primarily reported from inferred health episodes at the Provincial Health Data Centre, where routine health data, such as laboratory tests and medication dispensed, is used to infer health conditions 14. The co-morbidities of private patients are reliant on manual capture, and there is the risk of under-ascertainment in this latter group.
No ethics approval was sought for this study, as it relies upon aggregate data from routine reports.
Results
There were 7 643 total COVID-19 related deaths in the Cape Town Metro. The total crude death rate ranged from 1 217 in Northern, to 2 547 in Klipfontein. Adjusted for age, the total standardized death rate for COVID-19 was 1 640 per million overall but ranged from 920 in Northern to 2 686 in Khayelitsha sub-district ( Table 1, Figure 2).
Figure 2. Total COVID-19 Standardized Death Rate (SDR) per million by sub-district.

Graphic courtesy of the Western Cape Department of Health.
Table 1. Total Number of COVID-19 deaths, Crude Death Rate (CDR) per million and Standardized Death Rate (SDR) per million in the Cape Town Metro, in each wave and by sub-district.
| Wave 1 | Wave 2 | Total | ||||||||
|---|---|---|---|---|---|---|---|---|---|---|
| 1 Mar - 31 Oct 2020 | 1 Nov - 28 Feb 2021 | 1 Mar - 28 Feb 2021 | Ratio of
Wave 2 to Wave 1 SDR |
|||||||
| Sub-district | Total
deaths |
CDR per
million |
SDR per
million |
Total
deaths |
CDR per
million |
SDR per
million |
Total
deaths |
CDR per
million |
SDR per
million |
|
| Eastern | 454 | 645 | 656 | 754 | 1070 | 1097 | 1208 | 1715 | 1753 | 1.67 |
| Khayelitsha | 404 | 913 | 1605 | 257 | 581 | 1080 | 661 | 1493 | 2686 | 0.67 |
| Klipfontein | 530 | 1292 | 1234 | 515 | 1255 | 1201 | 1045 | 2547 | 2435 | 0.97 |
|
Mitchells
Plain |
376 | 611 | 793 | 496 | 806 | 1022 | 872 | 1417 | 1815 | 1.29 |
| Northern | 195 | 417 | 313 | 374 | 800 | 608 | 569 | 1217 | 920 | 1.94 |
| Southern | 437 | 732 | 549 | 685 | 1148 | 867 | 1122 | 1880 | 1416 | 1.58 |
| Tygerberg | 503 | 689 | 695 | 797 | 1092 | 1110 | 1300 | 1781 | 1806 | 1.60 |
| Western | 349 | 553 | 529 | 517 | 819 | 790 | 866 | 1372 | 1319 | 1.49 |
| METRO Total | 3248 | 706 | 696 | 4395 | 956 | 943 | 7643 | 1662 | 1640 | 1.35 |
Using the 2011 Census data, the eight sub-districts have differing levels of employment and monthly household income. Among the deceased COVID-19 cases, more private laboratory testing was done in the higher income sub-districts ( Table 2). The scatter plots ( Figure 3a and b) show a linear positive relationship between increasing COVID-19 SDR in a sub-district and (a) percentage of unemployment and (b) percentage of low-income households in a sub-district.
Figure 3a and 3b.
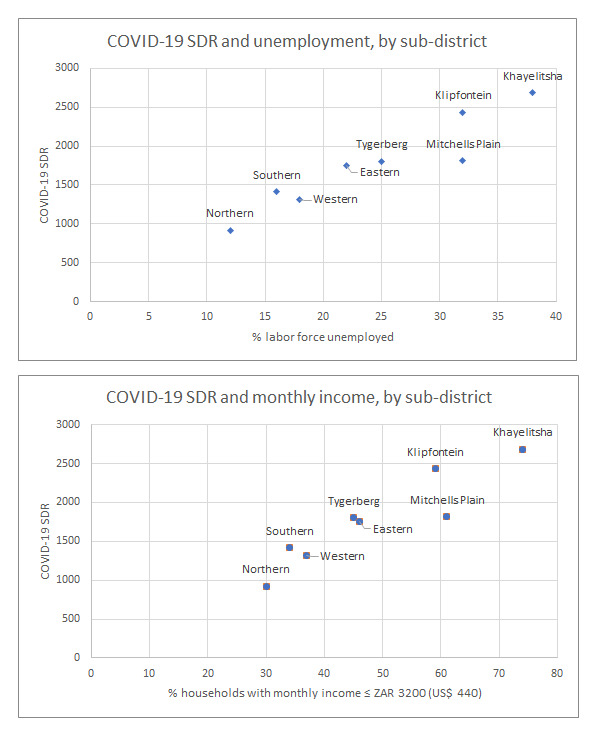
Total COVID-19 Standardized Death Rate (SDR) and percent of labor force unemployed ( a) and household monthly income ( b), taken from the 2011 Census 3, and plotted for each Cape Town Metro sub-district.
Table 2. Economic indicators (taken from 2011 Census 3) and test facility for deceased COVID-19 cases, by sub-district.
| Sub-district | % Labor force
(aged 15-64) unemployed |
% Households with
monthly income ≤ ZAR3200 |
% Private testing for
deceased COVID-19 cases |
|---|---|---|---|
| Eastern | 22 | 46 | 36.3 |
| Khayelitsha | 38 | 74 | 14 |
| Klipfontein | 32 | 59 | 23.9 |
| Mitchells Plain | 32 | 61 | 20.5 |
| Northern | 12 | 30 | 54.9 |
| Southern | 16 | 34 | 42.6 |
| Tygerberg | 25 | 45 | 29.7 |
| Western | 18 | 37 | 41.2 |
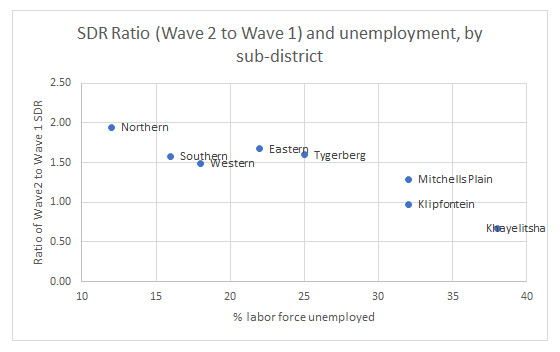
Poorer sub-districts tended to be worse affected in the first wave with relative protection in the second wave. In contrast, wealthier sub-districts had a low SDR during the first wave but were worse affected in the second wave. A linear but inverse relationship was present between percentage unemployment rate in a sub-district and the ratio of Wave 2 to Wave 1 COVID-19 SDRs ( Figure 4).
Figure 4. Ratio of Wave 2 to Wave 1 COVID-19 SDRs and percent of labor forced unemployed, by sub-district.
For the deceased patients with COVID-19, different sub-districts also have differing age structures and co-morbidity burdens. Sub-districts with higher burdens of infectious diseases, particularly HIV and tuberculosis, tended to have younger COVID-19 deaths and an overall higher SDR ( Figure 5 and Figure 6).
Figure 5. Age categories for the deceased COVID-19 patients, by sub-district.

Figure 6. Known co-morbidities in deceased COVID-19 patients, by sub-district (note that tuberculosis includes both previous and current disease).

Discussion
The study suggests that low-income sub-districts had higher COVID-19 SDRs. The SDR for Khayelitsha was almost three times higher than that of Northern, a more affluent sub-district. This finding of a strong socio-economic gradient in COVID-19 mortality is consistent with an expanding literature, and explanations for this association are multifactorial. Individuals in low-income communities with crowded housing, a reliance on public transport and higher numbers of essential workers are less able to implement and maintain social distancing and non-pharmaceutical interventions (NPIs) 7. And they therefore are more likely to get infected with COVID-19, as demonstrated in several South African seroprevalence studies 15– 17.
A SARS-CoV-2 seroprevalence study performed by the South African blood service in four of the nine provinces (Eastern Cape, Northern Cape, Free State and KwaZulu Natal) found substantial differences between different race groups, with Black African donors having seroprevalence rates above 60% and White donors having less than or around 20% 15. While the authors note the limitations of using race as a proxy for socio-economic status, their study highlights the limitations of NPIs in communities with economic deprivation and high population density, or conversely how effective NPIs can be when they are feasible 15. A study on shopping mall workers in Cape Town found a high seroprevalence was associated with informal housing, living in a sub-district with a low-income per household and having a low-earning occupation 16.
In a study from the USA, amongst those diagnosed with COVID-19, poverty was also associated with a higher risk of hospitalization and intensive care unit admission 18. Because of upstream social determinants of health, low-income communities have higher rates of chronic diseases that put them at risk of severe COVID-19 disease 7. Younger age is usually a protective factor for severe COVID-19 disease. However, data from the USA and UK has shown that in communities of color, people of younger ages were still at risk of COVID-19 mortality, because high rates of co-morbidities, such as diabetes and chronic lung , are concentrated in these poor communities 19. The diagnosis and management of these chronic conditions is also inferior, as these same communities often lack access to quality care 20.
Data from a population-based study in the Western Cape during the first wave of the pandemic showed that older age, male sex and diabetes were strongly associated with COVID-19 mortality 12. The study also found that HIV and current tuberculosis, both conditions strongly associated with poverty, were associated with COVID-19 mortality, with a 2.14 (95% confidence interval [CI] 1.70-2.70) and 2.70 (95% CI 1.81-4.04) adjusted hazard ratio, respectively 12. A population-based study from the UK also found a strong association between HIV and COVID-19 mortality 21.
As data on co-morbidities is not collected in a standardized way across the public and private sectors for all cases diagnosed with COVID-19, this study was not able to formally assess the differing burdens of co-morbidities across the sub-districts.
If individuals in low-income communities require in-patient treatment, they are more likely to access the relatively under-resourced public health sector. An analysis of COVID-19 in-hospital mortality in South Africa, found that admission to a public sector compared to a private sector facility was associated with increased risk of mortality (adjusted odds ratio of 1.6; 95% CI 1.4-1.8) 22. This may be due to later presentations to hospital, as well as differences in access to and unequal availability of critical care and other specialized resources or interventions in the public sector.
This study also showed that low-income sub-districts were worse affected in the first wave compared to the second wave, suggesting that infection in the first wave may have conferred some immunity. However, the science on re-infection is still very unclear, and particularly in the context of emerging variants, this should be interpreted cautiously 23.
Limitations of this study include its ecological nature, the lack of standardized co-morbidity data and the fact that the economic data is from 2011. However, while the percentages of individuals living in poverty in each sub-district might have changed with time, and even increased during the pandemic, a reduction in inequality between the sub-districts is unlikely to have occurred. The Western Cape Government reported increasing inequity in Cape Town from 2011 to 2018, with the Gini coefficient for the city increasing from 0.604 in 2011 to 0.617 in 2018 11. An analysis of data from the National Income Dynamics Study (NIDS) in 2017 and the first wave of the NIDS-Coronavirus Rapid Mobile Survey (NIDS-CRAM) suggested that income-related health inequality in the COVID-19 era increased six-fold compared with what was obtained in 2017 24.
The COVID-19 pandemic has exposed the longstanding structural drivers of health inequities globally 25. While all sectors of the population of Cape Town were affected by the pandemic, those living in low-income communities were at higher risk of SARS-CoV-2 infection and of COVID-19-related mortality. Health services need to be preferentially directed to those that need them the most, i.e. the poor. This is not only for COVID-19, but for any subsequent pandemic where low-income communities will remain vulnerable without improved access to care. It will however remain difficult to address the inequities of COVID-19 morbidity and mortality while poverty and income inequality persist.
Data availability
All data underlying the results are available as part of the article and no additional source data are required.
Funding Statement
This work was supported by the Western Cape Provincial Health Data Centre (Western Cape Department of Health), the US National Institutes for Health (grant numbers R01 HD080465 and U01 AI069924), the Bill and Melinda Gates Foundation (grant numbers 1164272 and 119327), the United States Agency for International Development (grant number 72067418CA00023), and the Wellcome Trust (grant number 203135/Z/16/Z) (A.B).
The funders had no role in study design, data collection and analysis, decision to publish, or preparation of the manuscript.
[version 1; peer review: 2 approved]
References
- 1. World Bank: Gini index (World Bank estimate).2021 [cited 2021 Apr 12]. Reference Source [Google Scholar]
- 2. International Bank for Reconstruction and Development / The World Bank: Overcoming Poverty and inequality in South Africa - An assessment of Drivers, Constraints and Opportunities.2018. Reference Source [Google Scholar]
- 3. Statistics South Africa: Cape Town census and population statistics.2011. Reference Source [Google Scholar]
- 4. Western Cape Government: Socio-economic profile. City of Cape Town.2017. Reference Source [Google Scholar]
- 5. Tegally H, Wilkinson E, Giovanetti M, et al. : Emergence and rapid spread of a new severe acute respiratory syndrome-related coronavirus 2 (SARS-CoV-2) lineage with multiple spike mutations in South Africa. medRxiv. 2020;2020.12.21.20248640. 10.1101/2020.12.21.20248640 [DOI] [Google Scholar]
- 6. Jassat W, Cohen C, Mudara C, et al. : Multivariable analysis comparing in-hospital mortality in the first and second wave of Covid-19 in three districts of South Africa. Covid-19 Spec Public Heal Surveill Bull. 2021;18(6). Reference Source [Google Scholar]
- 7. Karmakar M, Lantz PM, Tipirneni R: Association of Social and Demographic Factors With COVID-19 Incidence and Death Rates in the US. JAMA Netw Open. 2021;4(1):e2036462. 10.1001/jamanetworkopen.2020.36462 [DOI] [PMC free article] [PubMed] [Google Scholar]
- 8. Office for National Statistics: Coronavirus (COVID-19) related deaths by ethnic group, England and Wales - : 2 March 2020 to 10 April 2020.2020 [cited 2021 Mar 4]. Reference Source [Google Scholar]
- 9. Millán-Guerrero RO, Caballero-Hoyos R, Monárrez-Espino J: Poverty and survival from COVID-19 in Mexico. J Public Health (Oxf). 2020;fdaa228. 10.1093/pubmed/fdaa228 [DOI] [PMC free article] [PubMed] [Google Scholar]
- 10. Martins-Filho PR, de Souza Araújo AA, Quintans-Júnior LJ, et al. : COVID-19 fatality rates related to social inequality in Northeast Brazil: a neighbourhood-level analysis. J Travel Med. 2020 [cited 2021 Feb 25];27(7):taaa128. 10.1093/jtm/taaa128 [DOI] [PMC free article] [PubMed] [Google Scholar]
- 11. Western Cape Government - Health: Western Cape Burden of Disease - Rapid Review Update 2019.2020. Reference Source [Google Scholar]
- 12. Boulle A, Davies MA, Hussey H, et al. : Risk factors for COVID-19 death in a population cohort study from the Western Cape Province, South Africa. Clin Infect Dis. 2020 [cited 2021 Feb 3];ciaa1198. 10.1093/cid/ciaa1198 [DOI] [PMC free article] [PubMed] [Google Scholar]
- 13. South African Reserve Bank: Selected Historical Rates.[cited 2021 Apr 14]. Reference Source [Google Scholar]
- 14. Boulle A, Heekes A, Tiffin N, et al. : Data centre profile: The provincial health data centre of the western cape province, South Africa. Int J Popul Data Sci. 2019;4(2):1143. 10.23889/ijpds.v4i2.1143 [DOI] [PMC free article] [PubMed] [Google Scholar]
- 15. Sykes W, Mhlanga L, Swanevelder R, et al. : Prevalence of anti-SARS-CoV-2 antibodies among blood donors in Northern Cape, KwaZulu-Natal, Eastern Cape, and Free State provinces of South Africa in January 2021. Res Sq. 2021 [cited 2021 Feb 25];rs.3.rs-233375. 10.21203/rs.3.rs-233375/v1 [DOI] [PMC free article] [PubMed] [Google Scholar]
- 16. Shaw JA, Meiring M, Cummins T, et al. : Higher SARS-CoV-2 seroprevalence in workers with lower socioeconomic status in Cape Town, South Africa. Musuka G, editor. PLoS One. 2021 [cited 2021 Mar 1];16(2):e0247852. 10.1371/journal.pone.0247852 [DOI] [PMC free article] [PubMed] [Google Scholar]
- 17. Hsiao M, Davies MA, Kalk E, et al. : SARS-CoV-2 seroprevalence in the Cape Town metropolitan sub-districts after the peak of infections. Covid-19 Spec Public Heal Surveill Bull. 2020;18(Supplementary Issue 5). Reference Source [Google Scholar]
- 18. Muñoz-Price LS, Nattinger AB, Rivera F, et al. : Racial Disparities in Incidence and Outcomes Among Patients With COVID-19. JAMA Netw Open. 2020;3(9):e2021892. 10.1001/jamanetworkopen.2020.21892 [DOI] [PMC free article] [PubMed] [Google Scholar]
- 19. Klugman KP, Zewdu S, Mahon BE, et al. : Younger ages at risk of Covid-19 mortality in communities of color [version 1; peer review: 2 approved]. Gates Open Res.F1000 Research Ltd;2020;4:69. 10.12688/gatesopenres.13151.1 [DOI] [PMC free article] [PubMed] [Google Scholar]
- 20. Kruk ME, Gage AD, Arsenault C, et al. : High-quality health systems in the Sustainable Development Goals era: time for a revolution. Lancet Glob Health.Elsevier Ltd;2018;6(11):e1196–e1252. 10.1016/S2214-109X(18)30386-3 [DOI] [PMC free article] [PubMed] [Google Scholar]
- 21. Bhaskaran K, Rentsch CT, MacKenna B, et al. : HIV infection and COVID-19 death: a population-based cohort analysis of UK primary care data and linked national death registrations within the OpenSAFELY platform. Lancet HIV. 2021;8(1):e24–e32. 10.1016/S2352-3018(20)30305-2 [DOI] [PMC free article] [PubMed] [Google Scholar]
- 22. Jassat W, Mudara C, Ozougwu L, et al. : Increased mortality among individuals hospitalised with COVID-19 during the second wave in South Africa. medRxiv. 2021;2021.03.09.21253184. 10.1101/2021.03.09.21253184 [DOI] [Google Scholar]
- 23. Cele S, Gazy I, Jackson L, et al. : Escape of SARS-CoV-2 501Y.V2 variants from neutralization by convalescent plasma. medRxiv. 2021;2021.01.26.21250224. 10.1101/2021.01.26.21250224 [DOI] [PMC free article] [PubMed] [Google Scholar]
- 24. Nwosu CO, Oyenubi A: Income-related health inequalities associated with the coronavirus pandemic in South Africa: A decomposition analysis. Int J Equity Health. 2021 [cited 2021 Apr 21];20(1):21. 10.1186/s12939-020-01361-7 [DOI] [PMC free article] [PubMed] [Google Scholar]
- 25. Paremoer L, Nandi S, Serag H, et al. : Covid-19 pandemic and the social determinants of health. BMJ.BMJ Publishing Group;2021;372:n129 . 10.1136/bmj.n129 [DOI] [PMC free article] [PubMed] [Google Scholar]