

Abstract
Aims/Introduction
To investigate and forecast type 2 diabetes mellitus epidemic, its related risk factors and cost in Oman by 2050.
Materials and Methods
An age‐structured mathematical model was used to characterize type 2 diabetes mellitus epidemiology and trends in Oman between 1990 and 2050. The model was parametrized using current and quality data, including six nationally representative population‐based epidemiological surveys for type 2 diabetes mellitus and its key risk factors.
Results
The projected type 2 diabetes mellitus prevalence increased from 15.2% in 2020 to 23.8% in 2050. The prevalence increased from 16.8 and 13.8% in 2020 among women and men to 26.3 and 21.4% in 2050, respectively. In 2020, 190,489 Omanis were living with type 2 diabetes mellitus compared with 570,227 in 2050. The incidence rate per 1,000 person‐years changed from 8.3 in 2020 to 12.1 in 2050. Type 2 diabetes mellitus’ share of Oman’s national health expenditure grew by 36% between 2020 and 2050 (from 21.2 to 28.8%). Obesity explained 56.7% of type 2 diabetes mellitus cases in 2020 and 71.4% in 2050, physical inactivity explained 4.3% in 2020 and 2.7% in 2050, whereas smoking accounted for <1% of type 2 diabetes mellitus cases throughout 2020–2050. Sensitivity and uncertainty analyses affirmed these predictions.
Conclusions
The type 2 diabetes mellitus epidemic in Oman is expected to increase significantly over the next three decades, consuming nearly one‐third of the national health expenditure. The type 2 diabetes mellitus burden is heavily influenced by obesity. Interventions targeting this single risk factor should be a national priority to reduce and control the burden of type 2 diabetes mellitus in Oman.
Keywords: Forecasting model, Non‐communicable disease, Risk factor
The prevalence of type 2 diabetes mellitus in Oman was projected to grow by 57% by 2050, whereas the incidence was projected to grow by 200% by 2050. By 2050, type 2 diabetes mellitus will consume 30% of Oman’s health expenditure. The type 2 diabetes mellitus epidemic in Oman is driven by the high obesity level.

Introduction
Diabetes mellitus is one of the fastest growing global health challenges of the 21st century 1 . Based on the 2019 International Diabetes Federation (IDF) Diabetes Atlas, 463 million adults aged 20–79 years (prevalence of 9.6%) are estimated to be living with diabetes mellitus today, worldwide, and 700 million (prevalence of 10.9%) are projected to be living with the condition by 2045 1 . Specifically, the Middle East and North Africa (MENA) region is estimated to have the highest diabetes mellitus prevalence of all regions in both 2019 and 2045 (i.e., 12.8 and 15.7%, respectively) 1 .
It is well established that type 2 diabetes mellitus, which accounts for approximately 90% of all diabetes mellitus cases, is linked to a variety of non‐modifiable and modifiable risk factors 1 . Non‐modifiable risk factors include age, genetics and sociodemographic factors 2 , 3 , 4 , whereas modifiable risk factors include unhealthy diet, obesity (defined by body mass index ≥30 kg/m2), physical inactivity, tobacco use and alcohol consumption, among others 3 , 5 , 6 , 7 .
Oman is one of the 21 countries and territories of the IDF MENA region, with a population of 4.95 million in 2020, of which 56% are Omanis 8 . With diabetes mellitus being a main concern to policy‐makers in Oman, four national and two regional population‐based surveys were carried out to estimate the diabetes mellitus prevalence and associated cardiovascular risk factors between 1991 and 2017 9 , 10 , 11 , 12 , 13 , 14 , 15 . The surveys reported an increasing diabetes mellitus prevalence among Omani nationals ranging between 11 and 15% 9 , 10 , 11 , 12 , 13 , 14 , 15 . The surveys also reported on the prevalence of key risk factors for diabetes mellitus, including obesity, which ranged between 13 and 35%, tobacco use between 2 and 9%, and physical inactivity between 38 and 42% 9 , 10 , 11 , 12 , 13 , 14 , 15 .
To investigate type 2 diabetes mellitus (not all diabetes mellitus cases) epidemiology and its projections in Oman up to 2050, we extended and adapted a recently developed mathematical modeling approach 16 and applied it to Oman. A key strength of this approach is that it factored (as model input) the totality of existing evidence on type 2 diabetes mellitus and its risk factors in Oman, to elucidate the epidemiology, and to generate inferences and predictions. Specifically, we forecasted the levels and trends in type 2 diabetes mellitus prevalence, incidence and incidence rate, as well as the prevalence of obesity, tobacco use and physical inactivity up to 2050. We also estimated the national heath expenditure directly attributed to type 2 diabetes mellitus, and delineated the epidemiological role of key risk factors in type 2 diabetes mellitus epidemiology in Oman.
Methods
An extension and adaptation of a published type 2 diabetes mellitus compartmental modeling approach 16 , 17 was utilized to describe and characterize the dynamics of the type 2 diabetes mellitus epidemic in the Omani population (only Omani nationals). Description of the conceptual framework, model structure, data sources, model fitting and model analyses are given in Figure 1. Further details on the model can be found in Awad et al. 16 . In brief, this dynamical modeling approach, in contrast to earlier approaches applied to Oman’s type 2 diabetes mellitus epidemic 12 , 18 , 19 , 20 , 21 , captured the interplay between the natural history of type 2 diabetes mellitus, related risk factors and demography. The model also stratified the Omani population by age, sex, and by the general progression states of susceptible and living with type 2 diabetes mellitus. The susceptible and type 2 diabetes mellitus populations were further stratified into different compartments according to their risk factor status including ‘healthy’ (defined as having none of the included type 2 diabetes mellitus‐related risk factors), obesity, tobacco use (hereafter referred to as smoking), physical inactivity and the different overlaps between these risk factors (Figure 1).
Figure 1.
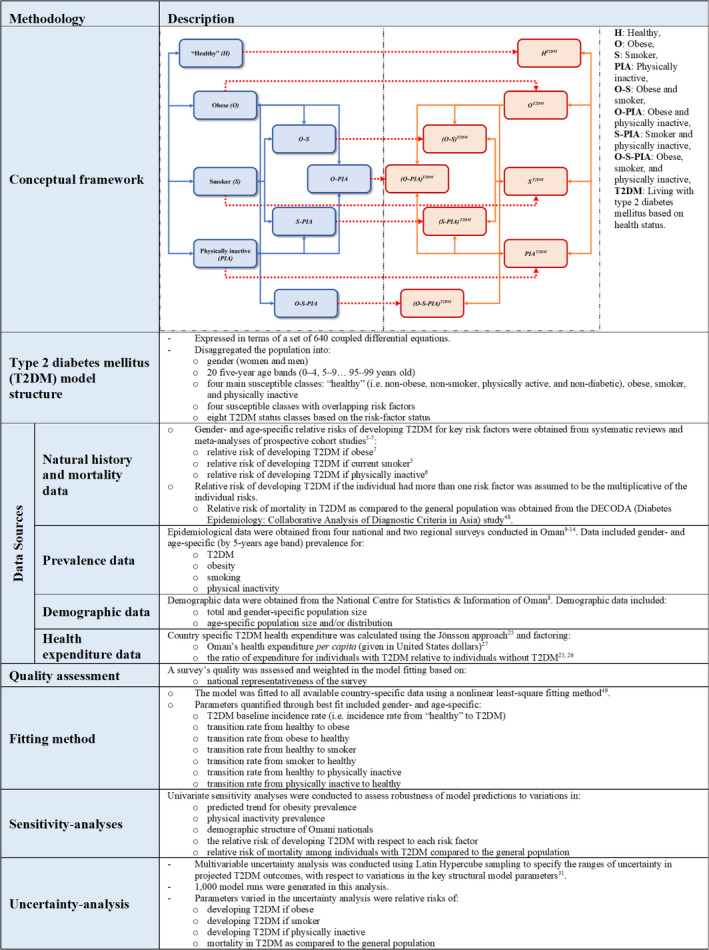
Description of the mathematical modeling methodology applied in the present study. T2DM, type 2 diabetes mellitus.
Data sources and model fitting
Model input parameters were set based on epidemiological and natural history data, as described in Figure 1 and listed in Table S1, or by fitting the model to existing data on demography, type 2 diabetes mellitus prevalence (assuming all reported diabetes mellitus cases were type 2 diabetes mellitus) and type 2 diabetes mellitus‐related risk factors for Oman. The sex‐ and age‐specific demographic structure of the Omani nationals was obtained from the National Center for Statistics and Information of Oman (Figure S1) 8 . Sex‐ and age‐specific type 2 diabetes mellitus, obesity, smoking, and physical inactivity prevalence data were obtained from Oman’s four nationally representative population‐based surveys carried out between 1991 and 2017 9 , 10 , 11 , 15 , as well as from two regional community‐based surveys carried out in the Nizwa district in 2001 and 2010 13 , 14 . The characteristics of these surveys are summarized in Table S2.
All the nationally representative prevalence measures for type 2 diabetes mellitus and its risk factors were equally weighted during model fitting, but the regional prevalence measures were ‘anchored’ to fit only the prevalence trend, and not the absolute prevalence level, as they are not nationally representative. The latter fitting was implemented per an existing ‘anchoring’ fitting method 22 , 23 . The ‘baseline’ type 2 diabetes mellitus incidence rate (in the absence of risk factors accounted for in the model), and six other sex‐ and age‐specific transition rates related to obesity, smoking, and physical inactivity (given in Figure 1) were derived through the model’s best fit of the input data.
Projecting the burden of type 2 diabetes mellitus and risk factors
Using the best fit parameters, the sex‐ and age‐specific prevalence of type 2 diabetes mellitus, obesity, smoking, and physical inactivity were estimated between 1990 and 2050 in the population aged 20–79 years . The total number of prevalent and incident type 2 diabetes mellitus cases (i.e., annual number of new cases), and overall incidence rate (estimated using the ‘baseline’ incidence rate and the relative risks [RRs] of developing type 2 diabetes mellitus with respect to each key risk factor) were also predicted for the studied time period. The RRs were based on pooled global estimates of data from prospective studies 5 , 6 , 7 from multiple settings and countries, as they are related to biological mechanisms that are probably universal in their effect, such as the effect of obesity on onset of diabetes. Through a population attributable fraction approach 16 , 24 , the effect of each risk factor on type 2 diabetes mellitus was also estimated.
To fit the actual obesity trend in the survey data 9 , 10 , 11 , 12 , 13 , 14 , 15 , the age‐specific rate of obesity was allowed to increase (through a logistic function) between 1990 and 2050. Meanwhile, as informed by the survey data 9 , 10 , 11 , 12 , 13 , 14 , 15 , the age‐specific rates of smoking and physical inactivity were assumed constant throughout the studied period. Hence, the demographic structure of the population was the only driving factor of the temporal change in the prevalence of smoking and physical inactivity.
Estimating the health expenditure attributed to type 2 diabetes mellitus
Oman’s health expenditure that is directly attributed to type 2 diabetes mellitus was estimated using the Jönsson approach 25 . This was carried out by adjusting the per capita health expenditure using the relative ratio (R as) of all health expenditure of type 2 diabetes mellitus individuals compared with non‐type 2 diabetes mellitus individuals, as informed by the global literature 25 , 26 .
The temporal change in Oman’s per capita health expenditure was based on the observed historical trend between 1998 and 2010, as reported in Oman’s Health Vision 2050 report (Figure S2) 27 . Meanwhile, between 2011 and 2050, two scenarios were considered: Oman’s per capita health expenditure was fixed at its 2010 level (i.e., $US568 27 ), or the observed trend between 1998 and 2010 was extrapolated into the future (Figure S2) 27 . As informed by the international literature 25 , 26 , an R as between 2 and 3 was applied to bracket the range of type 2 diabetes mellitus‐attributable spending. No discounting was applied for costs.
Sensitivity analyses
Sensitivity analyses were carried out to assess the robustness of our predictions. In the first analysis, instead of the observed increase in the age‐specific obesity prevalence in Oman’s surveys 9 , 10 , 11 , 12 , 13 , 14 , 15 , this prevalence was assumed to be constant between 2017 and 2050 at its 2016 level (Figure S7a). Hence, the demographic structure of the population was the only driving factor of the temporal change in obesity prevalence.
In the second analysis, obesity prevalence was assumed to grow, but at a slower rate than predicted in the main analysis, hence reaching an obesity prevalence in 2050 that was 10 percentage points lower than that projected in the main analysis (Figure S7b). This analysis is meant to reflect the impact of an intervention targeting obesity as part of the national response.
Given the evidence showing that self‐reported physical activity is inflated relative to objective biomarkers 28 , the third sensitivity analysis assessed the effects of a higher (but reasonable at 75%) prevalence of physical inactivity on type 2 diabetes mellitus prevalence (Figure S7c).
Given that the demographic structure in 2040 (i.e., ‘population pyramid’), as reported by the National Center for Statistics and Information of Oman (Figure S8a), is different from that projected for Oman by the Population Division of the United Nations Department of Economic and Social Affairs (Figure S8b) 29 , the fourth sensitivity analysis assessed the effects of a demographic structure that is similar to that of the United Nations Department of Economic and Social Affairs’ projections 29 (by enforcing a declining trend in the birth rate over the next two decades).
Although the estimates of the RRs of developing type 2 diabetes mellitus with respect to each key risk factor and the RR of mortality with type 2 diabetes mellitus were obtained from large and quality prospective studies 5 , 6 , 7 , the robustness of the model predictions were further assessed through additional univariate sensitivity analyses by varying these RRs (using their estimated 95% confidence intervals).
Uncertainty analysis
To specify the range of uncertainty in the estimated and projected type 2 diabetes mellitus outcomes, a multivariable uncertainty analysis of 1,000 runs was carried out. In each uncertainty run of the model, the key structural model parameters (Table S1), including the RR of mortality and of developing type 2 diabetes mellitus if obese, a smoker and physically inactive, were varied simultaneously applying Latin Hypercube sampling from a multidimensional distribution of the parameters. This sampling technique, implemented in MATLAB (2019a; MathWorks, Natick, MA, USA) through the function LHSDESIGN 30 , is a statistical sampling approach to generate random samples of the input parameter values, and systematically uses the information about the whole parameter space in carrying out the uncertainty runs 31 . The technique aims to spread the sampled points evenly across all possible values within the parameter range 31 . For parameters with no prior confidence interval or plausibility range (such as the RR of mortality), we assumed ±30% uncertainty around the parameters’ point estimates, as informed by an existing approach 16 . For each set of new input parameter values, the type 2 diabetes mellitus model was refitted and the 95% uncertainty intervals (UIs) were calculated for each model outcome.
The mathematical model and all analyses were carried out using MATLAB 2019a 30 .
Results
The best fit of the model to the size of the Omani population is in Figure S1. The best fit of the model to the sex‐ and age‐specific prevalence data for type 2 diabetes mellitus (Figure S3), obesity (Figure S4), smoking (Figure S5) and physical inactivity (Figure S6) across the different surveys is also shown in Supporting information. The model produced good fits to these data (fitting process was terminated, and goodness of fit assessed, at a tolerance of 10−4 for the error function 30 ).
Projecting the type 2 diabetes mellitus burden
The model projected an increase in type 2 diabetes mellitus prevalence from 15.2% (95% UI 14.7–15.7) in 2020 to 18.0% (95% UI 17.3–18.9) in 2030 and to 23.8% (95% UI 22.5–25.4) in 2050 (Figures 2a, S10). Type 2 diabetes mellitus prevalence increased among women from 16.8 to 26.2% between 2020 and 2050. Type 2 diabetes mellitus prevalence increased among men from 13.8 to 21.4% between 2020 and 2050 (Figure 2a). For comparison with IDF estimates (please note discussion), type 2 diabetes mellitus prevalence was also projected for the years 2019 and 2045 to be 15.0 and 22.5%, respectively.
Figure 2.
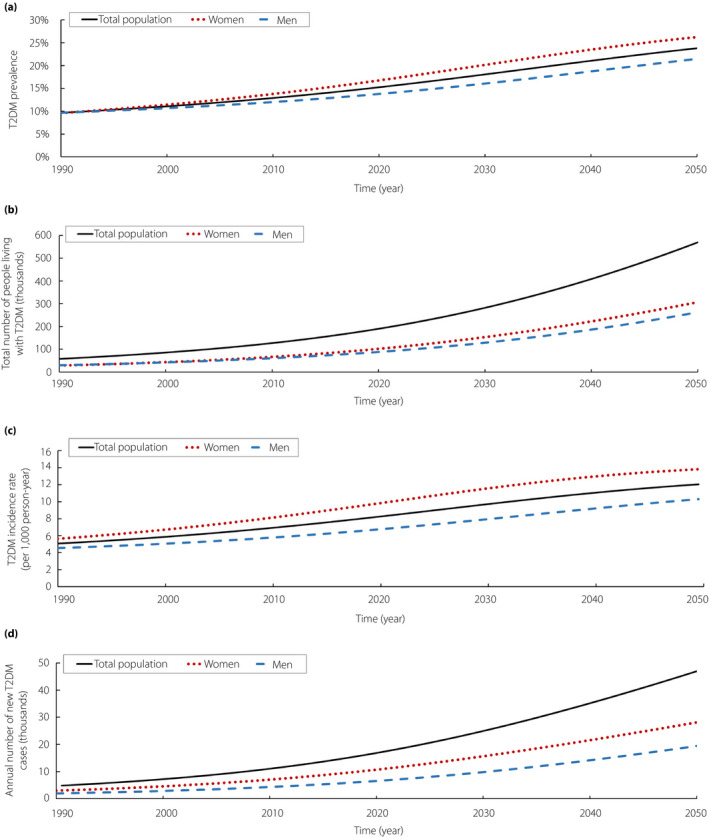
The projected type 2 diabetes mellitus (T2DM) epidemic among Omanis aged 20–79 years, 1990–2050. (a) Type 2 diabetes mellitus prevalence. (b) Total number of Omanis living with type 2 diabetes mellitus. (c) Type 2 diabetes mellitus incidence rate. (d) Annual number of new type 2 diabetes mellitus cases.
The number of Omanis living with type 2 diabetes mellitus was predicted to increase from 190,489 in 2020 to 282,585 in 2030 and to 570,227 in 2050 (Figure 2b), whereas the annual number of new type 2 diabetes mellitus cases (i.e., type 2 diabetes mellitus incidence) increased from 17,230 to 25,432 and to 47,559, respectively (Figure 2d). The incidence rate per 1,000 person‐years also increased from 8.3 in 2020 to 9.7 in 2030 and to 12.1 in 2050 (Figure 2c). The absolute number of type 2 diabetes mellitus prevalent and incident cases, as well as the incidence rate per 1,000 person‐years was higher among Omani women compared with men (Figure 2b–d).
Estimating the health expenditure attributed to type 2 diabetes mellitus
Assuming an R as of 2–3 and fixed per capita health expenditure between 2011 and 2050, the total health expenditure attributed to type 2 diabetes mellitus was estimated to be $97.5–171.1 million in 2020, $140.1–241.0 million in 2030 and $267.1–444.5 million in 2050 (Figure 3a). Given the number of Omanis living with type 2 diabetes mellitus (Figure 2b), $512.0–898.0, $495.8–852.7 and $468.4–779.5 would be spent per type 2 diabetes mellitus patient in 2020, 2030 and 2050, respectively (Figure 3b).
Figure 3.
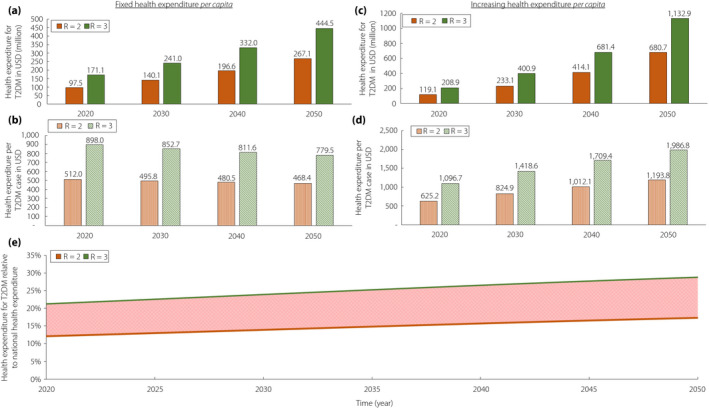
Projected health expenditure on type 2 diabetes mellitus (T2DM) in Oman, 2020–2050. (a) Total expenditure and (b) expenditure per type 2 diabetes mellitus case assuming fixed annual per capita health expenditure between 2011 and 2050. (c) Total expenditure and (d) expenditure per type 2 diabetes mellitus case assuming increasing annual per capita health expenditure between 2011 and 2050 based on extrapolation of the historical trend 27 . (e) Proportion of Oman’s total health expenditure spent on type 2 diabetes mellitus. Health expenditure was calculated as per the Jönsson’s approach 25 . R is the relative ratio of all health expenditures between individuals with and without type 2 diabetes mellitus. It is the key parameter for converting the per capita health expenditure to estimates of type 2 diabetes mellitus‐attributable spending.
Total health expenditure attributed to type 2 diabetes mellitus was $119.1–208.9 million in 2020, $233.1–400.9 million in 2030 and $680.7–1,132.9 million in 2050, assuming an R as of 2–3 and increased per capita health expenditure between 2011 and 2050 (Figures 3c,S2). Given the number of Omanis living with type 2 diabetes mellitus (Figure 2b), $625.2–1,096.7, $824.9–1,418.6 and $1,193.8–1,986.8 would be spent per type 2 diabetes mellitus patient in 2020, 2030 and 2050, respectively (Figure 3d).
For these same years, type 2 diabetes mellitus would consume 12.1–21.2%, 13.8–23.8% and 17.3–28.8% of Oman’s national health expenditure (Figure 3e).
Projecting the prevalence of obesity, smoking and physical inactivity
Assuming continuation of the increasing (logistical) trend in obesity prevalence as per the survey data (Figure S4) 9 , 10 , 11 , 12 , 13 , 14 , the model projected an increase in obesity prevalence from 35.9% in 2020 to 69.1% in 2050 (Figure 4a), with the increase most pronounced for women (Figure 4a). Smoking and physical inactivity prevalence remained stable at 6.6 and 35.0%, respectively, between 2020 and 2050 (Figure 4b,c). Women had lower smoking prevalence (0.3%) than men (12.6% between 2020 and 2050; Figure 4b). Women had higher physical inactivity prevalence (~46% between 2020 and 2050) than men (~25% between 2020 and 2050; Figure 4c).
Figure 4.
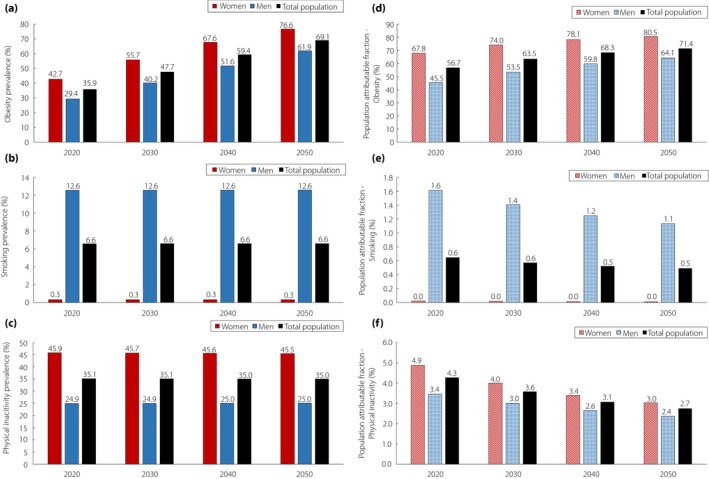
Projections for type 2 diabetes mellitus‐related risk factors among Omanis, 2020–2050. The figure shows the projected prevalence of (a) obesity, (b) smoking and (c) physical inactivity, and proportions of type 2 diabetes mellitus cases that are attributable to (d) obesity, (e) smoking and (f) physical inactivity.
Impact of obesity, smoking and physical inactivity on type 2 diabetes mellitus
The proportion of incident type 2 diabetes mellitus cases attributed to obesity increased from 56.7% in 2020 to 63.5% in 2030 and to 71.4% in 2050 (Figure 4d). In women, this proportion was predicted to increase from 67.8 to 80.5% between 2020 and 2050. In men, this proportion was predicted to increase from 45.5 to 64.1% between 2020 and 2050 (Figure 4d).
The proportion of incident type 2 diabetes mellitus cases attributed to smoking slightly decreased from 0.6% in 2020 and 2030, to 0.5% in 2050 (Figure 4e). In women, this proportion remained stable at 0.02% between 2020 and 2050. In men, this proportion decreased from 1.6 to 1.2% between 2020 and 2050 (Figure 4e).
The proportion of incident type 2 diabetes mellitus cases attributed to physical inactivity also decreased from 4.3% in 2020 to 3.6% in 2030 and to 2.7% in 2050 (Figure 4f). In women, this proportion decreased from 4.9 to 3.0% between 2020 and 2050. In men, this proportion decreased from 3.4 to 2.4% between 2020 and 2050 (Figure 4f).
Sensitivity analyses
Figure 5a shows the impact on type 2 diabetes mellitus prevalence of assuming that the age‐specific obesity prevalence remained stable after 2017 (Figure S7a). Type 2 diabetes mellitus prevalence increased from 15.2% in 2020 to 17.1% in 2050. In women, type 2 diabetes mellitus prevalence increased from 16.8 to 18.7% between 2020 and 2050. In men, type 2 diabetes mellitus prevalence increased from 13.7 to 15.6% between 2020 and 2050 (Figure 5a). Type 2 diabetes mellitus incidence rate per 1,000 person‐years flattened at 7.9 between 2020 and 2050 (Figure S9a).
Figure 5.
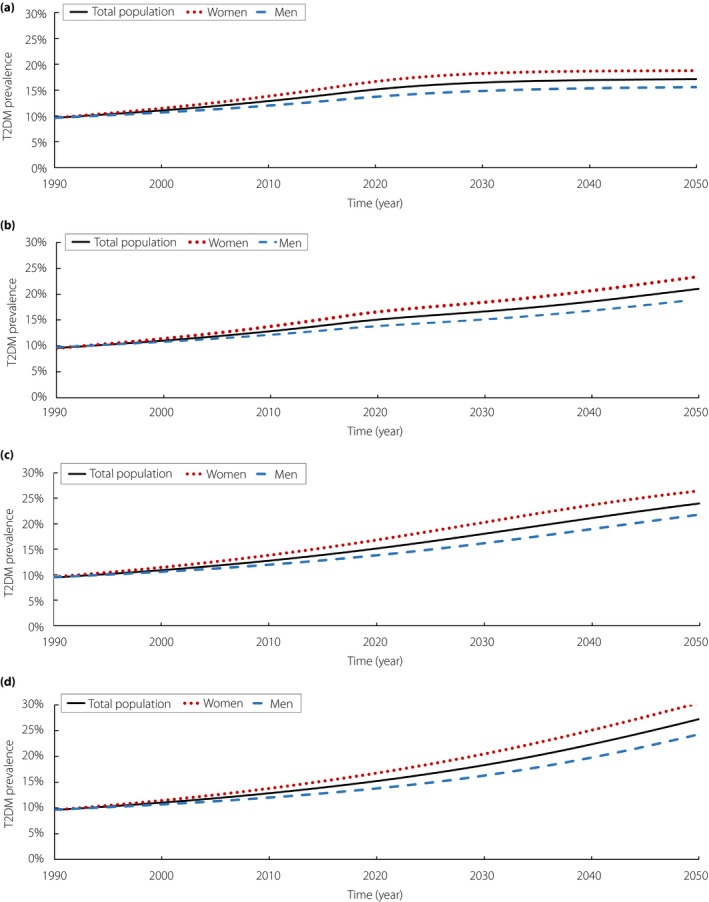
Sensitivity analyses. Projected type 2 diabetes mellitus (T2DM) prevalence in Omanis aged 20–79 years, between 1990 and 2050, assuming (a) the age‐specific obesity prevalence remained stable after 2017, (b) lower obesity prevalence than projected in the main analysis between 2017 and 2050, (c) higher prevalence of physical inactivity than that self‐reported in the Omani surveys 9 , 10 , 11 , 12 , 13 , 14 , and (d) demographic structure similar to that projected by the Population Division of the United Nations Department of Economic and Social Affairs 29 .
Figure 5b shows the impact on type 2 diabetes mellitus prevalence of assuming that obesity prevalence increased at a slower rate compared with the main prediction, hence reaching a prevalence level in 2050 that was 10 percentage points lower (i.e., 59.1% instead of 69.1% in 2050; Figure S7b). Type 2 diabetes mellitus prevalence increased from 15.2% in 2020 to 21.0% in 2050. In women, type 2 diabetes mellitus prevalence increased from 16.8 to 23.4% between 2020 and 2050. In men, type 2 diabetes mellitus prevalence increased from 13.7 to 18.8% between 2020 and 2050 (Figure 5b). The type 2 diabetes mellitus incidence rate per 1,000 person‐years increased from 7.8 to 10.9 between 2020 and 2050 (Figure S9b).
Figure 5c shows the impact on type 2 diabetes mellitus prevalence of assuming a higher (but stable) physical inactivity prevalence of 75% (Figure S7c). Type 2 diabetes mellitus prevalence increased from 15.2% in 2020 to 24.1% in 2050. In women, type 2 diabetes mellitus prevalence increased from 16.8 to 26.5% between 2020 and 2050. In men, type 2 diabetes mellitus prevalence increased from 13.7 to 21.8% between 2020 and 2050 (Figure 5c). The type 2 diabetes mellitus incidence rate per 1,000 person‐years increased from 8.3 to 12.2 between 2020 and 2050 (Figure S9c).
Figure 5d shows the impact on type 2 diabetes mellitus prevalence of assuming a demographic structure that is similar to that projected by the United Nations Department of Economic and Social Affairs for Oman 29 (by enforcing a declining trend in the birth rate over the next two decades; Figure S8b). Type 2 diabetes mellitus prevalence increased from 15.2% in 2020 to 27.2% in 2050. In women, type 2 diabetes mellitus prevalence increased from 16.8 to 30.1% between 2020 and 2050. In men, type 2 diabetes mellitus prevalence increased from 13.7 to 24.3% between 2020 and 2050 (Figure 5d). The type 2 diabetes mellitus incidence rate per 1,000 person‐years increased from 8.5 to 18.2 between 2020 and 2050 (Figure S9d).
Figures S9 and S10 provide further sensitivity analyses showing that the projected type 2 diabetes mellitus prevalence is sensitive to the value of the RR of developing type 2 diabetes mellitus if obese, and the RR of mortality in persons with type 2 diabetes mellitus compared with the general population. However, the projected prevalence was insensitive to variations in the remaining parameters (Figure S10). In 2050, the type 2 diabetes mellitus prevalence ranged from 20.9–26.8% to 22.4–25.3% by varying (over the 95% confidence interval) the RR of developing type 2 diabetes mellitus if obese in women and men, respectively (Figure S10). The type 2 diabetes mellitus prevalence ranged from 22.9–25.0% to 23.2–24.7% by varying the RR of mortality with type 2 diabetes mellitus in women and men, respectively (Figure S10).
Uncertainty analysis
Figure S11 shows the results of the uncertainty analysis for the trend in type 2 diabetes mellitus prevalence between 1990 and 2050. The range of uncertainty was relatively small, highlighting that the predicted type 2 diabetes mellitus prevalence was consistent despite the uncertainty in the input parameters. As the model is constrained by current data, the uncertainty interval was narrow at current times, but wider as we approached 2050.
Discussion
The type 2 diabetes mellitus prevalence in Oman was projected to increase within the next decade (2020–2030) by 18.5%, and further by 31.8% between 2030 and 2050. Over 2020–2050, Oman will witness a nearly 200% increase in the number of Omanis living with type 2 diabetes mellitus as a result of a growing and aging population. This will result in type 2 diabetes mellitus consuming 29% of the national health expenditure by the year 2050 (that is $1 out of every $3 spent on health). Oman currently provides national health services to all Omanis free of charge, mainly through the oil and gas revenues. However, the volatility of this source of income coupled with the emergence of other global threats, such as the one recently witnessed due to the coronavirus disease 2019 pandemic, questions the sustainability of current health service financing (including for diabetes mellitus) 27 .
The relative roles of smoking and physical inactivity in the epidemic were forecasted to decline between 2020 and 2050, despite their prevalences remaining stable, as growing obesity is the key risk factor that will affect the type 2 diabetes mellitus epidemic over the next few decades (Figure 4). These findings show that Oman is confronted with a serious challenge of a high and increasing type 2 diabetes mellitus epidemic if obesity is not controlled over the coming years.
Our projections are based on currently available data for the trends in risk factors and the demographic structure of the population, but future trends could be subject to changes due to intervention programs, among others. Thus, the projections provided in the present study should be compared with and validated with future data coming from nationally representative population‐based surveys for type 2 diabetes mellitus and its risk factors. Having said so, sensitivity analyses using alternative scenarios for the trends in obesity, physical inactivity and demographic structure affirmed the predicted growing trend in type 2 diabetes mellitus prevalence and incidence, but suggested that the projected growth of the epidemic could be smaller (by 13–28%) if the obesity trend stabilizes soon or does not increase substantially over the coming decades.
Several randomized clinical trials showed the feasibility of reducing the risk of type 2 diabetes mellitus by 31–58% by targeting individuals at high risk of type 2 diabetes mellitus with lifestyle interventions, such as diet, exercise or through pharmacological (metformin) interventions 32 , 33 , 34 . Evidence has shown also that structural interventions targeting obesity, smoking and physical inactivity have the potential to positively impact the type 2 diabetes mellitus epidemic 35 . Such interventions include increasing taxation on sugar‐sweetened beverages (i.e., fiscal regulations) or subsidizing healthier foods (such as fruits and vegetables) 35 .
Currently, there are no intervention programs in Oman addressing obesity at the community‐level, and health educational programs or nutritional interventions remain modest 36 . The type 2 diabetes mellitus health response includes dedicated diabetes mellitus clinics at the primary healthcare level with full access to all medications required to treat type 2 diabetes mellitus and associated cardiovascular risk factors, with clear pathways for secondary and tertiary referral services. A local diabetes mellitus registry is also kept in every primary care clinic acting as a surveillance and screening tool for diabetes mellitus complications and for annual screening of diabetes mellitus related complications. Additionally, obesity clinics have recently been introduced in most primary healthcare facilities.
From June 2019, Oman also introduced an excise tax on all soda drinks (50% of retail price) and all energy drinks (100% of retail price), and a 100% tax on all tobacco products 37 . The scope of excise taxation is planned to be widened to include all sugar‐containing drinks from October 2020 38 . Yet, it is not known whether increasing taxation on such products will attenuate the type 2 diabetes mellitus epidemic in Oman. Further considerations and investigations are required to assess the impact of such interventions.
The percentage increase in type 2 diabetes mellitus prevalence projected in the present study was lower than that projected by the IDF for the duration 2019–2045. Our study predicted that the type 2 diabetes mellitus prevalence will increase by 50.0%, whereas the IDF estimated an increase of 67.5% 1 . These differences might be explained by differences in the included survey data inputs, as well as differences in the implemented modeling methodology. We used all survey data available for Oman, and a dynamical population‐level model for type 2 diabetes mellitus and its key risk factors, whereas the IDF approach implements a logistic regression method with a specific criteria for which surveys to be included as input data, apparently including only one survey from Oman 1 . Other studies, using different methodologies, also showed a rapidly growing type 2 diabetes mellitus epidemic in Oman 12 , 39 .
The forecasted increase in the type 2 diabetes mellitus incidence rate in Oman contrasts with the flattening or even decline seen in the type 2 diabetes mellitus incidence rate in high‐income countries 40 . A recent systematic review showed that the type 2 diabetes mellitus incidence rate has flattened or declined in recent years in a number of high‐income countries 40 . The main reason behind the different trajectory between Oman and these countries is the different demographic structure. The Omani population is young (with a median age of 24 years in 2020 8 ), and its aging effect will need to unfold over several decades, thus driving a higher type 2 diabetes mellitus incidence rate.
Nevertheless, the forecasted type 2 diabetes mellitus epidemic in Oman in the present study is similar to that forecasted for other Gulf countries, such as in Kuwait 1 , Saudi Arabia 1 , 41 , United Arab Emirates 1 , Qatar 1 , 16 and Bahrain 1 . It is also similar to that in other MENA countries, beyond the Gulf region, such as in Tunisia 1 , 42 and Jordan 1 , 17 . Although this suggests that there could be homogeneity in the underlying type 2 diabetes mellitus epidemiology in this region despite the differences in the socioeconomic conditions across MENA countries, the underlying demographic structures could be still different. For instance, applying a similar mathematical modeling approach, type 2 diabetes mellitus prevalence in Qatar and Jordan was projected to grow by 43 and 29% by 2050, respectively 16 , 17 , whereas the type 2 diabetes mellitus prevalence in Oman was projected to grow by 56%. These differences are explained in part by differences in the demographic structure of these populations.
The present study had limitations. First, the study did not include the expatriate population of Oman, as this analysis was intended for the permanent and stable population of this country. Expatriates residing in Oman are not permanent residents, they come to Oman for work through work visas and not immigrant visas, and most often stay for a limited number of years. Furthermore, the national surveys 9 , 10 , 11 , 12 , 13 , 14 , 15 that formed the bulk of input data to our model did not include this transient population of Oman, and thus cannot be included in our analyses.
Second, the study did not account for other risk factors for type 2 diabetes mellitus, such as gestational diabetes, diet and hypertension. Although these risk factors were not explicitly accounted for in the model, their impact on type 2 diabetes mellitus prevalence and incidence is indirectly factored in the ‘baseline’ incidence rate; that is, in the part of the population that is not obese, not a smoker and not physically inactive. Thus, explicit inclusion of such factors would only change the baseline incidence rate, but not likely to affect the projections for the type 2 diabetes mellitus prevalence and incidence rate, nor the estimated role of obesity, smoking and physical inactivity.
Third, we used all national surveys carried out in Oman at different time points, but such volume of evidence could result in variations in the survey approach, time‐point, design, geographic coverage, and methods used to ascertain diabetes mellitus and risk factors 43 , 44 . Outcome definitions, potential selection and information biases, and response rates differed from one survey to another 43 , 44 . Our projections, thus, are contingent on the representativeness of these surveys. However, by factoring in the totality of the type 2 diabetes mellitus surveys through such a mathematical modeling approach, model fitting might ensure best fit to data, accounting for adjustments/corrections to these data, as well as weights for the level of confidence in each survey data point – irrespective of the discrepancies and limitations in available data.
Finally, the relative ratio of health expenditure for type 2 diabetes mellitus individuals versus non‐type 2 diabetes mellitus individuals was not age‐dependent nor Oman‐specific. However, to bracket the estimates of the type 2 diabetes mellitus economic burden, we used the conventional range of 2–3 to be consistent with the global empirical evidence 25 . The estimates of the RRs of type 2 diabetes mellitus with respect to the risk factors and the RRs of disease‐related mortality were obtained from large, quality prospective studies that were pooled through global systematic reviews and meta‐analyses 5 , 6 , 7 , albeit the representativeness of these RRs for the population of Oman is unknown. However, given that these RRs were pooled from multiple settings and they represent biological mechanisms that are probably universal in their effect, variations in these RRs might have a limited impact on the present results. Indeed, we carried out several sensitivity analyses to assess the robustness of our predictions to variations in these RRs. The analyses showed that the present results were mainly sensitive to the RR of developing type 2 diabetes mellitus if obese (Figure S10), which is well established in the literature 45 , 46 . We also carried out a multivariable uncertainty analysis to assess the robustness of our predictions. The analysis indicated narrow uncertainty intervals around the point estimates (Figure S11), affirming our predictions.
In conclusion, the type 2 diabetes mellitus epidemic in Oman is projected to substantially increase over the next three decades, consuming a large proportion of the country’s national health expenditure. The main driving factor for this increase is the rising prevalence of obesity. Ensuring long‐term financial sustainability for type 2 diabetes mellitus response in Oman is a concern, given the country’s high public budget contribution, unstable revenues, and the ongoing demographic and epidemiological health transitions. Therefore, the present findings highlight the need for large‐scale population‐level interventions that emphasize on type 2 diabetes mellitus prevention and that alleviate the burden of obesity.
Type 2 diabetes mellitus prevention should be implemented at both national and governorate levels with multi‐sectorial, governmental and societal support, as type 2 diabetes mellitus is an emerging threat to social and economic development. In addition, aiming at reducing the modifiable risk factors for type 2 diabetes mellitus, existing public awareness campaigns and interventions need to be expanded by strengthening the implementation of Oman’s National Policy for Diet, Physical Activity and Health 36 , and introducing legislation on foods and beverages. Furthermore, implementation of the physical activity toolkit, ACTIVE, launched by the World Health Organization 47 , could be beneficial to encourage adoption of active lifestyles and to reduce sedentary lifestyles. Finally, the country needs to streamline the health information systems to guarantee reliable, complete, and quality data for evidence‐based practice and decision‐making in type 2 diabetes mellitus prevention and control.
Disclosure
The authors declare no conflict of interest.
Supporting information
Table S1 | Model assumptions in terms of parameter values.
Table S2 | Characteristics of the Oman’s population‐based surveys used in the analysis for type 2 diabetes mellitus and its risk factors.
Figure S1 | Model predictions for the population size of Omanis overall and stratified by sex, as compared with estimates of the National Center for Statistics and Information of Oman.
Figure S2 | Trend in annual per capita health expenditure (in $US) in Oman between 1998–2010, as reported in Oman’s Health Vision 2050 report.
Figure S3 | Model fit for the sex‐ and age‐specific type 2 diabetes mellitus (T2DM) prevalence in Omanis.
Figure S4 | Model fit for the sex‐ and age‐specific obesity prevalence in Omanis.
Figure S5 | Model fit for the sex‐ and age‐specific smoking prevalence in Omanis.
Figure S6 | Model fit for the sex‐ and age‐specific physical inactivity prevalence in Omanis.
Figure S7 | Assumptions used in three sensitivity analyses.
Figure S8 | Population pyramid in 2040.
Figure S9 | Sensitivity analyses.
Figure S10 | Sensitivity analyses to assess the sensitivity of the model predictions for type 2 diabetes mellitus (T2DM) prevalence in 2050 to variations in the relative risks (RRs) of the T2DM‐related risk factors and RR of mortality in T2DM compared to the general population.
Figure S11 | Uncertainty interval for the prevalence of type 2 diabetes mellitus (T2DM) in Oman between 1990–2050.
Acknowledgments
This publication was made possible by NPRP grant number 10‐1208‐160017 from the Qatar National Research Fund (a member of Qatar Foundation). The statements made herein are solely the responsibility of the authors. The authors are also grateful for infrastructure support provided by the Biostatistics, Epidemiology and Biomathematics Research Core at Weill Cornell Medicine‐Qatar.
J Diabetes Investig 2021; 12: 1162–1174
References
- 1. International Diabetes Federation . IDF Diabetes Atlas, 9th edn. International Diabetes Federation, 2019. Available from: https://www.diabetesatlas.org/upload/resources/2019/IDF_Atlas_9th_Edition_2019.pdf. Accessed November 24, 2019. [Google Scholar]
- 2. Santosa A, Wall S, Fottrell E, et al. The development and experience of epidemiological transition theory over four decades: a systematic review. Glob Health Action 2014; 7: 23574. [DOI] [PMC free article] [PubMed] [Google Scholar]
- 3. Hu FB. Globalization of diabetes: the role of diet, lifestyle, and genes. Diabetes Care 2011; 34: 1249–1257. [DOI] [PMC free article] [PubMed] [Google Scholar]
- 4. World Health Organization . The Global Burden of Disease: 2004 Update. Switzerland: World Health Organization; 2008. Available from: http://www.who.int/healthinfo/global_burden_disease/GBD_report_2004update_full.pdf). [Google Scholar]
- 5. Pan A, Wang Y, Talaei M, et al. Relation of active, passive, and quitting smoking with incident type 2 diabetes: a systematic review and meta‐analysis. Lancet Diabetes Endocrinol 2015; 3: 958–967. [DOI] [PMC free article] [PubMed] [Google Scholar]
- 6. Bull FC, Armstrong TP, Dixon T, Ham S, Neiman A, Pratt M. Comparative Quantification of Health Risks: Global and Regional Burden of Disease Attribution to Selected Major Risk Factors. Chapter 10: Physical Inactivity. World Health Organization; 2004. Available from: http://www.who.int/publications/cra/chapters/volume1/0729‐0882.pdf?ua=1. [Google Scholar]
- 7. Abdullah A, Peeters A, de Courten M, et al. The magnitude of association between overweight and obesity and the risk of diabetes: a meta‐analysis of prospective cohort studies. Diabetes Res Clin Pract 2010; 89: 309–319. [DOI] [PubMed] [Google Scholar]
- 8. National Centre for Statistics & Information of Oman . Population Projections 2020–2040, 2017. Available from: https://ncsi.gov.om/Elibrary/LibraryContentDoc/ben_projection‐Eng_87f44b27‐0bf3‐4a80‐b2d2‐1ead231a0165.pdf. Accessed January 01, 2020.
- 9. Asfour M, Lambourne A, Soliman A, et al. High prevalence of diabetes mellitus and impaired glucose tolerance in the Sultanate of Oman: results of the 1991 national survey. Diabetic Med 1995; 12: 1122–1125. [DOI] [PubMed] [Google Scholar]
- 10. Al Riyami A, Elaty MA, Morsi M, et al. Oman world health survey: part 1‐methodology, sociodemographic profile and epidemiology of non‐communicable diseases in Oman. Oman Med J 2012; 27: 425–443. [PMC free article] [PubMed] [Google Scholar]
- 11. Al‐Lawati JA, Al Riyami AM, Mohammed AJ, et al. Increasing prevalence of diabetes mellitus in Oman. Diabetic Med 2002; 19: 954–957. [DOI] [PubMed] [Google Scholar]
- 12. Al‐Lawati JA, Panduranga P, Al‐Shaikh HA, et al. Epidemiology of diabetes mellitus in Oman: results from two decades of research. Sultan Qaboos Univ Med J 2015; 15: e226–33. [PMC free article] [PubMed] [Google Scholar]
- 13. Oman Ministry of Health . Summary Report of the Nizwa Healthy Lifestyle Project Survey 2001. Muscat: Ministry of Health, 2002. [Google Scholar]
- 14. Al‐Siyabi HA‐AZ, Al‐Hinai H, Al‐Hinai S. Nizwa Healthy Lifestyle Project Evaluation Report. Ad Dakhiliyah: Ministry of Health, 2010. [Google Scholar]
- 15. Oman Ministry of Health . National Health Survey of Non‐Communicable Diseases Risk Factors, 2017. Available from: https://www.who.int/ncds/surveillance/steps/oman/en/Accessed November 24, 2019.
- 16. Awad SF, O’Flaherty M, Critchley J, et al. Forecasting the burden of type 2 diabetes mellitus in Qatar to 2050: a novel modeling approach. Diabetes Res Clin Pract 2018; 137: 100–108. [DOI] [PubMed] [Google Scholar]
- 17. Awad SF, Huangfu P, Dargham SR, et al. Characterizing the type 2 diabetes mellitus epidemic in Jordan up to 2050. Under Review, 2020. [DOI] [PMC free article] [PubMed]
- 18. King H, Aubert RE, Herman WH. Global burden of diabetes, 1995–2025: prevalence, numerical estimates, and projections. Diabetes Care 1998; 21: 1414–1431. [DOI] [PubMed] [Google Scholar]
- 19. Guariguata L, Whiting DR, Hambleton I, et al. Global estimates of diabetes prevalence for 2013 and projections for 2035. Diabetes Res Clini Pract 2014; 103: 137–149. [DOI] [PubMed] [Google Scholar]
- 20. Amos AF, McCarty DJ, Zimmet P. The rising global burden of diabetes and its complications: estimates and projections to the year 2010. Diabet Med 1997; 14(Suppl 5): S1–85. [PubMed] [Google Scholar]
- 21. Mutlu F, Bener A, Eliyan A, et al. Projection of diabetes burden through 2025 and contributing risk factors of changing disease prevalence: an emerging public health problem. J Diabetes Metab 2014; 5: 341. [Google Scholar]
- 22. Ayoub HH, Al Kanaani Z, Abu‐Raddad LJ. Characterizing the temporal evolution of the hepatitis C virus epidemic in Pakistan. J Viral Hepat 2018; 25: 670–679. [DOI] [PubMed] [Google Scholar]
- 23. Ayoub HH, Chemaitelly H, Kouyoumjian SP, et al. Characterizing the historical role of parenteral antischistosomal therapy in hepatitis C virus transmission in Egypt. Int J Epidemiol 2020; 49: 798–809. [DOI] [PMC free article] [PubMed] [Google Scholar]
- 24. Llorca J, Delgado‐Rodriguez M. A new way to estimate the contribution of a risk factor in populations avoided nonadditivity. J Clin Epidemiol 2004; 57: 479–483. [DOI] [PubMed] [Google Scholar]
- 25. Jonsson B. The economic impact of diabetes. Diabetes Care 1998; 21(Suppl 3): C7–C10. [DOI] [PubMed] [Google Scholar]
- 26. Bommer C, Heesemann E, Sagalova V, et al. The global economic burden of diabetes in adults aged 20–79 years: a cost‐of‐illness study. Lancet Diabetes Endocrinol 2017; 5: 423–430. [DOI] [PubMed] [Google Scholar]
- 27. Undersecretariat for Planning Affairs . Health Vision 2050, Quality Care Sustained Health. Muscat: Ministry of Health, 2014. Available from: https://www.moh.gov.om/documents/16506/119833/Health+Vision+2050/7b6f40f3‐8f93‐4397‐9fde‐34e04026b829. Accessed May 31, 2020. [Google Scholar]
- 28. National Health Service . Health Survey for England 2008‐Physical activity and fitness. NHS, 2009. Available from: http://www.hscic.gov.uk/pubs/hse08physicalactivity. Accessed November 24, 2019. [Google Scholar]
- 29. United Nations, Department of Economic and Social Affairs, Population Division . World Population Prospects: The 2019 Revision, DVD Edition. 2019. Available from: https://esa.un.org/unpd/wpp/Download/Standard/Population/. Accessed November 24, 2019.
- 30. The MathWorks, Inc . MATLAB. The language of technical computing. 8.5.0.197613 (R2019a). Natick, Massachusetts: ed: The MathWorks, Inc., 2019. [Google Scholar]
- 31. Stein M. Large sample properties of simulations using latin hypercube sampling. Technometrics 1987; 29: 143–151. [Google Scholar]
- 32. Tuomilehto J, Schwarz P, Lindström J. Long‐term benefits from lifestyle interventions for type 2 diabetes prevention: time to expand the efforts. Diabetes Care 2011; 34(Supplement 2): S210–4. [DOI] [PMC free article] [PubMed] [Google Scholar]
- 33. Lindstrom J, Ilanne‐Parikka P, Peltonen M, et al. Sustained reduction in the incidence of type 2 diabetes by lifestyle intervention: follow‐up of the Finnish Diabetes Prevention Study. Lancet 2006; 368: 1673–1679. [DOI] [PubMed] [Google Scholar]
- 34. Knowler WC, Fowler SE, Hamman RF, et al. 10‐year follow‐up of diabetes incidence and weight loss in the Diabetes Prevention Program Outcomes Study. Lancet 2009; 374: 1677–1686. [DOI] [PMC free article] [PubMed] [Google Scholar]
- 35. Afshin A, Penalvo JL, Del Gobbo L, et al. The prospective impact of food pricing on improving dietary consumption: a systematic review and meta‐analysis. PLoS One 2017; 12: e0172277. [DOI] [PMC free article] [PubMed] [Google Scholar]
- 36. Mabry R, Owen N, Eakin E. A national strategy for promoting physical activity in Oman: a call for action. Sultan Qaboos Univ Med J 2014; 14: e170–e5. [PMC free article] [PubMed] [Google Scholar]
- 37. Ministry of Legal Affairs . Royal Decree 23/2019 Promulgating the Excise Tax Law, 2019. Available from: http://mola.gov.om/eng/legislation/decrees/details.aspx?Id=553&type=L Accessed May 20, 2020.
- 38. Oman adds “sweetened drinks” to the “sin‐tax” list, 2020. Available from: http://wafoman.com/2020/06/18/oman‐adds‐sweetened‐drinks‐to‐the‐sin‐tax‐list/?lang=en. Accessed June 25, 2020.
- 39. Al‐Riyami A. Type 2 diabetes in Oman: can we learn from the Lancet editorial. Oman Med J 2010; 25: 153–154. [DOI] [PMC free article] [PubMed] [Google Scholar]
- 40. Magliano DJ, Islam RM, Barr ELM, et al. Trends in incidence of total or type 2 diabetes: systematic review. BMJ 2019; 366: l5003. [DOI] [PMC free article] [PubMed] [Google Scholar]
- 41. Al‐Quwaidhi AJ, Pearce MS, Sobngwi E, et al. Comparison of type 2 diabetes prevalence estimates in Saudi Arabia from a validated Markov model against the International Diabetes Federation and other modelling studies. Diabetes Res Clini Pract 2014; 103: 496–503. [DOI] [PMC free article] [PubMed] [Google Scholar]
- 42. Saidi O, O’Flaherty M, Mansour NB, et al. Forecasting Tunisian type 2 diabetes prevalence to 2027: validation of a simple model. BMC Public Health 2015; 15: 104. [DOI] [PMC free article] [PubMed] [Google Scholar]
- 43. Galea S, Tracy M. Participation rates in epidemiologic studies. Ann Epidemiol 2007; 17: 643–653. [DOI] [PubMed] [Google Scholar]
- 44. Marston M, Harriss K, Slaymaker E. Non‐response bias in estimates of HIV prevalence due to the mobility of absentees in national population‐based surveys: a study of nine national surveys. Sex Transm Infect. 2008; 84(Suppl 1): i71–i7. [DOI] [PMC free article] [PubMed] [Google Scholar]
- 45. Staimez LR, Weber MB, Narayan KMV, et al. A systematic review of overweight, obesity, and type 2 diabetes among Asian American subgroups. Curr Diabetes Rev 2013; 9: 312–331. [DOI] [PMC free article] [PubMed] [Google Scholar]
- 46. Guh DP, Zhang W, Bansback N, et al. The incidence of co‐morbidities related to obesity and overweight: a systematic review and meta‐analysis. BMC Public Health 2009; 9: 88. [DOI] [PMC free article] [PubMed] [Google Scholar]
- 47. World Health Organization . ACTIVE: a technical package for increasing physical activity, 2018. Available from: https://apps.who.int/iris/bitstream/handle/10665/275415/9789241514804‐eng.pdf?ua=1 Accessed June 1, 2020.
Associated Data
This section collects any data citations, data availability statements, or supplementary materials included in this article.
Supplementary Materials
Table S1 | Model assumptions in terms of parameter values.
Table S2 | Characteristics of the Oman’s population‐based surveys used in the analysis for type 2 diabetes mellitus and its risk factors.
Figure S1 | Model predictions for the population size of Omanis overall and stratified by sex, as compared with estimates of the National Center for Statistics and Information of Oman.
Figure S2 | Trend in annual per capita health expenditure (in $US) in Oman between 1998–2010, as reported in Oman’s Health Vision 2050 report.
Figure S3 | Model fit for the sex‐ and age‐specific type 2 diabetes mellitus (T2DM) prevalence in Omanis.
Figure S4 | Model fit for the sex‐ and age‐specific obesity prevalence in Omanis.
Figure S5 | Model fit for the sex‐ and age‐specific smoking prevalence in Omanis.
Figure S6 | Model fit for the sex‐ and age‐specific physical inactivity prevalence in Omanis.
Figure S7 | Assumptions used in three sensitivity analyses.
Figure S8 | Population pyramid in 2040.
Figure S9 | Sensitivity analyses.
Figure S10 | Sensitivity analyses to assess the sensitivity of the model predictions for type 2 diabetes mellitus (T2DM) prevalence in 2050 to variations in the relative risks (RRs) of the T2DM‐related risk factors and RR of mortality in T2DM compared to the general population.
Figure S11 | Uncertainty interval for the prevalence of type 2 diabetes mellitus (T2DM) in Oman between 1990–2050.