Abstract
Objectives
Inflammatory bowel disease (IBD) is characterised by dysregulated mucosal immune responses associated with genetic, environmental and microbial factors. Recent therapies targeting key inflammatory mediators such as tumor necrosis factor (TNF)‐α emphasise the importance of innate immunity in the development of IBD.
Methods
We examined the distribution of innate immune cells such as innate lymphoid cells (ILCs) and myeloid cells in the intestinal epithelium from children diagnosed as IBD and murine models of colitis induced by dextran sulphate sodium (DSS) or an anti‐CD40 antibodies.
Results
We found an increased number of type 3 ILCs (ILC3s) that do not express the natural cytotoxicity receptor (NCR) and neutrophils, in both human IBD patients and colitis‐induced mice. A co‐culture experiment of neutrophils with NCR‐ ILC3s revealed that NCR‐ ILC3s stimulate neutrophils by producing granulocyte–macrophage colony‐stimulating factor (GM‐CSF). Furthermore, a blockade of GM‐CSF could inhibit the development of IBD by inhibiting neutrophil activity.
Conclusion
The NCR‐ ILC3: GM‐CSF: neutrophil axis could contribute to the development of IBD.
Keywords: granulocyte, Inflammatory bowel diseases, innate lymphoid cells, macrophage colony‐stimulating factor, neutrophils
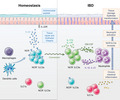
We showed type 3 innate lymphoid cells (ILC3s) that do not express natural cytotoxicity receptor (NCR), and neutrophils, are increased in the inflamed colons from both humans and mice. NCR‐ ILC3s produce granulocyte‐macrophage colony‐stimulating factor (GM‐CSF) and, in turn, stimulate neutrophils. This NCR‐ ILC3s: GM‐CSF: neutrophil axis may be a critical innate aspect of inflammatory bowel disease.
Introduction
Inflammatory bowel disease (IBD), consisting of Crohn’s disease (CD) and ulcerative colitis (UC), is a complex chronic inflammatory condition of the human gut of unknown causes. 1 Various genetic and environmental factors have been associated with the onset of IBD, including abnormal gut microbiota, dysregulation of the immune response, smoking, diet, medications, and pollutants, indicating that IBD arises through multiple mechanisms. 2 , 3 Early efforts to understand disease pathogenesis primarily focused on adaptive T‐cell responses; however, lots of evidence suggest that alterations in the innate immune system also contribute to disease progression. 4 Because IBD pathogenesis, including its causes, exacerbation, and recurrence is incompletely understood, it is necessary to explore whether there are as yet unrevealed mechanisms associated with IBD.
Recent advances in mucosal immunology indicate that innate immunity also plays an essential role in the pathogenesis of IBD. In the intestine, neutrophils migrate to the lamina propria (LP) and epithelial barrier by bacteria‐derived inflammatory mediators 5 and act to eliminate microorganisms by phagocytosis, by releasing reactive oxygen species, and by forming neutrophil extracellular traps. 6 However, abnormally activated neutrophils can damage tissue, resulting in the progression of chronic inflammation. Innate lymphoid cells (ILCs) are also essential for intestinal homeostasis. 7 , 8 Although lacking rearranged antigen‐specific receptors, ILCs resemble T cells in having similar key transcription factors and producing similar cytokines. Among ILCs, ILC3s can be subdivided further based on their differential expression of natural cytotoxicity receptors (NCRs, i.e., NKp44, NKp46, and NKp30). 7 ILCs rapidly respond to environmental signals and contribute to the initial immune responses to pathogens, such as extracellular bacteria, helminths, and viruses. 9 Also, recent studies suggest that ILCs are involved in the pathogenesis of chronic inflammatory diseases, such as allergic reactions, cancer, and IBD. 10 , 11 , 12 , 13 In the intestines, ILC3s that secrete granulocyte–macrophage colony‐stimulating factor (GM‐SCF) activate dendritic cells and macrophages to promote the expansion of regulatory T cells. 14 ILC3s also inhibit commensal‐specific T cells by direct contact with the MHCII receptor and withdrawal of IL‐2. 15 , 16 Meanwhile, ILC3‐driven GM‐SCF can exacerbate inflammation by recruiting intestinal inflammatory monocytes. 17 , 18
These examples illustrate the integration of environmental signals into the function of innate cells such as ILCs and myeloid cells by interactions with various tissue‐resident immune cells. 19 However, the mechanisms underlying the crosstalk between ILCs and intestinal myeloid cells remain unclear, especially the functional role of these cells in mucosal inflammation, particularly in IBD. The purpose of this study was to investigate the distribution of ILC subsets and myeloid cells in the colons of patients with IBD and to assess the interactions between ILCs and myeloid cells in a mouse model of colitis. We noted the increase in NCR‐ ILC3s and neutrophils, but the decrease in NCR+ ILC3s in the inflamed tissue from IBD patients and mice. GM‐CSF produced by NCR‐ ILC3s induced the activation of neutrophils and contributed to the progression of IBD. These results suggest a new mechanism of the IBD pathogenesis, and a better understanding of these innate interactions is required to develop effective treatment strategies for IBD.
Results
Increased NCR‐ ILC3s in the colons of IBD patients show an inverse correlation with NCR+ ILC3s
ILCs can affect tissue homeostasis or inflammation by interacting with other immune cells in the intestines. 4 , 20 To investigate the potential role of ILCs in intestinal inflammation, the distribution of ILCs was assessed in colonoscopic biopsies from paediatric patients with IBD and non‐IBD controls by flow cytometry (Figure 1a, Supplementary figure 1a). The patients with CD and UC were divided into quiescent and active status, depending on the degree of inflammation. The frequency of total ILCs was comparable between groups and was not affected by disease status (Figure 1b). Although the percentage of ILC2s was very low, NCR+ ILC3s were the dominant population in the colon of the non‐IBD group (Figure 1c, d). However, the frequency of NCR+ ILC3s decreased, while that of NCR‐ ILC3s increased in the IBD (Figure 1c, d). A separate analysis of CD and UC patients showed a similar pattern (Supplementary figure 1b, c). When ILCs were compared between non‐inflamed and inflamed tissues from the same donor, ILC1s and NCR‐ ILC3s were significantly increased in the inflamed tissue compared with non‐inflamed tissue (Figure 1e). Both ILC1s and NCR‐ ILC3s were increased in the colon of IBD, but a strong negative correlation was observed only between NCR+ ILC3s and NCR‐ ILC3s (Figure 1f, g).
Figure 1.
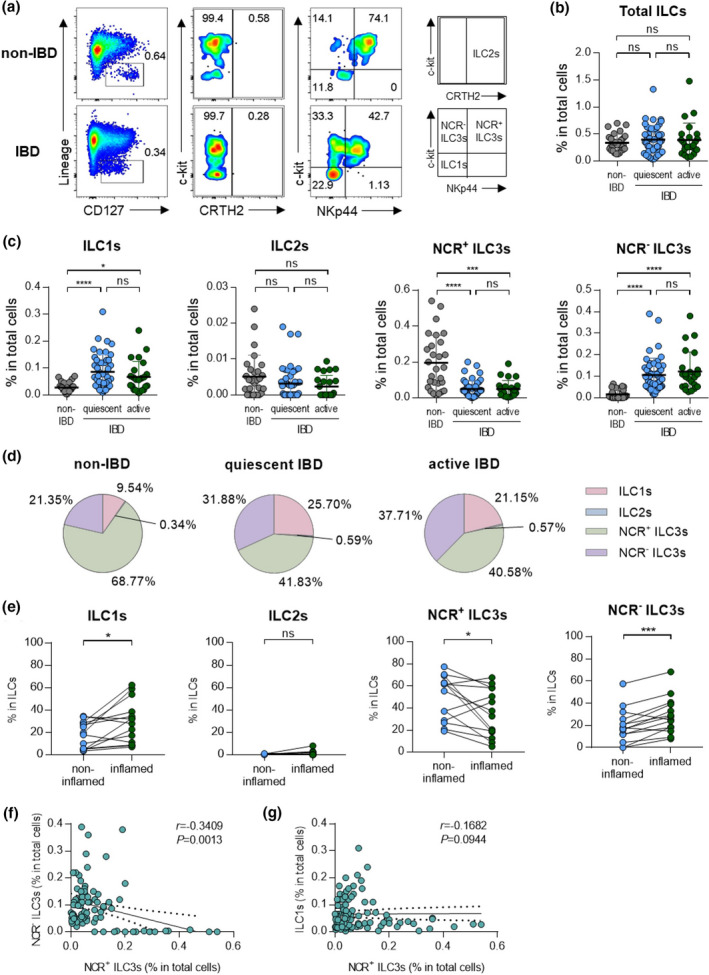
Distribution of ILCs in non‐IBD subjects and patients with IBD. (a) Representative flow cytometry plots of ILC subsets in colonoscopic biopsies. (b) Percentage of total ILCs in colonoscopic biopsies of non‐IBD subjects (n = 30) and IBD patients with quiescent (n = 49) and active (n = 29) status. Data are presented as mean ± SD (one‐way ANOVA). (c) The percentage of ILCs in colonoscopic biopsies of non‐IBD subjects (n = 30) and IBD patients with quiescent (n = 49) and active (n = 29) status. Data are presented as mean ± SD (one‐way ANOVA). (d) The distribution of ILC subsets in total ILCs. (e) Paired analysis of ILCs in non‐inflamed and inflamed regions of IBD patients (n = 13). (f) Correlation between NCR‐ ILC3s and NCR+ ILC3s. (g) Correlation between ILC1s and NCR+ ILC3s. The r and P‐value are shown in the panel (Spearman’s correlation test). *P < 0.05, ***P < 0.005 and ****P < 0.001, and ns, not significant (P > 0.05).
Neutrophils and NCR− ILC3s positively correlated in IBD patients
To assess dysregulated immune responses in the intestines, inflammatory cells, including neutrophils, eosinophils, dendritic cells, and macrophages, were analysed by flow cytometry (Figure 2a, b). As with the previous analysis, patients with IBD were divided into those with quiescent and active disease. The frequencies of neutrophils and dendritic cells were significantly higher in patients with IBD than in non‐IBD subjects, regardless of disease status (Figure 2c). The frequencies of eosinophils and macrophages did not differ significantly between these groups (Figure 2c).
Figure 2.
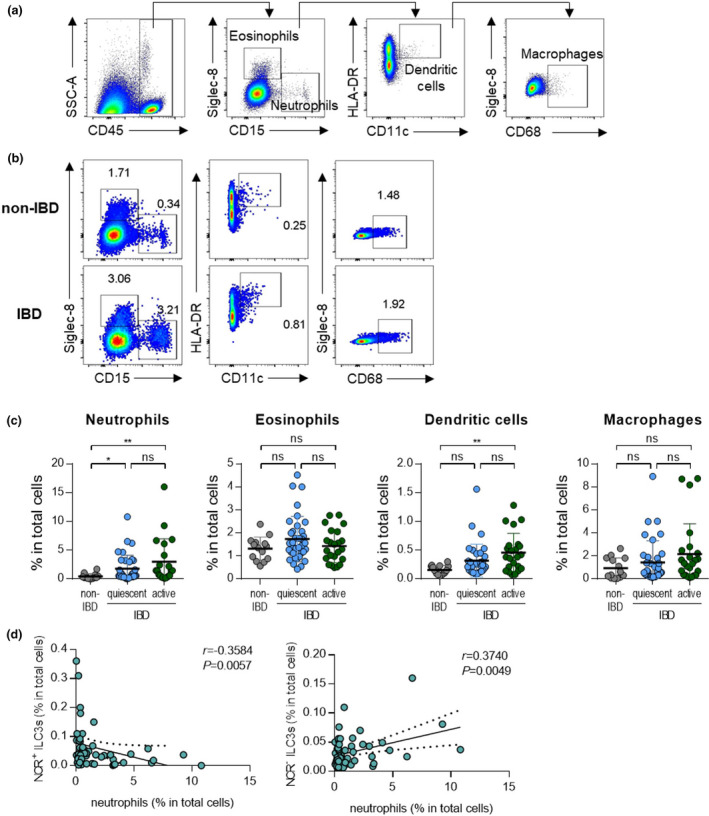
Neutrophils have reverse correlations with subsets of ILC3s. (a) Gating strategy for eosinophils (CD45+Siglec‐8+CD15‐), neutrophils (CD45+Siglec‐8‐CD15+), dendritic cells (CD45+Siglec‐8‐CD15‐CD11c+HLA‐DR+) and macrophages (CD45+Siglec‐8‐CD15‐CD68+). (b) Representative flow cytometry plots of myeloid cells including neutrophils, eosinophils, dendritic cells and macrophages. (c) Percentage of myeloid cells in colonoscopic biopsies of non‐IBD subjects (n = 11) and IBD patients with quiescent (n = 34) and active (n = 21) status. Data are presented as mean ± SD (one‐way ANOVA). (d) Correlation of NCR+ or NCR‐ ILC3s with neutrophils. The r and P‐value are shown in the panels (Spearman’s correlation test). *P < 0.05 and **P < 0.01, and ns, not significant (P > 0.05).
To define target cells that have the potential to interact with ILC3s, we performed a correlation analysis between ILC3s and various inflammatory immune cells that are increased in IBD status. We noted that NCR+ ILC3s showed a negative correlation with neutrophils, while NCR‐ ILC3s showed a positive correlation with neutrophils (Figure 2d). Dendritic cells also increased in patients with active IBD, but they did not show a significant correlation with NCR+ ILC3s or NCR‐ ILC3s because of their low frequency (Supplementary figure 2a, b). NCR+ ILC3s showed a negative correlation with macrophages, but no significant association with other cells, including eosinophils, was not observed (Supplementary figure 2a, b). Similarly, there were no correlations between ILC1s and other immune cells (Supplementary figure 2c). Based on these results, we hypothesised that a positive correlation between NCR‐ ILC3s and neutrophils might be involved in disease exacerbation.
NCR− ILC3s and neutrophils were increased in the inflamed colon in the murine colitis models
The mechanism of interaction between NCR‐ ILC3s and neutrophils in IBD were further assessed in a mouse model of DSS‐induced colitis (Figure 3a). Although DSS‐induced colitis is an acute model of colitis, it includes the characteristics of human IBD, such as epithelial hyperplasia, goblet cell depletion, and crypt destruction (Figure 3b–e). As observed in human IBD, the frequency of NCR‐ ILC3s and neutrophils is significantly increased in DSS‐induced colitis mice while NCR+ ILC3s are decreased (Figure 3f–j, Supplementary figure 3). Also, there was a positive correlation between NCR‐ ILC3s and neutrophils (Figure 3k). As in patients with IBD, DCs were increased, but other myeloid cells remained unchanged upon induction of colitis (Supplementary figure 3b, c).
Figure 3.
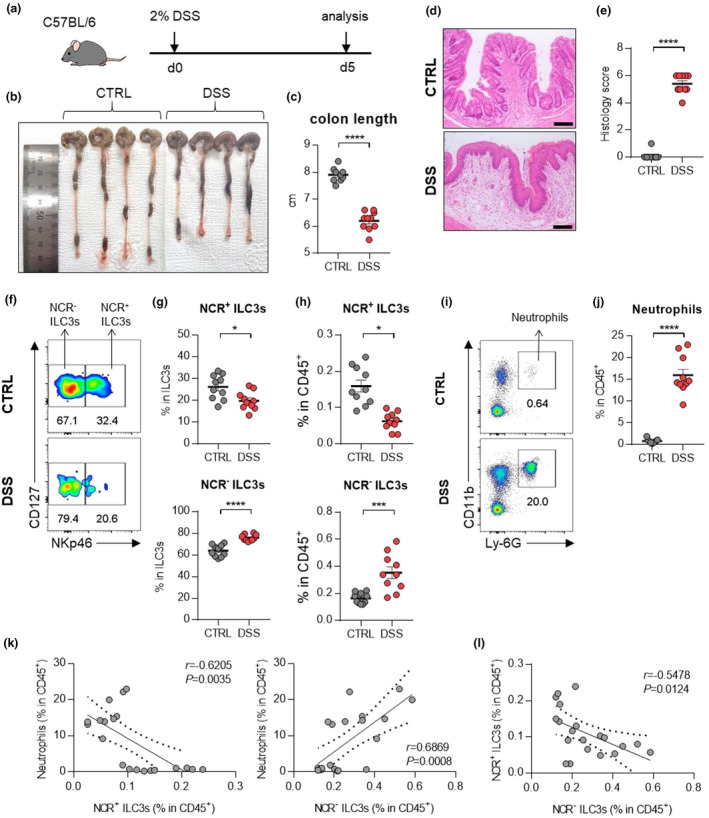
ILC3s and neutrophils in mice with DSS‐induced colitis. (a) Experimental schedule of DSS‐induced colitis. (b–e) A representative picture of colons (b) and colon length (c); and photomicrographs (d) of H&E‐stained histological sections of distal colon (scale bar: 100 μm), and histology score (e) at day 5 post‐induction with DSS. (f) The distribution of ILC3 subsets in the colon of control and DSS‐induced mice. (g, h) The percentage of NCR+ ILC3s (CD45+Lin‐CD127+RORγt+CD4‐NKp46+) and NCR‐ ILC3s (CD45+Lin‐CD127+RORγt+CD4‐NKp46‐) in the colon from control and DSS‐induced colitis mice. (i) Representative flow cytometry plots of neutrophils in the colon of control and DSS‐induced colitis mice. (j) The percentage of neutrophils (CD45+CD11b+Ly‐6G+) in the colon of control and DSS‐induced mice. Data are presented as mean ± SEM (Student’s t‐test). *P < 0.05, **P < 0.01 and ****P < 0.001. (k) Correlation between neutrophils and NCR+ ILC3s or NCR‐ ILC3s in the colon of control and DSS‐induced colitis mice. (l) Correlation between NCR+ ILC3s and NCR‐ ILC3s in the colon of control and DSS‐induced colitis mice. The r and P‐value are shown in the panels (Pearson's correlation test). Data are pooled from two independent experiments with n = 5 per group.
In the anti‐CD40‐induced colitis model, the contribution of NCR‐ ILC3s and neutrophils to intestinal inflammation also confirmed (Figure 4a–e). An increase in NCR‐ ILC3s and neutrophils was observed in the inflamed colons from anti‐CD40‐induced colitis mice (Figure 4f–j). Besides, other immune cells had no significant changes in the colon of mice with anti‐CD40‐induced colitis (Supplementary figure 3d, e). As in the DSS‐induced colitis model, there was a positive correlation between NCR‐ ILC3s and neutrophils, but a negative correlation between NCR+ ILC3s and neutrophils was observed (Figure 4k). We also note a significant inverse correlation between NCR+ ILC3s and NCR‐ ILC3s in these murine models of colitis (Figure 3l, 4l). These results suggest that certain factors in the IBD environment can induce the inverse correlation between NCR+ ILC3s and NCR‐ ILC3s.
Figure 4.
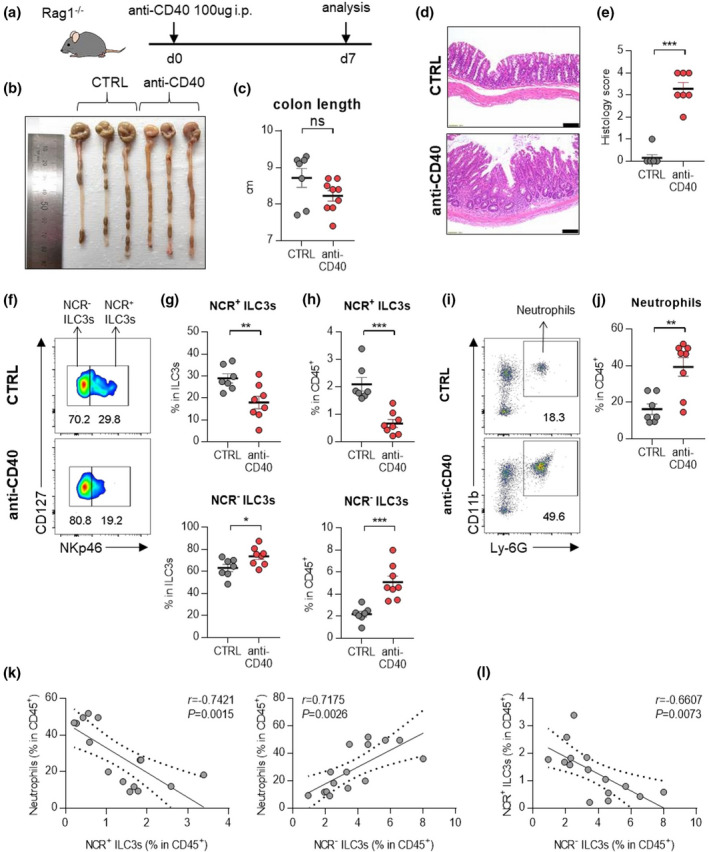
ILC3s and neutrophils in mice with anti‐CD40‐induced colitis. (a) Experimental schedule of anti‐CD40‐induced colitis. (b–e) A representative picture of colons (b) and colon length (c); and photomicrographs (d) of H&E‐stained histological sections of distal colon (scale bar: 100 μm), and histology score (e) at day 7 post‐induction with anti‐CD40. (f) The distribution of ILC3 subsets in the colon of control and anti‐CD40‐induced mice. (g, h) The percentage of NCR+ ILC3s (CD45+Lin‐CD127+RORγt+CD4‐NKp46+) and NCR‐ ILC3s (CD45+Lin‐CD127+RORγt+CD4‐NKp46‐) in the colon from control and anti‐CD40‐induced colitis mice. (i) Representative flow cytometry plots of neutrophils in the colon of control and anti‐CD40‐induced colitis mice. (j) The percentage of neutrophils (CD45+CD11b+Ly‐6G+) in the colon of control and anti‐CD40‐induced mice. Data are presented as mean ± SEM (Student’s t‐test). *P < 0.05, **P < 0.01 and ***P < 0.005, and ns, not significant (P > 0.05). (k) Correlation between neutrophils and NCR+ ILC3s or NCR‐ ILC3s in the colon of control and anti‐CD40‐induced colitis mice. (l) Correlation between NCR+ ILC3s and NCR‐ ILC3s in the colon of control and anti‐CD40‐induced colitis mice. The r and P‐value are shown in the panels (Pearson's correlation test). Data are representative of two independent experiments with control (n = 7) and anti‐CD40 (n = 8).
GM‐CSF‐producing NCR− ILC3s activate neutrophils in DSS‐induced colitis mice
Assessment of immune cell kinetics in the colons of mice with DSS‐induced colitis showed that NCR‐ ILC3s were increased prior to neutrophils and other inflammatory cells (Supplementary figure 4a–e). Therefore, we hypothesised that NCR‐ ILC3s in the colon are responsible for disease development by initiating intestinal inflammation. Among the inflammatory cytokines secreted by NCR‐ ILC3s, 9 , 13 only GM‐CSF has elevated in colitis‐induced mice (Figure 5a–d, Supplementary figure 5a, b). We also observed similar trends when analysing the mRNA of inflammatory cytokines in tissues from IBD patients (Supplementary figure 5c). There was no difference in IFN‐γ‐secreting ILC1s (Supplementary figure 5d, e). Since various ILC3 subsets can generate GM‐CSF, 14 we further analysed GM‐CSF‐producing ILC3 subsets and confirmed that NCR‐ILC3s account for the main proportion (Supplementary figure 6a, b).
Figure 5.
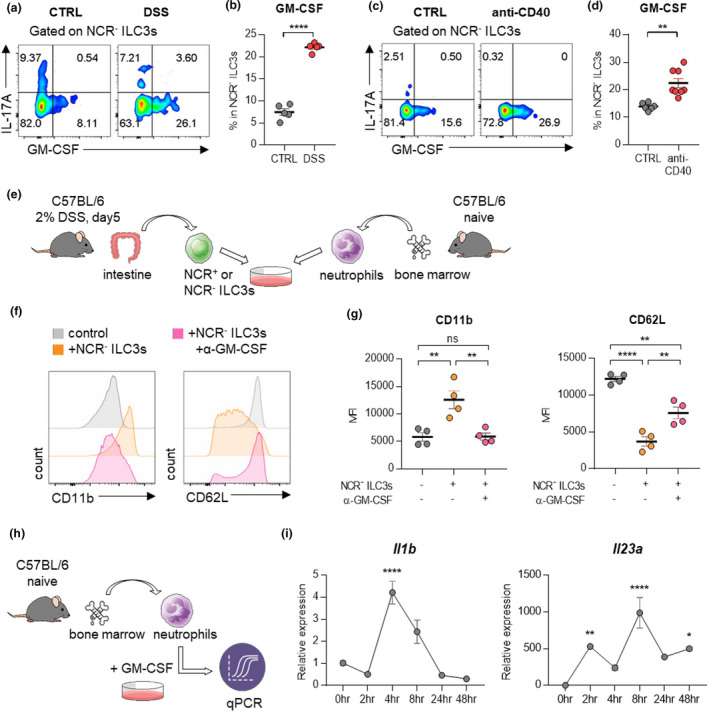
NCR‐ ILC3s activate neutrophils by producing GM‐CSF. (a) Cells isolated from the colon of mice with DSS‐induced colitis were stimulated with PMA and ionomycin, and cytokine production was analysed by intracellular cytokine staining. (b) The percentage of GM‐CSF‐producing NCR‐ ILC3s. Data are presented as mean ± SEM (Student’s t‐test). Data are representative of three independent experiments with n = 5 per group. (c) Cells isolated from the colon of mice with anti‐CD40‐induced colitis were stimulated with PMA and ionomycin, and cytokine production was analysed by intracellular cytokine staining. (d) The percentage of GM‐CSF‐producing NCR‐ ILC3s. Data are presented as mean ± SEM (Student’s t‐test). Data are representative of two independent experiments with control (n = 7) and anti‐CD40 (n = 8). (e) Schematic diagram of the co‐culture procedure of ILC3s and neutrophils. (f, g) Neutrophils and NCR‐ ILC3s were co‐cultured with or without anti‐GM‐CSF antibodies for 24 hours. Histogram (f) and MFI (g) of CD11b and CD62L expression on neutrophils. Data are presented as mean ± SEM (one‐way ANOVA). Data are representative of three independent experiments with n = 4 per group. (h) Schematic diagram of the stimulation procedure of neutrophils with GM‐CSF. Neutrophils were isolated from bone marrow from naïve mice, then stimulated with recombinant GM‐CSF. (i) The level of mRNA expression of Il1b and Il23a was measured at the indicated time point. Data are normalised to Gapdh. Data are presented as mean ± SEM (one‐way ANOVA). Data are representative of three independent experiments with n = 3 per group.*P < 0.05, **P < 0.01 and ****P < 0.001, and ns, not significant (P > 0.05).
To determine whether GM‐CSF secreted by NCR‐ ILC3s induces the activation of neutrophils, we co‐cultured neutrophils with NCR+ or NCR‐ ILC3s (Figure 5e, Supplementary figure 7a–d). Activated neutrophils upregulate the expression of CD11b but downregulate the expression of CD62L 21 , 22 , 23 . Culturing neutrophils with NCR‐ ILC3s increased CD11b expression while reducing CD62L expression, and this phenotype was reversed by treatment with anti‐GM‐CSF antibodies (Figure 5f, g). By contrast, NCR+ ILC3s did not affect the levels of CD11b and CD62L expression on neutrophils (Supplementary figure 7e, f). Therefore, these results suggest that NCR‐ ILC3s, not NCR+ ILC3s, could stimulate neutrophils through GM‐CSF. Besides, GM‐CSF significantly enhanced the expression of Il1b, Il23a (Figure 5h, i), and Tgfb mRNAs (Supplementary figure 7g) from neutrophils, and the level of TGFB mRNA was also higher in colonoscopic biopsies of patients with IBD (Supplementary figure 7h). Since these cytokines are not only well‐known stimulating factors of ILC3s but also critical for the development of IBD, the crosstalk between NCR‐ ILC3s and neutrophils may be involved in the development of IBD.
Blockade of GM‐CSF and neutrophils reduces intestinal inflammation in DSS‐induced colitis
Next, we injected anti‐GM‐CSF antibodies (Ab) into DSS‐treated WT mice to evaluate the role of GM‐CSF in the development of colitis (Figure 6a). Treatment with anti‐GM‐CSF Ab resulted in the restoration of shortened colons (Figure 6b, c) and collapsed epithelial cells (Figure 6f, g). To exclude the role of adaptive immune cells, we confirmed these results in Rag1 −/− mice, which have no mature B or T lymphocytes. Again, treatment with anti‐GM‐CSF antibodies in the Rag1 −/− mice showed similar results as observed in WT mice (Figure 6d, e, f, h). Administration of DSS increased the frequency of neutrophils (Figure 6i, j). Increased neutrophils also produced a higher level of ROS and IL‐1β (Figure 6k, l), but blockade of GM‐CSF inverted ROS and IL‐1β production (Figure 6k, l). A decrease in CD11b, a neutrophil activation marker, but an increase in CD62L expression, a neutrophil inactivation marker, was observed in both WT and Rag1 −/− mice by GM‐CSF blockade (Figure 6m, n).
Figure 6.
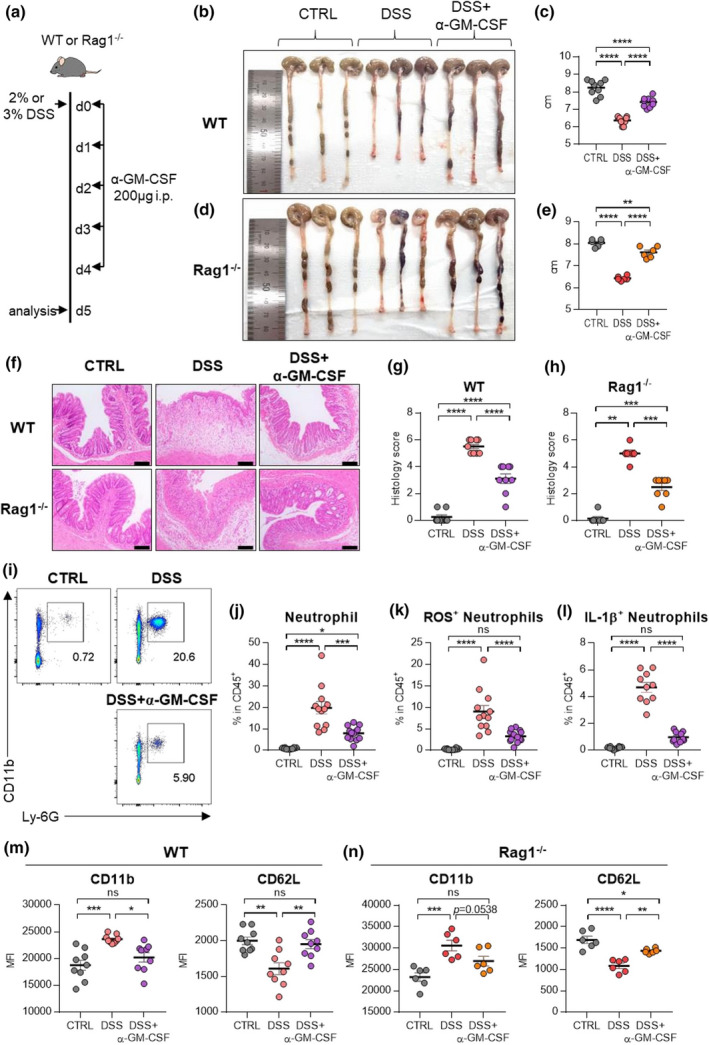
Blockade of GM‐CSF ameliorates disease symptoms by inhibiting neutrophils. (a) Experimental schedule of GM‐CSF blockade in a murine model of DSS‐induced colitis. GM‐CSF blocking antibodies were injected intraperitoneally for five consecutive days. (b–e) A representative picture of colons and colon length of WT (b, c) or Rag1 −/− (d, e) mice. (f–h) Photomicrographs (f) of H&E‐stained histological sections of the proximal colon (scale bar: 100 μm), and histology score (g, h) at day 5 post‐induction with DSS. (i) Representative flow cytometry plots of neutrophils in the colon at day 5 post‐induction with DSS. (j–l) The percentage of total neutrophils (j), DHR123(ROS)+ neutrophils (k) and IL‐1β(pro‐form)+ neutrophils (l) in the colon at day 5 post‐induction with DSS. (m, n) MFI of neutrophil activation markers including CD11b and CD62L in WT (m) and Rag1 −/− (n) at day 5 post‐induction with DSS. Data are presented as mean ± SEM (one‐way ANOVA). In (c, g, m), data are pooled from two independent experiments with n = 9 per group. In (e, h, n), data are pooled from two independent experiments with n = 6 per group. In (j–l), data are pooled from three independent experiment with CTRL (n = 10), DSS (n = 12) and DSS+α‐GM‐CSF (n = 13). *P < 0.05, **P < 0.01, ***P < 0.005 and ****P < 0.001, and ns, not significant (P > 0.05).
Next, we examined whether neutrophils contribute to the development of colitis. To deplete neutrophils, we injected anti‐Ly‐6G Ab during the induction of colitis (Figure 7a–c). Treatment of anti‐Ly‐6G Ab resulted in the restoration of shortened colons (Figure 7d, e) and collapsed epithelial cells (Figure 7f, g). There was no difference in the frequency of GM‐CSF‐producing NCR‐ ILC3s (Figure 7h), indicating that neutrophils are targets of NCR‐ ILC3s. Together, these findings suggest that GM‐CSF drives pathological immune responses by stimulating neutrophils in the inflamed intestine.
Figure 7.
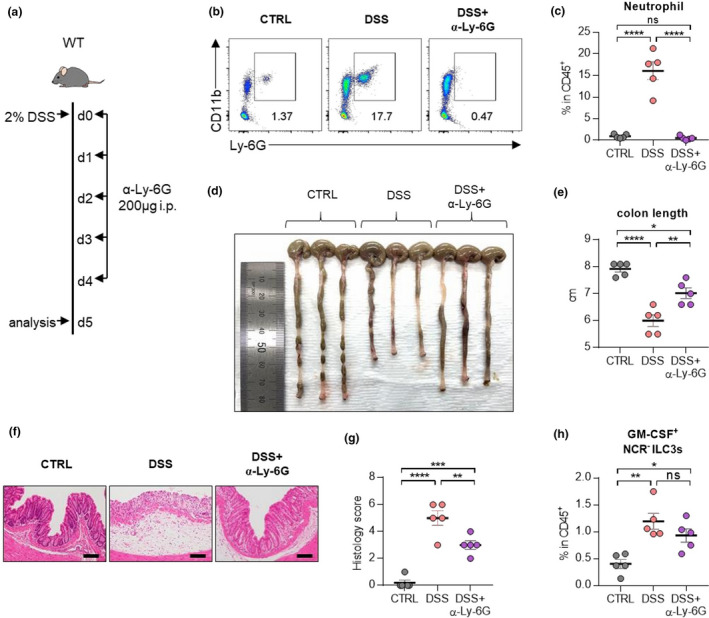
Depletion of neutrophils ameliorates disease symptoms in mice with DSS‐induced colitis. (a) Experimental schedule of neutrophil depletion in a murine model of DSS‐induced colitis. Ly‐6G depletion antibodies were injected intraperitoneally for five consecutive days. (b) Representative flow cytometry plots of neutrophils in the colon at day 5 post‐induction with DSS. (c) The percentage of total neutrophils in the colon at day 5 post‐induction with DSS. (d, e) A representative picture of colons (d) and colon length (e). (f, g) Photomicrographs (f) of H&E‐stained histological sections of the proximal colon (scale bar: 100 μm), and histology score (g) at day 5 post‐induction with DSS. (h) The percentage of GM‐CSF+ NCR‐ ILC3s in the colon at day 5 post‐induction with DSS. Data are presented as mean ± SEM (one‐way ANOVA). Data are representative of two independent experiments with n = 5 per group. *P < 0.05, **P < 0.01, ***P < 0.005 and ****P < 0.001, and ns, not significant (P > 0.05).
Discussion
IBD, including both CD and UC, is a complex chronic immune‐mediated disease, and the treatment of IBD is very limited because of a lack of understanding of the mechanisms underlying disease initiation and progression. The present study showed that GM‐CSF‐producing NCR‐ ILC3s could activate neutrophils in the inflamed intestinal mucosa in IBD, thereby promoting the disease. By using mouse models of DSS‐induced colitis and in vitro co‐culture experiments, we found that GM‐CSF‐producing NCR‐ ILC3s can induce neutrophil activation. Furthermore, blockade of GM‐CSF ameliorated DSS‐induced colitis by inhibiting the activation of neutrophils in vivo. Through these findings, we suggested the previously unrecognised NCR‐ ILC3: GM‐CSF: neutrophil axis is concerned with the progress of IBD.
Emerging evidence from studies in humans and mice indicates that ILCs participate in the pathogenesis of IBD. Of the ILCs, ILC3s are implicated in gastrointestinal immune responses. Most ILCs in the ileum 24 and colon 24 , 25 are ILC3s, and NCR+ ILC3s accounting for 5% of lymphocytes are at a steady‐state. 26 NCR+ ILC3s mainly secrete IL‐22 that enhances intestinal barrier integrity and the proliferation of intestinal epithelium. 27 By contrast, NCR‐ ILC3s are predominant in the diseased colon rather than a steady‐state, and they can induce spontaneous colitis 28 and bacteria‐driven colitis 29 by secreting IL‐17A. In the present study, we also observed an increase in NCR‐ ILC3s, along with decreases in NCR+ ILC3s, in inflamed colons from IBD patients and mice with DSS‐induced or anti‐CD40 colitis. In particular, we noted a strong negative correlation between NCR+ ILC3s and NCR‐ ILC3s in inflamed colons. Stimulation of neutrophils with GM‐CSF resulted in an increased level of Tgfb mRNA. TGF‐β signalling was recently proposed to induce the conversion of NCR+ ILC3s to NCR‐ ILC3s 30 ; however, the source of TGF‐β and the signalling pathway involved remain unknown. Changes from homeostatic NCR+ ILC3s to pathogenic NCR‐ ILCs might be involved in the development of colitis. Therefore, more detailed research on how these reversible NCR+ ILC3s and NCR‐ ILC3s interact with surrounding inflammatory cells such as neutrophils will be of interest.
The roles of GM‐CSF on intestinal immune cells are quite complex. GM‐CSF can exhibit protective functions in the intestine. For example, neutralising anti‐GM‐CSF autoantibodies are increased in IBD, 31 and GM‐CSF KO mice are less susceptible to DSS‐induced colitis. 32 Also, recombinant GM‐CSF treatment ameliorates acute DSS‐induced colitis. 33 From the perspective of ILCs, GM‐CSF from ILC3s can maintain gut homeostasis by generating retinoic acid and IL‐10 in DCs and macrophages to facilitate tolerance function. 14 However, a recent large‐scale clinical trial reported that recombinant GM‐CSF (sargramostim) was not effective in inducing clinical mitigation or improvement in patients with active CD. 34 Although GM‐CSF has a protective effect, it also acts as an essential mediator of tissue inflammation. 35 , 36 GM‐CSF exacerbates colitis by promoting the accumulation of Ly‐6C+ inflammatory monocytes 17 , 18 ; namely, NCR+ ILC3s promote inflammation through GM‐CSF‐induced accumulation of inflammatory monocytes in the anti‐CD40 innate colitis model. 18 We also found that GM‐CSF production has increased in the colons of DSS‐induced colitis mice and colonoscopic biopsies from patients with IBD, although there was a difference in the subset of ILC3s that produce GM‐CSF. Here, we showed that GM‐CSF‐producing NCR‐ ILC3s aggravate IBD by activating neutrophils. Neutrophils have long been considered as effector cells in acute and chronic inflammation 37 by secreting significant amounts of pro‐inflammatory cytokines 38 and matrix metalloproteases (MMPs). 39 Moreover, inhibition of neutrophil recruitment alleviates DSS‐induced colitis. 40 , 41 Therefore, the reciprocal interaction between NCR‐ ILC3s and neutrophils may contribute to the pathogenesis of IBD.
Up to now, the drugs most widely used to treat CD are corticosteroids; immunosuppressants, such as methotrexate; and thiopurines, such as azathioprine and mercaptopurine; and biological agents, such as the antitumor necrosis factor (TNF) antibodies infliximab, adalimumab, and certolizumab pegol, and the anti‐adhesion agent vedolizumab. 42 Clinical trials have shown that 30% to 50% of IBD patients do not respond to anti‐TNF therapy, the most advanced treatment currently available. 43 Therefore, alternative strategies are required to target the mechanisms underlying the pathogenesis of IBD. This study underscores the importance that ILCs should be considered as a therapeutic target for IBD. For example, agents targeting IL‐23, which can stimulate ILC3s, have been evaluated in clinical trials in patients with CD. These include AMG 139, a human anti‐IL‐23 antibody currently in phase 1 clinical trial for treating CD 44 ; and ustekinumab, a monoclonal antibody that binds with high affinity to the p40 subunit of human IL‐12 and IL‐23 and has been approved for the treatment of patients with moderate‐to‐severe CD. 45 , 46 Also, pharmacologic approaches aimed at blocking the activation of neutrophils might be useful adjuncts to other therapeutic approaches using biologics.
In conclusion, the NCR‐ ILC3s: GM‐CSF: neutrophil axis in colitis could induce activation of innate immunity. The current study may provide clues to understand inflammatory responses at intestinal barrier surfaces that regulate the balance between mucosal homeostasis and inflammation. Although more researches are required, an in‐depth comparison of the characteristic of ILCs in diseased human tissues will help to identify how ILCs play a role in the progression of human IBD.
Methods
Subjects
A cohort of 91 children diagnosed with IBD, including 67 with Crohn’s disease and 24 with ulcerative colitis, along with 40 control children without inflammation, was recruited by the paediatric gastroenterology team at SNUH Hospital during 2016–2017 (Supplementary table 1, Supplementary figure 8). All the subjects in this study have normal phenotypes, which were not related to the syndromic morphology nor the other systemic diseases. Genetic screening tests such as IL‐10 receptor deficiency were usually done in patients younger than 6 years in our institution. Children who had a diagnosis of IBD ruled out with macroscopically and histologically normal mucosa served as the non‐disease control group. Each patient’s final clinical diagnosis was based on the revised Porto criteria. At the diagnostic endoscopy, additional mucosal biopsies were taken from the small bowel (i.e. terminal ileum [TI]) and colon sections (i.e. ascending colon [AC] and sigmoid colon [SC]). During the colonoscopic examination, biopsied tissues were taken from non‐inflamed and/or inflamed mucosa for the isolation of cells. Cell isolation was based on one biopsy bottle. Each bottle contained 3–5 pieces of biopsied tissue. More than 480 pieces of biopsied tissue were analysed (a total of 160 bottles). The inflammation status of a sample (inflamed vs non‐inflamed) was based on the gross endoscopic finding. Longitudinal samples were taken from the TI and SC of a subset of patients who underwent repeat endoscopy (CD: n = 13; UC: n = 4). The patient was excluded from the analysis if the percentage of living cells or the ILC population was too low that the reliability was poor.
Cell isolation from colonoscopic biopsies
Colon tissues obtained from colonoscopy were transferred to cold PBS and minced with single‐edge blades. The tissues were incubated with 5 mL RPMI medium with type IV collagenase (Worthington, New Jersey, USA) and DNase I (Sigma‐Aldrich, Missouri, USA) at 37°C shaking incubator for 1 hour and filtered with 100‐μm strainer (SPL, Gyeonggi‐do, Korea). Then, red blood cells were lysed by Red Blood Cell Lysing Buffer (Sigma‐Aldrich, Missouri, USA) and washed with PBS. The cells were resuspended in an appropriate volume of PBS with 2% FBS.
Mice
C57BL/6 wild‐type (WT) mice were purchased from the Koatech Company (Gyeonggi‐do, Korea). Rag1 −/− mice on the C57BL/6 background were purchased from the Jackson Laboratory (Bar Harbor, Maine, USA). 6‐week‐old male mice were used for experiments. All mice were kept in a specific pathogen‐free facility on a 12‐hour light/12‐hour dark cycle and provided food and water ad libitum.
DSS‐induced colitis model and treatment
Experimental colitis was induced by administration of 2% or 3% DSS (MP Biomedicals, Santa Ana, California, USA) in sterile drinking water for 5 days, while control mice received plain drinking water. For some experiments, mice were treated with 200 μg of monoclonal anti‐mouse GM‐CSF antibody (MP1‐22E9; BioXCell, New Hampshire, USA) or anti‐Ly‐6G antibody (1A8; BioXCell, New Hampshire, USA) daily.
Anti‐CD40‐induced colitis model
To induce innate colitis, 100 μg of anti‐CD40 antibody (FGK45; BioXCell, New Hampshire, USA) was administered via intraperitoneal injection to Rag1 −/− mice. Mice were sacrificed at day 7 post‐injection of anti‐CD40.
Colon length and histology
The colon was harvested and gently unfolded, and its length was measured from the ileocecal junction to the anus by a ruler. A piece of colon was fixed in 4% formaldehyde, embedded in paraffin and stained with haematoxylin and eosin. All bright‐field microscopic images were captured using the Olympus IX53 microscope (Olympus, Tokyo, Japan), using 20X apochromatic objective lenses and an Olympus colour CCD camera. Features were blindly scored for (i) quality and dimension of inflammatory cell infiltrates, (ii) epithelial changes and (iii) overall mucosal architecture using previously published criteria. 47 Each sample was graded from 0 to 6 in DSS‐induced colitis, or from 0 to 5 in anti‐CD40‐induced colitis.
Cell isolation from mouse colon
Colons were isolated from mice, opened longitudinally, washed thoroughly with PBS and cut into 0.5‐cm pieces. The tissues were shaken for 30 min in 10 mL RPMI medium containing 2 mM EDTA at 37°C. The tissues were washed, minced and digested in 5 mL RPMI medium containing type IV collagenase and DNase I for 30 min at 37°C with shaking. After incubation, cell suspensions were filtered through a 100‐μm strainer. Colonic LP cells were further purified into LP mononuclear cells on a 40–75% discontinuous Percoll gradient (GE Healthcare, Chicago, USA) and centrifuged at 2 000 rpm for 25 min without break. The cell layer at the 40/75% interphase was harvested and washed twice with PBS. The cells were resuspended in an appropriate volume of buffer for the next procedure.
Flow cytometry
For human samples, single cells from colonoscopic biopsies samples were incubated with Zombie Aqua™ Fixable Viability Kit (BioLegend, San Diego, CA, USA) at room temperature for 10 min, then blocked with anti‐human CD16/CD32 (BD Biosciences, New Jersey, USA) at 4°C for 15 min. Next, single cells were stained with the following monoclonal antibodies: PerCP/Cy5.5 anti‐human CD45, fluorescein isothiocyanate (FITC) anti‐Lineage Cocktail (anti‐human CD3, anti‐human CD14, anti‐human CD19, anti‐mouse/human CD11b, anti‐human CD11c, anti‐human CD49b and anti‐human FcεRIα), PE/Cy7 anti‐human CD127, PE anti‐human CRTH2, Brilliant Violet (BV)421 anti‐human c‐kit, allophycocyanin (APC) anti‐human NKp44, PE/Cy7 anti‐human CD15, PE anti‐human Siglec‐8, BV421 anti‐human CD11c, APC anti‐human HLA‐DR and FITC anti‐human CD68 (BioLegend, San Diego, CA, USA).
For mouse samples, single cells from mouse colon were incubated with Zombie Aqua™ Fixable Viability Kit (BioLegend, San Diego, CA, USA) at room temperature for 10 min, then blocked with anti‐mouse CD16/CD32 (BD Biosciences, New Jersey, USA) at 4°C for 15 min. Next, single cells were stained with the following monoclonal antibodies: PerCP/Cy5.5 anti‐mouse CD45, FITC anti‐Lineage Cocktail (anti‐mouse CD3, anti‐mouse CD11b, anti‐mouse CD11c, anti‐mouse CD19, anti‐mouse CD49b, anti‐mouse F4/80 and anti‐mouse FcεRIα), PE/Cy7 anti‐mouse CD127, APC anti‐mouse CD4, BV421 anti‐mouse NKp46, BV650 anti‐mouse CD45, BV785 anti‐mouse CD11b, PerCP/Cy5.5 anti‐mouse Ly‐6G, BV421 anti‐mouse Siglec‐F, PE anti‐mouse CD11c, FITC anti‐mouse I‐Ab, APC anti‐mouse F4/80 (BioLegend, San Diego, CA, USA) and biotin anti‐mouse ST2 (Invitrogen, Carlsbad, CA, USA). After biotinylated antibody staining at 4°C for 30 min, the cells were incubated with PE Streptavidin (BD Biosciences, New Jersey, CA, USA) at 4°C for 30 min. For intracellular cytokine staining, single cells were incubated in RPMI medium containing 10% FBS with phorbol 12‐myristate 13‐acetate (PMA) (100 ng mL‐1; Sigma‐Aldrich, Missouri, USA), ionomycin (1 μg mL−1; Sigma‐Aldrich, Missouri, USA) and BD GolgiStop (0.7 μL mL−1; BD Biosciences, New Jersey, USA) at 37°C for 4 h. After surface staining, the cells were fixed and permeabilised with eBioscience Foxp3/Transcription Factor Fixation/Permeabilization Buffer Set (Invitrogen, Carlsbad, CA, USA). Finally, the cells were stained with BV650 anti‐mouse RORγt, BV421 anti‐mouse IL‐17A, PE anti‐mouse IL‐17F, PE anti‐mouse GM‐CSF and BV421 anti‐mouse IFN‐γ (BioLegend, San Diego, CA, USA).
Cells were analysed using a BD LSRFortessa™ X‐20 flow cytometer and FACSDiva software (BD Biosciences, New Jersey, USA). Flow cytometry data were analysed using FlowJo analysis software (Treestar, Ashland, OR, USA).
Quantitative real‐time PCR
Colonoscopic biopsies were stored with PrepProtect Stabilization Buffer (Miltenyi Biotec, Bergisch Gladbach, Germany) at −20°C. Tissues were homogenised using PowerMasher (Optima, Tokyo, Japan) with TRIzol® reagent (Ambion, Carlsbad, CA, USA). After extraction of total RNA, cDNA was synthesised using iScript cDNA Synthesis Kit (Bio‐Rad, Hercules, CA, USA). Quantitative real‐time PCR was performed using IQ Supermix (Bio‐Rad, Hercules, CA, USA) and TaqMan® Gene Expression Assays (Applied Biosystems, Foster City, CA, USA). Gene expression of each target was calculated relative to the housekeeping gene RPLP0.
Co‐culture of ILCs and neutrophils
Neutrophils were isolated from the bone marrow of naïve 8‐week‐old male mice. The bone marrows were flushed out with PBS and filtered with a 70‐μm strainer. Red blood cells were lysed by Red Blood Cell Lysing Buffer (Sigma‐Aldrich, Missouri, USA), and cells were washed with PBS. Neutrophils were isolated using Neutrophil Isolation Kit (Miltenyi Biotec, Bergisch Gladbach, Germany) followed by the manufacturer’s instructions. NCR+ and NCR‐ ILC3s were stained and isolated by BD FACSAria™ (BD Biosciences, New Jersey, CA, USA). 2.5 × 10⁵ neutrophils were cultured with 5.0 × 10⁴ NCR+ or NCR‐ ILC3s in complete medium at 37°C and 5% CO2. Cells were plated simultaneously and cultured in the presence of recombinant IL‐2 (10 U mL–1; BioLegend, San Diego, CA, USA), IL‐1β (20 ng mL−1; BioLegend, CA, USA) and IL‐23 (20 ng mL–1; BioLegend, San Diego, CA, USA). In some experiments, anti‐mouse GM‐CSF (10 μg mL−1; BioXCell, New Hampshire, USA) was added in co‐culture. After 24 hours, cells were harvested and analysed by flow cytometry.
Statistical analysis
All statistical analysis was performed using GraphPad Prism 7 (GraphPad Software, La Jolla, CA, USA). The determination of normality of data was based on the Shapiro–Wilk test. Two unpaired groups were compared using the two‐tailed Student’s t‐test for the parametric measure or the Mann–Whitney U‐test for non‐parametric measures. When three groups are compared, the one‐way ANOVA followed by Bonferroni’s post‐test was used for parametric measures or the Kruskal–Wallis test followed by Dunn’s post‐test was used for non‐parametric measures. When analysing correlations, the Pearson’s correlation test was used for the parametric measure, or the Spearman’s correlation test was used for non‐parametric measures. Data are represented as arithmetic means with standard error of the mean (SEM) or standard deviations (SD) as stated. P < 0.05 was considered statistically significant. No statistical method was used to predetermine sample size; however, sample sizes were based on prior experience with similar studies.
Study approval
This study was conducted after obtaining patient and/or parent consent with full ethical approval (IRB No. 1511‐078‐720). All animal experiments were approved by the Institutional Animal Care and Use Committee in Seoul National University Hospital (SNUH‐IACUC), and animals were maintained in the facility‐accredited AAALAC International (#001169) following the Guide for the Care and Use of Laboratory Animals 8th edition, NRC (2010).
Conflict of Interest
We declare that they have no competing interests.
Author Contribution
Yuna Chang: Conceptualization; Data curation; Investigation; Methodology; Validation; Writing‐original draft. Ju Whi Kim: Conceptualization; Formal analysis; Investigation; Methodology; Validation; Writing‐original draft. Siyoung Yang: Conceptualization; Formal analysis; Resources; Validation. Doo Hyun Chung : Conceptualization; Formal analysis; Resources; Supervision. Jae Sung Ko: Conceptualization; Formal analysis; Project administration; Resources; Supervision. Jin Soo Moon : Conceptualization; Formal analysis; Funding acquisition; Project administration; Resources; Supervision; Writing‐review & editing. Hye Young Kim: Conceptualization; Formal analysis; Funding acquisition; Project administration; Resources; Supervision; Writing‐review & editing.
Supporting information
Acknowledgments
This work was supported by the Korea Healthcare Technology R&D Project, Ministry of Health and Welfare, Korea [grant number HI15C3083, HI15C1736]; the National Research Foundation of Korea [grant numbers 2019R1A2C2087574 and SRC 2017R1A5A1014560]; the SNUH Research Fund [grant number 0420190540]; and Eisai Korea [grant number 0620160130].
Contributor Information
Jin Soo Moon, Email: mjschj@snu.ac.kr, Email: hykim11@snu.ac.kr.
Hye Young Kim, Email: hykim11@snu.ac.kr.
References
- 1. Abraham C, Cho JH. Inflammatory bowel disease. N Engl J Med 2009; 361:2066–2078. [DOI] [PMC free article] [PubMed] [Google Scholar]
- 2. Jostins L, Ripke S, Weersma RK et al. Host‐microbe interactions have shaped the genetic architecture of inflammatory bowel disease. Nature 2012; 491:119–124. [DOI] [PMC free article] [PubMed] [Google Scholar]
- 3. Ng SC, Bernstein CN, Vatn MH et al. Geographical variability and environmental risk factors in inflammatory bowel disease. Gut 2013; 62:630–649. [DOI] [PubMed] [Google Scholar]
- 4. Li J, Glover SC. Innate Lymphoid Cells in Inflammatory Bowel Disease. Arch Immunol Ther Exp (Warsz) 2018; 66:415–421. [DOI] [PubMed] [Google Scholar]
- 5. Kolaczkowska E, Kubes P. Neutrophil recruitment and function in health and inflammation. Nat Rev Immunol 2013; 13:159–175. [DOI] [PubMed] [Google Scholar]
- 6. Wera O, Lancellotti P, Oury C. The dual role of neutrophils in inflammatory bowel diseases. J Clin Med 2016; 5:118. [DOI] [PMC free article] [PubMed] [Google Scholar]
- 7. Spits H, Artis D, Colonna M et al. Innate lymphoid cells–a proposal for uniform nomenclature. Nat Rev Immunol 2013; 13:145–149. [DOI] [PubMed] [Google Scholar]
- 8. Goldberg R, Prescott N, Lord GM, MacDonald TT, Powell N. The unusual suspects–innate lymphoid cells as novel therapeutic targets in IBD. Nat Rev Gastroenterol Hepatol 2015; 12:271–283. [DOI] [PubMed] [Google Scholar]
- 9. Eberl G, Colonna M, Di Santo JP, McKenzie ANJ. Innate lymphoid cells: A new paradigm in immunology. Science 2015; 348:aaa6566. [DOI] [PMC free article] [PubMed] [Google Scholar]
- 10. Morita H, Moro K, Koyasu S. Innate lymphoid cells in allergic and nonallergic inflammation. J Allergy Clin Immunol 2016; 138:1253–1264. [DOI] [PubMed] [Google Scholar]
- 11. Stier MT, Peebles RS. Innate lymphoid cells and allergic disease. Ann Allergy Asthma Immunol 2017; 119:480–488. [DOI] [PMC free article] [PubMed] [Google Scholar]
- 12. Chiossone L, Dumas P‐Y, Vienne M, Vivier E. Natural killer cells and other innate lymphoid cells in cancer. Nat Rev Immunol 2018; 18:671–688. [DOI] [PubMed] [Google Scholar]
- 13. Geremia A, Arancibia‐Carcamo CV. Innate lymphoid cells in intestinal inflammation. Front Immunol 2017; 8:1296. [DOI] [PMC free article] [PubMed] [Google Scholar]
- 14. Mortha A, Chudnovskiy A, Hashimoto D et al. Microbiota‐dependent crosstalk between macrophages and ILC3 promotes intestinal homeostasis. Science 2014; 343:1249288. [DOI] [PMC free article] [PubMed] [Google Scholar]
- 15. Hepworth MR, Monticelli LA, Fung TC et al. Innate lymphoid cells regulate CD4+ T‐cell responses to intestinal commensal bacteria. Nature 2013; 498:113–117. [DOI] [PMC free article] [PubMed] [Google Scholar]
- 16. Hepworth MR, Fung TC, Masur SH et al. Immune tolerance. Group 3 innate lymphoid cells mediate intestinal selection of commensal bacteria‐specific CD4+ T cells. Science 2015; 348:1031–1035. [DOI] [PMC free article] [PubMed] [Google Scholar]
- 17. Pearson C, Thornton EE, McKenzie B et al. ILC3 GM‐CSF production and mobilisation orchestrate acute intestinal inflammation. Elife 2016; 5:e10066. [DOI] [PMC free article] [PubMed] [Google Scholar]
- 18. Song C, Lee JS, Gilfillan S et al. Unique and redundant functions of NKp46+ ILC3s in models of intestinal inflammation. J Exp Med 2015; 212:1869–1882. [DOI] [PMC free article] [PubMed] [Google Scholar]
- 19. Mortha A, Burrows K. Cytokine networks between innate lymphoid cells and myeloid cells. Front Immunol 2018; 9:191. [DOI] [PMC free article] [PubMed] [Google Scholar]
- 20. Penny HA, Hodge SH, Hepworth MR. Orchestration of intestinal homeostasis and tolerance by group 3 innate lymphoid cells. Semin Immunopathol 2018; 40:357–370. [DOI] [PMC free article] [PubMed] [Google Scholar]
- 21. Kishimoto T, Jutila M, Berg E, Butcher E. Neutrophil Mac‐1 and MEL‐14 adhesion proteins inversely regulated by chemotactic factors. Science 1989; 245:1238–1241. [DOI] [PubMed] [Google Scholar]
- 22. Bajt ML, Farhood A, Jaeschke H. Effects of CXC chemokines on neutrophil activation and sequestration in hepatic vasculature. Am J Physiol‐Gastrointest Liver Physiol 2001; 281:G1188–G1195. [DOI] [PubMed] [Google Scholar]
- 23. Mann BS, Chung KF. Blood neutrophil activation markers in severe asthma: lack of inhibition by prednisolone therapy. Respir Res 2006; 7:59. [DOI] [PMC free article] [PubMed] [Google Scholar]
- 24. Bernink JH, Peters CP, Munneke M et al. Human type 1 innate lymphoid cells accumulate in inflamed mucosal tissues. Nat Immunol 2013; 14:221–229. [DOI] [PubMed] [Google Scholar]
- 25. Kramer B, Goeser F, Lutz P et al. Compartment‐specific distribution of human intestinal innate lymphoid cells is altered in HIV patients under effective therapy. PLoS Pathog 2017; 13:e1006373. [DOI] [PMC free article] [PubMed] [Google Scholar]
- 26. Takayama T, Kamada N, Chinen H et al. Imbalance of NKp44+NKp46‐ and NKp44‐NKp46+ natural killer cells in the intestinal mucosa of patients with Crohn's disease. Gastroenterology 2010; 139:882–892. [DOI] [PubMed] [Google Scholar]
- 27. Satoh‐Takayama N, Vosshenrich CA, Lesjean‐Pottier S et al. Microbial flora drives interleukin‐22 production in intestinal NKp46+ cells that provide innate mucosal immune defense. Immunity 2008; 29:958–970. [DOI] [PubMed] [Google Scholar]
- 28. Powell N, Walker AW, Stolarczyk E et al. The transcription factor T‐bet regulates intestinal inflammation mediated by interleukin‐7 receptor+ innate lymphoid cells. Immunity 2012; 37:674–684. [DOI] [PMC free article] [PubMed] [Google Scholar]
- 29. Buonocore S, Ahern PP, Uhlig HH et al. Innate lymphoid cells drive interleukin‐23‐dependent innate intestinal pathology. Nature 2010; 464:1371–1375. [DOI] [PMC free article] [PubMed] [Google Scholar]
- 30. Viant C, Rankin LC, Girard‐Madoux MJH et al. Transforming growth factor–β and Notch ligands act as opposing environmental cues in regulating the plasticity of type 3 innate lymphoid cells. Sci Signal 2016; 9:ra46. [DOI] [PubMed] [Google Scholar]
- 31. Han X, Uchida K, Jurickova I et al. Granulocyte‐macrophage colony‐stimulating factor autoantibodies in murine ileitis and progressive ileal Crohn's disease. Gastroenterology 2009; 136:1261–1271. [DOI] [PMC free article] [PubMed] [Google Scholar]
- 32. Xu Y, Hunt NH, Bao S. The role of granulocyte macrophage‐colony‐stimulating factor in acute intestinal inflammation. Cell Res 2008; 18:1220–1229. [DOI] [PubMed] [Google Scholar]
- 33. Sainathan SK, Hanna EM, Gong Q et al. Granulocyte macrophage colony‐stimulating factor ameliorates DSS‐induced experimental colitis. Inflammatory Bowel Dis 2007; 14:88–99. [DOI] [PMC free article] [PubMed] [Google Scholar]
- 34. Roth L, MacDonald JK, McDonald JW, Chande N. Sargramostim (GM‐CSF) for induction of remission in Crohn's disease: a cochrane inflammatory bowel disease and functional bowel disorders systematic review of randomized trials. Inflamm Bowel Dis 2012; 18:1333–1339. [DOI] [PubMed] [Google Scholar]
- 35. Codarri L, Gyulveszi G, Tosevski V et al. RORγt drives production of the cytokine GM‐CSF in helper T cells, which is essential for the effector phase of autoimmune neuroinflammation. Nat Immunol 2011; 12:560–567. [DOI] [PubMed] [Google Scholar]
- 36. El‐Behi M, Ciric B, Dai H et al. The encephalitogenicity of TH17 cells is dependent on IL‐1‐ and IL‐23‐induced production of the cytokine GM‐CSF. Nat Immunol 2011; 12:568–575. [DOI] [PMC free article] [PubMed] [Google Scholar]
- 37. Maloy KJ, Powrie F. Intestinal homeostasis and its breakdown in inflammatory bowel disease. Nature 2011; 474:298–306. [DOI] [PubMed] [Google Scholar]
- 38. Mantovani A, Cassatella MA, Costantini C, Jaillon S. Neutrophils in the activation and regulation of innate and adaptive immunity. Nat Rev Immunol 2011; 11:519–531. [DOI] [PubMed] [Google Scholar]
- 39. Tester AM, Cox JH, Connor AR et al. LPS responsiveness and neutrophil chemotaxis in vivo require PMN MMP‐8 activity. PLoS One 2007; 2:e312. [DOI] [PMC free article] [PubMed] [Google Scholar]
- 40. Farooq SM, Stillie R, Svensson M, Svanborg C, Strieter RM, Stadnyk AW. Therapeutic effect of blocking CXCR2 on neutrophil recruitment and dextran sodium sulfate‐induced colitis. J Pharmacol Exp Ther 2009; 329:123. [DOI] [PubMed] [Google Scholar]
- 41. Zhu F, He H, Fan L et al. Blockade of CXCR2 suppresses proinflammatory activities of neutrophils in ulcerative colitis. Am J Transl Res 2020; 12:5237–5251. [PMC free article] [PubMed] [Google Scholar]
- 42. Dignass A, Van Assche G, Lindsay JO et al. The second European evidence‐based Consensus on the diagnosis and management of Crohn's disease: current management. J Crohns Colitis 2010; 4:28–62. [DOI] [PubMed] [Google Scholar]
- 43. Adegbola SO, Sahnan K, Warusavitarne J, Hart A, Tozer P. Anti‐TNF Therapy in Crohn's Disease. Int J Mol Sci 2018; 19:2244. [DOI] [PMC free article] [PubMed] [Google Scholar]
- 44. Kock K, Pan WJ, Gow JM et al. Preclinical development of AMG 139, a human antibody specifically targeting IL‐23. Br J Pharmacol 2015; 172:159–172. [DOI] [PMC free article] [PubMed] [Google Scholar]
- 45. Adedokun OJ, Xu Z, Gasink C et al. Pharmacokinetics and exposure response relationships of ustekinumab in patients with Crohn's disease. Gastroenterology 2018; 154:1660–1671. [DOI] [PubMed] [Google Scholar]
- 46. El‐Sherbiny Y, Savage L, Wittmann M, Emery P, Goodfield M, McGonagle D. SAT0007 Group 3 innate lymphoid cells numbers in peripheral blood predict ustekinumab (STELARA) therapy responsiveness in psoriatic disease cases with subclinical imaging enthesopathy. Ann Rheum Dis 2017; 76:771. [Google Scholar]
- 47. Erben U, Loddenkemper C, Doerfel K et al. A guide to histomorphological evaluation of intestinal inflammation in mouse models. Int J Clin Exp Pathol 2014; 7:4557–4576. [PMC free article] [PubMed] [Google Scholar]
Associated Data
This section collects any data citations, data availability statements, or supplementary materials included in this article.
Supplementary Materials


