Abstract
The synthesis of gold nanoparticles is dependent on both the concentration of trisodium citrate dihydrate and the time that it interacts with tetrachloroauric acid. A wide range of gold nanoparticles with various sizes and dispersity can be produced based on control variables, such as time of reaction and acid concentration, using a similar approach to that of the Turkevich model. In this model, the pH of the solution decreases slightly throughout the reaction (0.005 unit/min) due to the chemical interactions between trisodium citrate dihydrate and tetrachloroauric acid. Dicarboxy acetone is formed during citrate oxidization, resulting in gold nuclei formation over time. In addition, gold nanoparticle nucleation causes pH fluctuation over time based on gold nanoparticle sizes. An inverse correlation (coefficient of smaller than −0.97) was calculated between the pH and reaction time at different ratios of trisodium citrate dihydrate to tetrachloroauric acid. Regression analysis was used to develop a model for the prediction of the size of gold nanoparticles ranging from 18 to 38 nm based on the concentration of trisodium citrate dihydrate and the reaction time.
1. Introduction
Nanoparticles are at the forefront of development in technology and medicine due to their size and unique properties.12345 The clinical application of nanotechnology in different areas of medicine is developed, including ophthalmology specifically in retina diseases,6 drug delivery to target cells,7 and potential for the prevention and treatment of cancer.8 Gold nanoparticles (Au NPs) have attracted enormous scientific and technological interest due to their ease of synthesis, chemical stability, unique optical properties, and biocompatibility.91011121314151617 These unique particles with sizes comparable to those of cellular structures enable the development of more applications such as optical tomography imaging18 and the use of tracers to detect DNA.19,20 Also, their unique optical properties provide the potential for developing artificial tissues in ophthalmic therapeutic applications due to their unique plasmon effect.21 However, it is still necessary to study their dispersity in size, shape, and distribution, which result in monodisperse Au NPs in different sizes. Multiple mechanisms and synthesis protocols have been established to control the Au NP size, shape, and surface-charge properties.2223242526272829 Among the array of advanced methods, the synthesis based on citrate reduction is widely used in different applications due to its high reproducibility and control over the particle size, however there are still critical questions in this regard..30 The Au NPs are produced following the reduction in the tetrachloroauric acid (HAuCl4) by trisodium citrate dihydrate in water.313233343536373839 In this multilayered chemical reaction, the trisodium citrate dihydrate initially undergoes oxidation, thereby producing dicarboxy acetone.40 The trisodium citrate dihydrate reaction with tetrachloroauric acid gold chloride produces dicarboxy acetone.41,42 Therefore, the dicarboxy acetone enables the simultaneous reduction and oxidation of the aurous species to form gold nuclei by acting as a nucleation agent. The gold chloride is then organized to form gold nuclei, as the dicarboxy acetone decomposes into acetone.40 These particles can then react with other Au NPs on their surfaces to cause an increase in size. Therefore, the findings indicate that the concentration of citrate, which is used as a reducing agent and a stabilizer, can significantly affect the NP size, and stable Au NPs with a uniform particle size results in the reduction of HAuCl4. In the reduction process, the rate of adsorption of the stabilizer controls the size of the nanoparticle.43444546 Ji et al.47 demonstrated that a mixture with pH > 6 provides a condition suitable for the formation of monodisperse Au NPs. However, our studies propose that reaction time is another important control factor that must be considered. Reaching a pH that is >6 is possible even at a lower ratio of citrate dihydrate to tetrachloroauric acid (1.875:1). Mountrichas et al.48 reported that during the Au NP synthesis, as temperature goes higher, the nanoparticle creation will be faster and more monodisperse Au NPs will be produced. Additionally, in another study, it was reported that Au NPs synthesized at temperatures below 50 °C were very polydisperse and also the long reaction times at low temperature made the synthesis method unrealistic.49 Thus, a fixed high temperature (boiling temperature) and protocol we used have been established for optimum and monodisperse synthesis of the nanoparticles. The purpose of this study is to analyze the effect of the concentration of trisodium citrate dihydrate and the length of reaction time as control parameters on the size of the nanoparticles. Our findings demonstrate that the reaction time changes the acidity, size, and dispersity of Au NPs over a selected range of time during their synthesis.
2. Results and Discussion
The pH values were measured for all collected samples in intervals of 10 min. All samples were measured three times on consecutive days, and the maximum standard deviation (SD) was 0.03 pH unit. Figure 1 shows that pH varies with both citrate concentration and reaction time. While it was initially expected that citrate would increase acidity, the pH analysis indicated that the acidity increases over time, as shown by a decline in pH. However, the pH was saturated after 70 min of reaction time in all concentrations; hence, the Au NP sizes were fixed. We found that the minimum pH was observed in the samples synthesized when the ratio of trisodium citrate dihydrate to tetrachloroauric acid was 1.5:1 and after 70 min of reaction time. We observed that, for the ratios of trisodium citrate dihydrate to tetrachloroauric acid from 1.5:1 to 1.875:1 as the trisodium citrate ratio increased, the pH increased as well. Figure 1 demonstrates that the highest pH value was obtained after 10 min of reaction in the ratio of 1.875:1.
Figure 1.
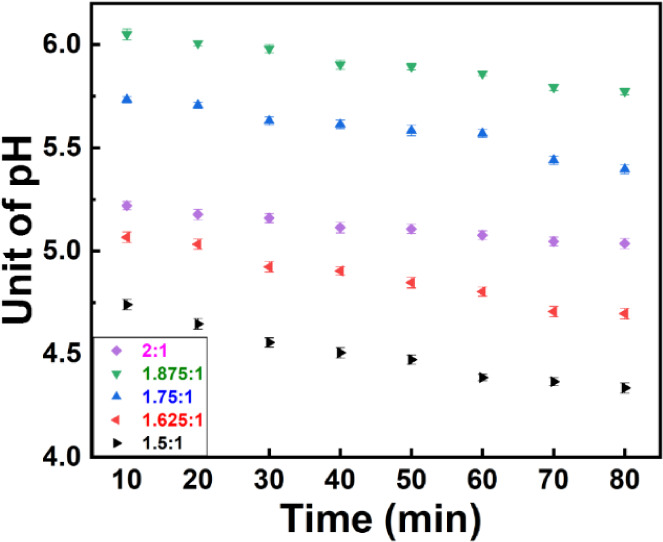
pH values over reaction time of samples synthesized with a different weight ratio of trisodium citrate dihydrate to tetrachloroauric acid.
However, for the ratio of 2:1, pH dramatically decreased likely due to reversible chemical interactions between aurous salt and single Au atoms. At this ratio, the pH of solutions was identical to the sample synthesized by the ratio of 1.625:1. The largest difference in pH was observed between 10 and 80 min in the solution synthesized with the ratio of 1.5:1 (0.35 pH unit), and the lowest difference in pH was observed in the sample synthesized with a ratio of 2:1 (0.19 pH unit).
Figure 2a illustrates the UV–vis spectra of Au NPs for samples with varying mass ratios of trisodium citrate dihydrate to tetrachloroauric acid following 10 min of reaction time for each concentration. The particular spectra indicated smaller Au NPs peaked near 520 nm, and larger nanoparticles peaked at longer wavelengths. It was noted that an increase in the amount of the trisodium citrate dihydrate-to-tetrachloroauric acid ratio from 1.5 to 1.875 mg was associated with a decrease in the highest absorption peak. The absorption was increased at the ratio of 2:1, but it was not as high as the absorption recorded in the sample synthesized with the ratio of 1.5:1, and the spectra were similar to the spectra of the sample synthesized with a 1.625:1 mass ratio. The absorption peak for the sample with a ratio of 1.5:1 occurred at the wavelength of 531 nm. A dramatic blue shift of the surface plasmon resonance (SPR) peak was observed from 520 to 531 nm with an increase in maximum absorbance value. This was quite different from the samples synthesized with higher amounts of trisodium citrate dihydrate ratios (1.625:1 to 2:1) as the color in Figure 2b was darker and purplish. Notably, this characteristic was different from other samples likely due to the larger size of the synthesized Au NPs. We found that the SPR shifted to 523, 521, and 520 nm when the ratio of trisodium citrate dihydrate to tetrachloroauric acid was increased to 1.625:1, 1.75:1, and 1.875:1, respectively, 10 min after adding trisodium citrate to the solution.
Figure 2.
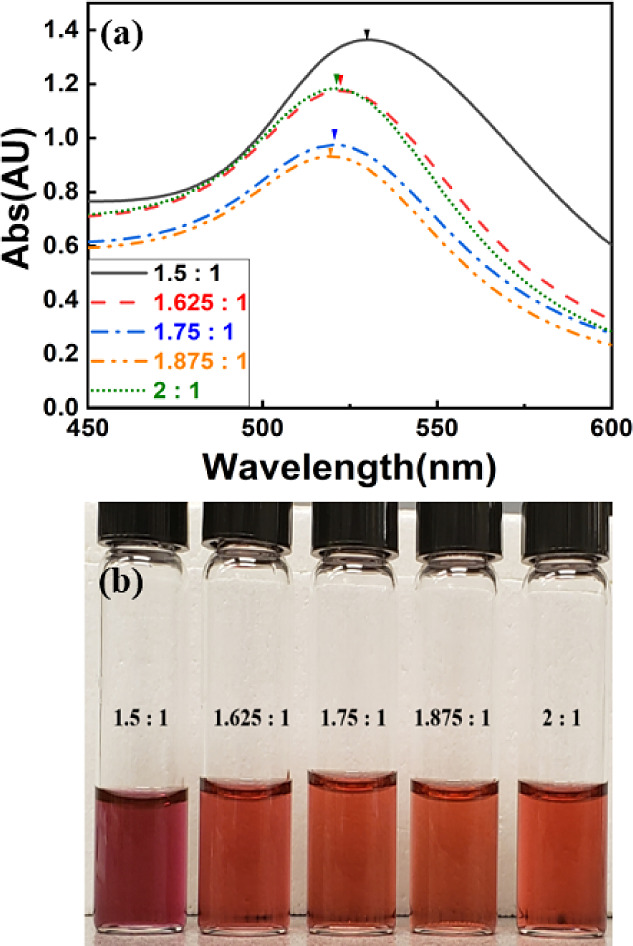
(a) UV–vis spectra and (b) optical image of the Au NP solution synthesized with different ratios of trisodium citrate.
We conducted dynamic light scattering (DLS) analysis (Figure 3a) and UV–vis spectroscopy (Figure 3b) to validate size measurements. In the first approach, the size of the synthesized Au NPs was measured directly by the DLS method. Each sample was measured three times, and an average size with SD ranging from 0.75 to 1.7 nm was detected. Figure 3a shows that the reaction time plays a crucial role in determining the ultimate size of the formed Au NPs in each stage. In all ratios, the average size of Au NPs slightly increased as pH decreased over time.
Figure 3.
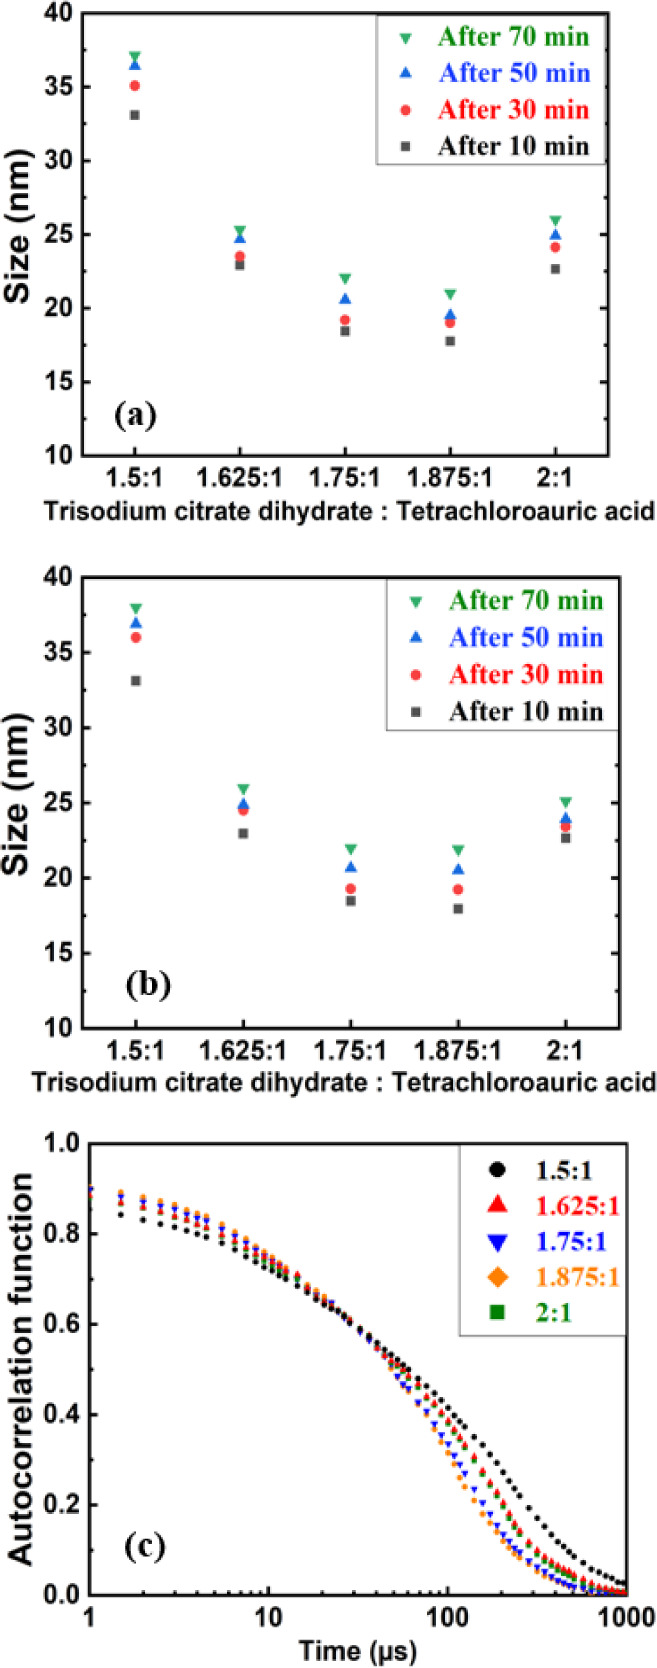
(a) Average size of Au NPs measured by DLS, (b) average size of Au NPs calculated from UV–vis spectroscopy data, and (c) autocorrelation function of Au NPs synthesized with the ratio of trisodim citrate dihydrate to tetrachloroauric acid after 10 min of reaction time.
When the ratio was 1.5:1 and after 10 min of stirring time, the average diameter of Au NPs was 33.08 nm with an SD of 1.75 nm. The NPs reached their final stage after 70 min, with a diameter of 37.12 nm for this ratio. This increase (around 4 nm) in the size of Au NPs overtime was the maximum for the ratio of 1.5:1. For the ratio of 1.625:1, the size increased 2.41 nm between the samples collected after 10 and 70 min, which was the minimum increase in size among the different concentrations. Also, Au NPs for the ratios of 1.5:1 and 1.625 after 50 min of reaction time were almost in their final stage in size adjustment as their pH remained constant. A V-shaped curve was noted that described the link between the particle size and the ratio of trisodium citrate dihydrate to tetrachloroauric acid. We demonstrated an inverse correlation (correlation coefficient of −0.89) between the amount of trisodium citrate dihydrate and the particle size when the ratio of trisodium citrate dihydrate to tetrachloroauric acid was smaller than 1.75. Our results further determined a direct correlation between the amount of trisodium citrate dihydrate and particle size with ratios ≥1.875. The reaction time plays a crucial role in determining the size of the formed Au NPs in each stage, and as pH decreases over time, the size of Au NPs increases. Both pH measurements (Figure 1) and DLS measurements (Figure 3a) verified whether Au NPs reached their maximum size after 70 min for all concentrations. More reaction time decreases the pH of the solution and consequently increases their size. The reaction time longer than 70 min did not increase the size of the synthesized Au NPs when pH remained constant. Therefore, the pH of the solution significantly affected both SPR and the size of Au NPs. The DLS measurements revealed that samples synthesized with higher pH values (>5) were more likely to produce monodisperse Au NPs. The measurements show that the most monodisperse Au NPs were produced when the ratio of trisodium citrate dihydrate to tetrachloroauric acid was 1.875:1 as the pH value remained over 6. At this solution, the majority of the samples were uniformly dispersed ranging from a size of 17.76 nm (SD = 0.75 nm) after 10 min of reaction time to 21.02 nm (SD = 0.87 nm) after 70 min of reaction time.
For samples synthesized with the ratio of 1.5:1 and after 10 min of reaction time, the average diameter of Au NPs was 33.08. However, on increasing the amount of the trisodium citrate dihydrate (after 10 min of stirring time), the size of the samples began to decrease. However, this effect was not observed when the ratio was 2:1 due to a decrease in pH. This increase in size for the ratio of 2:1 also resulted in an increase in the maximum absorbance value after 10 min, as revealed by UV–vis (Figure 2a). We found that samples synthesized at a ratio of 1.5:1 exhibited different size polydispersity with SD up to 1.7 nm. However, with an increasing ratio of trisodium citrate dihydrate to tetrachloroauric acid, the size difference of the synthesized Au NPs decreased (as low as SD = 0.75 nm).
We verified the size measurements using UV–vis spectroscopy, as calculated from the method of Haiss et al.50 We used absorption at 450 nm and SPR from UV spectra, as shown in Figure 3b. Based on this method, the diameter of Au NPs was in good accordance with the DLS data in Figure 3a and for most solutions, they were in the range of SD.
Figure 3c displays the autocorrelation function (ACF) for different ratios of trisodium citrate dihydrate to tetrachloroauric acid after 10 min of reaction time. The exponential behavior of decay and intensity of ACFs verify whether the samples are in a standard quality in both monodispersity and concentration. Au NPs synthesized with the ratio of 1.5:1 due to their larger size and higher dispersity have a longer decay time and lower intensity. Smaller Au NPs synthesized with the ratio of 1.875:1 decay relatively rapidly. The ACF of AU NPs synthesized with the ratio of 1.75:1 almost overlap with the ACF of the sample synthesized with the ratio of 1.875:1, though decay time is slightly longer due to their size difference. This scenario was repeated for Au NPs synthesized with the ratios of 1.625:1 and 2:1.
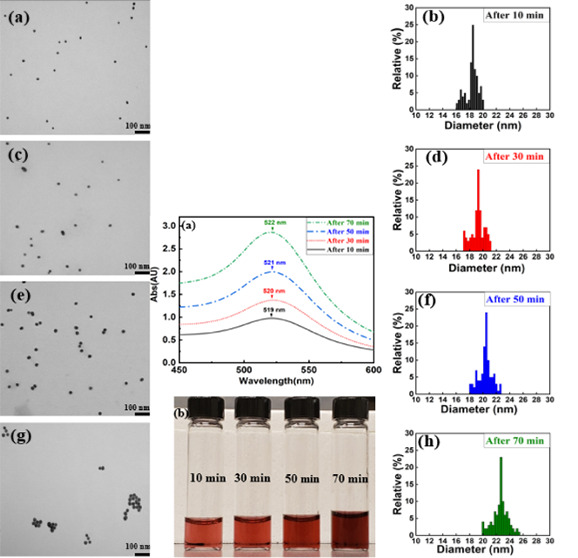
Figure 4a shows the UV–vis spectra for samples synthesized using 35 mg of trisodium citrate dihydrate (ratio of 1.75:1) at different reaction times. It was seen that, after 10 min of reaction time, the synthesized Au NPs were distinctly around 18.4 nm with an SD of 0.94 nm. At this time, UV–vis measurements confirmed that the highest plasmon peak occurred at 519 nm. However, as time passed, the decrease in the pH directly affected the highest plasmon peak. After 30 min of stirring time with the decreasing pH value of the solution, the highest plasmon peak of Au NPs increased to 520 nm. Then, when the pH of the sample continued decreasing after 50 min of reaction time, the highest plasmon peak was 521 nm and the sample size was 22 nm with an SD of 1.05 nm. Finally, after 70 min of reaction time with decreasing pH to the minimum value, both the average Au NP size (23 nm with SD = 1.23 nm) and SPR (522 nm) increased. Figure 4b demonstrates the colorology of Au NPs synthesized using 35 mg of trisodium citrate dihydrate (ratio of 1.75:1) at different reaction times. As the reaction time increases and samples became larger in size, the highest plasmon peak increased over time and the samples became darker in color. However, in Figure 5, we demonstrate that the aggregation of Au NPs as another parameter can potentially cause an increase in the highest plasmon resonance as well.
Figure 4.
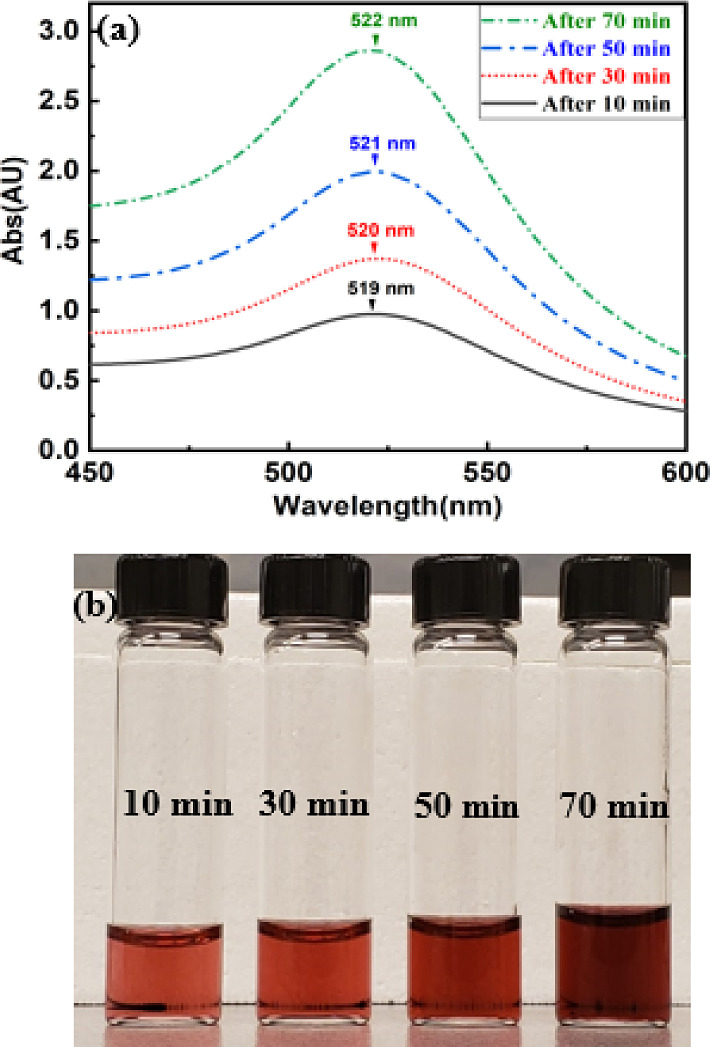
(a) UV–vis spectra of Au NPs synthesized with 35 mg of trisodim citrate dihydrate and (b) optical image of Au NPs synthesized at different reaction times.
Figure 5.
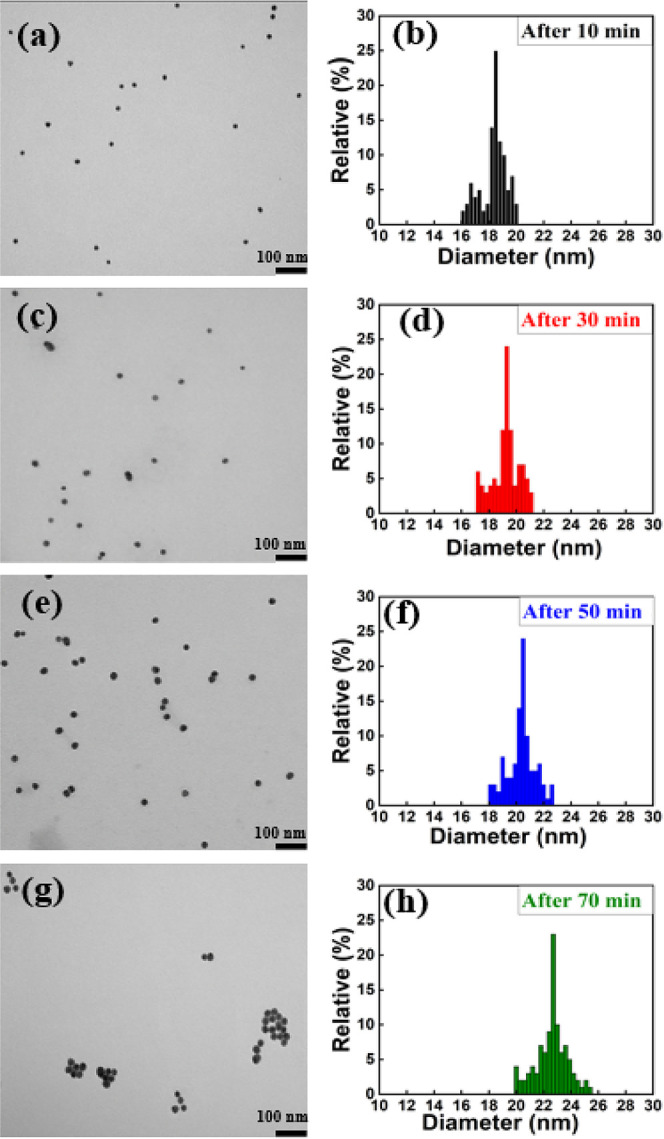
TEM images of Au NPs synthesized with the ratio of 1.75:1 after (a) 10, (c) 30, (e) 50, and (g) 70 min of reaction time. Size distribution histogram of Au NPs after (b) 10, (d) 30, (f) 50, and (h) 70 min of reaction time.
Figure 5 shows the transmission electron microscopy (TEM) images and corresponding size distribution histogram of Au NPs synthesized with the ratio of 1.75:1 and with reaction times of 10, 30, 50, and 70 min. As TEM images (Figure 5a,c,e,g) represent that not only the size of Au NPs increased slightly as the reaction time increases but also the density of samples per volume increased, which consequently resulted in an increase in absorption. At the reaction time of around 70 min, they aggregated and distinct Au NPs could not be observed. This behavior of Au NPs synthesized over different reaction times was also justified by UV–vis spectroscopy measurements, wherein the absorption increased continuously while the wavelength peak remained almost constant (Figure 4a). As a result, the absorption of Au NPs continuously increased. After 70 m, almost all nanoparticles formed an aggregated pile, allowing them to absorb a significant amount of light. Size distribution histograms of Au NPs synthesized with the ratio of 1.75:1 and Au NPs over different reaction times (Figure 5b,d,f,h) clearly demonstrate average size of Au NPs shifted to a larger particles with higher polydispersity relatively.
Figure 6 compares the size and polydispersity of Au NPs synthesized with different concentrations of trisodium citrate dihydrate to tetrachloroauric acid (1.625:1 and 1.875:1) after 10 min of reaction time. Figure 6a shows a relatively wider range of polydispersity for the size of Au NPs when the weight ratio of trisodium citrate dihydrate to tetrachloroauric acid was 1.625:1. Based on the TEM image (Figure 6a) and size distribution histogram of Au NPs (Figure 6b), after 10 min of stirring time, Au NPs of different sizes were formed with a larger SD. Rare NPs with about 2 nm in diameter were detected, and the average sample size was 23 nm with an SD of 1.7 nm. Figure 6c,d shows the TEM images for Au NPs synthesized with the ratio of 1.875:1; as the size of Au NPs decreased they became more monodisperse with a smaller SD. At this ratio and after 10 min of stirring time, the most monodisperse Au NPs with the average size of 18 nm and an SD of 0.75 nm were observed. However, we noticed that as reaction time increased, subsequently increasing size of Au NPs SD was increased to a higher value as well.
Figure 6.
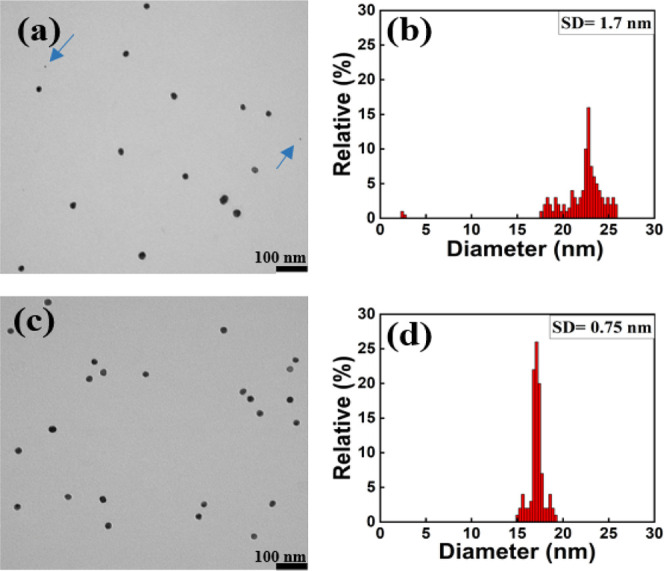
TEM image and size distribution histogram of Au NPs synthesized with the ratio of (a and b) 1.625:1 and (c and d) 1.875:1 after 10 min of reaction time.
3. Synthesis Analysis
We calculated the importance and impact of reaction time and pH on the Au particle size using regression analysis (Figure 7). Our analyses confirmed that we could predict and estimate the size of nanoparticles based on the reaction time and pH of the solution with a p-value of 1.53 × 10⁻⁶ and the root-mean-square error of 2.91 in solutions with different ratios of trisodium citrate dihydrate to tetrachloroauric acid. The predicted versus actual plot shown in the inset suggests a robust model for estimating the nanoparticle size at different reaction times or citrate-to-Au ratios. Our regression model (x1 = 0.0067, x2 = −10.1360, and intercept = 77.2970), while y = 1 + x1 + x2 can estimate the size of the nanoparticles through measuring the pH at any given time during the experiment for different ratios of trisodium citrate dihydrate to tetrachloroauric acid. These quality control measurements can lead to more robust Au NP synthesis.
Figure 7.
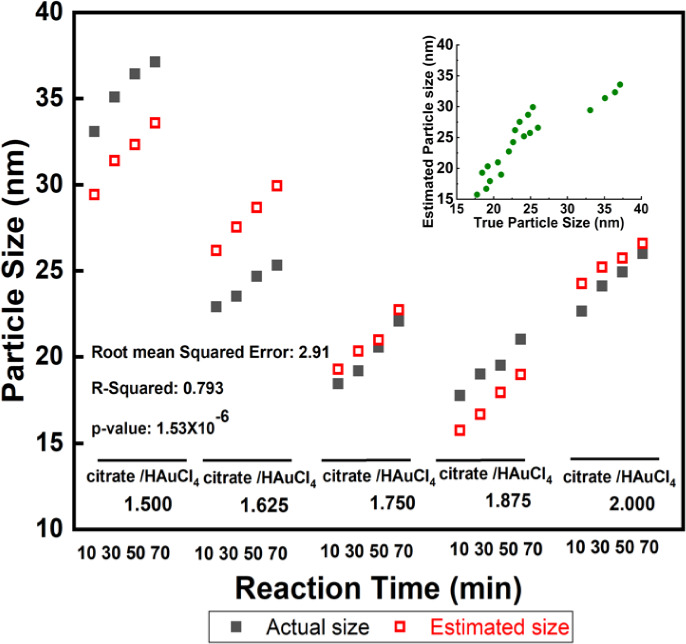
Regression analysis based on the reaction time and pH of solutions with different ratios of trisodium citrate dihydrate to tetrachloroauric acid.
4. Conclusions
In this paper, the effect of the weight ratio of trisodium citrate dihydrate to tetrachloroauric acid (1.5:1–2:1) and the reaction time on producing Au NPs with different sizes and dispersity were investigated. It was observed that the concentration of trisodium citrate dihydrate played a crucial role in producing Au NPs with different sizes and dispersity. Besides, due to a series of reversible chemical reactions, the effect of reaction time was as significant as trisodium citrate dihydrate concentration on both size and dispersity. Furthermore, pH measurements verified that the most monodisperse Au NPs were produced, while the pH of the solution was at least 6. In samples synthesized with a ratio of 1.5:1, the largest Au NPs with a diameter around 38 nm over a low pH value were produced. Subsequently, increasing pH value by adding more concentration of trisodium citrate dihydrate resulted in smaller Au NPs, though the size of NPs fluctuates at different reaction time lengths. TEM images revealed for sample synthesized with lower weigh ratio polydispersity occurred and Au NPs with a diameter as small as 2 nm was observed, though 99% of Au NPs remained monodisperse with a low SD. For the weight ratio of 1.875:1, the most monodisperse Au NPs with a size of 18 nm and an SD of 0.75 nm after 10 min of reaction time were produced. Together, we demonstrate that gold nanoparticle nucleation causes pH fluctuation over time based on gold nanoparticle sizes and controlling the concentration of trisodium citrate dihydrate and the reaction time results in a controlled gold nanoparticle generation of sizes about 18–38 nm. These findings provide critical information that can be used for the development of nanoparticles for technology and medicine.
5. Experimental Section
5.1. Materials
Gold(III) chloride trihydrate (HAuCl4) (99.9% purity-trace metal basis) was acquired from Sigma-Aldrich Co., Ltd, USA. Trisodium citrate dihydrate (HOC(COONa)(CH2COONa)2·2H2O) was acquired from Sigma-Aldrich Co., Ltd, USA. Milli-Q water was obtained using a Thermo Scientific Barnstead Nanopure system, having 18.2 MΩ ionic purity.
5.2. Sample Preparation
Five different solutions of Au NPs with different concentrations of trisodium citrate dihydrate ranging from 30 to 40 mg were synthesized using the Turkevich synthesis method. For each solution, 20 mg of HAuCl4 was suspended in 0.7 mL of Milli-Q water, and this was gradually added to 195 mL of Milli-Q boiling water in a round-bottomed Erlenmeyer on a hot plate. A range of trisodium citrate dihydrate (30, 32.5, 35, 37.5, and 40 mg) was dissolved in 3 mL of Milli-Q water, separately, and was added dropwise to the boiling water with the constant ratio of 0.1 mL/s. This resulted in the mass ratios of trisodium citrate dihydrate to HAuCl4 as 1.5:1, 1.625:1, 1.75:1, 1.875:1, and 2:1, respectively. Due to the temperature-dependent nature of the synthesis, the solution was stirred vigorously by a cylinder-shaped magnet on top of the hot plate. This ensures a uniform temperature across the solution, leading to the formation of nanoparticles of similar sizes. An IR thermometer was used to control and measure the temperature of the solution during the experiment. After the addition of the trisodium citrate dihydrate, the color of the boiling solution gradually changed from light yellow to dark blue and eventually to a wine red, indicating a series of chemical reactions quickly happening that forms nanostructures with different sizes. This process initially started with the oxidation of citrate and producing dicarboxy acetone.40 Auric salt (AuCl3) interacted with two electrons as a result of the first step, thereby producing aurous salt (AuCl).404142 Finally, aurous salt is oxidized simultaneously to produce gold atoms.40 Samples were collected every 10 min after adding trisodium citrate dihydrate solution for a total of 80 min at each concentration. The samples were cooled to room temperature and then stored at 4 °C until further characterization.
5.3. Analysis
All data collected were determined using UV–vis spectroscopy (Thermo Scientific UV–vis 335 923-000 GENESYS 10S Spectrophotometer), DLS (Malvern Zetasizer ZS90), and a pH meter (Corning 320). Due to the optical properties of Au NPs, UV–vis spectroscopy was used to quantify the absorbed light on the plasmon highest peak as well as the SPR peak. Importantly, the optical properties of nanoparticles are indicative of their size, concentration, and numerous other characteristics. The absorption of the Au NPs measured by UV–vis spectroscopy estimates the diameter and the size of the nanoparticles using the method of Haiss et al.50 by measuring the absorption at the SPR peak wavelength and light passing through each sample for Au NPs at 450 nm. This method is valid for Au NPs with a diameter between 5 and 80 nm
where B1 = 2.01 and B2 = 3.11 are constants obtained experimentally. In the formula, ASPR is the absorption at SPR; A450 is the absorption at a wavelength of 450 nm, and d is the diameter of Au NPs. To have a more uniform solution, all samples were sonicated for 10 min before their measurements. Both the concentration and reaction mixture of the added citrate solution drastically impacted the size and dispersity of the Au NPs. A TEM (Tesnai Spirit TEM, Thermofisher Hillsboro) was used to confirm the results obtained by UV–vis and DLS. These methods were used for an in-depth analysis of the nanoparticles produced in the trials conducted throughout this experiment.
Acknowledgments
The authors would like to thank the IUPUI Center for Research and Learning (CRL) for funding this research through the Multidisciplinary Undergraduate Research Institute (MURI) program. They also thank the Integrated Nanosystems Development Institute (INDI) for their help in experiments and the preparation images.
Author Present Address
⊥ Biomedical Engineering, Northwestern University, Evanston, IL 60208, USA
The authors declare no competing financial interest.
References
- Chugh H.; Sood D.; Chandra I.; Tomar V.; Dhawan G.; Chandra R. Role of gold and silver nanoparticles in cancer nano-medicine. Artif. Cells, Nanomed., Biotechnol. 2018, 46, 1210–1220. 10.1080/21691401.2018.1449118. [DOI] [PubMed] [Google Scholar]
- Yadid M.; Feiner R.; Dvir T. Gold Nanoparticle-Integrated Scaffolds for Tissue Engineering and Regenerative Medicine. Nano Lett. 2019, 19, 2198–2206. 10.1021/acs.nanolett.9b00472. [DOI] [PubMed] [Google Scholar]
- Han X.; Xu K.; Taratula O.; Farsad K. Applications of nanoparticles in biomedical imaging. Nanoscale 2019, 11, 799–819. 10.1039/C8NR07769J. [DOI] [PMC free article] [PubMed] [Google Scholar]
- Zhang J.; Mou L.; Jiang X. Surface chemistry of gold nanoparticles for health-related applications. Chem. Sci. 2020, 11, 923–936. 10.1039/C9SC06497D. [DOI] [PMC free article] [PubMed] [Google Scholar]
- Yildiz I.; Shukla S.; Steinmetz N. F. Applications of viral nanoparticles in medicine. Curr. Opin. Biotechnol. 2011, 22, 901–908. 10.1016/j.copbio.2011.04.020. [DOI] [PMC free article] [PubMed] [Google Scholar]
- Scheive M.; Yazdani S.; Hajrasouliha A. R. The utility and risks of therapeutic nanotechnology in the retina. Ther. Adv. Ophthalmol. 2021, 13, 25158414211003381 10.1177/25158414211003381. [DOI] [PMC free article] [PubMed] [Google Scholar]
- Saxena S. K.; Nyodu R.; Kumar S.; Maurya V. K.. Current Advances in Nanotechnology and Medicine. In NanoBioMedicine; Saxena S., Khurana S., Eds.; Springer, 2020; 978-981-32-9897-2. [Google Scholar]
- Siemer S.; Wünsch D.; Khamis A.; Lu Q.; Scherberich A.; Filippi M.; Krafft M. P.; Hagemann J.; Weiss C.; Ding G.-B.; Stauber R. H.; Gribko A. Nano Meets Micro-Translational Nanotechnology in Medicine: Nano-Based Applications for Early Tumor Detection and Therapy. Nanomaterials (Basel) 2020, 10, 383. 10.3390/nano10020383. [DOI] [PMC free article] [PubMed] [Google Scholar]
- Abdelghany A. M.; Oraby A. H.; Farea M. O. Influence of green synthesized gold nanoparticles on the structural, optical, electrical and dielectric properties of (PVP/SA) blend. Phys. B (Amsterdam, Neth.) 2019, 560, 162–173. 10.1016/j.physb.2019.02.029. [DOI] [Google Scholar]
- Bai X.; Wang Y.; Song Z.; Feng Y.; Chen Y.; Zhang D.; Feng L. The Basic Properties of Gold Nanoparticles and their Applications in Tumor Diagnosis and Treatment. Int. J. Mol. Sci. 2020, 21, 2480 10.3390/ijms21072480. [DOI] [PMC free article] [PubMed] [Google Scholar]
- Miu D.; Nicolae I. Third order nonlinear optical properties of gold/alumina multilayer nanocomposites with different nanoparticle arrangements. Thin Solid Films 2020, 697, 137829 10.1016/j.tsf.2020.137829. [DOI] [Google Scholar]
- Huang X.; El-Sayed M. A. Gold nanoparticles: Optical properties and implementations in cancer diagnosis and photothermal therapy. J. Adv. Res. 2010, 1, 13–28. 10.1016/j.jare.2010.02.002. [DOI] [Google Scholar]
- Barnoy E. A.; Motiei M.; Tzror C.; Rahimipour S.; Popvtzer R.; Fixler D. Biological Logic Gate Using Gold Nanoparticles and Fluorescence Lifetime Imaging Microscopy. ACS Appl. Nano Mater. 2019, 2, 6527–6536. 10.1021/acsanm.9b01457. [DOI] [Google Scholar]
- Shen J.-J.; Zhang P.-H.; Zheng F.; Chen H.; Chen W.; Ding Y.; Xia X.-H. Preliminary quality criteria of citrate-protected Gold Nanoparticles for Medicinal Applications. ACS Appl. Nano Mater. 2018, 1, 2120–2128. 10.1021/acsanm.8b00192. [DOI] [Google Scholar]
- Rodrigues G. H. S.; Miyazaki C. M.; Rubira R. J. G.; Constantino C. J. L.; Ferreira M. Layer-by-layer Films of Graphene Nanoplatelets and Gold Nanoparticles for Methyl Parathion Sensing. ACS Appl. Nano Mater. 2019, 2, 1082–1091. 10.1021/acsanm.9b00007. [DOI] [Google Scholar]
- Yeh Y.-C.; Creran B.; Rotello V. M. Gold nanoparticles: Preparation, properties, and applications in bionanotechnology. Nanoscale 2012, 4, 1871–1880. 10.1039/C1NR11188D. [DOI] [PMC free article] [PubMed] [Google Scholar]
- Li N.; Zhao P.; Astruc D. Anisotropic gold nanoparticles: Synthesis, properties, applications, and toxicity. Angew. Chem., Int. Ed. 2014, 53, 1756–1789. 10.1002/anie.201300441. [DOI] [PubMed] [Google Scholar]
- Hayashi A.; Naseri A.; Pennesi M. E.; De Juan E. Jr. Subretinal delivery of immunoglobulin G with gold nanoparticles in the rabbit eye. Jpn. J. Ophthalmol. 2009, 53, 249–256. 10.1007/s10384-009-0655-x. [DOI] [PubMed] [Google Scholar]
- Fadeel B.; Garcia-Bennett A. E. Better safe than sorry: Understanding the toxicological properties of inorganic nanoparticles manufactured for biomedical applications. Adv. Drug Deliv. Rev. 2010, 62, 362. 10.1016/j.addr.2009.11.008. [DOI] [PubMed] [Google Scholar]
- Azarmi S.; Roa W. H.; Löbenberg R. Targeted delivery of nanoparticles for the treatment of lung diseases. Adv. Drug Deliv. Rev. 2008, 60, 863. 10.1016/j.addr.2007.11.006. [DOI] [PubMed] [Google Scholar]
- Mustafa D. E.; Yang T.; Xuan Z.; Chen S.; Haiyang T.; Zhang A. Surface Plasmon Coupling Effect of Gold Nanoparticles with Different Shape and Size on Conventional Surface Plasmon Resonance Signal. Plasmonics 2010, 5, 221–231. 10.1007/s11468-010-9141-z. [DOI] [Google Scholar]
- Da Silva A. B.; Rufato K. B. Composite materials based on chitosan/gold nanoparticles: From synthesis to biomedical applications. Int. J. Biol. Macromol. 2020, 161, 977–998. 10.1016/j.ijbiomac.2020.06.113. [DOI] [PubMed] [Google Scholar]
- Lee K. X.; Shameli K.; Yew Y. P.; Teow S.-Y.; Jahangirian H.; Rafiee-Moghaddam R.; Webster T.J. Recent Developments in the Facile Bio-Synthesis of Gold Nanoparticles (AuNPs) and Their Biomedical Applications. Int. J. Nanomed. 2020, 15, 275–300. 10.2147/IJN.S233789. [DOI] [PMC free article] [PubMed] [Google Scholar]
- Alle M.; Lee S.-H.; Kim J.-C. Ultrafast synthesis of gold nanoparticles on cellulose nanocrystals via microwave irradiation and their dyes-degradation catalytic activity. J. Mater. Sci. Technol. 2020, 41, 168–177. 10.1016/j.jmst.2019.11.003-. [DOI] [Google Scholar]
- Khatua A.; Priyadarshini E.; Rajamani P.; Patel A.; Kumar J.; Naik A.; Saravanan M.; Barabadi H.; Prasad A.; Ghosh L.; Paul B.; Meena R. Phytosynthesis, Characterization and Fungicidal Potential of Emerging Gold Nanoparticles Using Pongamia pinnata Leave Extract: A Novel Approach in Nanoparticle Synthesis. J. Cluster Sci. 2020, 31, 125–131. 10.1007/s10876-019-01624-6. [DOI] [Google Scholar]
- Panariello L. Highly reproducible, high-yield flow synthesis of gold nanoparticles based on a rational reactor design exploiting the reduction of passivated Au(III). React. Chem. Eng. 2020, 5, 663–676. 10.1039/C9RE00469F. [DOI] [Google Scholar]
- Gao Y. Mechanistic insights of the reduction of gold salts in the Turkevich protocol. Nanoscale 2020, 4, 2740–2751. 10.1039/C9NR08877F. [DOI] [PubMed] [Google Scholar]
- Besenchard M. O. New insight into the effect of mass transfer on the synthesis of silver and gold nanoparticles. CrystEngComm 2018, 20, 7082–7093. 10.1039/C8CE01014E. [DOI] [Google Scholar]
- Shi L.; Buhler E.; Boué F.; Carn F. How does the size of gold nanoparticles depend on citrate to gold ratio in Turkevich synthesis? Final answer to a debated question. J. Colloid Interface Sci. 2017, 492, 191–198. 10.1016/j.jcis.2016.10.065. [DOI] [PubMed] [Google Scholar]
- Wuithschick M.; Birnbaum A.; Witte S.; Sztucki M.; Vainio U.; Pinna N.; Rademann K.; Emmerling F.; Kraehnert R.; Polte J. Turkevich in New Robes: Key Questions Answered for the Most Common Gold Nanoparticle Synthesis. ACS Nano 2015, 9, 7052–7071. 10.1021/acsnano.5b01579. [DOI] [PubMed] [Google Scholar]
- Fakih F. B.; Shanti A.; Stefanini C.; Lee S. Optimization of Gold Nanoparticles for Efficient Delivery of Catalase to Macrophages for Alleviating inflammation. ACS Appl. Nano Mater. 2020, 3, 9510–9519. 10.1021/acsanm.0c02234. [DOI] [Google Scholar]
- Sengani M.; Alexandru Mihai G. V.; Rajeswari D. Recent trends and methodologies in gold nanoparticle synthesis—A prospective review on drug delivery aspect. OpenNano 2017, 2, 37–46. 10.1016/j.onano.2017.07.001. [DOI] [Google Scholar]
- Ding W.; Zhang P.; Li Y.; Xia H.; Wang D. Effect of latent heat in boiling water on the synthesis of gold nanoparticles of different sizes by using the Turkevich method. Chem. Phys. Chem. 2015, 16, 447–454. 10.1002/cphc.201402648. [DOI] [PubMed] [Google Scholar]
- Schulz F.; Homolka T.; Bastús N. G.; Puntes V.; Weller H. Little adjustments significantly improve the Turkevich synthesis of gold nanoparticles. Langmuir 2014, 30, 10779–10784. 10.1021/la503209b. [DOI] [PubMed] [Google Scholar]
- Zhao P.; Li N.; Astruc D. State of the art in gold nanoparticle synthesis. Coord. Chem. Rev. 2013, 257, 638–665. 10.1016/j.ccr.2012.09.002. [DOI] [Google Scholar]
- Rohiman A.; Anshori I.; Surawijaya A. Study of colloidal gold synthesis using Turkevich method. AIP Conf. Proc. 2011, 1415, 39. 10.1063/1.3667215. [DOI] [Google Scholar]
- Zabetakis K.; Ghann W. E.; Kumar S.; Daniel M.-C. Effect of high gold salt concentrations on the size and polydispersity of gold nanoparticles prepared by an extended Turkevich–Frens method. Gold Bull. 2012, 45, 203–211. 10.1007/s13404-012-0069-2. [DOI] [Google Scholar]
- Uppal M. A.; Kafizas A.; Ewing M. B.; Parkin I. P. The effect of initiation method on the size, monodispersity and shape of gold nanoparticles formed by the Turkevich method. New J. Chem. 2010, 34, 2906–2914. 10.1039/c0nj00505c. [DOI] [Google Scholar]
- De Souza C. D.; Nogueira B. R.; Rostelato M. E. C. M. Review of the methodologies used in the synthesis gold nanoparticles by chemical reduction. J. Alloys Compd. 2019, 798, 714–740. 10.1016/j.jallcom.2019.05.153. [DOI] [Google Scholar]
- Sanjeev Kumar K. S. G.; Kumar R. Modeling of Formation of Gold Nanoparticles by Citrate Method. Ind. Eng. Chem. Res. 2007, 46, 3128–3136. 10.1021/ie060672j. [DOI] [Google Scholar]
- Gammons C.; Yu Y.; Williams-Jones A. The Disproportionation of Gold (I) Chloride Complexes at 25 to 200 °C. Geochim. Cosmochim. Acta 1997, 61, 1971–1983. 10.1016/S0016-7037(97)00060-4. [DOI] [Google Scholar]
- Davies A. The Kinetics of the Coagulation of Gold Sols. J. Phys. Chem. 1929, 33, 274–284. 10.1021/j150296a009. [DOI] [Google Scholar]
- Méndez E.; Fagúndez P.; Sosa P.; Gutiérrez M.V.; Botasini S. Experimental evidences support the existence of an aggregation/disaggregation step in the Turkevich synthesis of gold nanoparticles. Nanotechnology 2021, 32, 045603 10.1088/1361-6528/abbfd5. [DOI] [PubMed] [Google Scholar]
- Grzelczak M.; Pérez-Juste J.; Mulvaney P. Shape control in gold nanoparticle synthesis. Chem. Soc. Rev. 2008, 37, 1783–1791. 10.1039/B711490G. [DOI] [PubMed] [Google Scholar]
- Gagner J. E.; Lopez M. D.; Dordick J. S.; Siegel R. W. Effect of gold nanoparticle morphology on adsorbed protein structure and function. Biomaterials 2011, 32, 7241–7252. 10.1016/j.biomaterials.2011.05.091. [DOI] [PubMed] [Google Scholar]
- Sardar R.; Shumaker-Parry J. S. Spectroscopic and microscopic investigation of gold nanoparticle formation: Ligand and temperature effects on rate and particle size. J. Am. Chem. Soc. 2011, 133, 8179–8190. 10.1021/ja107934h. [DOI] [PubMed] [Google Scholar]
- Ji X.; Song X.; Li J.; Bai Y.; Yang W.; Peng X. Size control of gold nanocrystals in citrate reduction: The third role of citrate. J. Am. Chem. Soc. 2007, 129, 13939–13948. 10.1021/ja074447k. [DOI] [PubMed] [Google Scholar]
- Mountrichas G.; Pispas S.; Kamitsos E. I. Effect of Temperature on the Direct Synthesis of Gold Nanoparticles Mediated by Poly(dimethylaminoethyl methacrylate) Homopolymer. J. Phys. Chem. C 2014, 118, 22754–22759. 10.1021/jp505725v. [DOI] [Google Scholar]
- Tran M.; DePenning R.; Turner M.; Padalkar S. Effect of citrate ratio and temperature on gold nanoparticle size and morphology. Mater. Res. Express 2016, 3, 105027 10.1088/2053-1591/3/10/105027. [DOI] [Google Scholar]
- Haiss W.; Thanh N. T. K.; Aveyard J.; Fernig D. G. Determination of Size and Concentration of Gold Nanoparticles from UV–Vis Spectra. Anal. Chem. 2007, 79, 4215–4221. 10.1021/ac0702084. [DOI] [PubMed] [Google Scholar]


