Abstract
Nanostructured titanium dioxide (TiO2) has a potential platform for the removal of organic contaminants, but it has some limitations. To overcome these limitations, we devised a promising strategy in the present work, the heterostructures of TiO2 sensitized by molybdenum disulfide (MoS2) nanoflowers synthesized by the mechanochemical route and utilized as an efficient photocatalyst for methyl orange (MO) degradation. The surface of TiO2 sensitized by MoS2 was comprehensively characterized by X-ray diffraction (XRD), Raman spectroscopy, Fourier transform–infrared spectroscopy (FT–IR), scanning electron microscopy (SEM), transmission electron microscopy (TEM), X-ray photoelectron spectroscopy (XPS), energy dispersive spectroscopy (EDS), UV–vis diffuse reflectance spectroscopy (UV–vis DRS), photoluminescence spectroscopy (PL), Brunauer–Emmett–Teller (BET) surface area, and thermogravimetric analysis (TGA). From XRD results, the optimized MoS2–TiO2 (5.0 wt %) nanocomposite showcases the lowest crystallite size of 14.79 nm than pristine TiO2 (20 nm). The FT–IR and XPS analyses of the MoS2–TiO2 nanocomposite exhibit the strong interaction between MoS2 and TiO2. The photocatalytic results show that sensitization of TiO2 by MoS2 drastically enhanced the photocatalytic activity of pristine TiO2. According to the obtained results, the optimal amount of MoS2 loading was assumed to be 5.0 wt %, which exhibited a 21% increment of MO photodegradation efficiency compared to pristine TiO2 under UV–vis light. The outline of the overall study describes the superior photocatalytic performance of 5.0 wt % MoS2–TiO2 nanocomposite which is ascribed to the delayed recombination by efficient charge transfer, high surface area, and elevated surface oxygen vacancies. The context of the obtained results designates that the sensitization of TiO2 with MoS2 is a very efficient nanomaterial for photocatalytic applications.
1. Introduction
In the globe, a large number of industries are being set up to cater to the fundamental needs of a growing population. These industries are mainly responsible for detrimental effects on the environment in number of ways.1 Harmful non-biodegradable ingredients like dyes, fertilizers, and pesticides from numerous industries are released into the water bodies without any treatment, which has a long-term effect on human health as well as biological constituents.2,3 Considering the quality and management of water, it can be seen that the available water resources have been drastically polluted due to massive pollution from domestic and industrial wastewater along with the unavailability of natural purification. Pure water is a basic and essential need for a healthy world today. As a result, a variety of physical, biological, and chemical methods are reported for industrial as well as domestic wastewater treatment.3,4 Otherwise, it will become more and more difficult to provide good quality drinking water to society.
In recent years, photocatalysis is considered to be a very effective dominant process and paying attention to various researchers in the field of environmental protection as well as materials to diminish global pollution by processing industrial wastewater using heterogeneous photocatalysis.5 The heterogeneous photocatalysis using semiconductors is an excellent alternative for other conventional methods due to unique advantages such as having a simple structure and powerful oxidizing capacity, no formation of secondary toxic pollutants, etc.6−8 Generally, the photocatalysis process, which takes place on the surface of the photocatalyst, involves three important steps: (i) production of electron–hole pairs by absorbing incident light by semiconducting materials, (ii) separation and transfer of the photoinduced charge carriers on the surface of the photocatalyst, and (iii) use of charge carriers during surface catalytic redox reactions.8,9 The various wide band gap metal oxides such as ZnO, SnO2, ZrO2, CeO2, CuO, and TiO2 have been utilized toward the removal of toxic organic pollutants from the water sources.7,10−12 As an ideal photocatalyst, nanostructured n-type TiO2 (band gap, ∼3.2 eV) has been the most admirable semiconducting material used in the photocatalytic field owing to its variety of properties like photostability, chemically inertness, cost-effectiveness, excellent durability, non-toxicity, etc.12−16 On the other hand, the TiO2 can only be absorbing UV light, which is merely 5.0% accessible in the solar spectrum.12 Also, a familiar drawback is a wide band gap, resulting in the faster electron–hole pair recombination, which restricts its activity for the photocatalysis process.17−19
To tackle the above issues, photocatalysis needs to have a design of a heterostructure platform so that it separates the charge and prevents electron–hole pair recombination by transporting more electrons.20 A number of techniques such as metal or non-metal doping, formation of heterostructures, creation of oxygen vacancy defects, and surface sensitization have been engaged to reduce the wide band gap and extend illumination response to visible range.15,21−25 Among these strategies, surface sensitization of TiO2 is an effective approach to enhance photocatalytic performance; additionally, surface sensitization contributes to shrinking the crystallite size and band gap of TiO2.15,26 It is carried out with different approaches like metal deposition, dye sensitization, and attachment of co-catalysts and quantum dots to modify the properties of the host.15
During the past few decades, transition metal dichalcogenides (TMDCs) have been proved to be remarkable work in many fields such as water splitting, optoelectronics, supercapacitors, solar cells, photocatalysis, hydrogen generation, sensors, and lithium-ion batteries due to their admirable chemical, electrical, optical and mechanical properties.27,28 Among these, MoS2 has been established as a significant interest in sensitizing a wide band gap TiO2 due to its potential properties like having a two-dimensional layered structure, good charge carrier transport capacity, and high surface area.29,30 Typically, MoS2 has a S–Mo–S sandwich layered structure seized together via weak Van der Waals interaction. It is analogous to graphene, in which Mo is surrounded by the S atoms through covalent bonding.30 The surface sensitization of TiO2 by MoS2 can systematically control the electron–hole pair recombination by acting as trapping centers of the electron.31
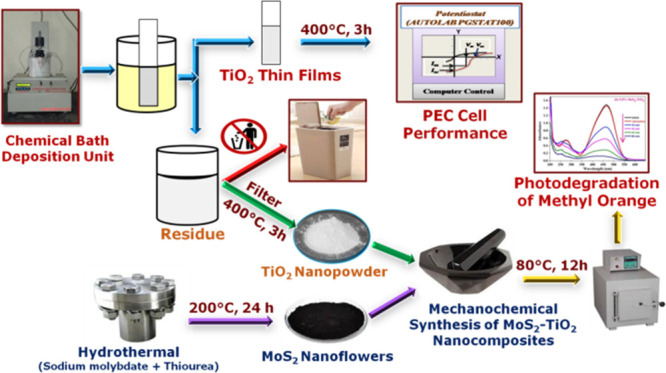
Herein, the present work focused on the surface sensitization of nanostructured TiO2 surface by MoS2 via a cost-effective and simpler mechanochemical method. For this work, TiO2 nanopowder was obtained from a chemical bath deposition residue after the successful preparation of thin films and MoS2 nanoflowers were synthesized by a facile hydrothermal technique. The hydrothermal method is a very unique technique to produce a desirable shape of a nanomaterial, which has better applications than the regular shape. The photocatalytic performance of surface-sensitized TiO2 was tested for MO under UV–vis light (λ = 365 nm), and its degradation mechanism are discussed. Also, this study provides the effect of different initial pH values and scavengers on photocatalytic activity.
2. Results and Discussion
2.1. XRD Analysis
The XRD patterns of pristine TiO2, TiO2 sensitized by MoS2 (2.5, 5.0, and 7.5 wt % MoS2–TiO2), and pristine MoS2 are depicted in Figure 1a–e. For pristine TiO2, the observed diffraction peaks are correlated to (101), (004), (200), (105), (211), (204), (116), (220), and (215) lattice planes. These indexed diffraction peaks correspond to the tetragonal anatase phase are confirmed by JCPDS card no. 21-1272.32,33
Figure 1.
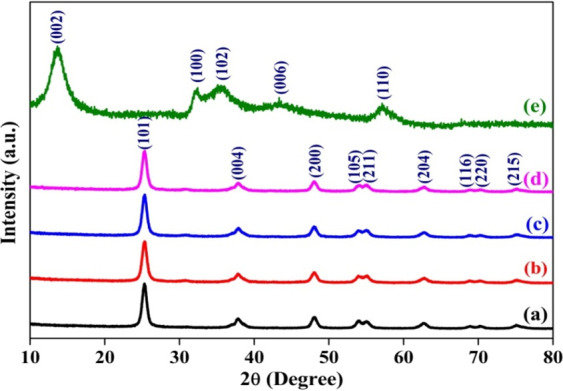
XRD patterns of (a) pristine TiO2, (b) 2.5 wt %, (c) 5.0 wt %, (d) 7.5 wt % MoS2–TiO2, and (e) pristine MoS2.
In the XRD pattern of MoS2 shown in Figure 1e, the diffraction peaks positioned at 13.62, 32.24, 35.58, 43.4, and 56.97 corresponds to the (002), (100), (102), (006), and (110) crystal planes of the hexagonal phase, respectively (JCPDS card 37-1492).34 Meanwhile, the XRD patterns of MoS2–TiO2 nanocomposites exhibit analogous diffraction peaks of pristine TiO2, which does not alter the tetragonal crystal structure of the TiO2. In addition, it is remarkable to notice that diffraction peak positions are negligibly shifted toward higher diffraction angles, which is accredited to the formation of defects and strain within TiO2 lattice (shown in Table 1).35,36
Table 1. Peak Positions at 2θ of XRD Patterns for Pristine TiO2 and MoS2–TiO2 Nanocomposites.
| XRD
peak positions at 2θ |
|||||
|---|---|---|---|---|---|
| observed
(Degree) |
|||||
| (hkl) planes | standard (degree) | TiO2 | 2.5 wt % MoS2–TiO2 | 5.0 wt % MoS2–TiO2 | 7.5 wt % MoS2–TiO2 |
| (101) | 25.271 | 25.27 | 25.303 | 25.307 | 25.305 |
| (004) | 37.786 | 37.78 | 37.867 | 37.897 | 37.878 |
| (200) | 48.030 | 48.04 | 48.049 | 48.061 | 48.043 |
| (105) | 53.869 | 53.95 | 53.977 | 54.046 | 53.964 |
| (211) | 55.038 | 55.11 | 55.079 | 55.053 | 55.068 |
| (204) | 62.663 | 62.71 | 62.747 | 62.776 | 62.741 |
| (116) | 68.732 | 68.84 | 68.871 | 68.950 | 68.758 |
| (220) | 70.279 | 70.30 | 70.307 | 70.307 | 70.298 |
| (215) | 74.997 | 75.11 | 75.132 | 75.139 | 75.060 |
The reflections of TiO2 are dominant in sensitized materials due to the larger amount of TiO2 than MoS2. Meanwhile, there is no existence of the characteristic reflections of MoS2 (Figure 1b–d); it is due to the low content, and this confirms that MoS2 is on the surface of the TiO2 NPs.37Table 2 shows the interplanar distances (d) of crystals, which are estimated according to Bragg’s equation (eq 1).14
| 1 |
where θ is symbolized for Bragg’s angle of a particular diffraction peak and λ represents the wavelength of Cu Kα radiation (0.15406 nm). The lattice parameters (a, c) along with unit cell volume (V) of the pristine and surface-sensitized TiO2 are calculated via lattice geometry eqs 2 and 3, respectively. Meanwhile, the lattice parameters and cell volume of hexagonal MoS2 is calculated by eqs 4 and 5.
| 2 |
| 3 |
| 4 |
| 5 |
Table 2. Comparison of Interplanar Spacing (d) between Pristine TiO2 and MoS2–TiO2 Nanocomposites.
| interplanar
distance (d) |
|||||
|---|---|---|---|---|---|
| observed
(Å) |
|||||
| (hkl) planes | standard (Å) | TiO2 | 2.5 wt % MoS2–TiO2 | 5.0 wt % MoS2–TiO2 | 7.5 wt % MoS2–TiO2 |
| (101) | 3.5200 | 3.5201 | 3.5156 | 3.5151 | 3.5153 |
| (004) | 2.3780 | 2.3783 | 2.3730 | 2.3712 | 2.3724 |
| (200) | 1.8920 | 1.8916 | 1.8912 | 1.8908 | 1.8914 |
| (105) | 1.6999 | 1.6975 | 1.6967 | 1.6947 | 1.6971 |
| (211) | 1.6665 | 1.6645 | 1.6653 | 1.6660 | 1.6656 |
| (204) | 1.4808 | 1.4798 | 1.4790 | 1.4784 | 1.4791 |
| (116) | 1.3641 | 1.3622 | 1.3616 | 1.3603 | 1.3636 |
| (220) | 1.3378 | 1.3374 | 1.3373 | 1.3374 | 1.3374 |
| (215) | 1.2649 | 1.2632 | 1.2629 | 1.2628 | 1.2640 |
The values of desired structural lattice parameters and unit cell volume for all samples are given in Table 3. The decrease in the lattice parameter and interplanar distance are ascribed due to the defects relaxation inside the crystal.36,38
Table 3. Comparison of Lattice Parameters and Cell Volume of Pristine TiO2 and MoS2–TiO2 Nanocomposites.
| observed |
|||||||
|---|---|---|---|---|---|---|---|
| MoS2–TiO2 |
observed | ||||||
| lattice parameters | standard | TiO2 | 2.5 wt % | 5.0 wt % | 7.5 wt % | MoS2 | standard |
| a (Å) | 3.7850 | 3.7832 | 3.7823 | 3.7816 | 3.7828 | 3.2022 | 3.1622 |
| c (Å) | 9.5130 | 9.5134 | 9.4920 | 9.4848 | 9.4896 | 12.495 | 12.298 |
| volume (Å3) | 136.31 | 136.16 | 135.79 | 135.63 | 135.79 | 110.95 | 106.43 |
From eqs 6–9, the average crystallite size (D), dislocation density (δ), microstrain (ε), and stacking fault (α) of all materials are evaluated through experimental XRD data.14 The dislocation density, microstrain, and stacking faults signify that some defects are present in the material.
| 6 |
| 7 |
| 8 |
| 9 |
β is a full width at half maxima of the respective peak in radian and k symbolized for shape factor, equal to 0.89. The structural parameters of all samples are given in Table 4. In particular, an average crystallite size of pristine TiO2 and MoS2 are calculated and found to be 20 and 3.64 nm respectively. After the surface sensitization of TiO2 by MoS2, the reduction in crystallite size from 20 to 14.79 nm (5.0 wt % MoS2–TiO2) is observed, due to the restraint of the grain growth of TiO2. Most of the time, increasing values of defects like microstrain, dislocation density and stacking faults lead to hinder grain growth.39 Some defects introduced in the semiconductor crystal increase catalytic activity by restraining the recombination rate of the photoexcited charge carriers.40
Table 4. Various Structural Parameters of Pristine TiO2, Pristine MoS2, and MoS2–TiO2 Nanocomposites.
| structural parameters | TiO2 | 2.5 wt % MoS2–TiO2 | 5.0 wt % MoS2–TiO2 | 7.5 wt % MoS2–TiO2 | MoS2 |
|---|---|---|---|---|---|
| crystallite size (D) (nm) | 20 | 15.50 | 14.79 | 16.25 | 3.64 |
| dislocation density (δ) (line/m2) (×1015) | 2.52 | 4.08 | 4.30 | 3.75 | 61.4 |
| microstrain (ε) (×10–3) | 1.80 | 2.27 | 2.53 | 2.14 | 11.19 |
| stacking fault (α) (×10–3) | 3.05 | 4.06 | 4.56 | 3.85 | 22.18 |
2.2. Raman Spectral Analysis
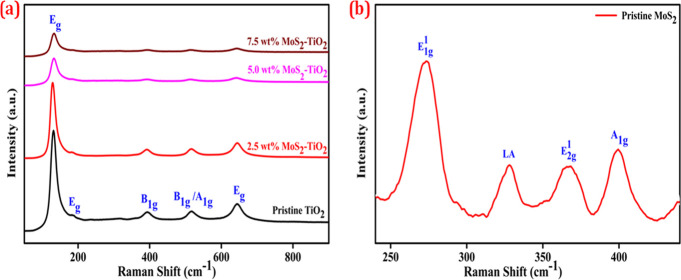
To further investigate the structural properties of nanocomposites, the Raman spectra of pristine TiO2, MoS2, and MoS2–TiO2 nanocomposites were recorded and shown in Figure 2a,b. From Figure 2a, the Raman spectrum of pristine TiO2 exhibits bands positioned at Eg (144, 197, and 639 cm–1), B1g (397 cm–1), and A1g + B1g (517 cm–1), which corresponds to active Raman modes of anatase TiO2.14,41Figure 2b provides Raman spectra of hydrothermally synthesized MoS2. It exhibits two characteristic peaks located at E2g1 (367 cm–1) and A1g (400 cm–1) modes. It is deemed that the E2g peak is correlated to in-layer movements of Mo and S atoms, whereas the A1g peak involves the out-of-layer symmetric movements of S atoms along the c-axis. In addition, the appearance of E1g1 (273 cm–1) and LA peaks (328 cm–1) are associated with the vibration of a particular MoS2 layer with adjacent layers (i.e., rigid layer mode).42,43
Figure 2.
Raman spectra of (a) pristine TiO2 and MoS2–TiO2 nanocomposites and (b) pristine MoS2.
In MoS2–TiO2 nanocomposites, the spectra display barely characteristic active Raman bands of TiO2. It indicates that the dominant phase is anatase TiO2, whereas no peaks could be ascribed to MoS2. However, TiO2 maintains its pure crystal phase after sensitization by MoS2, but interestingly, the intensity of all peaks greatly decreased corresponding to the peaks of TiO2.
2.3. FT–IR Analysis
Fourier transform–infrared (FT–IR) analysis of pristine TiO2 (Figure 3a) demonstrated bands at 535, 1052, 1634, and 3447 cm–1, which is in accordance with earlier work.14 A broad band at 535 cm–1 is allocated to Ti–O stretching and Ti–O–Ti bridge stretching vibrations. In addition, two bands at 1634 and 3447 cm–1 correspond to bending and stretching vibrations of the −OH group. A band at 1052 cm–1 is allocated to stretching vibrations of the alcoholic C–O group.44,45
Figure 3.
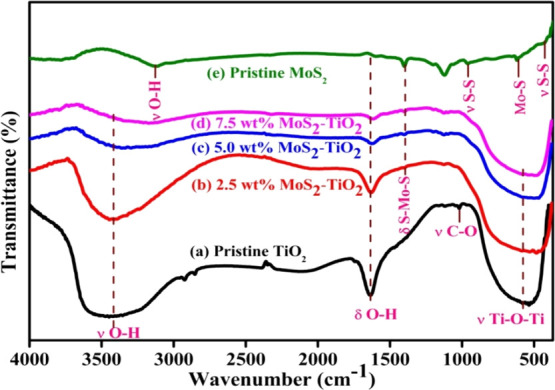
FT–IR spectra of (a) pristine TiO2, (b–d) MoS2–TiO2 nanocomposites, and (e) pristine MoS2.
In the FT–IR spectrum of MoS2, the bands at 441, 618, 960, 1121, and 1401 cm–1 are assigned to the hexagonal MoS2. The spectrum shows characteristic multiple bands related to sulfur groups, which appeared within the 700–1150 cm–1 spectral region.46 Also, two bands appear separately in the spectrum at 441 and 960 cm–1, which is related to the stretching vibrations of the S–S bond (ν S–S).47 Furthermore, a band at 1401 cm–1 is caused by the stretching vibration of the S–Mo–S bond (ν S–Mo–S).48 The band at 618 cm–1 refers to the stretching vibrations of the Mo–S bond (ν Mo–S).46 The characteristic bands at 3115 and 1607 cm–1 are associated with stretching (ν OH) and bending (δ OH) vibrations of the −OH group.47,48
The obtained FT–IR spectra of TiO2 coupled with MoS2 results point out the major bands of TiO2 that emerged in the materials. Upon the introduction of MoS2, the appearance of one supplementary band of stretching vibration of the S–Mo–S is observed at 1401 cm–1, which suggests successful surface sensitization on TiO2. Lastly, we recognized that the bending and stretching vibrational bands of surface adsorbed water (−OH) has slightly weakened with increasing wt % of MoS2.
2.4. TEM Analysis
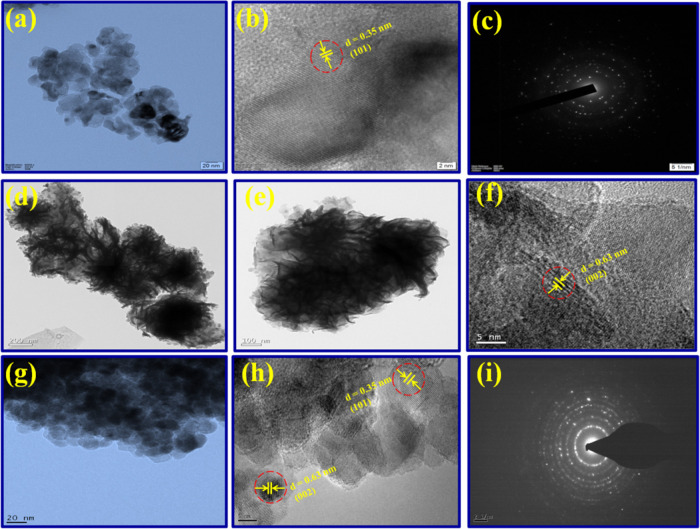
The comprehensive morphological investigations of pristine TiO2 along with the 5.0 wt % MoS2–TiO2 nanocomposite were performed via TEM and HR–TEM analysis. From Figure 4a, the TEM image of TiO2 exhibits an irregular spherical-shaped morphology with the particle size between 15–20 nm. As well, the HR–TEM image of TiO2 NPs demonstrates lattice fringes with 0.35 nm interplanar spacing, which is analogous to the (101) crystal plane of the anatase phase (Figure 4b). From Figure 4c, the SAED pattern revealed that TiO2 is nanocrystalline in nature. Figure 4d,e shows the TEM images of the pristine MoS2. It is obvious that the TEM images of MoS2 clearly show a nanopetal-like morphology with a thickness of about 5 nm. In Figure 4f, the HR–TEM image of MoS2 nanoflowers reveals lattice fringes with 0.63 nm interplanar spacing, which corresponds to the (002) crystal plane of hexagonal MoS2.
Figure 4.
TEM, HR–TEM, and SAED pattern of the (a–c) pristine TiO2, (d–f) pristine MoS2, and (g–i) 5.0 wt % MoS2–TiO2 nanocomposite.
Figure 4g indicates the TEM image of the 5.0 wt % MoS2–TiO2 nanocomposite, which illustrated some dark particles superimposed on the surface of TiO2. In addition to that, it gives evidence for a uniform spherical morphology and uniform homogeneity signifying that mechanochemical treatment is flexible for the synthesis of the nanocomposite. Furthermore, interfacial interaction between closely connected TiO2 with MoS2 is appropriate for the separation of photoinduced charge carriers. From Figure 4h, the HR–TEM image further showed an interplanar distance of 0.35 nm analogous to the (101) crystalline plane of the anatase TiO2. Whereas, the additional lattice fringe distance of 0.63 nm corresponds to the (002) plane of MoS2. From Figure 4i, the SAED pattern evidently showed nanocrystalline nature with well-defined dotted rings.
2.5. XPS Analysis
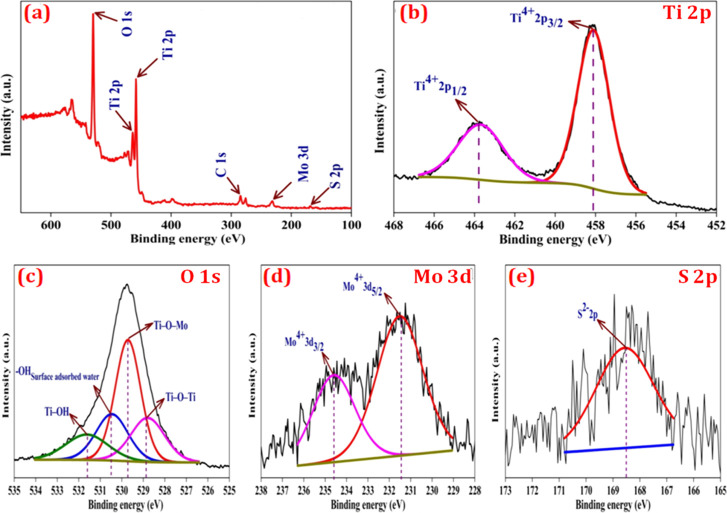
In Figure 5a, the 5.0 wt % MoS2–TiO2 nanocomposite exhibits the binding peaks of C 1s, Mo 3d, S 2p, Ti 2p, and O 1s elements. The C 1s peak is attributed to the XPS instrument itself. From Figure 5b, the HR-XPS spectrum of the Ti 2p electron demonstrates that the remarkable two peaks emerging at 458.11 and 463.8 eV are associated with 2p3/2 and 2p1/2 electrons, clearly evident for the existence of a Ti4+ oxidation state. In Figure 5d, deconvolution of the Mo 3d region is finely fitted with a doublet of the Mo 3d5/2 and Mo 3d3/2 spin–orbit splitting components situated at 231.47 and 234.6 eV, which exhibits molybdenum moieties related to the Mo4+ oxidation state. In addition, the one emerging peak at 168.53 eV is allocated to the S 2p, which is effectively evidence of the presence of S2– (Figure 5e).
Figure 5.
(a) XPS spectrum of the 5.0 wt % MoS2–TiO2 nanocomposite and HR-XPS spectra of (b) Ti 2p, (c) O 1s, (d), Mo 3d, and (e) S 2p.
The O 1s region (Figure 5c) demonstrates four peaks at 528.8, 529.73, 530.48, and 531.63, which are attributed to Ti–O–Ti, Ti–O–Mo, hydroxyl groups of surface adsorbed water, and Ti–OH bonds, respectively. The existence of Ti–O–Mo bonds points out that TiO2 and MoS2 are intimately bound to each other, which mainly contributes to the capable transport of photoinduced charge carriers and improves catalytic activity.49
2.6. SEM and EDS Analysis
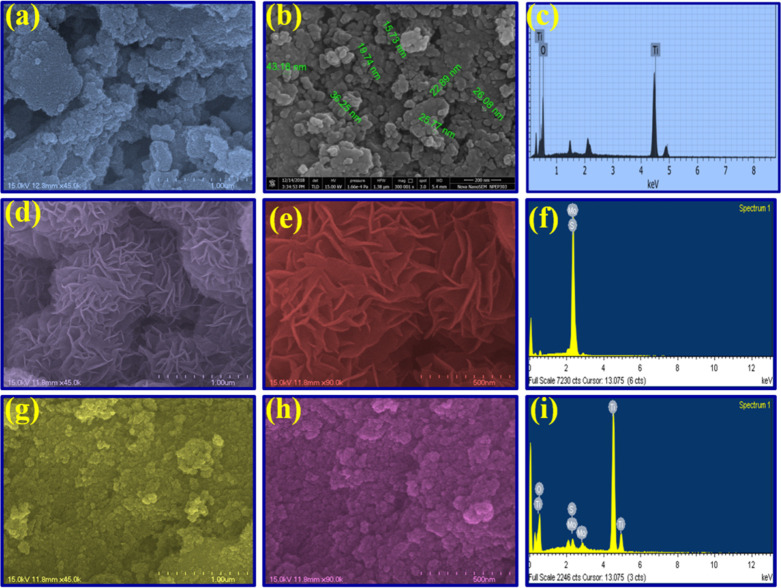
From Figure 6a,b, SEM micrographs of pristine TiO2 NPs reveal an irregular and aggregated spherical shape morphology with a sphere diameter in the range of 20–30 nm. The EDS spectrum of pristine TiO2 (Figure 6c) clearly showed only a higher percentage of titanium along with oxygen molecules without any other impurities. Amazingly, SEM images of pristine MoS2 (Figure 6d,e) demonstrated that a number of nanopetals have come together into 3D-nanoflowers that furnish a massive surface area. In Figure 6f, the EDS spectrum of pristine MoS2 shows the only presence of Mo and S elements without any other impurity peaks.
Figure 6.
SEM micrographs and EDS spectra of the (a–c) pristine TiO2, (d–f) pristine MoS2, and (g–i) 5.0 wt % MoS2–TiO2 nanocomposite.
Furthermore, SEM images of the 5.0 wt % MoS2–TiO2 nanocomposite, which is shown in Figure 6g,h, address that after the addition of MoS2, the original spherical shape pattern of the TiO2 NPs was retained, but the nanoflower MoS2 brings the homogeneity of the material by significantly decreasing the aggregation rate. In addition, the MoS2 were interconnected and sharply bound with TiO2 by forming internal Ti–O–Mo bonds (support Figure 5c), which sort out the leaching problem of MoS2 from TiO2 in the nanocomposite material.
From Figure 6i, the EDS spectrum verified the existence of Mo, S, Ti, and O in the nanocomposite, which established the successful construction of the nanocomposite. One more significant aspect that the nanocomposite contains point defects, i.e., oxygen vacancies, which provide electron or hole traping centers, which help to enhance the photocatalytic activity (Table 5).50
Table 5. Elemental Atomic % of the Pristine TiO2, Pristine MoS2, and 5.0 wt % MoS2–TiO2 Nanocomposite.
| elements (atomic %) | pristine TiO2 | 5.0 wt % MoS2–TiO2 | pristine MoS2 |
|---|---|---|---|
| Ti | 22.71 | 32.60 | |
| O | 77.29 | 66.09 | |
| Mo | 0.52 | 37.37 | |
| S | 0.78 | 62.63 |
2.7. UV–Vis DRS and PL Analysis
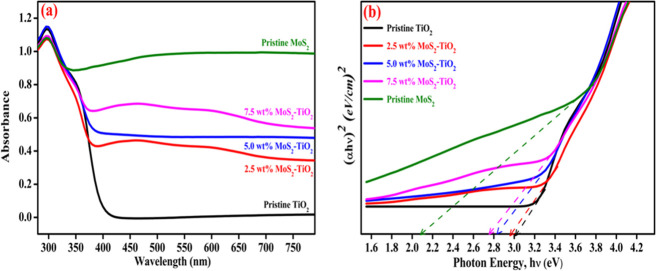
To examine the optical absorption study of pristine TiO2, pristine MoS2, and MoS2–TiO2 nanocomposites by UV–vis, DRS spectra and results are shown in Figure 7a. The pristine TiO2 host demonstrated a cutoff absorption edge at approximately 410 nm. Whereas, MoS2–TiO2 nanocomposites exhibited a red–shift absorption edge in comparison with the pristine TiO2, which is related to light-harvesting properties.51 It indicates that the addition of visible active MoS2 extends the optical absorption, which is responsible for enhancing the photocatalytic activity of the material. The UV–vis DRS spectrum revealed that MoS2 has strong absorption in the visible region.
Figure 7.
(a) UV–vis DRS spectra and (b) Tauc’s plots of pristine TiO2, pristine MoS2, and MoS2–TiO2 nanocomposites.
From Figure 7b, the corresponding band gap energy values from Tauc’s plots are obtained to be 3.03 and 2.08 for pristine TiO2 and pristine MoS2, respectively. In addition, the band gap energy of 2.5, 5.0, and 7.5 wt % MoS2–TiO2 nanocomposites are found to be 2.96, 2.85, and 2.77 eV, respectively. From the acquired values, it is strongly evident that the nanocomposite material has the minimal band gap energy compared to the pristine TiO2. With the minimal band gap energy, a greater light wavelength is needed. In the meantime, the requirement of energy is lower for smooth electron transit, which is responsible for improving the catalytic activity.
Figure 8 demonstrates a comparison of the PL spectra of pristine TiO2 and surface sensitized TiO2 by MoS2. From the PL spectra of photocatalysts, the charge transfer behavior and the possibility of recombination of photoexcited electron–holes can be explained to some extent.
Figure 8.
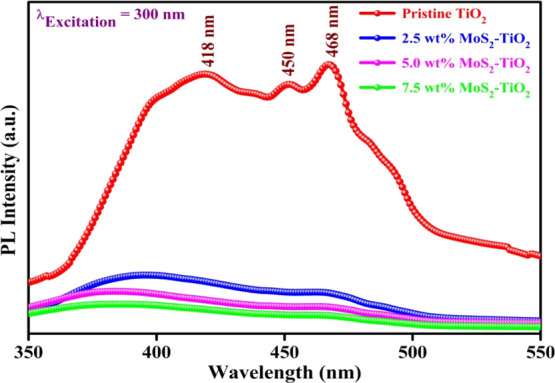
PL spectra for pristine TiO2 and MoS2–TiO2 nanocomposites.
The pristine TiO2 exhibits three visible emission peaks (418, 450, and 468 nm) in the broad 400–500 nm region, generally originating from self-trapped excitons (STE), vacancy of oxygen, and surface defects.52,53 The violet emission peaks at 418 nm are usually associated with the transfer of electrons to the conduction band from valence band.52 The blue emission peaks at 450 and 468 nm are related to surface defects and vacancy of oxygen.54,55 Generally, the towering PL emission intensity of TiO2 intends the speedy recombination rate of photoexcited charge carriers. The main aim of introducing MoS2 on the surface of TiO2 is to reduce the photoexcited electron–hole pair recombination by creating complementary acceptor energy levels. From the PL spectra, it is indicated that in TiO2 coupled with MoS2, the intensity of these observed emission peaks quenched significantly. Notably, MoS2 provides sites for electron traps, thereby evidently enhancing photodegradation efficiency through efficient suppression of the charge carrier recombination.
2.8. BET Surface Area Analysis
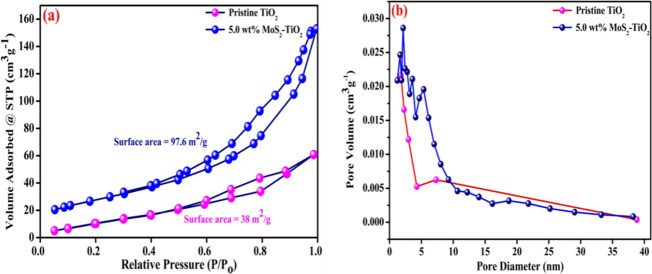
The surface area and porosity of pristine TiO2 as well as 5.0 wt % MoS2–TiO2 photocatalysts were resolved by Brunauer–Emmett–Teller (BET) and Barrett–Joyner–Halenda (BJH) methods. According to IUPAC classifications (Figure 9a), pristine TiO2 and 5.0 wt % MoS2–TiO2 photocatalysts follow type IV isotherm curves with hysteresis loops of H3 type at a relative pressure range of 0.6 to 0.95 and 0.4 to 1.0, respectively.56 The acquired results indicate that 5.0 wt % MoS2–TiO2 photocatalysts are extremely more mesoporous in nature than pristine TiO2 due to the oxygen vacancies. From the BET method, the surface area of 5.0 wt % MoS2–TiO2 was found to be 97.6 m2/g, which is bigger than that of pristine TiO2 photocatalysts (38 m2/g).
Figure 9.
(a) Typical N2 adsorption–desorption isotherms and (b) BJH pore size distribution curves of TiO2 and the 5.0 wt % MoS2–TiO2 nanocomposite.
The BJH plots for the pore size distribution are shown in Figure 9b. From the BJH method, the pore radius and total pore volume of TiO2 were found to be 1.79 nm and 0.087 cm3/g, respectively. Whereas, the pore radius and total pore volume for 5.0 wt % MoS2–TiO2 photocatalysts were found to be 2.14 nm and 0.229 cm3/g, respectively. From the BET surface area analyzer, it was confirmed that the surface area increases from 38 to 97.6 m2/g; after the introduction of MoS2 onto the surface of TiO2, it offers additional active sites for adsorption along with degradation of MO and thus improves the catalytic activity of the composite.57 In addition to that, the total pore volume increases from 0.087 to 0.229 cm3/g, which clearly suggests the formation of supplementary pores.
2.9. TGA Analysis
Figure 10 demonstrates the TGA curves of the pristine TiO2 and 5.0 wt % MoS2–TiO2 nanocomposite to study thermal stability. First, pristine TiO2 shows four apparent weight loss regions: 25–150 °C (removal of physisorbed water molecules as well as excess solvents), 150–350 °C (elimination of unhydrolyzed isopropoxide and chemisorbed water molecules), 350–750 °C (formation of amorphous to thermodynamically stable anatase crystal phase), and 750–1000 °C (transform anatase into rutile phase).
Figure 10.
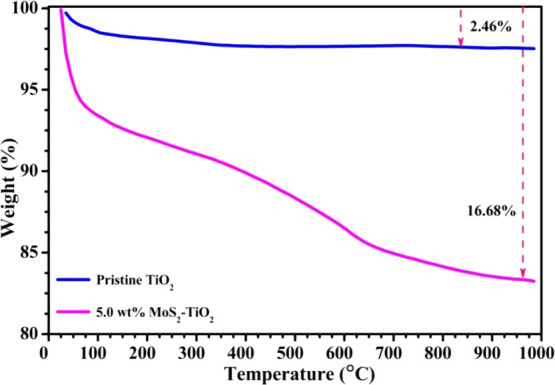
TGA curves of TiO2 and the 5.0 wt % MoS2–TiO2 nanocomposite.
In the 5.0 wt % MoS2–TiO2 nanocomposite, below 350 °C, a weight loss of 9.41% was observed due to the evaporation of physically adsorbed water and loss of chemisorbed water molecules.58 The next weight loss was measured to be 6.02%, attributed to the oxidation of MoS2 to MoO3 and transformation of amorphous TiO2 to the anatase phase.14,59 The final weight loss is 1.25% in the range of 750–1000 °C due to the phase transformation from anatase TiO2 to rutile. The weight loss was measured to be 2.46 and 16.68% for the pristine TiO2 and 5.0 wt % MoS2–TiO2 nanocomposite, respectively. From the overall TGA curves, the apparent weight loss does not appear, which demonstrates that the photocatalyst can be used directly for practical applications.
2.10. Photodegradation of MO over the MoS2–TiO2 Nanocomposite under UV–Visible Light (365 nm)
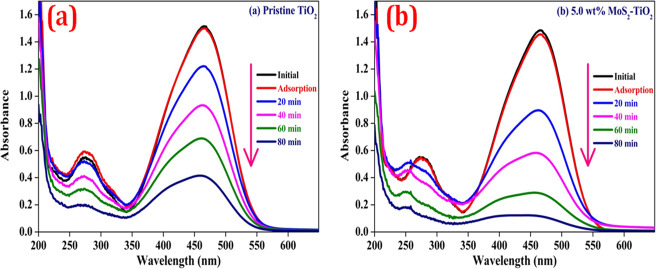
The photodegradation efficiencies of MO using pristine TiO2 and MoS2–TiO2 nanocomposites were determined under UV–vis light irradiation. In the dark condition, the 5.0 wt % MoS2–TiO2 nanocomposite displays 1.98% of MO dye molecules adsorbed onto the surface, whereas the pristine TiO2 surface adsorbed only 1.0%. It indicates that a nanocomposite has superior adsorption capacity. Clearly, the addition of the 5.0 wt % MoS2–TiO2 (0.5 g/dm3) nanocomposite under UV–vis light leads to significant photodegradation of MO (20 mg/dm3) (93%) within 80 min, while the pristine TiO2 had a photodegradation efficiency of 72% (Figure 11). In Table 6, the obtained results were compared with different previously reported nanocomposites with respect to degradation time and degradation efficiency.60−68 It concludes that the photocatalytic activity of the synthesized nanocomposite is admirable toward MO degradation.
Figure 11.
UV–vis absorption spectra of MO degradation (20 mg/dm3) over (a) TiO2 and (b) 5.0 wt % MoS2–TiO2 (0.5 g/dm3) photocatalysts under UV–vis light.
Table 6. Comparison of the Photodegradation of MO over Different Nanocomposites.
| photocatalyst | amount of photocatalyst (g/dm3) | concentration of MO dye (mg/dm3) | time (min) | light source | degradation efficiency (%) | reference |
|---|---|---|---|---|---|---|
| MoS2/g–C3N4 | 0.5 | 20 | 300 | visible | 60 | (60) |
| GO/TiO2 | 1.0 | 20 | 240 | UV | 85 | (61) |
| visible | 40 | |||||
| MoS2/g–C3N4 | 0.4 | 10 | 180 | visible | 95 | (62) |
| g–C3N4/TiO2/FAC | 3.0 | 20 | 180 | visible | 71 | (63) |
| Pc/C–TiO2 | 0.6 | 10 | 150 | UV–visible | 60 | (64) |
| MoS2/TiO2 | 0.5 | 20 | 120 | visible | 60 | (65) |
| MoS2/TiO2 | 0.5 | 10 | 120 | visible | 89 | (66) |
| N–TiO2@MoS2 | 0.5 | 10 | 120 | visible | 91 | (67) |
| MoS2/Fe3O4 | 0.5 | 10 | 100 | visible | 79 | (68) |
| MoS2–TiO2 | 0.5 | 20 | 80 | UV–visible | 94 | present work |
The photocatalytic activity of pristine TiO2 was lower than the nanocomposite. Almost 21% improvement in the photocatalytic activity of the 5.0 wt % MoS2–TiO2 nanocomposite can be attributed to the enhancement of the effective surface area that allows higher contaminant molecules or MO dye molecules to be adsorbed for the redox reaction to take place. Also, it improves the charge separation resulting from the reduction of electron–hole pair recombination.
2.10.1. Effect on Photodegradation of MO over Different wt% MoS2–TiO2 Nanocomposites
Additionally, from Figure 12, 2.5 and 7.5 wt % MoS2–TiO2 nanocomposites also exhibited photodegradation efficiencies of 76.15 and 75.38% within 80 min, respectively. This established that the synthesized nanocomposites are efficient photocatalysts for MO degradation.
Figure 12.
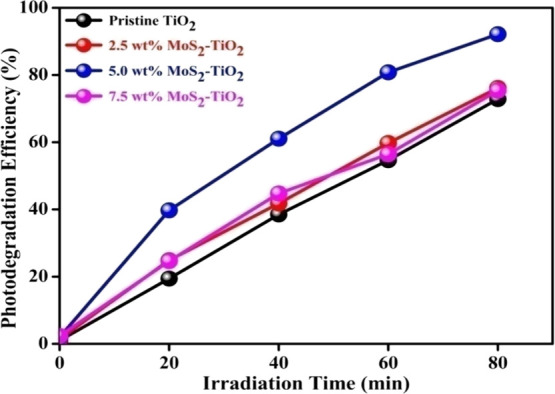
Photocatalytic degradation of MO over different wt % MoS2–TiO2 nanocomposites.
Basically, the MoS2 cocatalyst can efficiently separate the photoexcited charge carriers and further increase the photocatalytic activity toward MO degradation as compared to pristine TiO2. MoS2 interacts with TiO2 on the interface after the mechanochemical method, which can quickly trap the photoexcited electrons of TiO2. As the amount of MoS2 on the surface of TiO2 is increased, the photocatalytic activity increased significantly and then decreased gradually. From Figure 12, it was observed that the MoS2–TiO2 nanocomposite with an optimum amount of MoS2 (5.0 wt %) possesses maximum photocatalytic activity. The appropriate amount of MoS2 would feasibly permit more electrons to trap and diminish the rate of recombination of photoexcited charge carriers without the screening of the TiO2 surface from the catalytic reaction than other concentrations of MoS2 in the MoS2–TiO2 nanocomposite. However, when the MoS2 amount exceeds 5.0 wt %, it leads to a decrease in photocatalytic activity because black MoS2 can absorb more light. The excessive amount of MoS2 can hinder the efficient absorption of light by TiO2 and also screening the TiO2 surface from the catalytic reaction.
2.10.2. Kinetics Study of Photodegradation of MO over Different wt% MoS2–TiO2 Nanocomposites
The kinetic study of photocatalytic degradation of MO was illustrated by the Langmuir–Hinshelwood model (eq 10), which is shown as follows:
| 10 |
where k is the decay rate constant, C0 is the initial concentration of MO, and Ct is the concentration of MO after degradation at time t. The photodegradation of MO using MoS2–TiO2 nanocomposites under UV–vis light follows the pseudo-first-order kinetics. Plots of ln(C0/Ct) with respect to irradiation time (t) for different wt % MoS2–TiO2 nanocomposites are shown in Figure 13. By the well-fitting linear regression plots, obtain the rate constants (k) from the slopes of each plot. Additionally, half life time (t1/2) is calculated through the following eq 11.14
| 11 |
Figure 13.
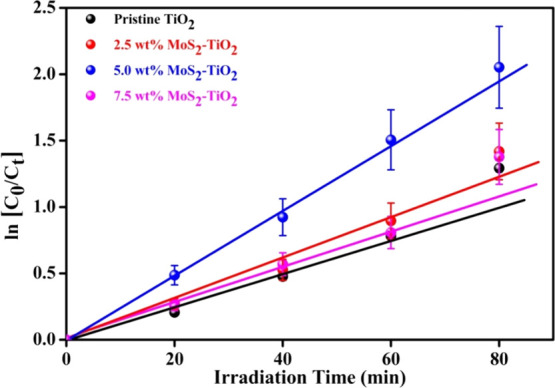
Plot of ln[C0/Ct] versus irradiation time to study the kinetics of photodegradation of MO.
The photodegradation efficiency, rate constant, and half life time are summarized in Table 7. From the obtained results, it is indicated that the 5.0 wt % MoS2–TiO2 nanocomposite showed a higher rate constant (0.028 min–1) and minimum half life time (23.98 min). The rate constant (k) represents the photocatalytic activity of the photocatalyst. The higher the k value, the faster the photodegradation of MO; hence, the better photocatalytic activity of the 5.0 wt % MoS2–TiO2 nanocomposite. In contrast, in the case of pristine TiO2, it showed a minimal rate constant and higher half life time.
Table 7. Photodegradation Efficiency and Kinetics Data of MO Degradation over MoS2–TiO2 Nanocomposites under UV–Vis Light.
| photocatalyst | TiO2 | 2.5 wt % MoS2–TiO2 | 5.0 wt % MoS2–TiO2 | 7.5 wt % MoS2–TiO2 |
|---|---|---|---|---|
| degradation time (min) | 80 | 80 | 80 | 80 |
| degradation efficiency (%) | 72.83 | 76.15 | 93 | 75.38 |
| rate constant (k) (min–1) | 0.015 | 0.0166 | 0.028 | 0.0163 |
| half life time (t1/2) (min) | 43.86 | 41.59 | 23.98 | 42.46 |
2.10.3. Effect of Initial pH of MO Solution on Photodegradation
The solution pH is another key feature to both the generation of reactive species and chemical forms of MO, thereby affecting the MO photodegradation. The different initial pH values (4, 5.8, 7, 8, and 9) were inspected with an initial MO concentration of 20 mg/dm3 under UV–vis light. The pH of the MO solution was adjusted by adding dilute HCl or NaOH.
The synthesized 5.0 wt % MoS2–TiO2 nanocomposite (0.5 g/dm3) is added in the target MO solution (20 mg/dm3) under the selected pH. The influence of initial pH on MO degradation is shown in Figure 14. Also, the initial pH of the MO solution affects photodegradation efficiency due to the alteration of the surface charge of the TiO2 photocatalyst. Generally, TiO2 shows an amphoteric nature and its point of zero charge (pHpzc) is at pH 6.8.14 It is well-known that the MO dye is anionic in nature. In an acidic medium (pH < pHpzc), there is a positive charge on the surface of TiO2 (attributed H+ ions) and a negative charge on the MO dye. Therefore, the photocatalyst can be easily offered more surface for the adsorption of the MO dye due to the electrostatic interaction between them. In addition, MO is likely to change into a quinone form under the acidic condition, which is ionized.69 The quinone structure has more oxidation power over the azo structure due to the sulfonic groups (−SO3–) aiding in capturing hydrogen protons and enhancing the hydrophobicity of the photocatalyst surface. In this condition, an elevated concentration of H+ would facilitate the generation of reactive oxygen species. With the increase of acidity, the hydroxyl radicals generated in the solution would also increase, thereby improving the photocatalytic ability of the system. The acidic condition is preferential for the photodegradation process of MO catalyzed by the 5.0 wt % MoS2–TiO2 nanocomposite. In acidic media, at pH 4 and 5.8 led to elevated photodegradation efficiencies of 94.3 and 93%, respectively. On the other hand, at very low pH (below 4 pH), TiO2 has an elevated oxidizing activity but excess H+ can retard reaction rate. In strongly acidic conditions, the maximum active adsorption sites of TiO2 are reduced, resulting in the MO dye having a lower affinity to be adsorbed by TiO2.
Figure 14.
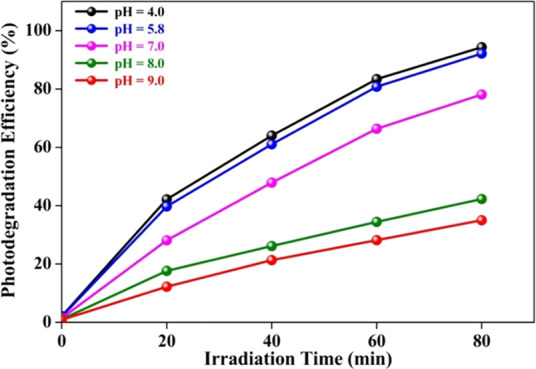
Effect of initial pH on MO degradation over a 5.0 wt % MoS2–TiO2 photocatalyst.
Also, a decrease in the photodegradation efficiency (78.09%) was detected under a neutral pH. Interestingly, the minimal photodegradation efficiency of MO (42.27 and 35.01%) is observed under an alkaline condition (pH 8 and 9, respectively). In the basic medium (pH > pHpzc), both surfaces of TiO2 (attributed OH– ions) and the MO dye are negatively charged. Therefore, the MO dye is difficult to be adsorbed onto the TiO2 surface due to the Coulombic repulsion, which prevents the formation of reactive oxygen species. In addition, MO is in the azo form in neutral and alkaline media.70 In this condition, the photogenerated holes formed on the heterostructures were easy to compound with OH– in the MO solution, which reduced the oxidative power of photogenerated reactive species, leading to the decline of the photodegradation efficiency.71
2.10.4. Determination of ROS Generated in the Photodegradation of MO over 5.0 wt % MoS2–TiO2 Nanocomposites
Functional scavenger compounds were added to the MO solution to determine the corresponding reactive oxygen species (ROS) during the photocatalytic degradation process with a catalyst dosage of (0.5 g/dm3) and an initial MO concentration of (20 mg/dm3) under UV–vis light irradiation. In these catalytic experiments, IPA, BQ, and EDTA were used to quench the photoexcited ·OH, O2·– and holes (h+) in the degradation reaction species. The degradation of MO reached 11.38 and 37.64% after the addition of BQ and IPA, respectively, whereas it is observed to be at 69.07% after the addition of EDTA (Figure 15). The results confirmed that ·OH and O2·– are active species in the catalytic reaction.
Figure 15.
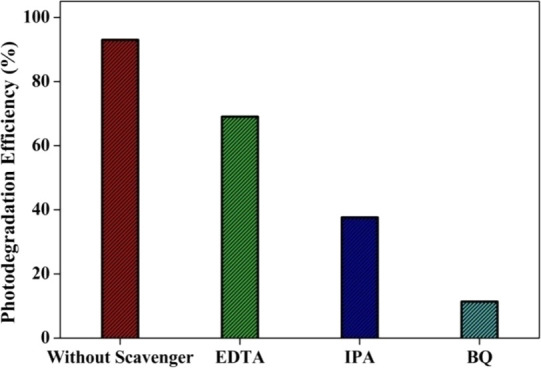
Inhibition of MO degradation over the 5.0 wt % MoS2–TiO2 nanocomposite with various active species scavengers
2.10.5. Recyclability Study of the 5.0 wt % MoS2–TiO2 Nanocomposite for MO Degradation
Figure 16 shows the recyclability study of the 5.0 wt % MoS2–TiO2 nanocomposite for MO degradation under identical experimental conditions to examine the stability and reusability of the photocatalyst.
Figure 16.
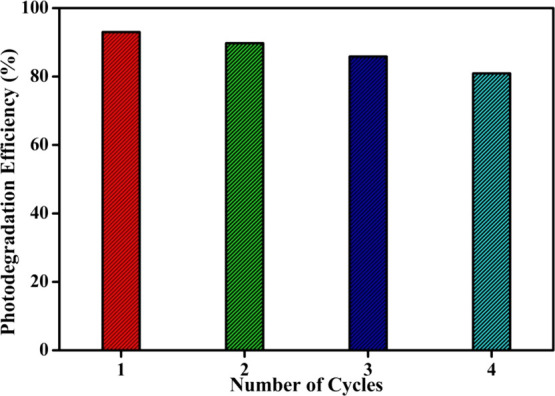
Recyclability study of the 5.0 wt % MoS2–TiO2 nanocomposite for MO degradation.
For this purpose, the photocatalyst used for the primary cycle is easily recovered through filtration. After four cycles, the photodegradation efficiency is reduced by only 12.08%. It is clear that the nanocomposite shows a stable performance on the photodegradation of MO, revealing the significant application value in ecological purification.
2.10.6. Plausible Mechanism for the Photocatalytic Degradation of MO over MoS2–TiO2 Nanocomposites
The plausible mechanism that is liable for the photodegradation of MO dye employing the MoS2–TiO2 nanocomposite under UV–vis light is suggested and demonstrated in Scheme 1. Under light irradiation, TiO2 absorbed the photons and generated electron–hole pairs. The photoinduced electrons and holes within the TiO2 particles either take part in redox reactions on the surface or recombine. The recombination process has faster kinetics than the redox reactions.72 On the whole, photogenerated electrons and holes are easy to recombine in pristine TiO2 without any cocatalyst loading, which resulted in low photocatalytic performance. Therefore, the recombination rate of photogenerated charge carriers is one of the key factors restricting the photocatalytic performance of TiO2-based photocatalysts.
Scheme 1. Plausible Mechanism for the Photodegradation of the MO Dye Employing MoS2–TiO2 Nanocomposite Under UV–Vis Light (λ = 365 nm).
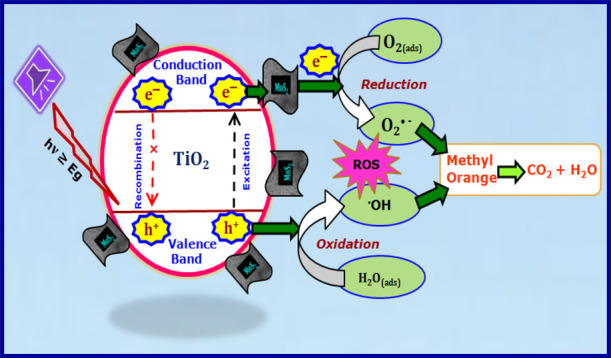
When the MoS2–TiO2 nanocomposite was irradiated by UV–vis light, MoS2 nanoflowers can accept electrons and provide active sites for the degradation of MO, due to its quantum-confinement effect.73 In the presence of MoS2, the photogenerated electrons in the conduction band of TiO2 could be easily transferred to the surface of MoS2 because of the intimate contact between them.74 Thus, the opportunity for the recombination of electron–hole pairs decreases greatly. The photogenerated electrons on the surface of MoS2 would react with O2 to form O2·–. Subsequently, they combine with H+ to produce H2O2 and finally form ·OH.75,76 Furthermore, these formed highly oxidative hydroxyl radicals (·OH) are responsible for the degradation of MO dye molecules.
Finally, we can conclude that there are two important aspects of MoS2 in the nanocomposite. Basically, it acts as an electron reservoir to trap electrons emitted from TiO2 NPs due to irradiation by UV–vis light, thus hindering electron–hole pair recombination. The other is to provide active sites to degrade MO and produce harmless products like CO2 and H2O. These two factors can elucidate the MoS2–TiO2 nanocomposite with a suitable composition to show enhanced photocatalytic activity for the photodegradation of MO as compared to pristine TiO2 alone.
3. Conclusions
Nanostructured TiO2 is a potential platform for the removal of organic contaminants, but it has few limitations. To overcome these limitations, we devised a promising strategy in the current work, mechanochemically synthesized hybrid heterostructures of MoS2 nanoflowers decorated on TiO2 and utilized as an efficient photocatalyst for MO degradation. MoS2-sensitized TiO2 nanocomposites revealed enormous potential in the photocatalytic degradation of MO under UV–vis light. The surface of TiO2 sensitized by MoS2 was comprehensively characterized by various sophisticated instruments. From XRD results, the optimized 5.0 wt % MoS2–TiO2 nanocomposite showcases the lower crystallite size of 14.79 nm than that of anatase TiO2 (20 nm). Here, MoS2-sensitized TiO2 heterostructures demonstrated a considerable enhancement in the photocatalytic property than pristine TiO2 due to the greater charge carrier-transport property, which helps to the formation of plenty of OH radicals to degrade MO entirely. The applications and physicochemical properties of sensitized TiO2 NPs are remarkably dependent on the amount of MoS2. The superior photodegradation efficiency of the MO was achieved by 5.0 wt % MoS2–TiO2 with 93% after UV–vis light irradiation for 80 min. According to the obtained results, the optimal loading amount was 5.0 wt % of the MoS2–TiO2 photocatalyst, which exhibited a 21% increment in photodegradation efficiency of MO as compared to pristine TiO2. From the pH study, it accomplished that the superior degradation effect observed at acidic pH. In summary, this study describes the superior photocatalytic activity of the 5.0 wt % MoS2–TiO2 nanocomposite, which is ascribed to the delayed recombination by efficient charge transfer, excellent surface area, and elevated content of surface oxygen vacancies. As a promising photocatalytic material, the MoS2-sensitized TiO2 will definitely get more consideration in the upcoming future.
4. Experimental Section
4.1. Materials
All analytical grade (AR) chemicals were utilized without any further purification for the synthesis of the photocatalysts. Titanium isopropoxide was obtained from Sigma-Aldrich (India), ethanol from Changshu Hongsheng Fine Chemical (China), and thiourea from S D Fine-Chem (India). Sodium molybdate and isopropanol were obtained from Thermo Fisher Scientific (India). Methyl orange was acquired from Molychem (India); p-benzoquinone was from Loba Chemie (India); and EDTA was from SRL chem (India).
4.2. Synthesis of TiO2 Nanopowder
According to our previously reported work, nanostructured TiO2 nanopowder was obtained from chemical bath residue after successful synthesis of thin films via the chemical bath deposition technique.14 In short, titanium isopropoxide (5 mL), isopropanol (10 mL), and ethanol (40 mL) were taken in a 100 mL beaker and then conducting or non conducting glass substrates were dipped in the bath solution. For the completion of deposition time, TiO2 films are directly deposited on the substrates. Afterward, the bath solution was constantly stirred and then the residue was collected from the chemical bath by decanting off the supernatant. The collected residue was dried out in the oven at 100 °C after washing with double distilled water and ethanol. Lastly, the obtained TiO2 nanopowder was annealed at 400 °C for 3 h and utilized for further work.
4.3. Hydrothermal Synthesis of MoS2 Nanoflowers
MoS2 nanoflowers were prepared by a simplistic hydrothermal route. In the typical synthesis process of MoS2, 1.21 g sodium molybdate (0.005 mol) and 1.56 g thiourea (0.02 mol) were mixed into 30 mL double distilled water. The resulting mixture was stirred constantly for 30 min and poured into 50 mL Teflon-lined stainless autoclave. Then, the autoclave was situated into a hot air oven at 200 °C for 24 h. Subsequently, the autoclave was allowed to cool and the obtained nanopowder was centrifuged multiple times with double distilled water and ethanol. Finally, the resultant black powder was kept to dry under a vacuum oven at 80 °C.
4.4. Surface Sensitization of Nanostructured TiO2 by MoS2 Nanoflowers
The surface sensitization of nanostructured TiO2 was carried out by using hydrothermally synthesized MoS2 via the mechanochemical method. The typical synthesis process is as follows: an appropriate amount of TiO2 nanopowder is mixed with a certain amount of MoS2 (2.5, 5.0 and 7.5 wt %) in a minute quantity of ethanol. The above mixture was ground constantly in a mortar and pestle for 2 h. At the completion of grinding, the obtained powder was rinsed with double distilled water and allowed to dry at 80 °C for 12 h. The sensitized material could be labeled as x wt % MoS2–TiO2 (x = 2.5, 5.0, and 7.5).
4.5. Characterization Techniques
The structural investigation of all samples was executed on an X-ray diffractometer (Ultima IV of Rigaku corporation diffractometer, Japan). To confirm the chemical structure of MoS2–TiO2 nanocomposites, Raman spectra were recorded between 50 and 900 cm–1 using micro-Raman spectroscopy (Monora 500i, ANDOR). An FT–IR spectrometer (4600, Jasco, Japan) was employed to study the interatomic bonding between photocatalysts scanned in the range of 4000–400 cm–1. Further confirmation of the elemental compositions and chemical states of Mo, S, Ti, and O elements in the 5.0 wt % MoS2–TiO2 nanocomposite was done using XPS analysis (Thermo Scientific, Multilab-2000). The microstructural investigations of pristine TiO2 as well as the 5.0 wt % MoS2–TiO2 nanocomposite were examined through TEM (JEOL, Japan). Also, for further confirmation, the microstructures and surface morphology of the photocatalysts were characterized by using SEM (Hitachi S-4700). The elemental distribution of the photocatalysts was resolute through an energy dispersive X-ray spectrometer (X Flash 6I30, Bruker). The band gap energy and optical properties of photocatalysts were studied through a UV–vis–NIR–DRS spectrophotometer (V-770, Jasco, Japan). The room temperature PL studies of photocatalysts were carried out in the 350–550 nm wavelength range via a spectrofluorometer (FP–8200, Jasco, Japan) at an excitation wavelength of 300 nm. The N2 adsorption–desorption isotherm curves of photocatalysts were obtained from BET surface area analysis (Quantachrome Nova Station A–v11.02 instrument, USA). In an ambient air atmosphere, TGA was carried out on an SDT Q600 V20.9 Build 20 instrument to examine thermal behavior of materials at a heating rate of 10 °C min–1.
4.6. Estimation of Photodegradation of MO
Consecutively, to estimate the photocatalytic activity, surface-sensitized TiO2 by MoS2 was employed with respect to MO degradation in an aqueous media under UV–vis light (365 nm). The entire degradation experiment was conducted at room temperature using a high-pressure mercury lamp (250 W, Philips HPL–N). Initially, to achieve adsorption–desorption equilibrium, the photocatalyst (0.5 g/dm3) was dispersed in the MO solution (100 mL, 20 mg L–1) with constant stirring for 30 min in the dark. Then, 3 mL of suspension was taken out after a considered time interval. At the same time, water continuously passed through the outer jacket of the reactor to maintain the temperature. A UV–vis–NIR spectrophotometer (UV–3600, Shimadzu) was used to acquire absorbance spectra to evaluate the degradation processes of MO on account of alter absorbance of the particular absorption peak at 465 nm. The photodegradation efficiency (η %) was calculated through the following eq 12.77
| 12 |
where A0 and At represent initial absorbance and absorbance after photodegradation of MO at particular time intervals, respectively.
Acknowledgments
One of the authors K.M.G. acknowledges to the Shivaji University, Kolhapur, for funding the research assistance under Research Strengthening Scheme (file no. SU/C & U.D. Section/87/1385 dated 28/03/2019). One of the authors S.W.L. acknowledges to the Korea Basic Institute (National Research Facilities and Equipment Center) grant funded by the Ministry of Education (2019R1A6C1010016) and Nano·Material Technology Development Program through the National Research Foundation of Korea (NRF) funded by the Ministry of Science, ICT and Future Planning (2009-0082580).
Author Contributions
The manuscript was written through the contributions of all authors. All authors have given approval to the final version of the manuscript.
The authors declare no competing financial interest.
References
- Wang Z.; Chu Z.; Dong C.; Wang Z.; Yao S.; Gao H.; Liu Z.; Liu Y.; Yang B.; Zhang H. Ultrathin BiOX (X = Cl, Br, I) nanosheets with exposed {001} facets for photocatalysis. ACS Appl. Nano Mater. 2020, 3, 1981–1991. 10.1021/acsanm.0c00022. [DOI] [Google Scholar]
- Atchudan R.; Edison T. N. J. I.; Perumal S.; Shanmugam M.; Lee Y. R. Direct solvothermal synthesis of zinc oxide nanoparticle decorated graphene oxide nanocomposite for efficient photodegradation of azo–dyes. J. Photochem. Photobiol. A. 2017, 337, 100–111. 10.1016/j.jphotochem.2017.01.021. [DOI] [Google Scholar]
- Rasheed T.; Bilal M.; Nabeel F.; Adeel M.; Iqbal H. M. N. Environmentally–related contaminants of high concern: potential sources and analytical modalities for detection, quantification, and treatment. Environ. Int. 2019, 122, 52–66. 10.1016/j.envint.2018.11.038. [DOI] [PubMed] [Google Scholar]
- Edison T. N. J. I.; Atchudan R.; Sethuraman M. G.; Lee Y. R. Reductive–degradation of carcinogenic azo dyes using Anacardium occidentale testa derived silver nanoparticles. J. Photochem. Photobiol. B 2016, 162, 604–610. 10.1016/j.jphotobiol.2016.07.040. [DOI] [PubMed] [Google Scholar]
- Singh A.; Khare P.; Verma S.; Bhati A.; Sonker A. K.; Tripathi K. M.; Sonkar S. K. Pollutant soot for pollutant dye degradation: soluble graphene nanosheets for visible light induced photodegradation of methylene blue. ACS Sustainable Chem. Eng. 2017, 5, 8860–8869. 10.1021/acssuschemeng.7b01645. [DOI] [Google Scholar]
- Anwer H.; Mahmood A.; Lee J.; Kim K.–. H.; Park J.–. W.; Yip A. C. K. Photocatalysts for degradation of dyes in industrial effluents: opportunities and challenges. Nano Res. 2019, 12, 955–972. . [DOI] [Google Scholar]
- Obregon S.; Amor G.; Vazquez A. Electrophoretic deposition of photocatalytic materials. Adv. Colloid Interface Sci. 2019, 269, 236–255. 10.1016/j.cis.2019.05.003. [DOI] [PubMed] [Google Scholar]
- Chatterjee D.; Dasgupta S. Visible light induced photocatalytic degradation of organic pollutants. J. Photochem. Photobiol. C 2005, 6, 186–205. 10.1016/j.jphotochemrev.2005.09.001. [DOI] [Google Scholar]
- Yang J.; Wang D.; Han H.; Li C. Roles of cocatalysts in photocatalysis and photoelectrocatalysis. Acc. Chem. Res. 2013, 46, 1900–1909. 10.1021/ar300227e. [DOI] [PubMed] [Google Scholar]
- Karthikeyan C.; Arunachalam P.; Ramachandran K.; Al–Mayouf A. M.; Karuppuchamy S. Recent advances in semiconductor metal oxides with enhanced methods for solar photocatalytic applications. J. Alloys Compd. 2020, 828, 15428. [Google Scholar]
- Gnanasekaran L.; Hemamalini R.; Saravanan R.; Ravichandran K.; Gracia F.; Agarwal S.; Gupta V. K. Synthesis and characterization of metal oxides (CeO2, CuO, NiO, Mn3O4, SnO2 and ZnO) nanoparticles as photo catalysts for degradation of textile dyes. J. Photochem. Photobiol. B, Biol. 2017, 173, 43–49. 10.1016/j.jphotobiol.2017.05.027. [DOI] [PubMed] [Google Scholar]
- Ibhadon A.; Fitzpatrick P. Heterogeneous photocatalysis: recent advances and applications. Catalysts 2013, 3, 189–218. 10.3390/catal3010189. [DOI] [Google Scholar]
- Jing Y.–. Q.; Gui C.–. X.; Qu J.; Hao S.–. M.; Wang Q.–. Q.; Yu Z.–. Z. Silver silicate@carbon nanotube nanocomposites for enhanced visible light photodegradation performance. ACS Sustainable Chem. Eng. 2017, 5, 3641–3649. 10.1021/acssuschemeng.6b02650. [DOI] [Google Scholar]
- Kite S. V.; Sathe D. J.; Kadam A. N.; Chavan S. S.; Garadkar K. M. Highly efficient photodegradation of 4–nitrophenol over the nano–TiO2 obtained from chemical bath deposition technique. Res. Chem. Intermed. 2020, 46, 1255–1282. . [DOI] [Google Scholar]
- Nam Y.; Lim J. H.; Ko K. C.; Lee J. Y. Photocatalytic activity of TiO2 nanoparticles: a theoretical aspect. Mater. Chem. A 2019, 7, 13833–13859. 10.1039/C9TA03385H. [DOI] [Google Scholar]
- Atchudan R.; Edison T. N. J. I.; Perumal S.; Karthikeyan D.; Lee Y. R. Effective photocatalytic degradation of anthropogenic dyes using graphene oxide grafting titanium dioxide nanoparticles under UV–light irradiation. J. Photochem. Photobiol. A. 2017, 333, 92–104. 10.1016/j.jphotochem.2016.10.021. [DOI] [Google Scholar]
- Kang X.; Liu S.; Dai Z.; He Y.; Song X.; Tan Z. Titanium dioxide: from engineering to applications. Catalysts 2019, 9, 1–32. 10.3390/catal9020191. [DOI] [Google Scholar]
- Lee K.; Yoon H.; Ahn C.; Park J.; Jeon S. Strategies to improve the photocatalytic activity of TiO2:3D nanostructuring and heterostructuring with graphitic carbon nanomaterials. Nanoscale 2019, 11, 7025–7040. 10.1039/C9NR01260E. [DOI] [PubMed] [Google Scholar]
- Atchudan R.; Edison T. N. J. I.; Perumal S.; Vinodh R.; Lee Y. R. In–situ green synthesis of nitrogen–doped carbon dots for bioimaging and TiO2 nanoparticles@nitrogen–doped carbon composite for photocatalytic degradation of organic pollutants. J. Alloys Compd. 2018, 766, 12–24. 10.1016/j.jallcom.2018.06.272. [DOI] [Google Scholar]
- Bai S.; Zhang N.; Gao C.; Xiong Y. Defect engineering in photocatalytic materials. Nano Energy 2018, 53, 296–336. 10.1016/j.nanoen.2018.08.058. [DOI] [Google Scholar]
- Mittal A.; Mari B.; Sharma S.; Kumari V.; Maken S.; Kumari K.; Kumar N. Non–metal modified TiO2: a step towards visible light photocatalysis. J. Mater. Sci.: Mater. Electron. 2019, 30, 3186–3207. . [DOI] [Google Scholar]
- Ajmal A.; Majeed I.; Malik R. N.; Idriss H.; Nadeem M. A. Principles and mechanisms of photocatalytic dye degradation on TiO2 based photocatalysts: a comparative overview. RSC Adv. 2014, 4, 37003–37026. 10.1039/C4RA06658H. [DOI] [Google Scholar]
- Chen H.; Wang L.; Wang L. Nanostructure sensitization of transition metal oxides for visible–light photocatalysis. Beilstein J. Nanotechnol. 2014, 5, 696–710. 10.3762/bjnano.5.82. [DOI] [PMC free article] [PubMed] [Google Scholar]
- Pan X.; Yang M.–. Q.; Fu X.; Zhang N.; Xu Y.–. J. Defective TiO2 with oxygen vacancies: synthesis, properties and photocatalytic applications. Nanoscale 2013, 5, 3601–3614. 10.1039/c3nr00476g. [DOI] [PubMed] [Google Scholar]
- Miditana S. R.; Tirukkovalluri S. R.; Raju I. M.; Alim S. A.; Jaishree G.; Chippada M. L. V.; Chippada P. Gemini surfactant assisted synthesis of mesoporous Mn/Mg bimetal doped TiO2 nanomaterial: characterization and photocatalytic activity studies under visible light irradiation. Sustain. Environ. Res. 2021, 31, 1–12. . [DOI] [Google Scholar]
- Raju I. M.; Rao T. S.; Lakshmi K. V.; Chandra M. R.; Padmaja J. S.; Divya G. Poly 3–Thenoic acid sensitized, Copper doped anatase/brookite TiO2 nanohybrids for enhanced photocatalytic degradation of an organophosphorus pesticide. J. Environ. Chem. Eng. 2019, 7, 103211. 10.1016/j.jece.2019.103211. [DOI] [Google Scholar]
- Wang Q. H.; Kalantar–Zadeh K.; Kis A.; Coleman J. N.; Strano M. S. Electronics and optoelectronics of two–dimensional transition metal dichalcogenides. Nat. Nanotechnol. 2012, 7, 699–712. 10.1038/nnano.2012.193. [DOI] [PubMed] [Google Scholar]
- Butler S. Z.; Hollen S. M.; Cao L.; Cui Y.; Gupta J. A.; Gutierrez H. R.; Heinz T. F.; Hong S. S.; Huang J.; Ismach A. F.; Johnston–Halperin E.; Kuno M.; Plashnitsa V. V.; Robinson R. D.; Ruoff R. S.; Salahuddin S.; Shan J.; Shi L.; Spencer M. G.; Terrones M.; Windl W.; Goldberger J. E. Progress, challenges, and opportunities in two–dimensional materials beyond graphene. ACS Nano 2013, 7, 2898–2926. 10.1021/nn400280c. [DOI] [PubMed] [Google Scholar]
- Hea Z.; Que W. Molybdenum disulfide nanomaterials: structures, properties, synthesis and recent progress on hydrogen evolution reaction. Appl. Mater. Today 2016, 3, 23–56. 10.1016/j.apmt.2016.02.001. [DOI] [Google Scholar]
- Li X.; Zhu H. Two–dimensional MoS2: properties, preparation, and applications. J. Materiomics 2015, 1, 33–44. 10.1016/j.jmat.2015.03.003. [DOI] [Google Scholar]
- Menon H.; Gopakumar G.; Nair V. S.; Nair S. V.; Shanmugam M. 2D–layered MoS2–incorporated TiO2–nanofiber– based dye–sensitized solar cells. Chem. Select 2018, 3, 5801–5807. 10.1002/slct.201702953. [DOI] [Google Scholar]
- Wang Y.; Li L.; Huang X.; Li Q.; Li G. New insights into fluorinated TiO2 (brookite, anatase and rutile) nanoparticles as efficient photocatalytic redox catalysts. RSC Adv. 2015, 5, 34302–34313. 10.1039/C4RA17076H. [DOI] [Google Scholar]
- Dastan D.; Chaure N.; Kartha M. Surfactants assisted solvothermal derived titania nanoparticles: synthesis and simulation. J. Mater. Sci.: Mater. Electron. 2017, 28, 7784–7796. . [DOI] [Google Scholar]
- Chen Y.; Tan L.; Sun M.; Lu C.; Kou J.; Xu Z. Enhancement of photocatalytic performance of TaON by combining it with noble–metal–free MoS2 cocatalysts. J. Mater. Sci. 2019, 54, 5321–5330. . [DOI] [Google Scholar]
- Gupta J.; Ahmed A. S. Interfacial exchange coupling and defects driven magnetic and optical properties of Co3O4–NiO nanocomposites. Phys. B 2020, 599, 412383. 10.1016/j.physb.2020.412383. [DOI] [Google Scholar]
- Pourrahimi A. M.; Liu D.; Strom V.; Hedenqvist M. S.; Olsson R. T.; Gedde U. W. Heat treatment of ZnO nanoparticles: new methods to achieve high–purity nanoparticles for high voltage applications. J. Mater. Chem. A 2015, 3, 17190–17200. 10.1039/C5TA03120F. [DOI] [Google Scholar]
- Wang D.; Xu Y.; Sun F.; Zhang Q.; Wang P.; Wang X. Enhanced photocatalytic activity of TiO2 under sunlight by MoS2 nanodots modification. Appl. Surf. Sci. 2016, 377, 221–227. 10.1016/j.apsusc.2016.03.146. [DOI] [Google Scholar]
- Zhou X.–D.; Huebner W. Size–induced lattice relaxation in CeO2 nanoparticles. Appl. Phys. Lett. 2001, 79, 3512–3514. 10.1063/1.1419235. [DOI] [Google Scholar]
- Khatun N.; Tiwari S.; Lal J.; Tseng C.–. M.; Liu S. W.; Biring S.; Sen S. Stabilization of anatase phase by uncompensated Ga–V co–doping in TiO2: A structural phase transition, grain growth and optical property study. Ceram. Int. 2018, 44, 22445–22455. 10.1016/j.ceramint.2018.09.012. [DOI] [Google Scholar]
- Kumar S.; Kumar A.; Navakoteswara Rao V.; Kumar A.; Shankar M. V.; Krishnan V. Defect–rich MoS2 ultrathin nanosheets–coated nitrogen–doped ZnO nanorod heterostructures: an insight into in–situ–generated ZnS for enhanced photocatalytic hydrogen evolution. ACS Appl. Energy Mater. 2019, 2, 5622–5634. 10.1021/acsaem.9b00790. [DOI] [Google Scholar]
- Vinodhini J.; Mayandi J.; Atchudan R.; Jayabal P.; Sasirekha V.; Pearce J. M. Effect of microwave power irradiation on TiO2 nano–structures and binder free paste screen printed dye sensitized solar cells. Ceram. Int. 2019, 45, 4667–4673. 10.1016/j.ceramint.2018.11.157. [DOI] [Google Scholar]
- Zhou K.–. G.; Withers F.; Cao Y.; Hu S.; Yu G.; Casiraghi C. Raman modes of MoS2 used as fingerprint of van der Waals interactions in 2–D crystal–based heterostructures. ACS Nano 2014, 8, 9914–9924. 10.1021/nn5042703. [DOI] [PubMed] [Google Scholar]
- Chen S.–Y.; Zheng C.; Fuhrer M. S.; Yan J. Helicity resolved Raman scattering of MoS2, MoSe2, WS2 and WSe2 atomic layers. Nano Lett. 2015, 15, 2526–2532. 10.1021/acs.nanolett.5b00092. [DOI] [PubMed] [Google Scholar]
- Praveen P.; Viruthagiri G.; Mugundan S.; Shanmugam N. Structural, optical and morphological analyses of pristine titanium di–oxide nanoparticles–synthesized via sol–gel route. Spectrochim. Acta A. 2014, 117, 622–629. 10.1016/j.saa.2013.09.037. [DOI] [PubMed] [Google Scholar]
- Sood S.; Mehta S. K.; Umar A.; Kansal S. K. The visible light–driven photocatalytic degradation of Alizarin red S using bi–doped TiO2 nanoparticles. New J. Chem. 2014, 38, 3127–3136. 10.1039/C4NJ00179F. [DOI] [Google Scholar]
- Ali G. A. M.; Thalji M. R.; Soh W. C.; Algarni H.; Chong K. F. One–step electrochemical synthesis of MoS2/graphene composite for supercapacitor application. J. Solid State Electrochem. 2020, 24, 25–34. . [DOI] [Google Scholar]
- Lalithambika K. C.; Shanmugapriya K.; Sriram S. Photocatalytic activity of MoS2 nanoparticles: an experimental and DFT analysis. Appl. Phys. A: Mater. Sci. Process. 2019, 125, 1–8. . [DOI] [Google Scholar]
- Koventhan C.; Vinothkumar V.; Chen S.; Chen T.; Sangili A.; Pandi K.; Sethupathi V. Efficient hydrothermal synthesis of flake–like molybdenum disulfide for selective electrochemical detection of metol in water real samples. Int. J. Electrochem. Sci. 2020, 15, 7390–7406. [Google Scholar]
- Hu J.; Li Y.; Zhang S.; Zhang Q.; Liu Y.; Zuo J.; Li Q.; Peng F. MoS2 supported on hydrogenated TiO2 heterostructure film as photocathode for photoelectrochemical hydrogen production. Int. J. Hydrogen Energy 2019, 44, 31008–31019. 10.1016/j.ijhydene.2019.09.238. [DOI] [Google Scholar]
- Bhargava R.; Shah J.; Khan S.; Kotnala R. K. Hydroelectric cell based on cerium oxide–decorated reduced graphene oxide (CeO2–rG) nanocomposite generates green electricity by room temperature water splitting. Energy Fuels 2020, 34, 13067–13078. 10.1021/acs.energyfuels.0c02192. [DOI] [Google Scholar]
- Hou Y.; Wen Z.; Cui S.; Guo X.; Chen J. Constructing 2D porous graphitic C3N4 nanosheets/nitrogen–doped graphene/layered MoS2 ternary nanojunction with enhanced photoelectrochemical activity. Adv. Mater. 2013, 25, 6291–6297. 10.1002/adma.201303116. [DOI] [PubMed] [Google Scholar]
- Wu W.; Xue X.; Jiang X.; Zhang Y.; Wu Y.; Pan C. Lattice distortion mechanism study of TiO2 nanoparticles during photocatalysis degradation and reactivation. AIP Adv. 2015, 5, 057105 10.1063/1.4919811. [DOI] [Google Scholar]
- Tripathi A. K.; Mathpal M. C.; Kumar P.; Singh M. K.; Mishra S. K.; Srivastava R. K.; Chung J. S.; Verma G.; Ahmad M. M.; Agarwal A. Synthesis based structural and optical behavior of anatase TiO2 nanoparticles. Mater. Sci. Semicond. Process. 2014, 23, 136–143. 10.1016/j.mssp.2014.02.041. [DOI] [Google Scholar]
- Mathpal M. C.; Tripathi A. K.; Singh M. K.; Gairola S. P.; Pandey S. N.; Agarwal A. Effect of annealing temperature on Raman spectra of TiO2 nanoparticles. Chem. Phys. Lett. 2013, 555, 182–186. 10.1016/j.cplett.2012.10.082. [DOI] [Google Scholar]
- Wang H.; Yi G.; Tan M.; Zu X.; Luo H.; Jiang X. Initial reactant controlled synthesis of double layered TiO2 nanostructures and characterization of its spectra of absorption and photoluminescence. Mater. Lett. 2015, 148, 5–8. 10.1016/j.matlet.2015.02.011. [DOI] [Google Scholar]
- He S.; Zhang Y.; Ren J.; Wang B.; Zhang Z.; Zhang M. Facile synthesis of TiO2@MoS2 hollow microtubes for removal of organic pollutants in water treatment. Colloids Surf. A Physicochem. Eng. Asp. 2020, 600, 124900. 10.1016/j.colsurfa.2020.124900. [DOI] [Google Scholar]
- Hu K.–. H.; Meng M. Degradation of Malachite green on MoS2/TiO2 nanocomposite. Asian J. Chem. 2013, 25, 5827–5829. 10.14233/ajchem.2013.OH102. [DOI] [Google Scholar]
- Pandey A.; Dutta S.; Kumar A.; Raman R.; Kapoor A. K.; Muralidhran R. Structural and optical properties of bulk MoS2 for 2D layer growth. Adv. Mater. Lett. 2016, 7, 777–782. 10.5185/amlett.2016.6364. [DOI] [Google Scholar]
- Wang D.; Zhou K.; Yang W.; Xing W.; Hu Y.; Gong X. Surface modification of graphene with layered molybdenum disulfide and their synergistic reinforcement on reducing fire hazards of epoxy resins. Ind. Eng. Chem. Res. 2013, 52, 17882–17890. 10.1021/ie402441g. [DOI] [Google Scholar]
- Peng W.; Li X. Synthesis of MoS2/g–C3N4 as a solar light–responsive photocatalyst for organic degradation. Catal. Commun. 2014, 49, 63–67. 10.1016/j.catcom.2014.02.008. [DOI] [Google Scholar]
- Lin C.; Gao Y.; Zhang J.; Xue D.; Fang H.; Tian J.; Zhou C.; Zhang C.; Li Y.; Li H. GO/TiO2 composites as a highly active photocatalyst for the degradation of methyl orange. J. Mater. Res. 2020, 35, 1307–1315. 10.1557/jmr.2020.41. [DOI] [Google Scholar]
- Li J.; Liu E.; Ma Y.; Hu X.; Wan J.; Sun L.; Fan J. Synthesis of MoS2/g–C3N4 nanosheets as 2D heterojunction photocatalysts with enhanced visible light activity. Appl. Surf. Sci. 2016, 364, 694–702. 10.1016/j.apsusc.2015.12.236. [DOI] [Google Scholar]
- Zhao Z.; Lei Y.; Liu W.; Fan J.; Xue D.; Xue Y.; Yin S. Fly ash cenospheres as multifunctional supports of g–C3N4/N–TiO2 with enhanced visible–light photocatalytic activity and adsorption. Adv. Powder Technol. 2017, 28, 3233–3240. 10.1016/j.apt.2017.09.035. [DOI] [Google Scholar]
- Altin I.; Sokmen M.; Biyiklioglu Z. Sol gel synthesis of cobalt doped TiO2 and its dye sensitization for efficient pollutant removal. Mater. Sci. Semicond. Process. 2016, 45, 36–44. 10.1016/j.mssp.2016.01.016. [DOI] [Google Scholar]
- Hu K. H.; Hu X. G.; Xu Y. F.; Sun J. D. Synthesis of nano–MoS2/TiO2 composite and its catalytic degradation effect on methyl orange. J. Mater. Sci. 2010, 45, 2640–2648. . [DOI] [Google Scholar]
- Liu X.; Xing Z.; Zhang H.; Wang W.; Zhang Y.; Li Z.; Wu X.; Yu X.; Zhou W. Fabrication of 3D mesoporous black TiO2/MoS2/TiO2 nanosheets for visible–light–driven photocatalysis. ChemSusChem 2016, 9, 1118–1124. 10.1002/cssc.201600170. [DOI] [PubMed] [Google Scholar]
- Liu X.; Xing Z.; Zhang Y.; Li Z.; Wu X.; Tan S.; Yu X.; Zhu Q.; Zhou W. Fabrication of 3D flower–like black N–TiO2–x@MoS2 for unprecedented–high visible–light–driven photocatalytic performance. Appl. Catal. B. 2017, 201, 119–127. 10.1016/j.apcatb.2016.08.031. [DOI] [Google Scholar]
- Lin X.; Wang X.; Zhou Q.; Wen C.; Su S.; Xiang J.; Cheng P.; Hu X.; Li Y.; Wang X.; Gao X.; Nozel R.; Zhou G.; Zhang Z.; Liu J. Magnetically recyclable MoS2/Fe3O4 hybrid composite as visible light responsive photocatalyst with enhanced photocatalytic performance. ACS Sustainable Chem. Eng. 2019, 7, 1673–1682. 10.1021/acssuschemeng.8b05440. [DOI] [Google Scholar]
- Chen S.; Zhang J.; Zhang C.; Yue Q.; Li Y.; Li C. Equilibrium and kinetic studies of methyl orange and methyl violet adsorption on activated carbon derived from Phragmites australis. Desalination 2010, 252, 149–156. 10.1016/j.desal.2009.10.010. [DOI] [Google Scholar]
- Zulfajri M.; Dayalan S.; Li W.; Chang C.; Chang Y.; Huang G. G. Nitrogen–doped carbon dots from averrhoa carambola fruit extract as a fluorescent probe for methyl orange. Sensors 2019, 19, 5008. 10.3390/s19225008. [DOI] [PMC free article] [PubMed] [Google Scholar]
- Wang J.; Guo B.; Zhang X.; Zhang Z.; Han J.; Wu J. Sonocatalytic degradation of methyl orange in the presence of TiO2 catalysts and catalytic activity comparison of rutile and anatase. Ultrason. Sonochem. 2005, 12, 331–337. 10.1016/j.ultsonch.2004.05.002. [DOI] [PubMed] [Google Scholar]
- Zhu Y.; Ling Q.; Liu Y.; Wang H.; Zhu Y. Photocatalytic H2 evolution on MoS2–TiO2 catalysts synthesized via mechanochemistry. Phys. Chem. Chem. Phys. 2015, 17, 933–940. 10.1039/C4CP04628E. [DOI] [PubMed] [Google Scholar]
- Xiang Q.; Yu J.; Jaroniec M. Synergetic effect of MoS2 and graphene as cocatalysts for enhanced photocatalytic H2 production activity of TiO2 nanoparticles. J. Am. Chem. Soc. 2012, 134, 6575–6578. 10.1021/ja302846n. [DOI] [PubMed] [Google Scholar]
- Zhang J.; Huang L.; Lu Z.; Jin Z.; Wang X.; Xu G.; Zhang E.; Wang H.; Kong Z.; Xi J.; Ji Z. Crystal face regulating MoS2/TiO2 (001) heterostructure for high photocatalytic activity. J. Alloys Compd. 2016, 688, 840–848. 10.1016/j.jallcom.2016.07.263. [DOI] [Google Scholar]
- Vattikuti S. V. P.; Byon C.; Reddy C. V. ZrO2/MoS2 heterojunction photocatalysts for efficient photocatalytic degradation of methyl orange. Electron. Mater. Lett. 2016, 12, 812–823. . [DOI] [Google Scholar]
- Zhang X.; Shao C.; Li X.; Miao F.; Wang K.; Lu N.; Liu Y. 3D MoS2 nanosheet/TiO2 nanofiber heterostructures with enhanced photocatalytic activity under UV irradiation. J. Alloys Compd. 2016, 686, 137–144. 10.1016/j.jallcom.2016.05.336. [DOI] [Google Scholar]
- Edison T. N. J. I.; Atchudan R.; Karthik N.; Balaji J.; Xiong D.; Lee Y. R. Catalytic degradation of organic dyes using green synthesized N–doped carbon supported silver nanoparticles. Fuel 2020, 280, 118682. 10.1016/j.fuel.2020.118682. [DOI] [Google Scholar]


