Abstract
Background
MYB transcription factors are a kind of DNA binding protein that can specifically interact with the promoter region. Members of MYB TFs are widely involved in plant growth and development, secondary metabolism, stress response, and hormone signal transduction. However, there is no report of comprehensive bioinformatics analysis on the MYB family of Casuarina equisetifolia.
Results
In this study, bioinformatics methods were used to screen out 182 MYB transcription factors from the Casuarina equisetifolia genome database, including 69 1R-MYB, 107 R2R3-MYB, 4 R1R2R3-MYB, and 2 4R-MYB. The C. equisetifolia R2R3-MYB genes were divided into 29 groups based on the phylogenetic topology and the classification of the MYB superfamily in Arabidopsis thaliana, while the remaining MYB genes (1R-MYB, R1R2R3-MYB, and 4R-MYB) was divided into 19 groups. Moreover, the conserved motif and gene structure analysis shown that the members of the CeqMYBs were divided into the same subgroups with mostly similar gene structures. In addition, many conserved amino acids in the R2 and R3 domains of CeqMYBs by WebLogo analysis, especially tryptophan residues (W), with 3 conserved W in R2 repeat and 2 conserved W in R3 repeat. Combining promoter and GO annotation analysis, speculated on the various biological functions of CeqMYBs, thus 32 MYB genes were selected to further explore its response to salt stress by using qPCR analysis technique. Most CeqMYB genes were differentially regulated following multiple salt treatments.
Conclusions
Seven genes (CeqMYB164, CeqMYB4, CeqMYB53, CeqMYB32, CeqMYB114, CeqMYB71 and CeqMYB177) were assigned to the “response to salt stress” by GO annotation. Among them, the expression level of CeqMYB4 was up-regulated under various salt treatments, indicating CeqMYB4 might participated in the response to salt stress. Our results provide important information for the biological function of C. equisetifolia, as well as offer candidate genes for further study of salt stress mechanism.
Supplementary Information
The online version contains supplementary material available at 10.1186/s12870-021-03083-6.
Keywords: Casuarina equisetifolia, MYB transcription factor, GO annotation analysis, Salt stress
Background
MYB (v-myb avian myeloblastosis viral oncogene homolog) transcription factor (TF) family is one of the largest transcription factors in plants and gets its name because its structure has a conserved DNA binding region, known as MYB domain. The N-terminal regions of the MYB transcription factor domain are highly conserved, and the domain consists of 1–4 serial and nonredundant imperfect sequence repeats (R1, R2, R3 and R4). Each repeat includes about 50 amino acids, containing a series of highly conserved amino acid residues and interval sequences, wherein the amino acid residues participate in the binding process with DNA in the form of helix-turn-helix (HTH) [1, 2]. MYB proteins can be divided into different classes according to the number of repeats: 1R-MYB (one repeats), R2R3-MYB (two repeats), R1R2R3-MYB (three repeats), and 4R-MYB (four repeats) [3, 4].
As regulatory protein, MYB TFs play an important role in plant growth and development. In 1987, Paz-Ares et al. identified the first plant MYB gene in maize, and the research showed that it was related to anthocyanin synthesis, and named it ZmMYBC1 [5]. Since then, the MYB gene had been identified and isolated in many species. Among them, R2R3-MYB TFs had been certified to be widely involved in the regulation of plant secondary metabolism, and acted a key role in the regulation of plant cell differentiation and organ formation [4, 6, 7]. Overexpression of MYB6 in transgenic poplar resulted in significantly increased anthocyanin and procyanidins accumulation, but inhibited the development of secondary cell walls [8]. And Mu et al. found that R2R3 TF AtMYB59 could regulate the cell cycle and root growth of Arabidopsis thaliana [9] and JcMYB1 (R2R3-MYB) played an important role in the abiotic stress response [10]. In addition, MYB30 in defense reaction was important for the regulation of root growth, and LcMYB2 promoted seed germination and root growth under drought stress [11]. It was found that 3R type MYB MYBL2 not only inhibited trichome development, but also inhibited flavonoid biosynthetic [12, 13], and 3R type MYB PhMYBx down-regulated anthocyanin synthesis [14, 15]. Previous study had found that the expression of AtMYB2 was up-regulated in late plant development and participated in the regulation of whole plant senescence [16].
MYB family genes are also widely involved in plant responses to hormones and environmental factors, and play an important regulatory role in plant responses to stress. For example, the R2R2-MYB TF AtMYB41 could not only affect cell wall development, but also respond to ABA, drought, and salt stress [17]. Previous studies showed that AtMYB96 enhanced the resistance of A. thaliana to low temperature by promoting the expression of CBFs [18], while AtMYB14 and AtMYB15 participated in low-temperature response by negatively regulating the expression of CBFs [19, 20]. What’s more, AtMYB60 in A. thaliana had been shown to be involved in drought tolerance stress in plants [21]. Recently, ZmMYB3R and GmMYB118 were found that could improve tolerance to drought and salt stress in transgenic plants [22, 23]. Additionally, AtMYB2, AtMYB44 and AtMYB74 enhanced the tolerance of A. thaliana to salt stress [24–26], while AtMYB73 played a negative role in plant salt stress resistance [27]. Furthermore, TaMYB73, StMYB30 and GhMYB73 were reported to enhance salt stress tolerance in transgenic plants [28–30]. In transgenic tomato plants, SlMYB102 increased the salt tolerance by regulating Na+-K+ homeostasis and ROS balance [31]. Although most MYB genes in response to salt stress belonged to R2R3 type, a few 3R-MYB genes (including OsMYB3R-2 and TaMYB3R1) were involved in the regulation of plant salt stress [32, 33].
The Casuarinaceae is a relatively special family of angiosperms, and is relatively distantly related to other plants [34]. C. equisetifolia is widely cultivated in tropical and subtropical regions and have many uses. It is suitable for coastal windbreak and sand fixation, saline-alkali land improvement and afforestation in arid areas. It can also fix nitrogen and provide wood and fuelwood, and is applied in agroforestry [35]. In addition, Casuarina is one of the few plants that thrive on coastal beaches because of its salt resistance and the flexibility of its branches that can withstand typhoons. The availability of the complete Casuarina sequence [36] combined with bioinformatics methods provides an opportunity to conduct a comprehensive, genome-wide analysis of C. equisetifolia MYB genes.
The MYB gene family has been extensively studied in monocot and dicot plant. However, current basic knowledge of MYB proteins in C. equisetifolia is still limited. In present study, a total of 182 MYB genes were identified using the known MYB gene sequences from A. thaliana genome. Furthermore, the physical position, phylogenetic relationships, conserved motifs and exon-intron structure were performed. We further analyzed selective pressure, cis-acting element and gene ontology of these genes. Finally, the expression levels of selected CeqMYB genes in roots and shoots under different salt concentrations and treatment times were investigated by using RNA-seq data and qRT-PCR. Based on current data, this is the first report on genome-wide gene family identification in C. equisetifolia. Therefore, the present study provides a starting point to explore the functions of MYB genes in C. equisetifolia, and it also helps to select candidate genes for genetic engineering in C. equisetifolia breeding.
Results
Identification of MYB genes in C. equisetifolia
The candidate genes with typical MYB or MYB-like domains were preliminarily screened from Casuarina genomic database according to the Hidden Markov Model (HMM) profile of the MYB domain. A total of 182 MYB genes were identified in C. equisetifolia after removing redundant repetitive sequences. Based on the order of gene identifier, CeqMYB genes were named CeqMYB1 to CeqMYB182. The lengths of the protein sequences of CeqMYB range from 104 to 1072 amino acids, and molecular weight vary from 11.08 kDa (CeqMYB153) to 117.93 kDa (CeqMYB158). Moreover, the theoretical isoelectric point (pI) ranged from 4.06 to 10.65. Some other parameters, such as scaffold position, open reading frame (ORF) length and number of domains, were detailed in the Table S1. The predicted subcellular localization data (Table S2) showed that most CeqMYB proteins were predicted to be expressed in the nucleus, while some were localized to chloroplasts (CeqMYB41, CeqMYB114 and CeqMYB148), mitochondria (CeqMYB37), and cytoplasm (CeqMYB5 and CeqMYB23).
Phylogenetic trees and group classification of CeqMYB genes
A total of 69 1R-MYB proteins, 107 R2R3-MYB proteins, four R1R2R3-MYB proteins, and two 4R-MYB proteins were identified in C. equisetifolia (Table S1). Based on the alignment, two phylogenetic trees were constructed using MYB proteins in A. thaliana and C. equisetifolia (Figs. 1A and Fig. 2). The number distribution of MYB gene in C. equisetifolia was consistent with that in A. thaliana (Fig. 1B). R2R3-MYB protein was the largest subfamily, while the number of 4R-MYB subfamily was the smallest.
Fig. 1.
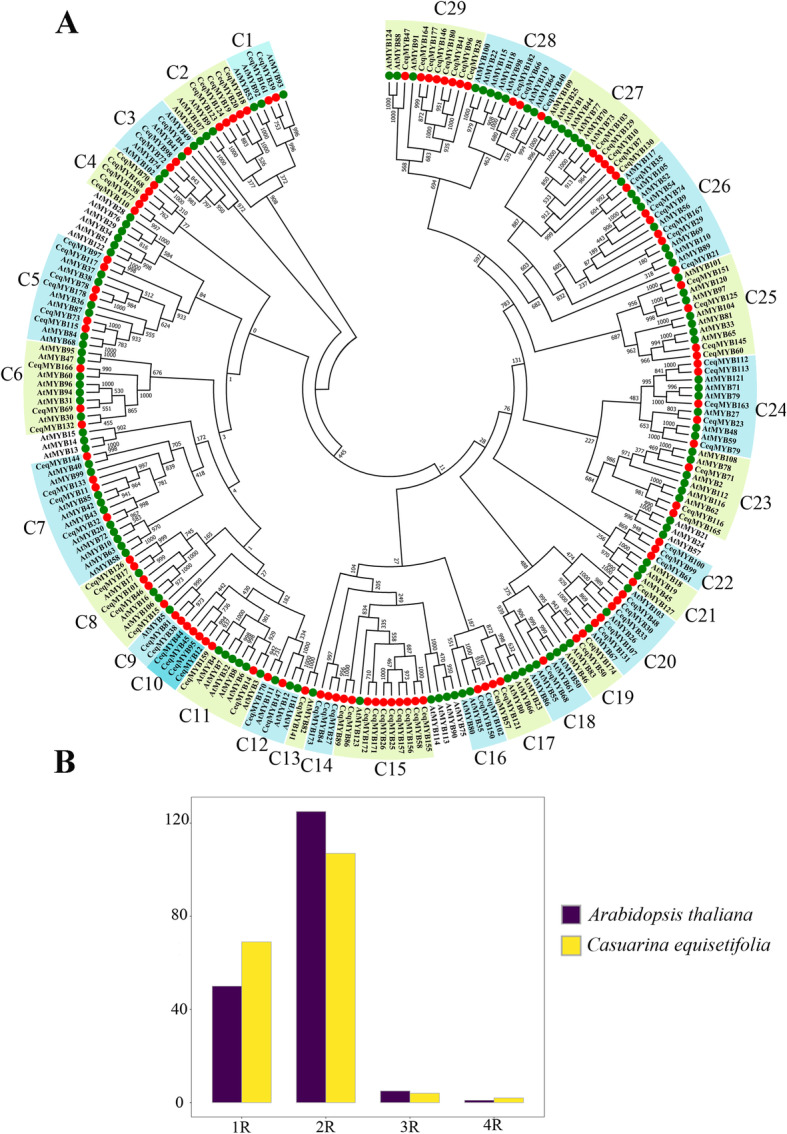
Phylogenetic relationships among R2R3-MYB genes in Casuarina equisetifolia and Arabidopsis thaliana. A Putative functions of the MYB proteins in C. equisetifolia based on the phylogenetic tree along with MYBs from A. thaliana. For details of the functions see Table S3. The circular unrooted tree was generated by NJ method with 1000 bootstrap replicates. B The number distribution of MYB gene in C. equisetifolia and A. thaliana
Fig. 2.
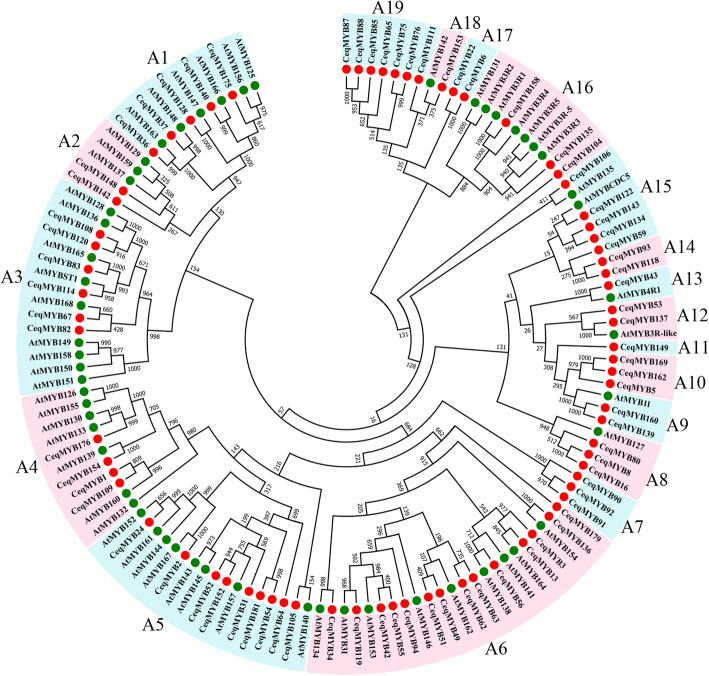
Phylogenetic tree of 1R-MYB, 3R-MYB and 4R-MYB genes in Casuarina equisetifolia and Arabidopsis thaliana. The circular unrooted tree was generated by NJ method with 1000 bootstrap replicates
The first phylogenetic tree (Fig. 1A) contained 125 R2R3-MYB genes of A. thaliana and 107 R2R3-MYB genes of C. equisetifolia. Then, these 107 R2R3-MYB genes in C. equisetifolia were divided into 29 groups (C1 ~ C29) according to the topology of the tree and the classification of the MYB superfamily in A. thaliana (Table S3). C13, C18 and C21 had only 1 member, which was the smallest group, while C15 had 10 members, which was the largest group. In addition, the members of C4, C10, C14, and C22 did not cluster into any group of A. thaliana, indicating that some changes occurred among MYB genes of different species during the evolutionary process. Most groups in our study (C1, C3, C5, C6, etc.) were supported by the previous studies with high bootstrap. For example, AtMYB93, AtMYB92, and AtMYB53 in group C1 regulated root development, and AtMYB49, AtMYB41, AtMYB74, and AtMYB102 in group C3 responded to adversity stress.
In the second phylogenetic tree (Fig. 2), a total of 131 MYB proteins (119 1R-MYB, nine 3R-MYB and three 4R-MYB) from C. equisetifolia and A. thaliana were extracted to construct the phylogenetic tree. According to the topology of the tree and classifications in A. thaliana, these 131 MYB proteins were divided into 19 groups (A1 ~ A19). As shown in Fig. 2, one 4R-MYB protein (CeqMYB43) was clustered into the 4R-MYB protein of A. thaliana, three R1R2R3-MYB proteins (CeqMYB104, CeqMYB135 and CeqMYB158) were clustered into five R1R2R3-MYB proteins of A. thaliana.
CeqMYB genes structure and protein motif analysis
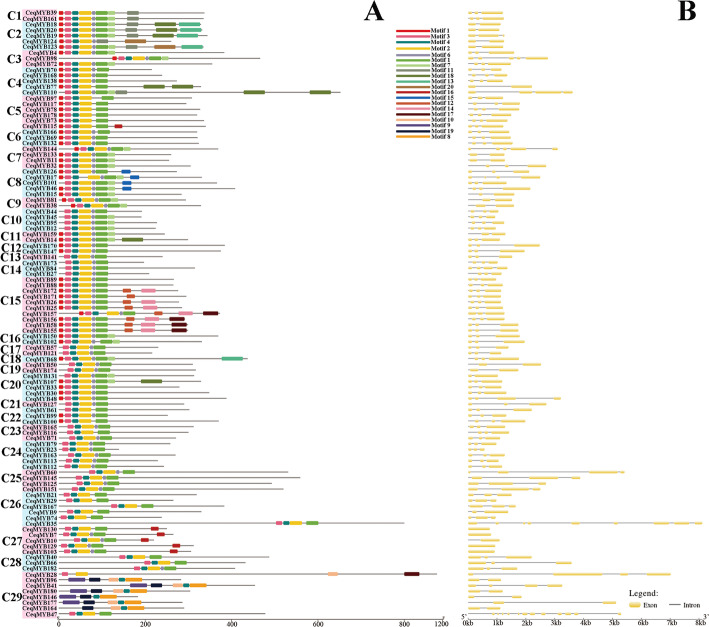
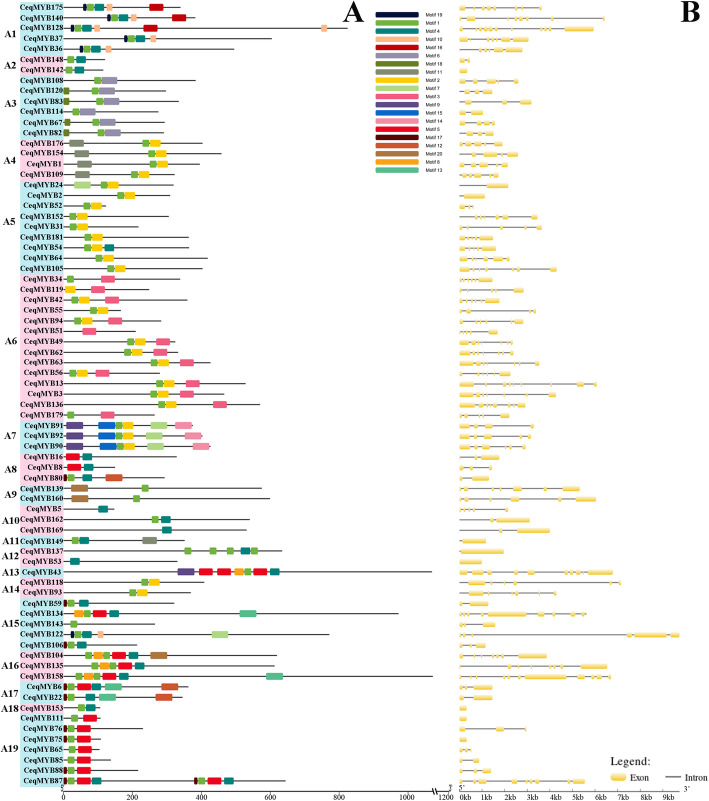
In order to have a more comprehensive understanding of the conserved domains of the CeqMYB genes, The Motif Elicitation (MEME) analysis was performed. Twenty conserved motifs were found in the R2R3-MYB and other CeqMYBs (1R-MYB, 3R-MYB and 4R-MYB) proteins of C. equisetifolia (Figs. 3A; Fig. 4A). As shown in Fig. 3A and Table S4, motif 1, motif 2, motif 3, motif 4, motif 9 and motif 10 were found to encode the MYB DNA-binding domain, while the other motifs didn’t have function annotation in R2R3-MYB of C. equisetifolia. A total of 100 of the 107 R2R3-MYB proteins included motif 3, motif 4, motif 2, motif 6 and motif 1. CeqMYB28 was composed of motif 3 and motif 2, motif 10 and motif 17. CeqMYB96, CeqMYB41, CeqMYB180, CeqMYB146, CeqMYB177 and CeqMYB164 clustered in the C29 group had unique motifs, including 9, 19, 10, 4 and 8 in R2R3-MYB proteins of C. equisetifolia. This characteristic was similar to a previous study in Chinese jujube (Ziziphus jujuba Mill.) R2R3-MYB proteins [3]. In addition, the conserved motif of other CeqMYB genes (1R-MYB, 3R-MYB and 4R-MYB) were predicted, different groups had different motifs, and motif 1 was common to all MYB genes in Fig. 4A. Specifically, motif 1 repeated four times in CeqMYB137, but repeated twice in members of A16 group. And motif 5 repeated three times in CeqMYB43. The motifs 17,1,5, and 4 were each repeated twice in CeqMYB87. The similar result was also found in Helianthus annuus L [37]. Furthermore, the result of PFAM and SMART annotation were shown in Table S5, Motif 1, motif 2, motif 5, motif 6, and motif 8 were found to encode the MYB DNA-binding domain and motif 4 encode the MYB-CC type domain, while the other motifs didn’t have function annotation.
Fig. 3.
Conserved motif and gene structure analysis of the R2R3-MYB proteins in Casuarina equisetifolia. A Groups of R2R3-MYB genes are highlighted with different colored backgrounds, and all motifs were identified by MEME. The different colored boxes represent different motifs and their position in each MYB sequence. For details of the motifs see Table S4. B The exons and introns are indicated by yellow rectangles and black lines, respectively
Fig. 4.
Distributions of conserved motifs gene structure and in CeqMYB genes (1R-MYB, 3R-MYB and 4R-MYB). A The motifs of numbers 1–20 is indicated in different colored boxes. The sequence information of the motifs is provided in Table S5. B The yellow boxes and black lines indicate exons and introns, respectively
To demonstrate conservation at particular positions, WebLogo was used to investigate further. The results (Fig. 5) showed that there were many conserved amino acids in the R2 and R3 domains of CeqMYBs, especially tryptophan residues (W), with 3 conserved W in R2 repeat. In the R3 repeat, there were only two conserved W residues, and the first W is usually replaced by either leucine (L) or phenylalanine (F) [38], which was replaced by L in this study.
Fig. 5.
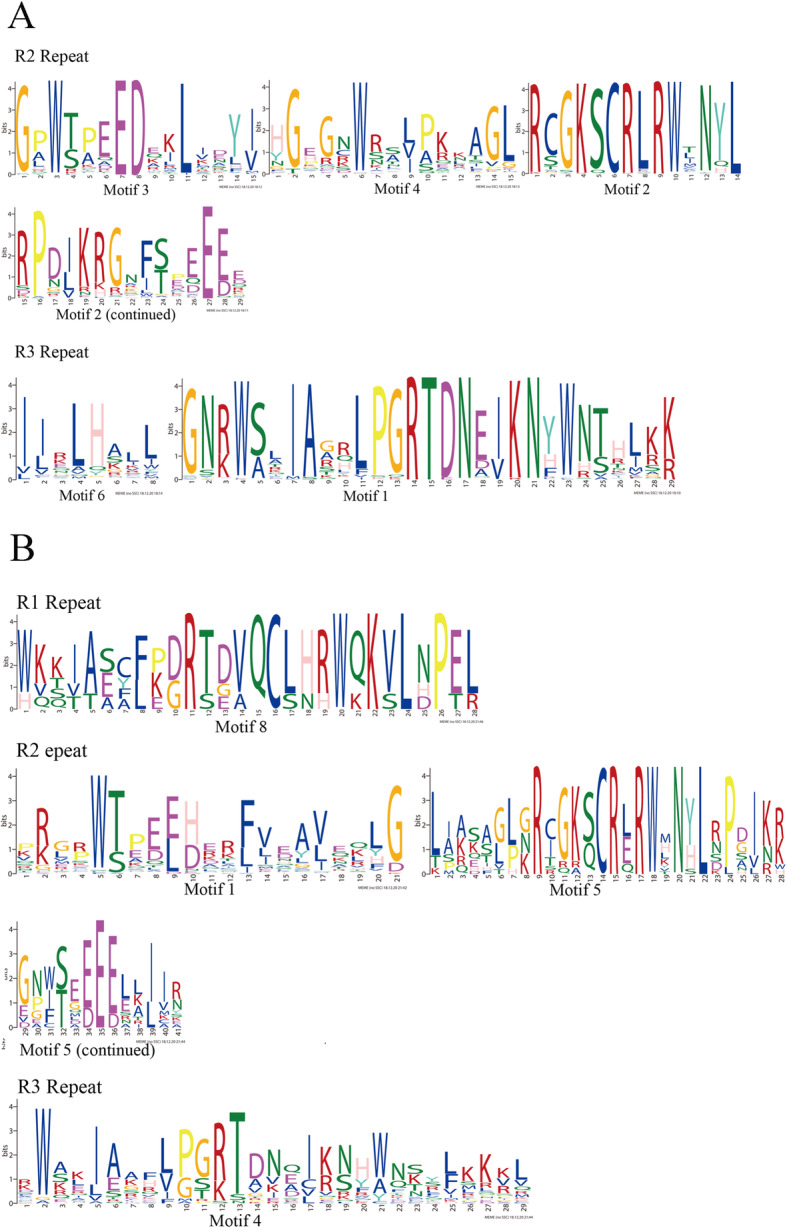
R1, R2 and R3 MYB repeats of the proteins in CeqMYB gene family. A R2 and R3 MYB repeats of R2R3-MYB proteins in C. equisetifolia. B R1, R2 and R3 MYB repeats of 1R-MYB, 3R-MYB and 4R-MYB proteins in C. equisetifolia. The overall height of each stack showed the conservation of the MYB protein sequence at that position. English letters indicate the different type of amino acid residue
In order to gain more insights into the structural diversity of MYB TFs, the exon/intron organization of R2R3-MYB and other MYB (1R-MYB, 3R-MYB and 4R-MYB) of C. equisetifolia were demonstrated separately. As shown in Fig. 3B, the 107 R2R3-MYB genes contained different numbers of exons, varying from 1 to 12. We found that most of the R2R3-MYB genes had two (20/107) or three (71/107) exons, while those with 9 and 12 exons existed just one each. In addition, combined with phylogenetic tree classification, it was found that there were 5 genes containing one exon and these 5 genes were clustered in the same group C27. Furthermore, the details of the exon/intron structural analysis of other CeqMYB genes (1R-MYB, 3R-MYB and 4R-MYB) were shown in Fig. 4B. The number of exons in 1R-MYBs ranged from 1 to 11, and the number of exons in 3R-MYBs ranged from 8 to 11. What’s more, the two 4R-MYBs had 9 (CeqMYB87) and 10 (CeqMYB43) exons, respectively. Based on the above observations, it was found that CeqMYB genes clustered in the same group had the same or similar number of exons. For example, CeqMYB genes belonging to the C28 (3 exons) and A14 (6 exons) group had the identical number of exons, while the A7 group had 4 to 6 exons. In brief, the number of exons of MYB genes from C. equisetifolia was quite different, but the closer the phylogenetic trees were, the greater the similarity of gene structure was.
MYB paralogs and orthologs
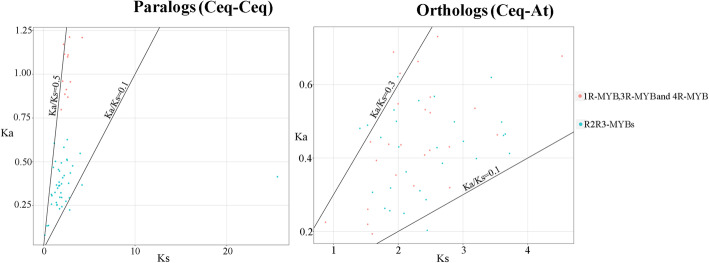
A total of 53 orthologues and 54 paralogues were identified based on the topology of phylogenetic tree and BLASTN methods. The ratio of non-synonymous substitution (Ka) and synonymous substitution (Ks) can reflect the selection pressure in the process of organism evolution. Thus, to explore the role of selection pressure in MYB gene family evolution, Ks values, Ka values, and Ka/Ks ratios of paralogues and orthologues were obtained (Table S6 and Fig. 6). Generally, a ratio of Ka/Ks less than 1 represent purification selection; a ratio of Ka/Ks greater than 1 mean positive selection; a ratio of Ka/Ks equal to 1 indicate neutral selection. The Ka/Ks ratio of all CeqMYB gene pairs was less than 1, of which the Ka/Ks ratio of most orthologues was 0.1–0.3, and that of paralogues was 0.1–0.5 (Fig. 6). The result suggested that purifying selection might have played an important role in the evolution of the MYB genes in C. equisetifolia.
Fig. 6.
Ka/Ks ratios of paralogs and orthologs. The black lines indicated Ka/Ks equal to 0.1, 0.3 and 0.5. The red dots represented 1R-MYB, 3R-MYB and 4R-MYB genes in C. equisetifolia and A. thaliana. The green dots represented R2R3-MYB genes in C. equisetifolia and A. thaliana
Profiling of expressed CeqMYB genes and GO annotation analysis
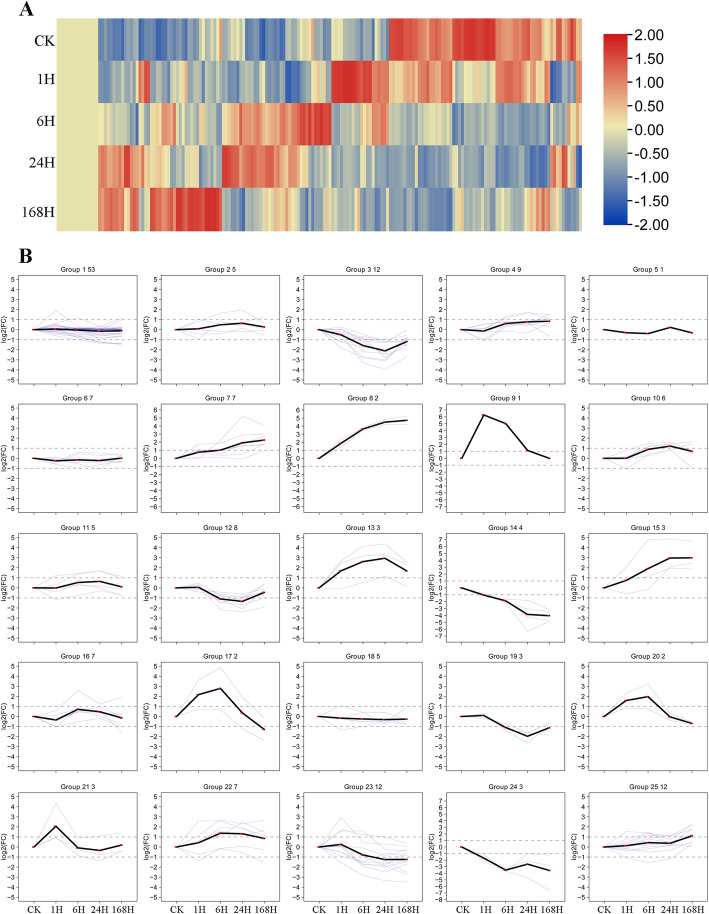
Based on transcriptome data, heat maps of CeqMYB genes treated with 200 mM NaCl at different time periods were analyzed (Fig. 7A). Next, the heat map data of 182 MYB genes were clustered into 25 expression patterns for trend analysis (Fig. 7B; Table S7). The CeqMYB genes responded to different time periods after 200 mM NaCl treatment, such as CeqMYB122 and CeqMYB14 were strongly up-regulated at 24 and 168 h after salt treatment, while the expression levels of CeqMYB10 and CeqMYB112 were up-regulated at 1 h after salt treatment and then down-regulated at later time points. Some of paralogues had similar expression patterns; for example, CeqMYB163/− 113 was initially up-regulated and reached a maximum at 6 h, but then decreased gradually. Nevertheless, some of the paralogues showed different expression patterns; for instance, the expression of CeqMYB16 was continuously up-regulated after salt treatment and reached the highest level after 168 h, while its paralogue, CeqMYB140, was highly expressed in 1 h during salt stress.
Fig. 7.
Expression pattern of 182 CeqMYB genes following NaCl treatment at different time points as determined by RNA-Seq. A The heatmap shows the hierarchical clustering of 182 CeqMYB genes at different time points. The color scale represents log10 expression values, blue represents low expression and red indicates a high expression level (transcript abundance). B Trend analysis of 182 CeqMYB genes expression (25 trends)
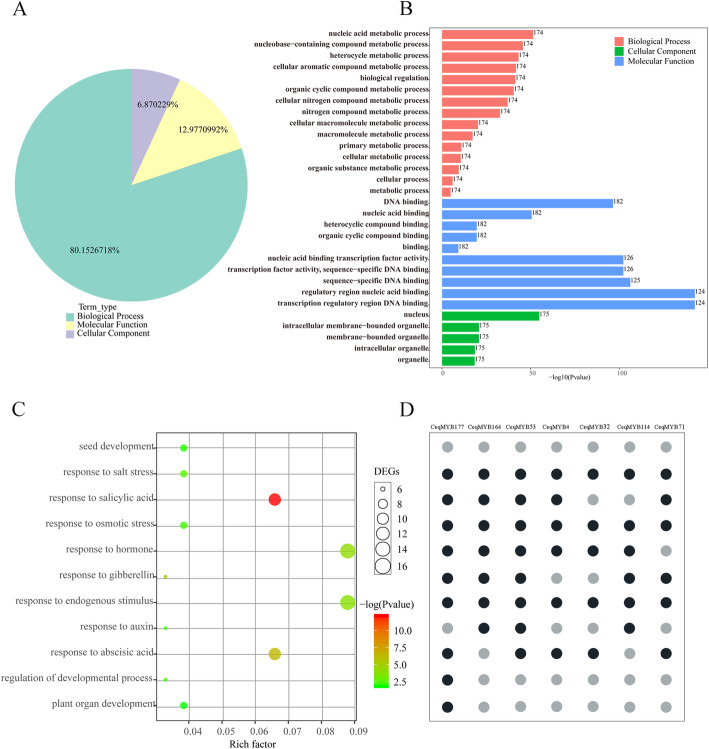
In order to predict the function of the MYB protein in C. equisetifolia, the GO annotation using a cut-off value of P ≤ 0.05 showed that a total of 131 GO items were enriched during the salt treatment (Table S8). As shown in Fig. 8A, 80% of term were categorized into biological process. Among these terms, nucleus, organelle, binding, biological regulation, cellular process and metabolic process were predominant (Fig. 8B). The analysis of cell component annotation showed that these proteins were mainly located in the nucleus, and the results were consistent with the prediction of subcellular localization. Furthermore, it was found that some CeqMYB genes assigned to the categories associated with development, hormone, and stress response. Seven genes were assigned to the “response to salt stress” category, of which CeqMYB164, CeqMYB4, CeqMYB53, CeqMYB32, CeqMYB114 and CeqMYB71 were also assigned to the categories associated with hormone response. Specially, CeqMYB177 was in the categories associated with development, hormone, and stress response (Fig. 8C; D).
Fig. 8.
GO enrichment analysis of 182 CeqMYB genes under salt stress. A the GO annotation using a cut-off value of P ≤ 0.05 showed that a total of 131 GO items, including molecular function, biological process, and cellular component. B The numbers of predominant GO items. C Some CeqMYB genes assigned to the categories associated with development, hormone, and stress response. The color gradient represents the size of the P value and the size of circular represents number of CeqMYB genes. The “rich factor” shows the ratio of the number of the CeqMYB genes to the total gene number in certain categories D Seven genes were assigned to the “response to salt stress” category. The grey circular indicated the gene was not involved in the category. The black circular indicated the gene was assigned to relevant category
In summary, combined with the expression pattern after salt treatment and GO annotation analysis, 32 CeqMYB genes were selected for further analysis.
Promoter analysis
The cis-element analysis of 32 selected CeqMYB genes were shown in Fig. 9, O2-site involved in zein metabolism regulation was found in the promoters of 4 CeqMYB genes. The differentiation of the palisade mesophyll cells (HD-Zip 1) and cell cycle regulation (MSA-like) element were found in the CeqMYB13 and CeqMYB117 promoter, respectively. Additionally, the meristem expression (CAT-box), seed-specific regulation (RY-element) and endosperm expression (GCN4_motif) were also identified in the promoters of the CeqMYB genes. Many hormone-responsive elements were identified, the auxin-responsive element (TGA element and AuxRR-core), the SA-responsive element (TCA element), the MeJA-responsive element (CGTCA motif and TGACG motif), the gibberellin-responsive element (TATC-box, GARE-motif and P-box) and the ABA-responsive element (ABRE) were found in the promoters of 12, 14, 25, 20 and 23 CeqMYB genes, respectively. In addition, stress related cis- elements including MBS (drought induced response element), LTR (low temperature response element), ARE (anaerobic induced response element), GC-motif (anoxic specific inducibility element) and TC-rich (defense and stress response element) were also identified in promoter regions of 32 selected CeqMYB genes. Therefore, the CeqMYB genes might be transcriptionally regulated under different abiotic stresses.
Fig. 9.
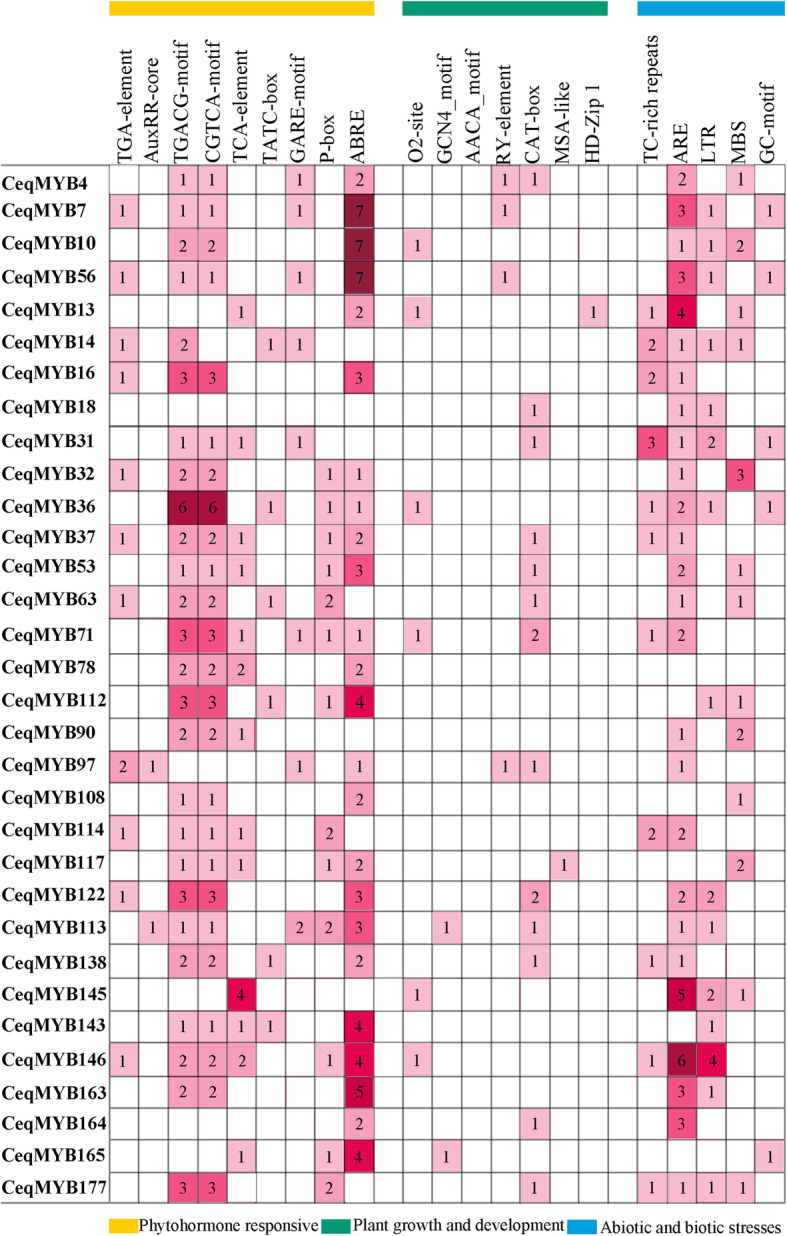
Cis-acting elements analysis of 32 selected CeqMYB genes in promoter region. Number of each cis-acting element in the promoter region
Validation of CeqMYB genes expression following salt treatment
According with the expression pattern after salt treatment and GO annotation analysis, the expression of 32 selected CeqMYB genes in root and shoot were detected by qRT-PCR after different concentrations of NaCl were used to treat the clone A8 seedlings for different time points. In addition, the specific primers of qRT-PCR were listed in Table S9.
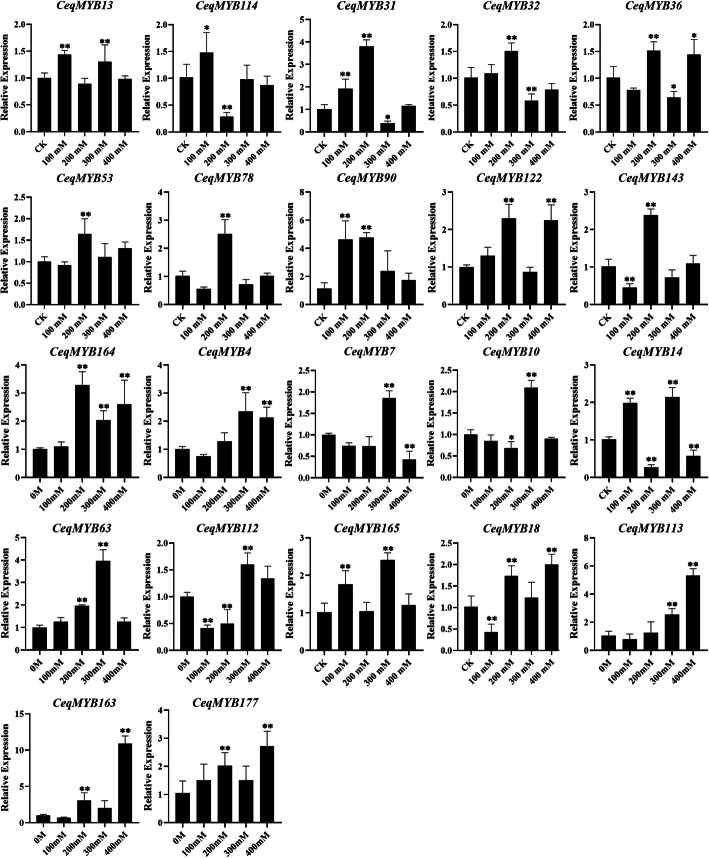
Fig. S1 showed that the expression of 90.6% (29/32) MYB genes was induced/repressed under different concentrations of NaCl treatment in C. equisetifolia roots. For example, expression of CeqMYB18, CeqMYB113, CeqMYB163, CeqMYB177 were up-regulated and peaked at 400 mM. Furthermore, expression of 16 genes peaked at different concentrations (Fig. 10). For example, CeqMYB31 and CeqMYB90 were up-regulated under low salt treatment and reached the maximum at 200 mM, but then dropped subsequently. Moreover, CeqMYB90 were significantly up-regulated more than 4-fold. In addition, the root response in salt stress at 200 mM NaCl shown in Fig. S2, all members of selected CeqMYBs can make relevant stress. Nine genes (CeqMYB14, CeqMYB16, CeqMYB31, CeqMYB32, CeqMYB37, CeqMYB71, CeqMYB97, CeqMYB122 and CeqMYB165) were up-regulated at 24 h and 168 h, whereas only CeqMYB164 was repressed with increasing time. Similar results were obtained in the paralogous (CeqMYB113/− 163), the expression levels were significantly up-regulated by high salinity treatment (400 mM) and at the time of 1 h in roots (Fig. 10 and Fig. S2).
Fig. 10.
Relative expression of 22 CeqMYB genes following NaCl treatment at different concentrations in roots as determined by qRT-PCR. The Y-axis and X-axis indicated relative expression levels and salt concentration of stress treatment, respectively. Mean values and standard deviations (SDs) were obtained from three biological and three technical replicates. The error bars indicate standard deviation. **P < 0.01 and *P < 0.05
Next, we analyzed the CeqMYB genes expression profile in shoots after treating at different concentrations of NaCl and at the same concentration for different time. Of the 32 CeqMYB genes, 15 were up-regulated at different concentrations, while 16 genes were down-regulated, compared with untreated seedlings (Fig. S3). The 16 genes were intensely up-regulated and peaked at low salinity (100 mM), and were then distinctly down-regulated (Fig. 11A). CeqMYB113 (more than 60-fold), CeqMYB138 (more than 15-fold), CeqMYB108 (more than 4-fold), CeqMYB112 (more than 4-fold) and CeqMYB63 (more than 6-fold) were strongly up-regulated in response to NaCl treatment at 100 mM. To further investigate the response of CeqMYB genes in shoots to salt stress, different time periods of salt treatment were used. From these, the expression level of CeqMYB97 did not change significantly, 8 genes were induced and peaked at 24 h, and 3 genes were suppressed at different time points (Fig. S4). Furthermore, Fig. 11B shown that 15 of 32 CeqMYB genes were expressed and peaked at 1 h, indicating a possible role for these genes in immediate/early responses of seedlings to osmotic stress. CeqMYB113 and CeqMYB163 were typical of this trend, the expression of which remained relatively unchanged at later time points but was strongly up-regulated by about 15-fold at 1 h. In short, most CeqMYB genes were up-regulated in root and shoot by multiple NaCl treatment, suggesting these genes may play important roles in salt stress response.
Fig. 11.
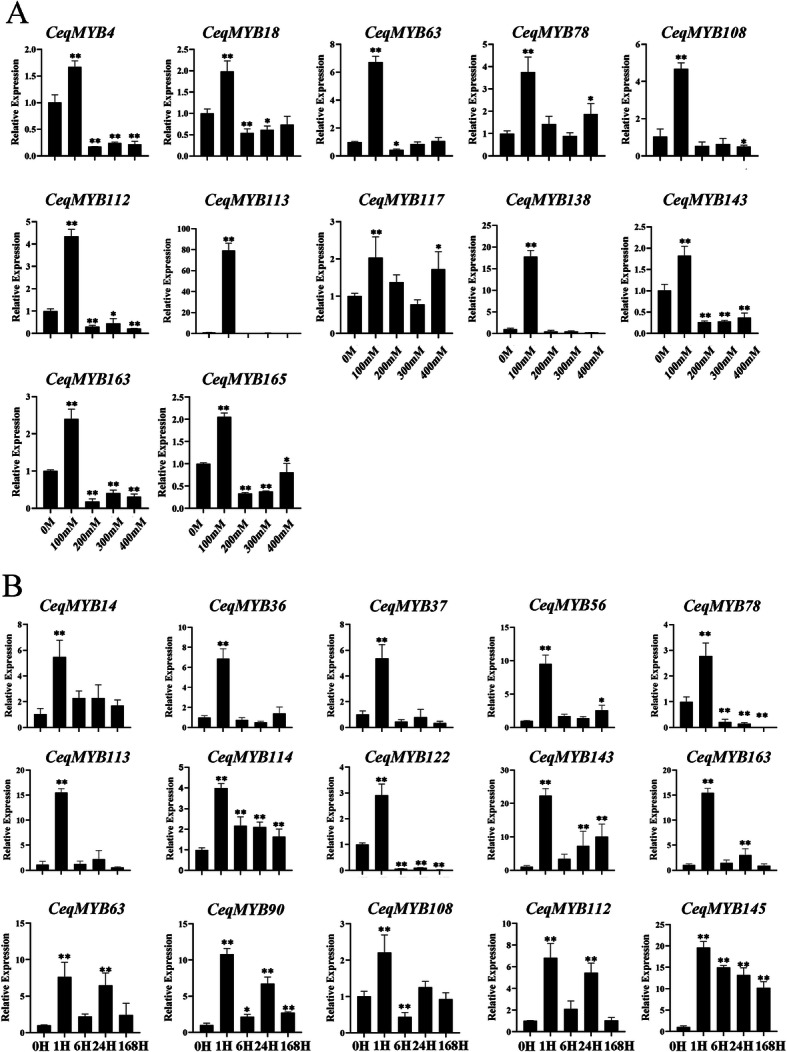
Relative expression of some CeqMYB genes following multiple NaCl treatment in roots as determined by qRT-PCR. A The expression level of 12 CeqMYB genes were up-regulated and peaked at 100 mM under different salt concentrations treatment. The Y-axis and X-axis indicated relative expression levels and salt concentration of stress treatment, respectively. B The expression level of 15 CeqMYB genes were up-regulated and peaked at 1 h following 200 mM NaCl treatment. The Y-axis and X-axis indicates relative expression levels and the time courses of stress treatments, respectively. Mean values and standard deviations (SDs) were obtained from three biological and three technical replicates. The error bars indicate standard deviation. **P < 0.01 and *P < 0.05
Discussion
MYB genes family is one of the largest transcription factors in plants. And MYB genes play important roles in many physiological processes of plants, such as cell cycle, primary metabolism, secondary metabolism, environmental response and stress response [4, 7, 38, 39]. So far, this is the first systematic study of the gene families in C. equisetifolia using bioinformatics tools and expression profiles based on the sequenced C. equisetifolia genome.
In this present study, a total of 182 CeqMYB genes were identified in the C. equisetifolia genome, and the distribution trend of CeqMYB members was similar to that reported in A. thaliana (Fig. 1B). The phylogenetic relationship of MYB gene family in C. equisetifolia and A. thaliana was studied (Figs. 1 and 2). Phylogenetic trees showed that some MYB genes in C. equisetifolia and A. thaliana formed their own independent clusters, which indicated that two species had a conserved evolutionary process. Moreover, not all groups of CeqMYB genes contain AtMYB genes. For example, the C4 group does not contain any AtMYB, reflecting the requirements of species to adapt to their specific environment [40].. The most closely related MYB genes may share a similar function. Previous studies have reported that AtMYB44 enhanced transgenic soybean tolerance to drought/salt stress by positively regulating abscisic acid (ABA) signaling to induce stomatal closure [41], and AtMYB73 played a negative role in plant tolerance to salt stress [27]. AtMYB44 and AtMYB73 were clustered in the same group, suggesting that CeqMYB130/− 7/− 10/− 129/− 103 in C27 group responded to salt stress.
Furthermore, the conserved motif and gene structure of 182 CeqMYB genes were analyzed (Figs. 3 and 4). The number and distribution of conserved motifs and exon/intron structures were different in CeqMYB genes. Among them, 4 CeqMYB genes had only one motif, and the maximum had 10 motif elements. The motif distribution of the same group of MYB was relatively consistent, most motif elements were concentrated and regularly distributed at the N-terminal, and a few (such as motif 18 and motif 17 in R2R3-MYB) were irregularly distributed at the C-terminal, indicating that CeqMYB genes with a close evolutionary relationship had similar functions. Some motifs appeared more frequently, such as motif 4 and motif 2, reflecting their importance to the function of CeqMYB protein. In addition, the members of the CeqMYB genes were divided into the same groups with mostly similar gene structures. Combined with previous studies [42, 43], it was also found that the number of exons in most MYB genes did not exceed two introns. On the whole, the differences in the number, type and distribution of the conserved motifs and exon/intron structures in the sequences might reveal the different functions of each gene. Ka/Ks can reflect the selection pressure in the process of biological evolution. Ka/Ks analysis was performed on all the identified homologous pairs, and the results showed that all the Ka/Ks ratios were less than 1 (Fig. 6), indicating that the MYB gene was mainly affected by purifying selection during evolution (Table S6).
Many MYB proteins are involved in the response of plants to adverse growth environment, some of which were closely related to the regulation of plant salt stress. Recent research reported that GhMYB108-like would play important regulatory role in response to drought and salt stresses based on quantitative expression analysis [44] and overexpression of TaMYB344 in tobacco enhanced the tolerance of plant to drought, high temperature and salt stress [45], while overexpression of VcMYB4a in blueberry callus enhanced sensitivity to salt, drought, cold, freezing, and heat stress [46]. Based on transcriptome data, we analyzed the expression patterns of 182 CeqMYB genes in response to 200 mM NaCl treatment at different time periods, and divided them into 25 groups according to different expression patterns (Fig. 7). Moreover, analysis of the molecular function annotations revealed that seven CeqMYB genes responded to salt stress (Fig. 8). From these, we selected 32 MYB genes to further explore their response to salt stress. Promoter analysis (Fig. 9) showed that 24 of the 32 selected CeqMYB genes harbored ABRE cis-regulatory elements involved in ABA responsiveness in their promoters. The auxin-responsive element (TGA-element and AuxRR-core) were also identified in the promoters of the 11 selected CeqMYB genes. Studies had shown that ABA signaling pathway played an important role in MYB-mediated salt tolerance. Overexpression of TaMYB33 could enhance drought and salt tolerance in Arabidopsis thaliana through ABA-mediated regulation of stress response signals [47]. In addition, the R2R3-type MYB TF encoded by MULTIPASS (OSMPs) were involved in plant hormone and cell wall synthesis while responding to high salinity signals [48]. These results suggested that MYB TFs can enhance salt tolerance of plants by mediating the signaling of plant hormones.
And the elucidation of gene expression patterns can provide important clues about gene function. The expression levels of 32 MYB genes were examined in the root and shoot of C. equisetifolia under various NaCl concentrations and time points under salt stress. The expression of 22 genes in roots and 15 genes in shoots were up-regulated after different concentration of NaCl treatment (Fig. S1; Fig. S3). Specially, expression level of CeqMYB16, CeqMYB37 and CeqMYB56 did not change significantly in root, but down-regulate in shoots. And CeqMYB71 were down-regulated at different concentration in root and shoot. Moreover, the expression level of some CeqMYB genes were up-regulated in root under salt stress, but down-regulated in shoots. The similar result was observed in Helianthus annuus [37], suggesting that some MYB genes were specifically expressed in roots. Some paralogous pairs exhibited similar expression patterns in the same tissue. For example, CeqMYB7/− 10 peaked at 300 mM NaCl in roots, but dropped to less than half that of CK at different concentration of NaCl treatment in shoots. Most genes with the same number of exons had similar expression patterns, such as CeqMYB7/− 10 contained one exon and CeqMYB4/− 16/− 32 contained 3 three exons (Fig. S3). Furthermore, qRT-PCR experiments and RNA-Seq data analysis showed that most CeqMYB genes were up-regulated at different time points following salt treatment in roots and shoots (Fig. S2; Fig. S4), consistent with previous studies such as that reported by Zhou et al. who found that some MYB genes in oil palm were induced at 24 h or/and 48 h by 300 mM NaCl treatment [49]. At least 8 genes were expressed in peanut roots under salt stress by qRT-PCR analysis [50]. In addition, rapid induction of AtMYB41 expression in response to osmotic and salt stress [51], and transgenic plants overexpressing AtMYB74 displayed hypersensitivity to NaCl during seed germination [26]. CeqMYB4, CeqMYB98, CeqMYB72, AtMYB41 and AtMYB74 were clustered in the same group, which suggested that these three CeqMYB genes responded to salt stress. In this study, CeqMYB4, which was a homologous pair of AtMYB74, was strongly up-regulated by about 10-fold at 1 and 24 h. It once again showed that CeqMYB4 played an important role in salt stress. Similarly, most CeqMYB genes were up-regulated to some extent following NaCl treatment, indicating a possible crucial role in response to salt stress.
Conclusions
In this study, 182 MYB genes were identified in the genome of C. equisetifolia. A comprehensive bioinformatics analysis was performed to investigate phylogenetic relationships, conserved motifs, gene structure, and promoter analysis. GO annotation analysis of CeqMYB genes in C. equisetifolia revealed that seven CeqMYB genes were assigned to the “response to salt stress” category. Combined with expression profile analysis by RNA-Seq data, 32 MYB genes were selected to further explore their response to salt stress. Expression profiling of selected 32 genes in root and shoot were detected by qRT-PCR after different concentrations of NaCl were used to treat seedlings for different time point. The expression levels of most selected MYB genes were up-regulated in shoots and roots at different treatment. Moreover, the expression level of CeqMYB4 was up-regulated under various salt treatments, indicating CeqMYB4 might participated in the response to salt stress. The information provided by these results may be helpful for further functional analysis of CeqMYB gene to elucidate its salt stress mechanism in C. equisetifolia.
Materials and methods
Sequence retrieval and gene identification
The Casuarina genome data was downloaded from online website (http://forestry.fafu.edu.cn/db/Casuarinaceae/). MYB genes were identified according to previous research methods [3, 52]. The HMM profile of MYB TFs (PF00249) was downloaded from Pfam protein family database (http://pfam.xfam.org/), then used it as query (P < 0.001) for the identification of all putative CeqMYB genes. Finally, all candidate MYB genes were manually screened by the Pfam database (http://pfam.janelia.org/), the NCBI Conserved Domain database (http://www.ncbi.nlm.nih.gov/Structure/cdd/wrpsb.cgi) and the SMART database (http://smart.embl-heidelberg.de/). A. thaliana genome sequences were obtained from the Phytozome database (http://www.phytozome.net/). To analysis the number of amino acids, open reading frame (ORF) length, molecular weight (MW) and isoelectric point (pI) for each MYB gene by using ExPASy (http://www.expasy.ch/tools/pi_tool.html). In addition, through online website WoLP PSORT (https://wolfpsort.hgc.jp/), predict the subcellular localization of CeqMYB deduced proteins.
Multiple sequence alignment and phylogenetic tree construction
MYB deduced proteins in C. equisetifolia were aligned with AtMYBs using ClustalX 2.11 [53, 54] software with default parameters. A neighbor-joining (NJ) phylogenetic analysis was conducted by MEGA7 based on the alignment. Bootstrap analysis with 1000 replicates was performed to calculate the reliability of the NJ tree [55].
Exon–intron structural and conserved motif analysis
In order to map the gene structure of exon-intron distribution of MYB gene, the online Gene Structure Display Server (http://gsds.cbi.pku.edu.ch) was used. For this purpose, CDS of each MYB gene and its corresponding genomic DNA sequence need to be uploaded. The MEME online program (http://meme-suite.org/tools/meme) was employed to analysis conserved motifs of MYB superfamily members in C. equisetifolia. The parameters for performing this analysis were as follows: number of repetition = any; maximum number of motifs = 20; optimum motif length = 6–200 residues. And the each of the putative motifs was annotated by searching Pfam and SMART.
Ka and Ks analysis of homologous pair
Based on the method from the study [56], defined paralogs. And the method was conducted by working a BLASTN [57] for all nucleotide sequences for each species. A pair of matching sequences that aligned exceed 300 bp and the identity ran over 80% were defined as pairs of paralogs in C. equisetifolia. The synonymous (Ks) and non-synonymous (Ka) substitutions per site between gene pairs were calculated by DnaSP v5.0 software [58].
Gene ontology (GO) annotation analysis
Gene ontology (GO) analysis was carried out for the CeqMYB genes from agriGO database (http://systemsbiology.cau.edu.cn/agriGOv2/index.php). All the 23,397 genes of C. equisetifolia were taken as the reference set and CeqMYB genes for both samples were taken as the test set. The results were divided into three categories, namely molecular function, biological process, and cellular component.
Expression profiling of CeqMYB genes
The expression profile data were downloaded from the Short Read Archive of the NCBI database (project accession number SRP064226) for expression analysis of C. equisetifolia root in different periods of salt treatment. The raw read counts for each transcript were calculated using Htseq-count and then normalized to transcripts per million (TPM). A heatmap was generated and visualized using the TBTOOLS software [59], the color scale shown represents TPM counts, and the ratios were log2 transformed. R software (https:// www.r-project.org) was used for the clustering analysis.
Putative promoter Cis-acting element analysis
To further study the regulatory mechanism of the CeqMYB genes in the abiotic stress response, many cis-acting elements related to plant growth and development, phytohormonal response, and abiotic and biotic stress responses were identified through PlantCARE program. The upstream 1500 bp region of the translation start site of the CeqMYB genes were download from the Casuarinaceae Database. The PlantCARE program was used to screen cis-elements in putative. The elements involved in plant growth and development, hormone response, abiotic and biological stress response were summarized.
Plant materials and salt treatments
The C. equisetifolia clone A8 (bred by the Zhanjiang Forestry Research Institute, selected from a commercial plantation in 1980s, which has been commercialized now, no any required permission for its sample collection and use) was preserved and cultivated by the Research Institute of Tropical Forestry, Chinese Academy of Forestry. Rooted cuttings of the clone A8 cultured in a growth chamber for 3 months were prepared for the experiment. For salt treatments, roots and shoots were harvested at 0, 1, 6, 24 and 168 h after 200 mM NaCl treatment, respectively. Furthermore, various concentrations (0, 100, 200, 300 and 400 mM NaCl) solution was poured over the culture medium vermiculite and black soil. The roots and shoots were harvested following 24 h of salt treatment and immediately frozen in liquid nitrogen, and transferred to an ultra-low temperature freezer for storage at-80 °C prior to needed for RNA extraction.
RNA extraction and qRT-PCR analysis
Total RNA was extracted from roots using the Aidlab plant RNA kit (Aidlab Biotech, Beijing, China) based on specifications. The integrity and concentration of the RNA was verified by 1% agarose gel electrophoresis and NanoDrop™ One/OneC (ThermoFisher Scientific, USA). The first strand cDNA was synthesized by PrimerScript RT MasterMix (Takara, Tokyo, Japan) according to the manufacturer’s instructions. qRT-PCR was performed on an LightCycler480 II Real-Time PCR system (Made in Switzerland) using TB Green Premix Ex Taq II (TaKaRa Biotechnology Co. Ltd., Dalian, China) with a 20 μL sample volume. And each reaction mixture contained 2.0 μl of diluted cDNA, 0.8 μl of each primer, 10.0 μl of TB Green Premix Ex Taq II, and 6.4 μl of RNase-free water. qPCR reaction cycling conditions were set as per the manufacturer’s instructions for TB Green Premix Ex Taq II. Each sample was conducted three times biologically using replicate. The relative expression level of each gene was calculated as 2-ΔΔCT [60] compared with untreated control plants that were set as 1. Specific primers for CeqMYB genes were designed by Primer Premier 5.0 software and the EF1α was used as housekeeping gene [61]. Statistical analysis and drawing by GraphPad 8 software [62].
Statistical analysis
Statistical significance was performed using a paired Student’s t test by JMP 8 software. The mean values and standard deviations (SDs) were calculated from three biological and three technical replicates, and significant differences relative to controls are indicated at **P < 0.01 and *P < 0.05.
Supplementary Information
Additional file 1: Figure S1. Relative expression of 32 selected CeqMYB genes following NaCl treatment at different concentrations in roots by qRT-PCR. The Y-axis and X-axis indicated relative expression levels and salt concentration of stress treatment, respectively. Mean values and standard deviations (SDs) were obtained from three biological and three technical replicates. The error bars indicate standard deviation. **P < 0.01 and *P < 0.05.
Additional file 2: Figure S2. Relative expression of 32 selected CeqMYB genes following NaCl treatment at different time periods in roots by RNA-Seq. The heatmap shows the hierarchical clustering of 32 CeqMYB genes at different time points. The color scale represents log10 expression values, blue represents low expression and red indicates a high expression level (transcript abundance).
Additional file 3: Figure S3. Relative expression of 32 selected CeqMYB genes following NaCl treatment at different concentrations in shoots by qRT-PCR. The Y-axis and X-axis indicated relative expression levels and salt concentration of stress treatment, respectively. Mean values and standard deviations (SDs) were obtained from three biological and three technical replicates. The error bars indicate standard deviation. **P < 0.01 and *P < 0.05.
Additional file 4: Figure S4. Relative expression of 32 selected CeqMYB genes following NaCl treatment at different time periods in shoots by qRT-PCR. The Y-axis and X-axis indicates relative expression levels and the time courses of stress treatments, respectively. Mean values and standard deviations (SDs) were obtained from three biological and three technical replicates. The error bars indicate standard deviation.
Additional file 5: Table S1. Details of the identified CeqMYB genes. Table S2 The prediction of subcellular localization in CeqMYB genes. Table S3 Putative functions of the MYB proteins in Casuarina equisetifolia. Table S4 Detailed information for the 20 motifs in the R2R3-MYB proteins of Casuarina equisetifolia. Table S5 Detailed information for the 20 motifs in the 1R-MYB, 3R-MYB and 4R-MYB proteins of Casuarina equisetifolia. Table S6 Ka/Ks ratios of gene pairs in Casuarina equisetifolia. Table S7 Heat map data of 182 MYB gene family in Casuarina equisetifolia. Table S8 Gene ontology of the of MYB gene family in Casuarina equisetifolia. Table S9 List of primer sequences used for qRT-PCR analysis of 32 selected CeqMYB genes.
Acknowledgements
Not applicable.
Authors’ contributions
Conceived and designed the experiments: YJW, CLZ and YZ. Performed the experiments: YJW and YCW Analyzed the data: YJW, JXM and ZL. Wrote the paper: YJW. Participated in the design of this study and revised manuscript: YJW, CJF and YZ. The authors read and approved the final manuscript.
Funding
This work was supported by a grant from the Specific Program for National Non-profit Scientific Institutions (CAFYBB2018ZB003), a project funded by the National Natural Science Foundation of China (Grant No. 31770716). The fundings body was not involved in the design of the study and collection, analysis, and interpretation of data and in writing the manuscript.
Availability of data and materials
Raw Illumina sequence data were deposited in the Short Read Archive of the NCBI database (project accession number SRP064226). The datasets supporting the results of this article are included in the article and Additional files.
Declarations
Ethics approval and consent to participate
Not applicable.
Consent for publication
Not applicable.
Competing interests
The authors declare no financial or commercial conflict of interest.
Footnotes
Publisher’s Note
Springer Nature remains neutral with regard to jurisdictional claims in published maps and institutional affiliations.
References
- 1.Lipsick J. One billion years of Myb. Oncogene. 1996;13(2):223–235. [PubMed] [Google Scholar]
- 2.Stracke R, Werber M, Weisshaar B. The R2R3-MYB gene family in Arabidopsis thaliana. Curr Opin Plant Biol. 2001;4(5):447–456. doi: 10.1016/S1369-5266(00)00199-0. [DOI] [PubMed] [Google Scholar]
- 3.Qing J, Dawei W, Jun Z, Yulan X, Bingqi S, Fan Z. Genome-wide characterization and expression analyses of the MYB superfamily genes during developmental stages in Chinese jujube. Peer J. 2019;7:e6353. doi: 10.7717/peerj.6353. [DOI] [PMC free article] [PubMed] [Google Scholar]
- 4.Dubos C, Stracke R, Grotewold E, Weisshaar B, Martin C, Lepiniec L. MYB transcription factors in Arabidopsis. Trends Plant Sci. 2010;15(10):573–581. doi: 10.1016/j.tplants.2010.06.005. [DOI] [PubMed] [Google Scholar]
- 5.Paz-Ares J, Ghosal D, Wienand U, Peterson PA, Saedler H. The regulatory c1 locus of zea mays encodes a protein with homology to MYB proto-oncogene products and with structural similarities to transcriptional activators. EMBO J. 1987;6(12):3553–3558. doi: 10.1002/j.1460-2075.1987.tb02684.x. [DOI] [PMC free article] [PubMed] [Google Scholar]
- 6.Legay S, Sivadon P, Blervacq A-S, Pavy N, Baghdady A, Tremblay L, Levasseur C, Ladouce N, Lapierre C, Séguin A. EgMYB1, an R2R3 MYB transcription factor from eucalyptus negatively regulates secondary cell wall formation in Arabidopsis and poplar. New Phytol. 2010;188(3):774–786. doi: 10.1111/j.1469-8137.2010.03432.x. [DOI] [PubMed] [Google Scholar]
- 7.Kranz H, Scholz K, Weisshaar B. C-MYB oncogene-like genes encoding three MYB repeats occur in all major plant lineages. Plant J. 2000;21(2):231–235. doi: 10.1046/j.1365-313x.2000.00666.x. [DOI] [PubMed] [Google Scholar]
- 8.Wang L, Lu W, Ran L, Dou L, Yao S. R2R3-MYB transcription factor MYB6 promotes anthocyanin and proanthocyanidin biosynthesis but inhibits secondary cell wall formation in Populus tomentosa. Plant J Cell Mol Biol. 2019;99(4):733–751. doi: 10.1111/tpj.14364. [DOI] [PubMed] [Google Scholar]
- 9.Mu RL, Cao YR, Liu YF, Lei G, Zou HF, Liao Y, Wang HW, Zhang WK, Ma B, Du JZ. An R2R3-type transcription factor gene AtMYB59 regulates root growth and cell cycle progression in Arabidopsis. Cell Res. 2009;19(11):1291–1304. doi: 10.1038/cr.2009.83. [DOI] [PubMed] [Google Scholar]
- 10.Li H-L, Guo D, Peng S-Q. Molecular and functional characterization of the JcMYB1, encoding a putative R2R3-MYB transcription factor in Jatropha curcas. Plant Growth Regul. 2015;75(1):45–53. doi: 10.1007/s10725-014-9930-z. [DOI] [Google Scholar]
- 11.Zhao P, Hou S, Guo X, Jia J, Yang W, Liu Z, Chen S, Li X, Qi D, Liu G, Cheng L. A MYB-related transcription factor from sheepgrass, LcMYB2, promotes seed germination and root growth under drought stress. BMC Plant Biol. 2019;19(1):564. doi: 10.1186/s12870-019-2159-2. [DOI] [PMC free article] [PubMed] [Google Scholar]
- 12.Dubos C, Gourrierec JL, Baudry A, Huep G, Lanet E, Debeaujon I, Routaboul JM, Alboresi A, Weisshaar B, Lepiniec L. MYBL2 is a new regulator of flavonoid biosynthesis in Arabidopsis thaliana. Plant J. 2008;55(6):940–953. doi: 10.1111/j.1365-313X.2008.03564.x. [DOI] [PubMed] [Google Scholar]
- 13.Kyoko M, Yoshimi U, Masaru OT. AtMYBL2, a protein with a single MYB domain, acts as a negative regulator of anthocyanin biosynthesis in Arabidopsis. Plant J. 2008;55(6):954–967. doi: 10.1111/j.1365-313X.2008.03565.x. [DOI] [PubMed] [Google Scholar]
- 14.Koes R, Verweij W, Quattrocchio F. Flavonoids: a colorful model for the regulation and evolution of biochemical pathways. Trends Plant Sci. 2005;10(5):236–242. doi: 10.1016/j.tplants.2005.03.002. [DOI] [PubMed] [Google Scholar]
- 15.Chezem WR, Clay NK. Regulation of plant secondary metabolism and associated specialized cell development by MYBs and bHLHs. Phytochemistry. 2016;131:26–43. doi: 10.1016/j.phytochem.2016.08.006. [DOI] [PMC free article] [PubMed] [Google Scholar]
- 16.Guo Y, Gan S. AtMYB2 regulates whole plant senescence by inhibiting cytokinin-mediated branching at late stages of development in Arabidopsis. Plant Physiol. 2011;156(3):1612–1619. doi: 10.1104/pp.111.177022. [DOI] [PMC free article] [PubMed] [Google Scholar]
- 17.Cominelli E, Sala T, Calvi D, Gusmaroli G, Tonelli C. Over-expression of the Arabidopsis AtMYB41 gene alters cell expansion and leaf surface permeability. Plant J. 2008;53(1):53–64. doi: 10.1111/j.1365-313X.2007.03310.x. [DOI] [PubMed] [Google Scholar]
- 18.Gil LH, Joon SP. The MYB96-HHP module integrates cold and abscisic acid signaling to activate the CBF-COR pathway in Arabidopsis. Plant J. 2015;82(6):962–977. doi: 10.1111/tpj.12866. [DOI] [PubMed] [Google Scholar]
- 19.Agarwal M, Hao Y, Kapoor A, Dong C-H, Fujii H, Zheng X, Zhu J-K. A R2R3 type MYB transcription factor is involved in the cold regulation of CBF genes and in acquired freezing tolerance. J Biol Chem. 2006;281(49):37636–37645. doi: 10.1074/jbc.M605895200. [DOI] [PubMed] [Google Scholar]
- 20.Chen Y, Chen Z, Kang J, Kang D, Gu H, Qin G. AtMYB14 regulates cold tolerance in Arabidopsis. Plant Mol Biol Report. 2013;31(1):87–97. doi: 10.1007/s11105-012-0481-z. [DOI] [PMC free article] [PubMed] [Google Scholar]
- 21.Cominelli E, Galbiati M, Vavasseur A, Conti L, Sala T, Vuylsteke M, Leonhardt N, Dellaporta SL, Tonelli C. A guard-cell-specific MYB transcription factor regulates stomatal movements and plant drought tolerance. Curr Biol. 2005;15(13):1196–1200. doi: 10.1016/j.cub.2005.05.048. [DOI] [PubMed] [Google Scholar]
- 22.Du Y, Zhao M, Wang C, Gao Y, Wang Y, Liu Y, Chen M, Chen J, Zhou Y, Xu Z, et al. Identification and characterization of GmMYB118 responses to drought and salt stress. BioMed Central. 2018;18(1):320. doi: 10.1186/s12888-018-1898-1. [DOI] [PMC free article] [PubMed] [Google Scholar]
- 23.Wu J, Jiang Y, Liang Y, Chen L, Chen W, Cheng B. Expression of the maize MYB transcription factor ZmMYB3R enhances drought and salt stress tolerance in transgenic plants. Plant Physiol Biochem. 2019;137:179–188. doi: 10.1016/j.plaphy.2019.02.010. [DOI] [PubMed] [Google Scholar]
- 24.Yoo JH, YoungPark C, Kim JC, Heo WD, Cheong MS, Park HC, Kim MC, Moon BC, Choi MS, Kang YH, et al. Direct interaction of a divergent CaM isoform and the transcription factor, MYB2, enhances salt tolerance in arabidopsis. J Biol Chem. 2005;280(5):3697–3706. doi: 10.1074/jbc.M408237200. [DOI] [PubMed] [Google Scholar]
- 25.Jung C, Seo JS, Han SW, Koo YJ, Kim CH, Song SI, Nahm BH, Choi YD, Cheong J-J. Overexpression of AtMYB44 enhances stomatal closure to confer abiotic stress tolerance in transgenic Arabidopsis. Plant Physiol. 2008;146(2):623–635. doi: 10.1104/pp.107.110981. [DOI] [PMC free article] [PubMed] [Google Scholar]
- 26.Xu R, Wang Y, Zheng H, Lu W, Wu C, Huang J, Yan K, Yang G, Zheng C. Salt-induced transcription factor MYB74 is regulated by the RNA-directed DNA methylation pathway in Arabidopsis. J Exp Bot. 2015;66(19):5997–6008. doi: 10.1093/jxb/erv312. [DOI] [PMC free article] [PubMed] [Google Scholar]
- 27.Kim JH, Nguyen NH, Jeong CY, Nguyen NT, Hong S-W, Lee H. Loss of the R2R3 MYB, AtMyb73, causes hyper-induction of the SOS1 and SOS3 genes in response to high salinity in Arabidopsis. J Plant Physiol. 2013;170(16):1461–1465. doi: 10.1016/j.jplph.2013.05.011. [DOI] [PubMed] [Google Scholar]
- 28.He Y, Li W, Lv J, Jia Y, Wang M, Xia G. Ectopic expression of a wheat MYB transcription factor gene, TaMYB73, improves salinity stress tolerance in Arabidopsis thaliana. J Exp Bot. 2012;63(3):1511–1522. doi: 10.1093/jxb/err389. [DOI] [PubMed] [Google Scholar]
- 29.Zhao Y, Yang Z, Ding Y, Liu L, Han X, Zhan J, Wei X, Diao Y, Qin W, Wang P, Liu P, Sajjad M, Zhang X, Ge X. Over-expression of an R2R3 MYB Gene, GhMYB73 , increases tolerance to salt stress in transgenic Arabidopsis. Plant Sci. 2019;286:28–36. doi: 10.1016/j.plantsci.2019.05.021. [DOI] [PubMed] [Google Scholar]
- 30.Li X, Guo C, Ahmad S, Wang Q, Yu J, Liu C, Guo Y. Systematic analysis of MYB family genes in potato and their multiple roles in development and stress responses. Biomolecules. 2019;9(8):317. doi: 10.3390/biom9080317. [DOI] [PMC free article] [PubMed] [Google Scholar]
- 31.Zhang X, Chen L, Shi Q, Ren Z. SlMYB102, an R2R3-type MYB gene, confers salt tolerance in transgenic tomato. Plant Sci. 2020;291:110356. doi: 10.1016/j.plantsci.2019.110356. [DOI] [PubMed] [Google Scholar]
- 32.Dai X, Xu Y, Ma Q, Xu W, Wang T, Xue Y, Chong K. Overexpression of an R1R2R3 MYB gene, OsMYB3R-2, increases tolerance to freezing, drought, and salt stress in transgenic Arabidopsis. Plant Physiol. 2007;143(4):1739–1751. doi: 10.1104/pp.106.094532. [DOI] [PMC free article] [PubMed] [Google Scholar]
- 33.Cai H, Tian S, Liu C, Dong H. Identification of a MYB3R gene involved in drought, salt and cold stress in wheat ( Triticum aestivum L.) Gene. 2011;485(2):146–152. doi: 10.1016/j.gene.2011.06.026. [DOI] [PubMed] [Google Scholar]
- 34.Beadle NCW. The vegetation of Australia. Cambridge: Cambridge University Press; 1981. [Google Scholar]
- 35.Lui Y, Zhong C, Bai J, Zhang Y, Chen J. The salt resistance experiment on four clones of Casuarina equisetifolia in tissue culture. Guangdong Forestry Sci Technol. 2003;19(2):47–50. [Google Scholar]
- 36.Ye G, Zhang H, Chen B, Nie S, Liu H, Gao W, Wang H, Gao Y, Gu L. De novo genome assembly of the stress tolerant forest species Casuarina equisetifolia provides insight into secondary growth. Plant J. 2019;97(4):779–794. doi: 10.1111/tpj.14159. [DOI] [PubMed] [Google Scholar]
- 37.Li J, Liu H, Yang C, Wang J, Yan G, Si P, Bai Q, Lu Z, Zhou W, Xu L. Genome-wide identification of MYB genes and expression analysis under different biotic and abiotic stresses in Helianthus annuus L. Ind Crop Prod. 2020;143:111924. doi: 10.1016/j.indcrop.2019.111924. [DOI] [Google Scholar]
- 38.Cao Y, Han Y, Li D, Lin Y, Cai Y. MYB transcription factors in Chinese Pear (Pyrus bretschneideri Rehd.): Genome-wide identification, classification, and expression profiling during fruit development. Front Plant Sci. 2016;7:577. doi: 10.3389/fpls.2016.00577. [DOI] [PMC free article] [PubMed] [Google Scholar]
- 39.Haga N, Kato K, Murase M, Araki S, Kubo M, Demura T, Suzuki K, Müller I, Voss U, Jürgens G, et al. R1R2R3-Myb proteins positively regulate cytokinesis through activation of KNOLLE transcription in Arabidopsis thaliana. Development. 2007;134(6):1101–1110. doi: 10.1242/dev.02801. [DOI] [PubMed] [Google Scholar]
- 40.Nozawa M, Kawahara Y, Nei M. Genomic drift and copy number variation of sensory receptor genes in humans. Proc Natl Acad Sci U S A. 2007;18(51):20421–20426. doi: 10.1073/pnas.0709956104. [DOI] [PMC free article] [PubMed] [Google Scholar]
- 41.Seo JS, Sohn HB, Noh K, Jung C, An JH, Donovan CM, Somers DA, Kim DI, Jeong S-C, Kim C-G, Kim HM, Lee SH, Choi YD, Moon TW, Kim CH, Cheong JJ. Expression of the Arabidopsis AtMYB44 gene confers drought/salt-stress tolerance in transgenic soybean. Mol Breed. 2012;29(3):601–608. doi: 10.1007/s11032-011-9576-8. [DOI] [Google Scholar]
- 42.Yang K, Li Y, Wang S, Xu X, Sun H, Zhao H, Li X, Gao Z. Genome-wide identification and expression analysis of the MYB transcription factor in moso bamboo (Phyllostachys edulis) Peer J. 2019;6:e6242. doi: 10.7717/peerj.6242. [DOI] [PMC free article] [PubMed] [Google Scholar]
- 43.Liu C, Hao J, Qiu M, Pan J, He Y. Genome-wide identification and expression analysis of the MYB transcription factor in Japanese plum (Prunus salicina) Genomics. 2020;112(6):4875–4886. doi: 10.1016/j.ygeno.2020.08.018. [DOI] [PubMed] [Google Scholar]
- 44.Ullah A, Qamar MTU, Nisar M, Hazrat A, Rahim G, Khan AH, Hayat K, Ahmed S, Ali W, Khan A, et al. Characterization of a novel cotton MYB gene, GhMYB108 - like responsive to abiotic stresses. Mol Biol Rep. 2020;47(3):1573–1581. doi: 10.1007/s11033-020-05244-6. [DOI] [PubMed] [Google Scholar]
- 45.Wei Q, Chen R, Wei X, Liu Y, Zhao S, Yin X, Xie T. Genome-wide identification of R2R3-MYB family in wheat and functional characteristics of the abiotic stress responsive gene TaMYB344. BMC Genomics. 2020;21(1):792. doi: 10.1186/s12864-020-07175-9. [DOI] [PMC free article] [PubMed] [Google Scholar]
- 46.Zhang C-Y, Liu H-C, Zhang X-S, Guo Q-X, Bian S-M, Wang J-Y, Zhai L-L. VcMYB4a , an R2R3-MYB transcription factor from Vaccinium corymbosum , negatively regulates salt, drought, and temperature stress. Gene. 2020;757:144935. doi: 10.1016/j.gene.2020.144935. [DOI] [PubMed] [Google Scholar]
- 47.Qin Y, Wang M, Tian Y, He W, Han L, Xia G. Over-expression of TaMYB33 encoding a novel wheat MYB transcription factor increases salt and drought tolerance in Arabidopsis. Mol Biol Rep. 2012;39(6):7183–7192. doi: 10.1007/s11033-012-1550-y. [DOI] [PubMed] [Google Scholar]
- 48.Schmidt R, Schippers JHM, Mieulet D, Obata T, Fernie AR, Guiderdoni E, Mueller-Roeber B. MULTIPASS , a rice R2R3-type MYB transcription factor, regulates adaptive growth by integrating multiple hormonal pathways. Plant J. 2013;76(2):258–273. doi: 10.1111/tpj.12286. [DOI] [PubMed] [Google Scholar]
- 49.Zhou L, Yarra R, Jin L, Cao H. Genome-wide identification and expression analysis of MYB gene family in oil palm (Elaeis guineensis Jacq.) under abiotic stress conditions. Environ Exp Bot. 2020;180:104245. doi: 10.1016/j.envexpbot.2020.104245. [DOI] [Google Scholar]
- 50.Chen N, Yang Q, Pan L, Chi X, Chen M, Hu D, Yang Z, Wang T, Wang M, Yu S. Identification of 30 MYB transcription factor genes and analysis of their expression during abiotic stress in peanut (Arachis hypogaea L.) Gene. 2014;533(1):332–345. doi: 10.1016/j.gene.2013.08.092. [DOI] [PubMed] [Google Scholar]
- 51.Lippold F, Sanchez DH, Musialak M, Schlereth A, Scheible W-R, Hincha DK, Udvardi MK. AtMyb41 regulates transcriptional and metabolic responses to osmotic stress in Arabidopsis. Plant Physiol. 2009;149(4):1761–1772. doi: 10.1104/pp.108.134874. [DOI] [PMC free article] [PubMed] [Google Scholar]
- 52.Zhao P, Wang D, Wang R, Kong N, Zhang C, Yang C, Wu W, Ma H, Chen Q. Genome-wide analysis of the potato Hsp20 gene family: identification, genomic organization and expression profiles in response to heat stress. BMC Genomics. 2018;19(1):61. doi: 10.1186/s12864-018-4443-1. [DOI] [PMC free article] [PubMed] [Google Scholar]
- 53.Saitou N. The neighbor-joining methods: a new method for reconstructing phylogenetic trees. Molbiolevol. 1987;4(4):406–425. doi: 10.1093/oxfordjournals.molbev.a040454. [DOI] [PubMed] [Google Scholar]
- 54.Thompson J, Gibson T, Plewniak F, Jeanmougin F, Higgins D. The Clustal_X windows interface : flexible strategies for multiple sequence alignment aided by quality analysis tool. Nuclc Acids Res. 1997;25(24):4876–4882. doi: 10.1093/nar/25.24.4876. [DOI] [PMC free article] [PubMed] [Google Scholar]
- 55.Kumar S, Stecher G, Tamura K. MEGA7: molecular evolutionary genetics analysis version 7.0 for bigger datasets. Mol Biol Evol. 2016;33(7):1870–1874. doi: 10.1093/molbev/msw054. [DOI] [PMC free article] [PubMed] [Google Scholar]
- 56.Blanc G, Wolfe KH. Widespread paleopolyploidy in model plant species inferred from age distributions of duplicate genes. Plant Cell. 2004;16(7):1667–1678. doi: 10.1105/tpc.021345. [DOI] [PMC free article] [PubMed] [Google Scholar]
- 57.Altschul S, Madden T, Schäffer A, Zhang J, Zhang Z, Miller W, Lipman D. Gapped BLAST (basic local alignment search tool) and PSI-BLAST : a new generation of protein database search programs. Nucleic Acids Res. 1997;25(17):3389–3402. doi: 10.1093/nar/25.17.3389. [DOI] [PMC free article] [PubMed] [Google Scholar]
- 58.Librado P, Rozas J. DnaSP v5: a software for comprehensive analysis of DNA polymorphism data. Bioinformatics. 2009;25(11):1451–1452. doi: 10.1093/bioinformatics/btp187. [DOI] [PubMed] [Google Scholar]
- 59.Chen C, Chen H, Zhang Y, Thomas HR, Xia R. TBtools: An integrative toolkit developed for interactive analyses of big biological data. Mol Plant. 2020;13(8):1194–1202. doi: 10.1016/j.molp.2020.06.009. [DOI] [PubMed] [Google Scholar]
- 60.Schmittgen TD, Livak KJ. Analyzing real-time PCR data by the comparative CT method. Nat Protoc. 2008;3(6):1101–1108. doi: 10.1038/nprot.2008.73. [DOI] [PubMed] [Google Scholar]
- 61.Fan C, Qiu Z, Zeng B, Liu Y, Li X, Guo G. Selection of reference genes for quantitative real-time PCR in Casuarina equisetifolia under salt stress. Biol Plant. 2017;61(3):463–472. doi: 10.1007/s10535-016-0670-y. [DOI] [Google Scholar]
- 62.Bryfczynski SP, Pargas RP. GraphPad: a graph creation tool for CS2/CS7. 2009. p. 389. [Google Scholar]
Associated Data
This section collects any data citations, data availability statements, or supplementary materials included in this article.
Supplementary Materials
Additional file 1: Figure S1. Relative expression of 32 selected CeqMYB genes following NaCl treatment at different concentrations in roots by qRT-PCR. The Y-axis and X-axis indicated relative expression levels and salt concentration of stress treatment, respectively. Mean values and standard deviations (SDs) were obtained from three biological and three technical replicates. The error bars indicate standard deviation. **P < 0.01 and *P < 0.05.
Additional file 2: Figure S2. Relative expression of 32 selected CeqMYB genes following NaCl treatment at different time periods in roots by RNA-Seq. The heatmap shows the hierarchical clustering of 32 CeqMYB genes at different time points. The color scale represents log10 expression values, blue represents low expression and red indicates a high expression level (transcript abundance).
Additional file 3: Figure S3. Relative expression of 32 selected CeqMYB genes following NaCl treatment at different concentrations in shoots by qRT-PCR. The Y-axis and X-axis indicated relative expression levels and salt concentration of stress treatment, respectively. Mean values and standard deviations (SDs) were obtained from three biological and three technical replicates. The error bars indicate standard deviation. **P < 0.01 and *P < 0.05.
Additional file 4: Figure S4. Relative expression of 32 selected CeqMYB genes following NaCl treatment at different time periods in shoots by qRT-PCR. The Y-axis and X-axis indicates relative expression levels and the time courses of stress treatments, respectively. Mean values and standard deviations (SDs) were obtained from three biological and three technical replicates. The error bars indicate standard deviation.
Additional file 5: Table S1. Details of the identified CeqMYB genes. Table S2 The prediction of subcellular localization in CeqMYB genes. Table S3 Putative functions of the MYB proteins in Casuarina equisetifolia. Table S4 Detailed information for the 20 motifs in the R2R3-MYB proteins of Casuarina equisetifolia. Table S5 Detailed information for the 20 motifs in the 1R-MYB, 3R-MYB and 4R-MYB proteins of Casuarina equisetifolia. Table S6 Ka/Ks ratios of gene pairs in Casuarina equisetifolia. Table S7 Heat map data of 182 MYB gene family in Casuarina equisetifolia. Table S8 Gene ontology of the of MYB gene family in Casuarina equisetifolia. Table S9 List of primer sequences used for qRT-PCR analysis of 32 selected CeqMYB genes.
Data Availability Statement
Raw Illumina sequence data were deposited in the Short Read Archive of the NCBI database (project accession number SRP064226). The datasets supporting the results of this article are included in the article and Additional files.


