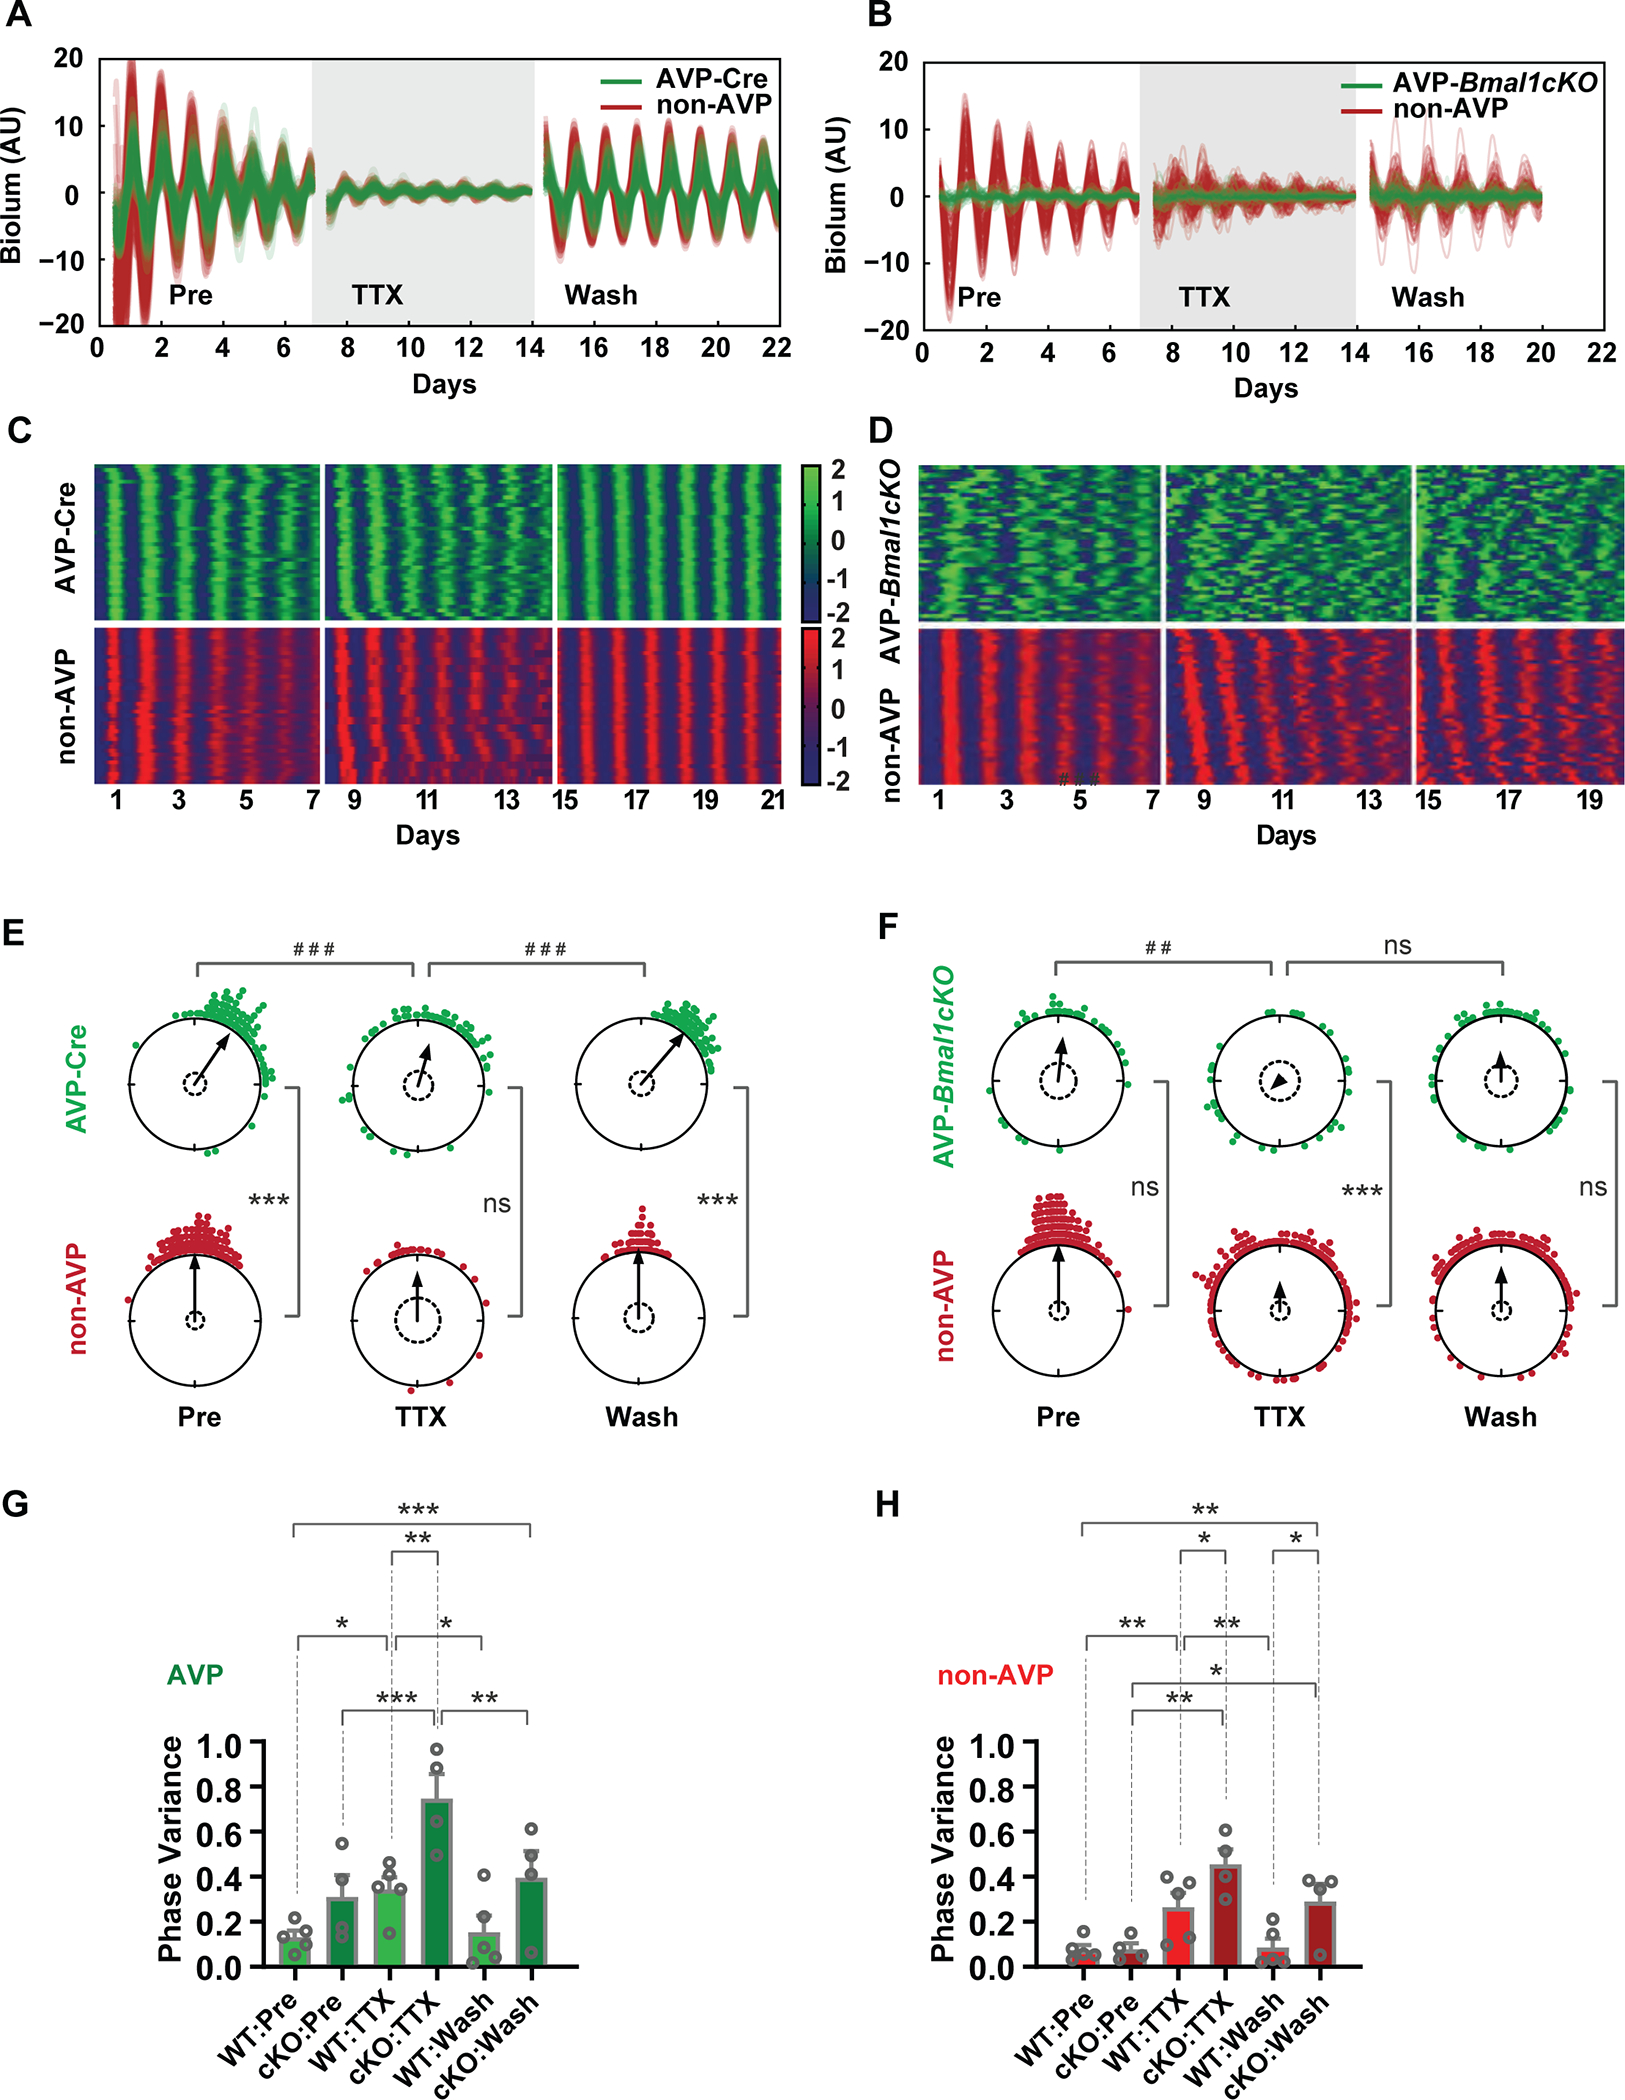
Figure 3: Cell-type-specific effects of Bmal loss of function in AVP neurons.

(A, B) Single-cell trajectories from AVP-Cre and AVP-Bmal1−/− (cKO) SCN through three conditions: pretreatment, 1μM TTX treatment and washout of TTX. (C, D) Heatmap representation of single-cell trajectories from AVP-Cre and an AVP-Bmal1−/− SCN through three conditions. (E, F) Single-cell phase distributions of an AVP SCN (E) and an AVP-Bmal1−/− SCN, (F). Sinusoid curve fitting was performed only on rhythmic cells, and phases on day 4 (midpoint) are presented in Rayleigh plots. Asterisks indicate significant directional mean phase differences by Watson-Williams test and pound signs indicate significant phase homogeneity or variance differences by Watson-Wheeler test. (G-H) Homogeneity of single-cell phase from multiple replicate SCN slices (AVP, n=5 and AVP-Bmal1−/−, n=4), were evaluated with Mean +/− SEM circular variances. Two-way ANOVA revealed a main effect of genotype, and asterisks indicate the significant Holm-Sidak’s multiple comparisons between AVP-Cre and AVP-Bmal1−/− across pretreatment, TTX treatment, and washout. One-way repeated measures ANOVA with Tukey’s multiple comparisons was used to assess the effects of pretreatment, TTX treatment and washout in each cell type (AVP-Cre, non-AVP, AVP-Bmal1−/−, and non-AVP Bmal1−/−). Asterisks and pound signs indicate significant differences (* or #, p ≤0.05; ** or ##, p ≤ 0.01; *** or ###, p ≤ 0.001). Detailed quantification results are included in Supplemental Data 1.
