Abstract
β-Thalassemia pathology is due not only to loss of β-globin (HBB), but also to erythrotoxic accumulation and aggregation of the β-globin-binding partner, α-globin (HBA1/2). Here we describe a Cas9/AAV6-mediated genome editing strategy that can replace the entire HBA1 gene with a full-length HBB transgene in β-thalassemia-derived hematopoietic stem and progenitor cells (HSPCs), which is sufficient to normalize β-globin:α-globin messenger RNA and protein ratios and restore functional adult hemoglobin tetramers in patient-derived red blood cells. Edited HSPCs were capable of long-term and bilineage hematopoietic reconstitution in mice, establishing proof of concept for replacement of HBA1 with HBB as a novel therapeutic strategy for curing β-thalassemia.
β-Thalassemia is one of the most common genetic blood disorders in the world, with a global annual incidence of 1 in 100,000 (ref. 1). Patients with this disease suffer from severe hemolytic anemia and, even with intensive medical care, experience a median life expectancy of approximately 30 years of age2,3. The most severe form—β-thalassemia major—is caused by homozygous (or compound heterozygous) loss-of-function mutations throughout the HBB gene. This results in loss of HBB protein, reducing the ability of red blood cells (RBCs) to deliver oxygen throughout the body, as well as accumulation of unpaired α-globin (from HBA1 and HBA2 genes), leading to dramatic erythrotoxicity and ultimately hemolysis. In fact, disease severity is known to be directly correlated with the degree of imbalance between β- and α-globin chains4. The current standard of care for β-thalassemia involves frequent blood transfusions and/or iron chelation therapy, making this one of the most costly genetic diseases in young adults5. Currently, the only curative strategy for this disease is allogeneic hematopoietic stem cell transplantation (HSCT) from an immunologically matched donor. However, the majority of cases do not have a matched donor and, even if available, transplants carry a high risk of immune rejection and graft-versus-host disease6.
An ideal treatment would therefore involve the isolation of patient-derived HSPCs and the introduction of HBB to restore hemoglobin production, followed by autologous HSCT of the patient’s own corrected HSPCs—thereby addressing the shortage of donors with little risk of immune rejection. Employing this logic, several gene therapies have been developed as a potentially curative measure for β-thalassemia, primarily through delivery of an HBB transgene using lentiviral vectors7-9. While these approaches have been shown to restore HBB to therapeutic levels in human clinical trials for β-thalassemia10, in one case this was achieved from a single, dominant clone11. And, while no adverse events have occurred after a multi-year follow-up, integrations into tumor suppressors such as NF1 are commonly observed, leading to safety concerns regarding semirandom transgene integration into the genome12.
Alternative strategies that rely on the reported safety13,14 of more precise genomic changes are thus being developed, such as clustered regularly interspaced short palindromic repeat (CRISPR)/Cas9-mediated inactivation of a repressor of the fetal precursor to β-globin, γ-globin, upregulation of which could compensate for the lack of HBB15. However, there is some concern that this upregulation of fetal hemoglobin may not be sufficient to rescue the β-globin:α-globin imbalance and that upregulation may not persist over the long term in adult patients in whom fetal hemoglobin is naturally silenced16,17. Moreover, this approach does not address the genetic cause of β-thalassemia—inactivation of HBB—and may not sufficiently rescue the disease phenotype in vivo. Furthermore, all of these therapies act to compensate only for the lack of HBB and do not diminish the levels of α-globin. This led us to explore whether Cas9/AAV6-mediated genome editing could be used to address both molecular factors responsible for disease pathology in a patient’s own HSPCs, which may be an effective and safe strategy to restoring the β-globin:α-globin balance and ultimately correcting β-thalassemia.
In this study we have leveraged the combined Cas9/AAV6 genome editing method to mediate site-specific gene replacement of the endogenous HBA1 gene with a full-length HBB transgene, while leaving the highly homologous HBA2 gene unperturbed. We found that this process allowed us to replace the entire coding region of HBA1 with an HBB transgene at high frequencies, which both normalized the β-globin:α-globin imbalance in β-thalassemia-derived HSPCs and rescued functional adult hemoglobin tetramers in RBCs. Following transplantation experiments into immunodeficient NOD scid gamma (NSG) mice, we found that edited HSCs were able to repopulate the hematopoietic system in vivo and could potentiate long-term engraftment, indicating that the editing process does not disrupt normal hematopoietic stem cell function.
We demonstrate a single Cas9-induced, double-strand break (DSB)-mediated replacement of an entire endogenous gene with an exogenous transgene at high frequencies. Because of this, we expect our findings to be broadly applicable to a wide variety of monogenic diseases caused by loss-of-function mutations scattered throughout a particular gene, ultimately expanding the genome editing toolbox.
Results
Cas9/AAV6-mediated genome editing is a robust system capable of introducing large genomic integrations at high frequencies across many loci in a wide variety of cell types, including HSPCs18-23. While CRISPR-mediated approaches have been successfully employed to correct disease-causing, single-nucleotide polymorphisms at high frequencies in HSPCs22-27, β-thalassemia is caused by loss-of-function mutations scattered throughout the gene rather than a single polymorphism. Therefore, a universal correction scheme for all patients requires delivery of a full-length copy of the missing gene, HBB in this case. Although the simplest method for doing so would be to knock in a functional HBB transgene at the endogenous locus, this approach would not be viable for patients with disease caused by large deletions or mutations in regulatory regions (Extended Data Fig. 1)28. Therefore, to develop a universal treatment for this disease, we must deliver an HBB transgene elsewhere in the genome.
Previous work has shown that patients with β-thalassemia and lowered α-globin levels demonstrate a less severe disease phenotype4,29. Therefore, knock-in of full-length HBB at the α-globin locus could most effectively allow us to improve the β-globin:α-globin imbalance in a single genome editing event.
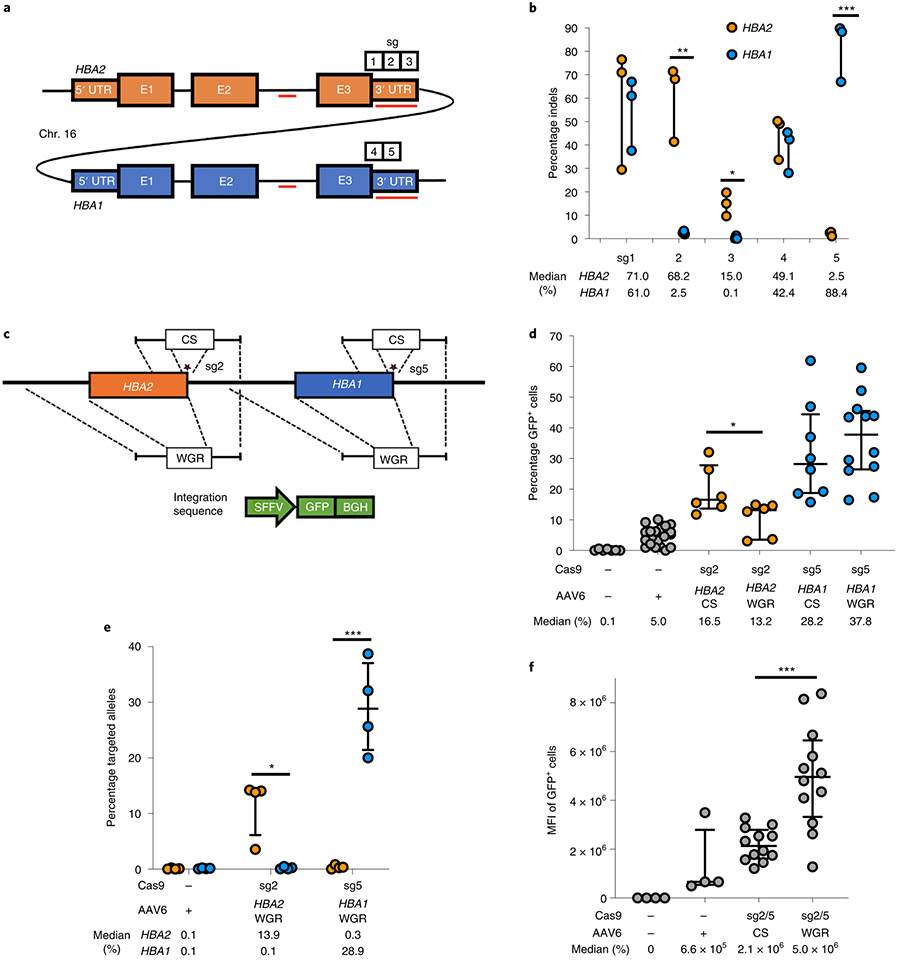
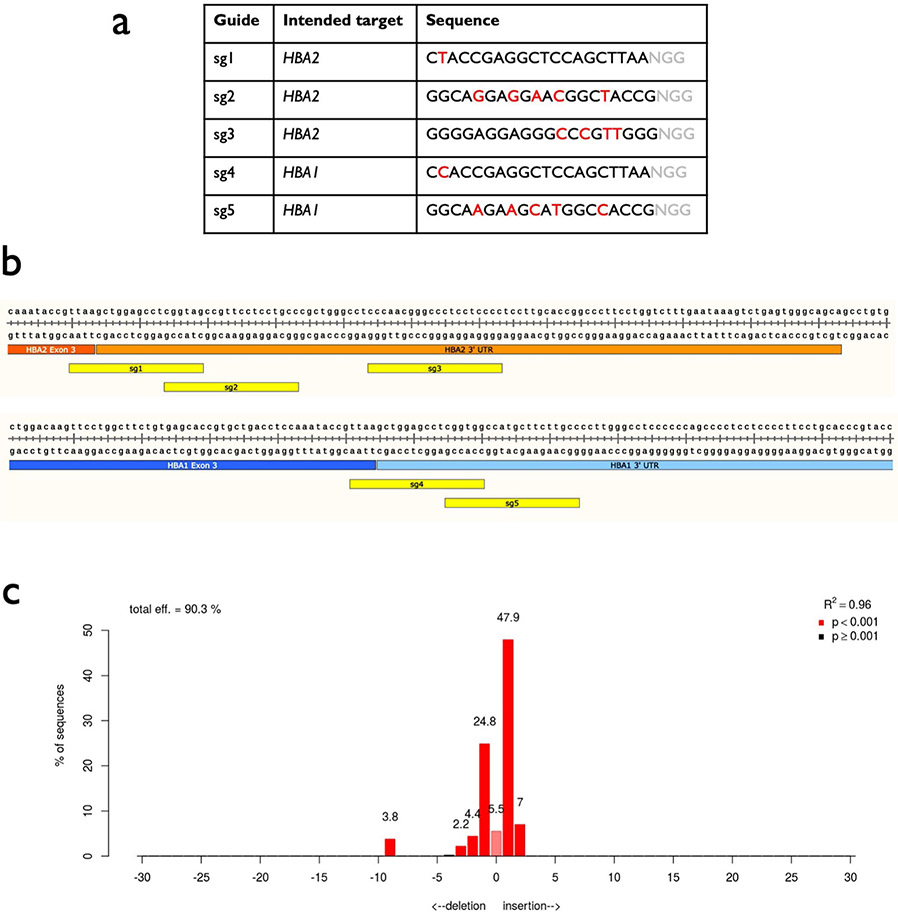
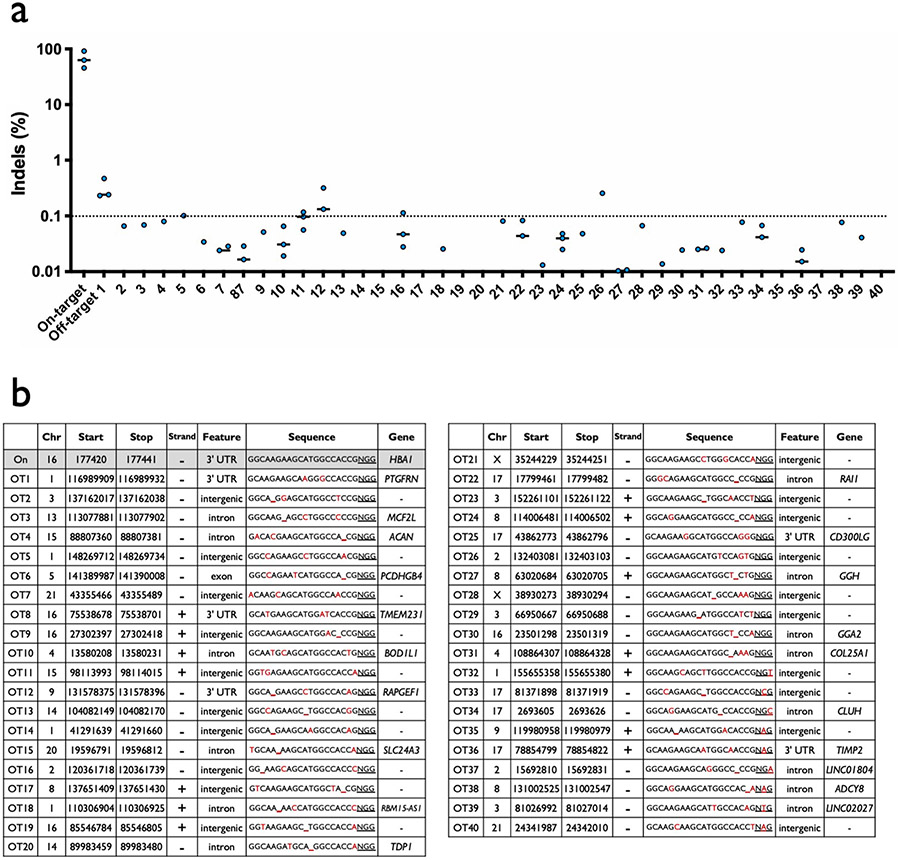
Because α-globin is expressed from two genes (HBA1 and HBA2) as HSPCs differentiate into RBCs, we hypothesized that site-specific replacement of a single α-globin gene with HBB could allow us to achieve RBC-specific expression of HBB without eliminating critical α-globin production. Alhough the HBA1 and HBA2 genes are highly homologous, we were able to identify a limited number of Cas9 single-guide RNA sites (termed sg1–5) in the 3′ untranslated region (UTR) that would be expected to cleave one α-globin gene and not the other (Fig. 1a and Extended Data Fig. 1a,b). We then delivered each chemically modified sgRNA30 precomplexed with Cas9 ribonucleoprotein (RNP) to human CD34+ HSPCs by electroporation, to determine which of the five sgRNAs could most efficiently and specifically induce insertions/deletions (indels) at the intended gene. We then PCR amplified the 3′ UTR regions of both HBA2 and HBA1 and quantified indel frequencies of the corresponding Sanger sequences using tracking of indels by decomposition analysis31. We found that four of the five guides induced indels at high frequencies; two were capable of distinguishing between the two genes (sg2 cuts HBA2 and sg5 cuts HBA1) and two were not (sg1 and sg4 cut both HBA2 and HBA1) (Fig. 1b and Extended Data Fig. 1a). To determine the off-target activity of the most effective of these sgRNAs, sg5, we performed targeted sequencing post editing of the top 40 sites predicted by COSMID32 in three separate HSPC donors. This determined that the HBA1-specific sg5 was extremely specific, with only two sites showing activity >0.1% (Extended Data Fig. 2).
Fig. 1 ∣. sgRNA and AAV6 design for editing at the α-globin locus.
a, Schematic of HBA2 and HBA1 gDNA. Sequence differences between the two genes are depicted as red lines. Locations of the five prospective sgRNAs are indicated. b, Indel frequencies for each guide at HBA2 and HBA1 in human CD34+ HSPCs are depicted in orange and blue, respectively. Bars represent median ± interquartile range. n = 3 for each treatment group. *P = 0.0083, **P = 0.0037, ***P = 0.00042 by unpaired two-tailed t-test. c, AAV6 DNA repair donor design schematics for the introduction of a SFFV-GFP-BGH integration are depicted at HBA2 and HBA1 loci. Stars denote Cas9 cleavage sites for sg2 and sg5 within HBA2 and HBA1, respectively. d, Percentage of GFP+ cells using HBA2- and HBA1-specific guides and CS and WGR GFP integration donors, as determined by flow cytometry. Bars represent median ± interquartile range. Values represent biologically independent HSPC donors: n = 7 for mock, n = 20 for AAV only, n = 6 for HBA2-editing vectors, n = 8 for HBA1 CS vector and n = 12 for HBA1 WGR vector. *P = 0.042 by unpaired two-tailed t-test. e, Targeted allele frequency at HBA2 and HBA1 by ddPCR for determination of whether off-target integration occurs at the unintended gene. Bars represent median ± interquartile range. n = 4 biologically independent HSPC donors for each treatment group. *P = 0.0052, ***P = 0.00039 by unpaired two-tailed t-test. f, MFI of GFP+ cells across each targeting event as determined by the BD FACS Aria II platform. Bars represent median ± interquartile range. n = 4 biologically independent HSPC donors for mock and AAV-only treatments, and n = 12 for CS and WGR treatment groups. ***P = 0.00026 by unpaired two-tailed t-test. E1–3, exons 1–3.
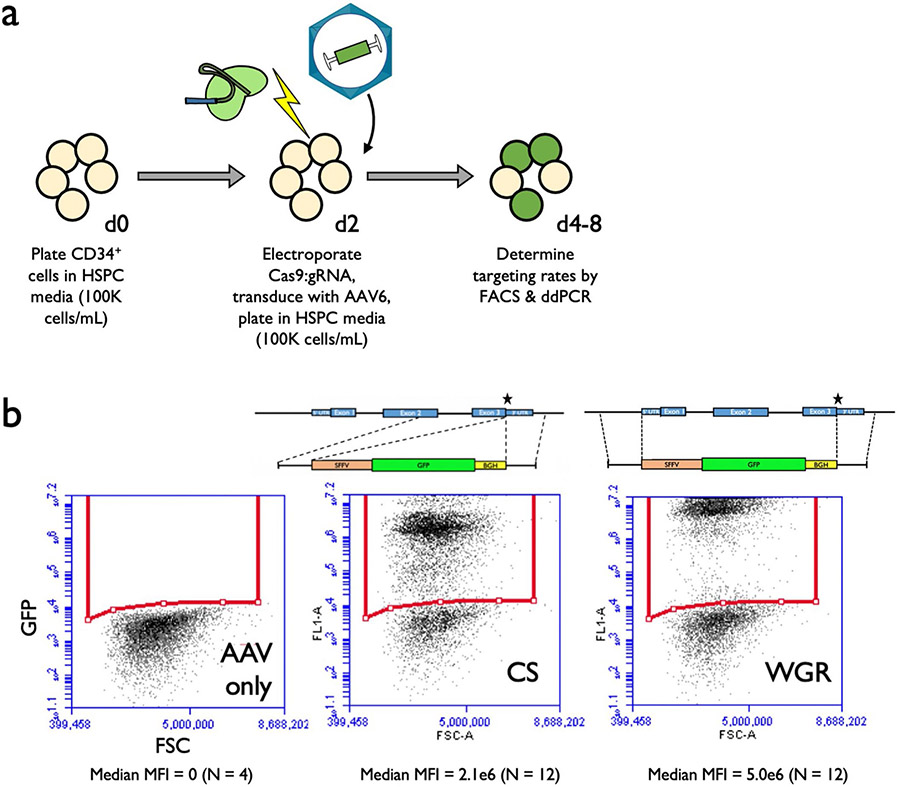
Following identification of HBA1- and HBA2-specific guides, we proceeded to test the frequency of AAV6-mediated homologous recombination (HR) at these loci. To do so, we designed AAV6 repair template vectors that would integrate a green fluorescent protein (GFP) expression cassette using 400-base pair (bp) homology arms immediately flanking the Cas9 RNP-induced cut site (hereafter termed CS vectors) (Fig. 1c). As before, we delivered the most specific guides (sg2 to target HBA2 and sg5 to target HBA1) complexed with Cas9 RNP by electroporation into human CD34+ HSPCs. Because of electroporation-aided transduction33, we added each AAV6 vector immediately following electroporation to maximize transduction. Several days later, we analyzed targeting frequencies by flow cytometry (Extended Data Fig. 3a) and found that CS vectors efficiently integrated at both HBA2 and HBA1 in CD34+ HSPCs (median of 16.5 and 28.2% of cells were GFP+, respectively) (Fig. 1d). However, the predicted cut sites for both guides reside 13 bp downstream of the stop codon, and the indel spectrum for sg5 indicates that 99.8% of detected indels occur within 9 bp of the cut site (Extended Data Fig. 1c). Consequently, this approach would not ensure knockout of either α-globin gene following HR. Therefore we also cloned repair template vectors with a left homology arm split off from the cut site, spanning the immediate 400 bp upstream of the start codon of each gene. We hypothesized that this approach might facilitate full replacement of the coding region of each α-globin gene, thereby reducing α-globin production and allowing transgene expression to be driven by the endogenous α-globin promoter (hereafter termed whole-gene replacement (WGR) vectors) (Fig. 1c). We found that splitting off the left homology arm in the WGR strategy significantly reduced editing frequency at HBA2 (median of 16.5 versus 13.2%, P < 0.05) (Fig. 1d). Surprisingly, this effect appeared to be locus dependent because the WGR strategy at HBA1 did not yield a coordinated decrease in editing frequency (median of 28.2 versus 37.8%) (Fig. 1d). Because the left homology arms were identical in each WGR vector, we used droplet digital PCR (ddPCR) to confirm that our editing events were specific only into the intended gene and correlated well with our targeting frequencies as determined by GFP expression (Fig. 1e). Notably, we found that the mean fluorescence intensity (MFI) of GFP+ cells was significantly higher for WGR vectors compared to CS vectors (P < 0.0005) (Fig. 1f and Extended Data Fig. 3b).
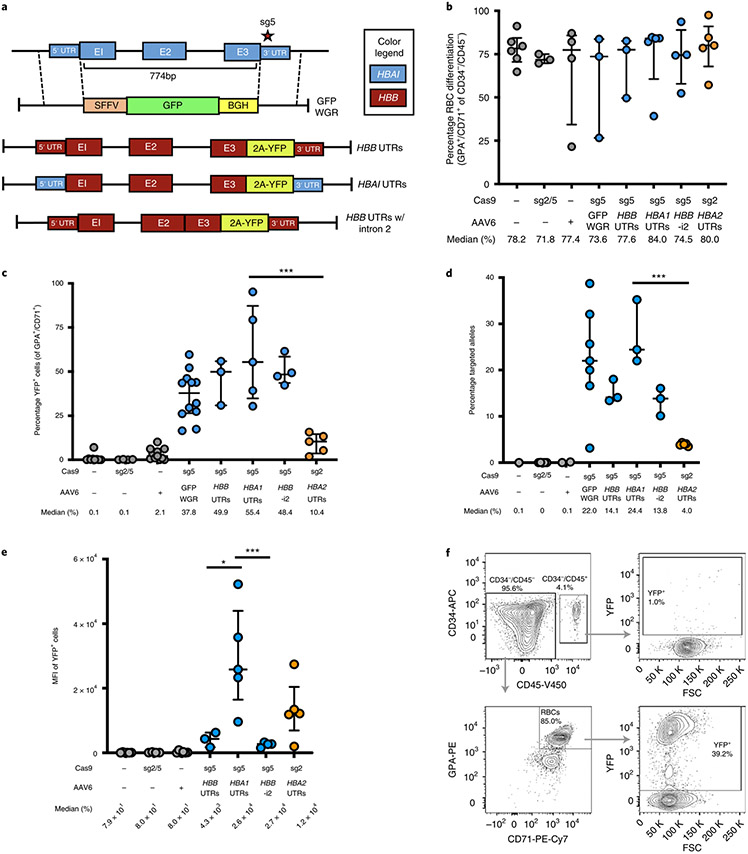
Due to the advantages of WGR vectors, we next adapted this scheme to replace the HBA1 locus with a full-length HBB transgene. To track transgene expression we included a T2A-yellow fluorescent protein (YFP) sequence at the C terminus of HBB, enabling fluorescent readout of editing frequencies and a surrogate for HBB protein levels. To determine the impact of regulatory and intronic regions, we designed a variety of AAV6 repair template vectors (Fig. 2a). We then targeted HSPCs as previously described, differentiated cells into erythrocytes using an established protocol34,35 and determined targeting frequencies and expression levels by flow cytometry (Supplementary Fig. 2 and Extended Data Fig. 4a). We found that (1) targeting at HBA1 and HBA2 had no discernible bearing on the ability of HSPCs to differentiate into RBCs compared to mock (that is, electroporation only), RNP-only and AAV-only controls (Fig. 2b); (2) HBA1 UTRs most efficiently mediated editing, as quantified by both flow cytometry and ddPCR (median of 55.4% YFP+ cells) (Fig. 2c,d); (3) MFI of YFP+ cells was significantly greater for the HBA1 UTR vector compared to either vector with HBB UTRs (P < 0.05) (Fig. 2e and Extended Data Fig. 4b); and (4) YFP was expressed only in GPA+/CD71+ RBCs (Fig. 2f). These results indicate that HBA1 is an effective and safe harbor site for achieving high levels of RBC-specific transgene expression while leaving α-globin production from HBA2 unperturbed.
Fig. 2 ∣. WGR of α-globin using a promoterless reporter.
a, AAV6 donor design for integration of HBB-T2A-YFP at the HBA1 locus. b, Percentage of CD34−/CD45− HSPCs acquiring RBC surface markers—GPA and CD71—as determined by flow cytometry. Bars represent median ± interquartile range. Values represent biologically independent HSPC donors: n = 6 for mock; n = 3 for RNP only, GFP WGR and HBB UTRs; n = 4 for AAV only and HBB UTRs without intron 2 (HBB-i2); and n = 5 for HBA1 UTRs and HBA2 UTRs. c, Percentage of GFP+ cells as determined by flow cytometry. Bars represent median ± interquartile range. Values represent biologically independent HSPC donors: n = 9 for mock; n = 4 for RNP only and HBB UTRs without intron 2; n = 11 for AAV only; n = 12 for GFP WGR; n = 3 for HBB UTRs; and n = 5 for HBA1 and HBA2 UTRs. ***P = 0.0035 by unpaired two-tailed t-test. d, Targeted allele frequency in bulk edited population as determined by ddPCR. Bars represent median ± interquartile range. Values represent biologically independent HSPC donors: n = 1 for mock; n = 5 for RNP only; n = 2 for AAV only; n = 7 for GFP WGR; n = 3 for HBB, HBA1 and HBB UTRs without intron 2; and n = 5 for HBA2 UTRs. ***P = 0.00023 by unpaired two-tailed t-test. e, MFI of GFP+ cells for each treatment as determined by the BD FACS Aria II platform. Values represent biologically independent HSPC donors: n = 6 for mock and AAV only; n = 4 for RNP only and HBB UTRs without intron 2; n = 3 for HBB UTRs; and n = 5 for HBA1 and HBA2 UTRs. Bars represent median ± interquartile range. *P= 0.037, ***P = 0.012 by unpaired two-tailed t-test without adjustment for multiple comparisons. f, Representative flow cytometry staining (FCS) and gating scheme for human HSPCs targeted at HBA1 with HBA1 UTRs donor and differentiated into RBCs. This indicates that only RBCs (CD34−/CD45−/CD71+/GPA+) are able to express the integrated T2A-YFP marker. E1–3, exons 1–3. K, 1,000.
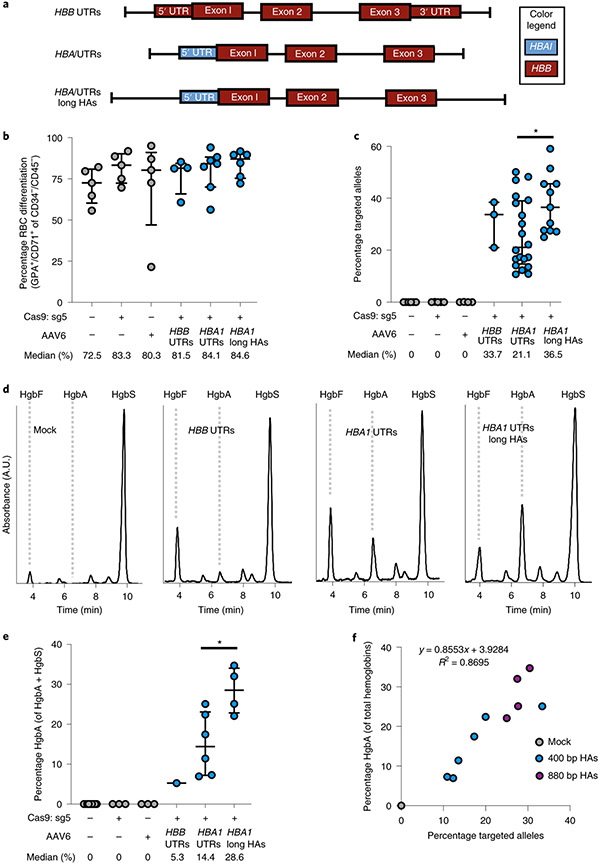
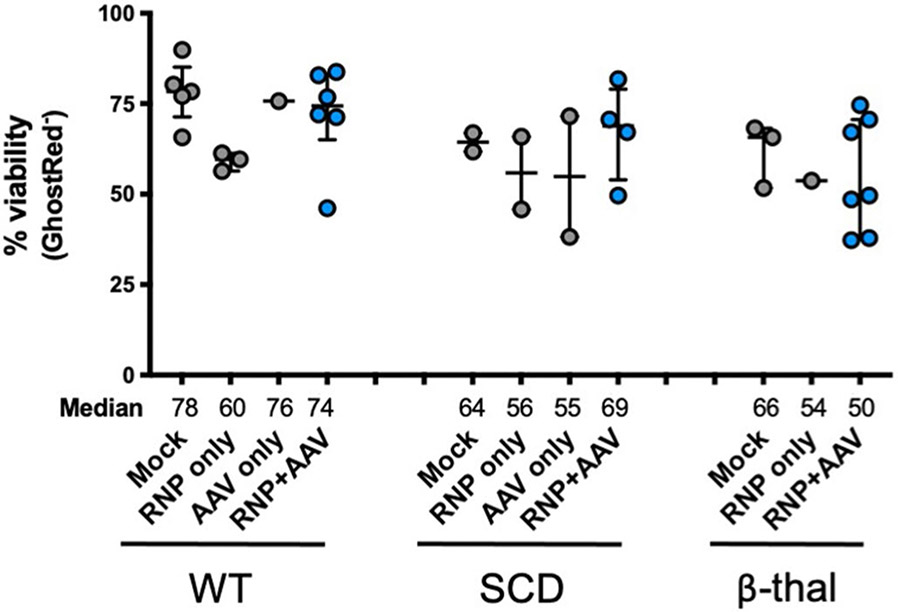
To confirm the production of β-globin protein following targeted replacement of HBA1, we designed HBB transgene vectors without T2A-YFP reporters that were flanked by either HBB or HBA1 UTRs (Fig. 3a). We also created gene replacement vectors with lengthened left and right homology arms, hypothesizing that doing so could help the cell identify regions of homology—particularly within the left arm split off from the cut site—thereby increasing editing frequency (Supplementary Fig. 3). To screen these vectors, we used sickle cell disease (SCD)-derived CD34+ HSPCs because these exclusively express sickle hemoglobin (HgbS), which would allow us to determine the degree of adult hemoglobin (HgbA) rescue following editing. Therefore, SCD HSPCs were targeted, differentiated into RBCs and analyzed for editing frequency and hemoglobin tetramers using ddPCR and high-performance liquid chromatography (HPLC), respectively. These experiments indicated that editing had no notable bearing on either cell viability or RBC differentiation 2–4 days post editing (Extended Data Fig. 5 and Fig. 3b). We also found that gene replacement frequency was significantly improved by lengthening the homology arms to ~900 bp, increasing targeted alleles from a median of 21.1 to 36.5% in the bulk population (P < 0.05) (Fig. 3c), which is expected to correspond to 48.7% of cells having undergone at least one editing event (Extended Data Fig. 6). When RBCs were analyzed for human hemoglobin by HPLC, we found that all three vectors yielded HgbA tetramers (Fig. 3d). As predicted by the T2A-YFP reporters, the vector with local HBA1 UTRs yielded a greater amount of HgbA tetramers, indicating that the T2A-YFP system is highly predictive of transgene expression. We also found that elongated homology arms not only resulted in significantly higher editing frequencies, but also yielded a significantly greater percentage of HgbA tetramers (P < 0.05) (Fig. 3e). As expected, we found a strong correlation between targeting frequency and HgbA tetramer production (R2 = 0.8695) (Fig. 3f), indicating that every HBB-targeted HBA1 allele is contributing to endogenous protein levels.
Fig. 3 ∣. WGR of α-globin with β-globin in SCD HSPCs.
a, AAV6 donor design for integration of a WGR HBB transgene at the HBA1 locus. b, Percentage of CD34−/CD45− HSPCs acquiring RBC surface markers—GPA and CD71—as determined by flow cytometry. Bars represent median ± interquartile range. Values represent biologically independent HSPC donors: n = 5 for mock, RNP only and AAV only; n = 4 for HBB UTRs; n = 7 for HBA1 UTRs; and n = 6 for HBA1 UTRs long HAs (HBA1 long HAs). c, Targeted allele frequency in bulk edited population at HBA1 as determined by ddPCR. Bars represent median ± interquartile range. Values represent biologically independent HSPC donors: n = 6 for mock, n = 5 for RNP only, n = 4 for AAV only, n = 3 for HBB UTRs, n = 20 for HBA1 UTRs and n = 11 for HBA1 UTRs long HAs. *P = 0.021 by unpaired two-tailed t-test. d, Representative HPLC plots for each treatment following targeting and RBC differentiation of human SCD CD34+ HSPCs. Retention times for HgbF, HgbA and HgbS tetramer peaks are indicated. e, Percentage HgbA of total hemoglobin tetramers. Bars represent median ± interquartile range. Values represent biologically independent HSPC donors: n = 9 for mock, n = 3 for RNP only and AAV only, n = 1 for HBB UTRs, n = 6 for HBA1 UTRs and n = 4 for HBA1 UTRs long HAs. *P = 0.019 by unpaired two-tailed t-test. f, Correlation between percentage HgbA and percentage targeted alleles in edited SCD HSPCs differentiated into RBCs and analyzed by HPLC. n = 11 biologically independent HSPC donors. A.U., arbitrary units.
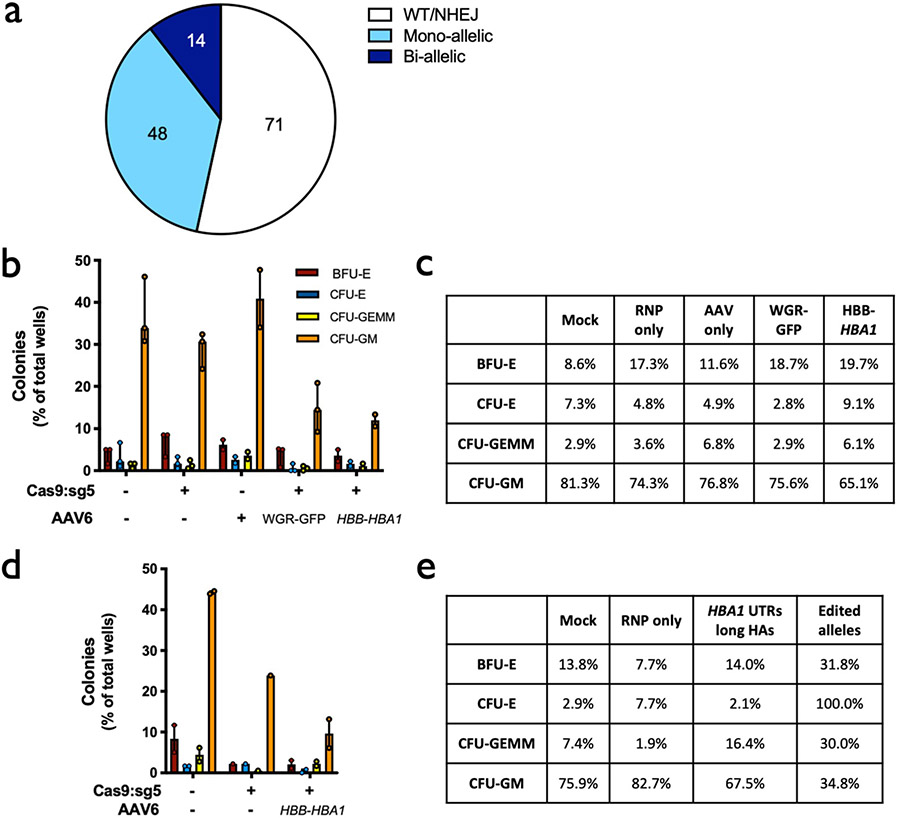
To determine whether editing impacts the ability of HSPCs to engraft and reconstitute myeloid and lymphoid lineages in vivo, we performed bone marrow transplantation experiments with human HSPCs targeted at the HBA1 locus into immune-compromised NSG mice. To replicate the clinical HSCT process as closely as possible, HSPCs from healthy donors were mobilized using G-CSF and Plerixafor12, enriched using bead-mediated CD34 selection and targeted with the HBB vector with HBA1 UTRs. Two days post editing, live CD34+ HSPCs were single-cell sorted into 96-well plates containing methylcellulose media and scored for colony-formation ability after 14 days, which indicated that edited HSPCs were able to give rise to cells of all lineages (Extended Data Fig. 7a-c). Although the editing process appears to reduce the total number of colonies, reduction is primarily due to the ability to form colonies in the granulocyte/macrophage lineage without impacting multilineage and erythroid lineage colony formation and their relative distribution.
The remaining bulk population of edited cells was injected intrafemorally into immunodeficient NSG mice that had been irradiated to clear the hematopoietic stem cell niche in the bone marrow (Supplementary Fig. 4). The experiment was performed on three healthy HSPC donors and, due to variable expansion rates, the total numbers of cells for transplantation varied among replicates. We therefore designated these as large, medium and small doses, corresponding to an injection of 1.3 × 10⁶, 7.5 × 10⁵ and 2.5 × 10⁵ cells per mouse, respectively.
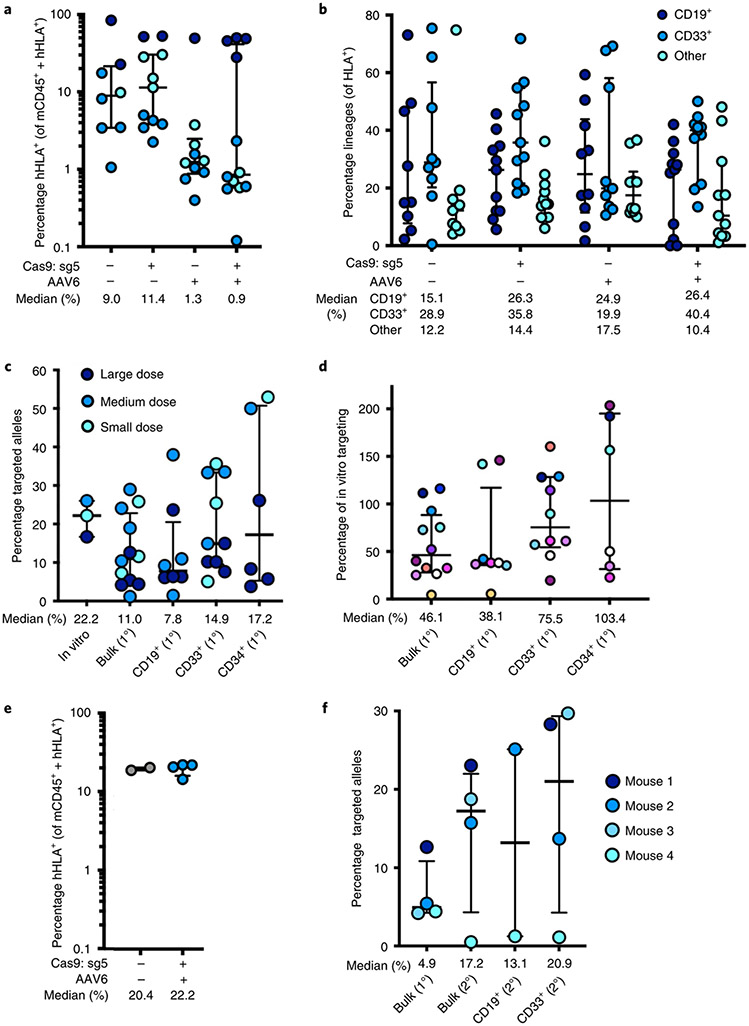
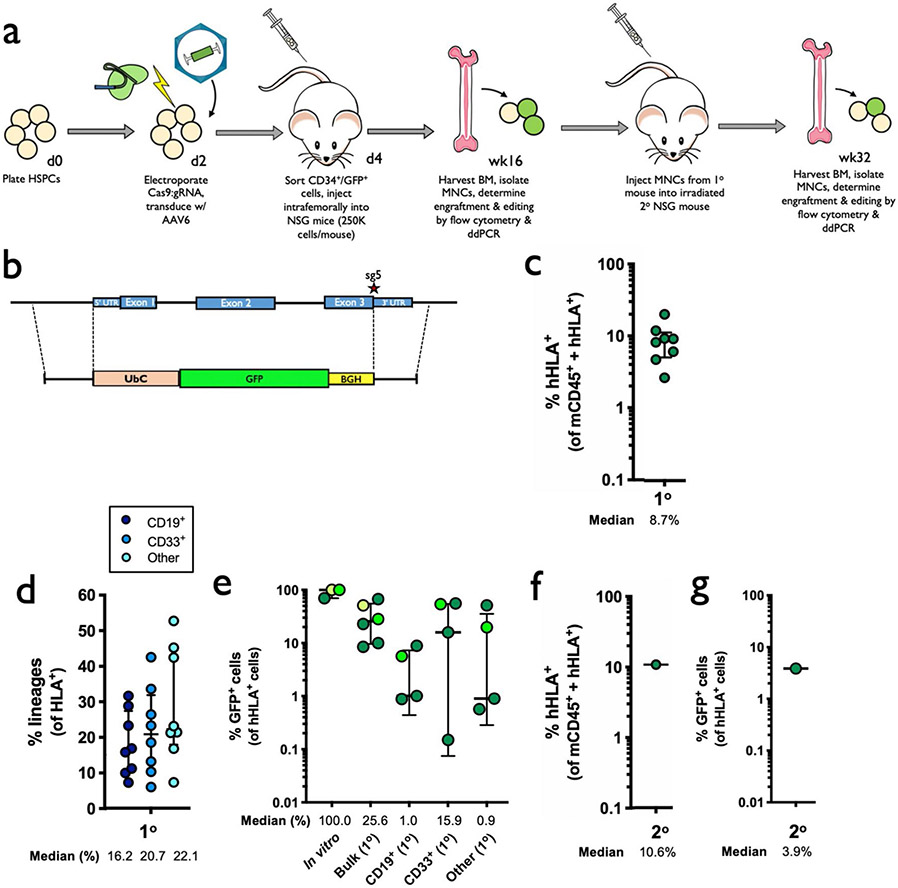
Sixteen weeks post transplantation, bone marrow from these mice was harvested and engraftment of human cells was determined using human HLA-A/B/C as a marker (Supplementary Fig. 5). We found that all treatment groups were able to successfully engraft into the bone marrow (Fig. 4a). While engraftment was negatively impacted in AAV-only and RNP + AAV treatments in medium and small doses as observed previously21,24, this effect was ameliorated by transplanting a greater number of cells. We also found that editing had no discernible impact on distribution among myeloid and lymphoid lineages in vivo (Fig. 4b). We next used ddPCR to determine that a mean of 11.0% of total alleles within our bulk population of engrafted HSPCs were targeted (Fig. 4c), which would be expected to correspond to 18.2% of cells having undergone at least one editing event (Extended Data Fig. 6). We also lineage-sorted engrafted cells into CD19+ (lymphoid), CD33+ (myeloid) and Lin−/CD34+/CD10− (HSPC) populations, and determined that editing occurred in all three subpopulations (median of 7.8, 14.9 and 17.2% edited alleles, respectively). We observed a modest reduction in targeted allele frequency among the pretransplantation population compared to cells that successfully engrafted (Fig. 4d), which is in line with previous studies22,24 and much less severe than recently reported by Pattabhi et al.25. In addition to editing with the clinically relevant HBB vector, we also targeted cells with a WGR repair template cassette to replace the HBA1 gene with a GFP expressed by the strong UbC promoter (Extended Data Fig. 8a-e), and observed successful engraftment and editing among transplanted cells.
Fig. 4 ∣. Engraftment of α-globin-targeted human HSPCs into NSG mice.
a, Sixteen weeks after transplantation of edited human CD34+ HSPCs into mice, bone marrow was harvested and engraftment rates were determined. Depicted is the percentage of mTerr119− cells (non-RBCs) that were hHLA+ among the total number of mCd45+ or hHLA+ cells. Bars represent median ± interquartile range. Values represent biologically independent transplantations: n = 8 for mock, n = 11 for RNP only, n = 10 for AAV only and n = 12 for RNP + AAV. b, Among engrafted human cells, distribution among CD19+ (B-cell), CD33+ (myeloid) and other (that is, HSPC/RBC/T/NK/Pre-B) lineages. Bars represent median ± interquartile range. Values represent biologically independent transplantations: n = 9 for mock, n = 11 for RNP only and RNP + AAV and n = 10 for AAV only. c, Targeted allele frequency at HBA1 as determined by ddPCR among in vitro (pretransplantation) HSPCs and bulk engrafted HSPCs, as well as among lineages. Bars represent median ± interquartile range. n = 3 for in vitro HSPCs, n = 12 for bulk engrafted HSPCs, n = 8 for CD19+ HSPCs, n = 10 for CD33+ HSPCs and n = 6 for CD34+ HSPCs. d, Targeted allele frequency at HBA1 among engrafted human cells compared to targeting rate pretransplantation in an in vitro human HSPC population. Individual mice are represented by different colors. Bars represent median ± interquartile range. n = 12 for bulk engrafted HSPCs, n = 8 for CD19+ HSPCs, n = 10 for CD33+ HSPCs and n = 6 for CD34+ HSPCs. e, 16 weeks post secondary transplantation, bone marrow was harvested and engraftment rates were determined as above. Bars represent median ± interquartile range. n = 2 for mock and n = 4 for edited treatment groups. f, Targeted allele frequency at HBA1 determined by ddPCR among engrafted human cells in bulk sample and lineages in secondary transplantations. Bars represent median ± interquartile range. n = 4 for each treatment group, with the exception of CD19+ HSPCs (n = 2). Large, medium and small doses correspond to 1,300,000, 750,000 and 250,000 transplanted cells, respectively. 1° and 2° indicate analysis of engraftment human cells harvested from primary or secondary mouse transplantations, respectively.
After harvesting of cells that successfully engrafted in the initial transplantation experiment, we intravenously injected a subset of cells into secondary recipient mice to determine whether editing events are stable in the long term. Indeed, both the mock electroporation treatment and cells targeted with Cas9 RNP + AAV6 were able to engraft at >20% (Fig. 4e). We then used ddPCR to confirm that editing frequency among successfully engrafted cells in secondary recipient mice was in line with the frequencies observed among engrafted cells in the initial transplantation experiment (Fig. 4f). These results were further confirmed by secondary transplantations using our WGR GFP vector, which demonstrated that GFP+ cells were able to engraft in the long term (Extended Data Fig. 8f,g).
Having demonstrated our ability to achieve stable gene replacement frequencies at the HBA1 locus in long-term repopulating HSCs derived from WT donors, we sought to determine the effects of our methodology on β-thalassemia-derived HSPCs. To do so, CD34+ cells were isolated from back-up Plerixafor- and Filgrastim-mobilized peripheral blood saved from patients with β-thalassemia and who were undergoing allogeneic HSCT. As previously, we expanded and targeted these HSPCs using the HBA1 UTR vectors (Fig. 3a) and sorted single, live CD34+ HSPCs into each well of 96-well plates for colony-formation assays. Once again, we found that edited HSPCs were able to give rise to cells of all lineages (Extended Data Fig. 7d,e). Although no lineage skewing was apparent, the overall ability of edited β-thalassemia-derived HSPCs to form colonies appeared to be slightly reduced, which is in line with previous reports36.
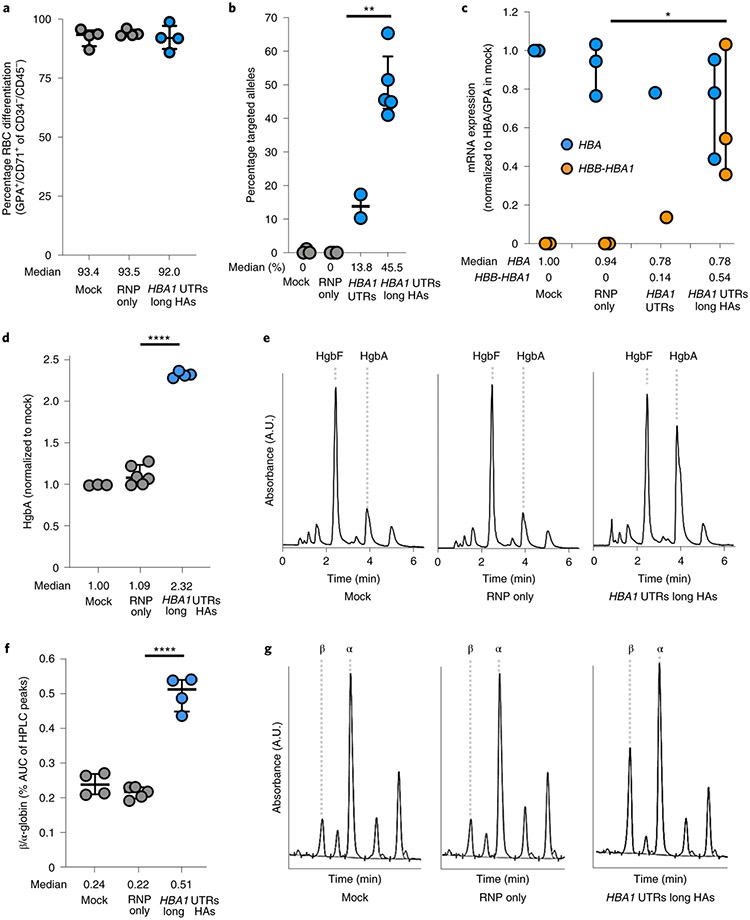
In addition to colony-formation assays, a subset of targeted HSPCs were subjected to RBC differentiation 2 days post editing. As before, we found that editing had no discernible bearing on either cell viability or RBC differentiation capacity post editing (Extended Data Fig. 5 and Fig. 5a). As shown previously, ddPCR confirmed that elongation of homology arms significantly improved editing frequencies (13.8 versus 45.5%, P < 0.005) (Fig. 5b), which is expected to correspond to 63.8% of cells having undergone at least one editing event (Extended Data Fig. 6). To gain insight into the effect of editing on the expression of α- and β-globin, we designed ddPCR primer/probes to assess mRNA expression of α-globin (not distinguishing between HBA1 and HBA2) as well as our HBB transgene. When expression was normalized to the RBC markers GPA and HBG, we found that differentiated cells edited with the longer homology arm displayed a decrease in α-globin expression and a significant increase in HBB transgene expression compared to RNP-only treatment (P < 0.05) (Fig. 5c and Extended Data Fig. 9a).
Fig. 5 ∣. WGR of α-globin with β-globin in β-thalassemia HSPCs.
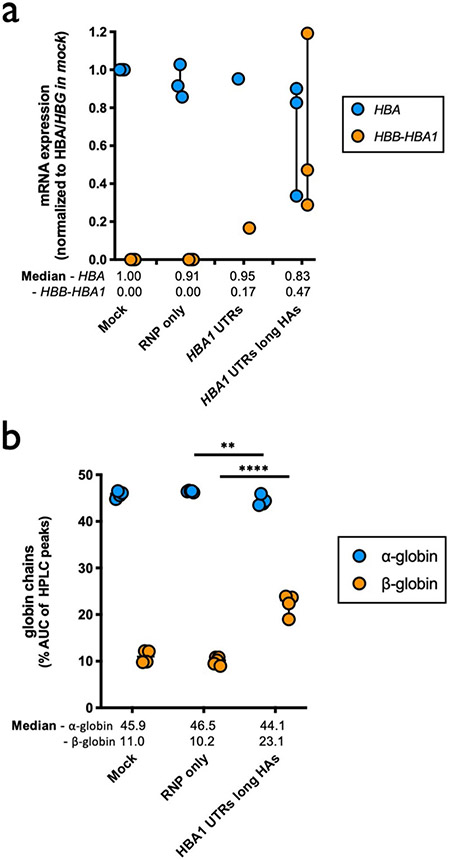
a, Percentage of CD34−/CD45− HSPCs acquiring RBC surface markers—GPA and CD71—as determined by flow cytometry. Bars represent median ± interquartile range. n = 4 for each treatment group. b, Targeted allele frequency at HBA1 in β-thalassemia HSPCs as determined by ddPCR. Bars represent median ± interquartile range. n = 3 for mock, n = 2 for RNP only and HBA1 UTRs and n = 5 for HBA1 UTRs long HAs treatments. **P = 0.0047 by unpaired two-tailed t-test. c, Following differentiation of edited HSPCs into RBCs, mRNA expression was quantified by ddPCR. Expression of transgene HBA (does not distinguish between HBA1 and HBA2) and HBB was normalized to GPA expression. Bars represent median ± interquartile range. n = 3 for each treatment group, with the exception of HBA1 UTRs (n = 1). *P = 0.033 by unpaired two-tailed t-test. d, Summary of hemoglobin tetramer HPLC. Bars represent median ± interquartile range. Values represent biologically independent erythroid differentiations. n = 4 for mock, n = 5 for RNP only and n = 4 for HBA1 UTRs long HAs. ****P < 0.00001 by unpaired two-tailed t-test. e, Representative hemoglobin tetramer HPLC plots for each treatment following editing and RBC differentiation. Retention times for HgbF and HgbA tetramer peaks are indicated. f, Summary of reverse-phase globin chain HPLC results showing AUC of β-/α-globin. Bars represent median ± interquartile range. Values represent biologically independent erythroid differentiations: n = 3 for mock, n = 6 for RNP only and n = 4 for HBA1 UTRs long HAs. ****P = 0.000006 by unpaired two-tailed t-test. g, Representative reverse-phase globin chain HPLC plots for each treatment following targeting and RBC differentiation. Retention times for β- and α-globin peaks are indicated. A.U., arbitrary units.
To confirm these results at the protein level, we harvested edited RBCs and performed hemoglobin tetramer analysis by HPLC. Indeed, we found that cells targeted by our optimized vector with longer homology arms were able significantly to boost HgbA tetramers in vitro (P < 0.0001) (Fig. 5d,e). To investigate the effect of editing at an even greater resolution, we also performed reverse-phase HPLC to determine relative β- and α-globin levels within our treatment groups. As expected, based on mRNA analysis we observed a significant correction of the β-globin:α-globin ratio among edited cells (P < 0.00001) (Fig. 5f,g). This normalization was attributed to a significant increase in both β-globin production (P < 0.0001) and a modest, but also significant, decrease in α-globin (P < 0.005) (Extended Data Fig. 9b).
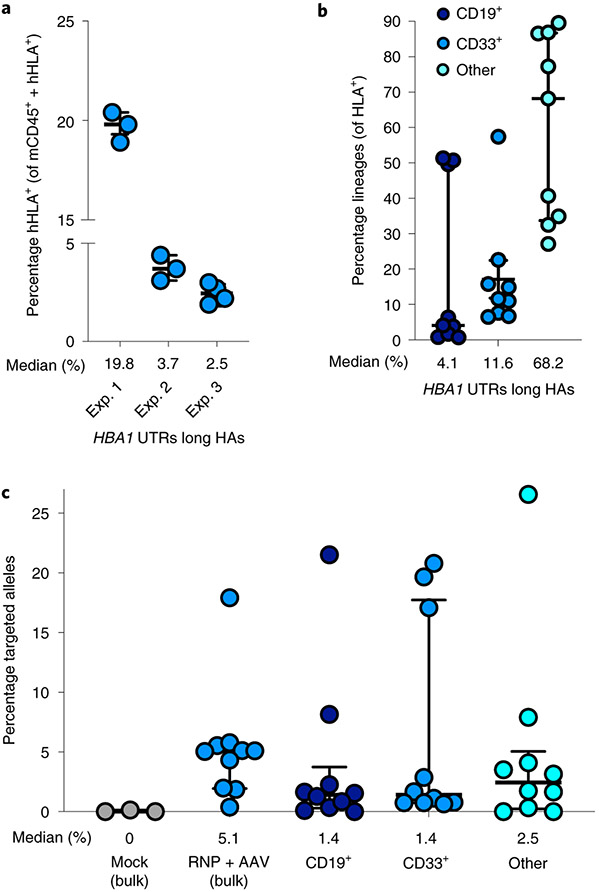
In addition to in vitro RBC differentiation and analysis, we performed engraftment experiments as above by injecting targeted β-thalassemia-derived HSPCs into irradiated NSG mice. Twelve to sixteen weeks post transplantation, we harvested bone marrow and determined engraftment and targeting frequencies by flow cytometry and ddPCR, respectively. We found that edited patient-derived HSPCs targeted were indeed capable of engraftment, with a median of 3.4% human cells in the bone marrow (Fig. 6a), as well as multilineage reconstitution (Fig. 6b). Using ddPCR, we also determined that successfully engrafted cells were edited in the bulk population at a median frequency of 5.1% edited alleles as well as in CD19+, CD33+ and ‘Other’ lineages, at median frequencies of 1.4, 1.4 and 2.5%, respectively (Fig. 5c).
Fig. 6 ∣. Engraftment of α-globin-targeted β-thalassemia HSPCs into NSG mice.
a, Sixteen weeks after transplantation of targeted β-thalassemia HSPCs into mice, bone marrow was harvested and rates of engraftment were determined. Depicted are percentages of mTerr119− cells (non-RBCs) that were hHLA+ among the total number of mCd45+ or hHLA+ cells. Exp. 1–3 denote three separate mouse transplantation experiments of edited patient-derived HSPCs. Bars represent median ± interquartile range. n = 10 independent mouse transplantations. b, Among engrafted human cells, distribution is shown among B-cell, myeloid and other (that is, HSPC/RBC/T/NK/Pre-B) lineages. Bars represent median ± interquartile range. n = 9 independent mouse transplantations. c, Targeted allele frequency at HBA1 determined by ddPCR among engrafted human cells in bulk sample and lineages. Bars represent median ± interquartile range. n = 3 for mock treatment group and n = 10 for targeted treatment group.
Discussion
In summary, the above results describe a novel genome editing protocol for the treatment of β-thalassemia that addresses both molecular factors responsible for the disease—loss of β-globin and accumulation of excess α-globin—in a single genome editing event. Previous data indicate that approximately 25% of edited cell chimerism in the bone marrow appears to be the threshold by which transfusion independence is achieved in patients with thalassemia37. In our study, we found that our gene correction frequency among engrafted patient-derived cells fell short of this benchmark, at 5% of edited alleles in the bulk population, which translates to nearly 10% of human cells in the bone marrow that harbor at least one corrected allele. While perhaps not curative, these correction frequencies may be expected to yield substantial clinical benefit to patients with β-thalassemia. Andreani et al.38, for example, showed that in the allogeneic setting, 20–25% donor mixed chimerism could result in a total HgbA of 9.3 g dl−1 (ref. 38). Thus it is possible that transfusion independence might occur in the autologous setting, with 10% of cells having a wild-type HBB gene replace an HBA1 gene.
While the xenogeneic engraftment of human HSPCs into the NSG mouse is the standard model for assessment of human HSPC function in the preclinical setting, it is certainly flawed due to the extreme oligo-/monoclonality of the model22,39,40. In addition, while many groups have observed a two- to tenfold drop in gene-targeting frequency following transplantation of human HSPCs into NSG mice21-24, in a mouse-into-mouse setting there was no such drop41, providing further caution about overinterpretation of human-into-mouse xenogeneic data. We also note that the history of evaluating human HSPCs in mice demonstrates continual improvements over time, with the development of mice that support higher levels of human engraftment (for example, the NSG model represents an improvement over the previous NOD model and it seems that the NSG-SGM3 model represents an even further improvement)42,43.
We believe that the WGR system, which is site specific and uses a patient’s own cells, would address a number of current barriers to treatment by (1) overcoming the shortage of immunologically matched donors; (2) eliminating the need for constant blood transfusions and/or iron chelation therapy; (3) dramatically reducing the likelihood of immune rejection that accompanies allogeneic HSCT; and (4) avoiding the risks of semirandom integration of viral vectors in the genome. For these reasons, the technology we have described addresses the pitfalls of current therapeutic strategies, leading us to conclude that our strategy has the potential to become the new standard of care. However, although much work remains to be done to translate this work to the clinical setting, we believe that this study establishes an important proof of concept for the treatment of the hemoglobinopathies.
Beyond the immediate impact for treatment of β-thalassemia, we believe that the results also have broader relevance to the genome editing field as a whole. The above results represent the ability of a single, Cas9-induced DSB to facilitate replacement of a large genomic region with a custom editing cassette at high frequency. Because most recessive hereditary disease is caused by loss-of-function mutations throughout a particular gene, the scheme we have developed can be adapted into a one-size-fits-all treatment strategy for a wide range of genetic disorders, effectively expanding the genome editing toolbox. The WGR strategy is also a powerful new tool for synthetic biology in which one gene can be swapped into another, thus potentially reprogramming cells with novel circuits.
Our study also showed that the T2A cleavage peptide system coupled with a fluorescent reporter is highly predictive of transgene expression. This demonstrates the utility of the system in the rapid identification of successfully edited cells, and for comparison of a variety of editing vectors (that is, those with different regulatory regions, with or without specific introns and so on). Because patient-derived HSPCs are often difficult to obtain, especially from multiple donors, this T2A screening system allows development of an optimal translational vector in healthy HSPCs that can be validated in patient-derived HSPCs. Lastly, because we have optimized gene replacement at the α-globin locus, which is expressed only in RBCs, this work has characterized a safe harbor locus for delivery of payloads by RBCs, such as therapeutic enzymes and monoclonal antibodies. This will allow future work to replace the HBA1 locus with custom vectors, thereby achieving RBC-specific expression without the risk of knocking out a gene critical to RBC development (because HBA2 remains intact). For these reasons, we expect the findings of this study to guide future genome editing work for the correction of a wide range of genetic disorders and cell engineering applications.
Online content
Any methods, additional references, Nature Research reporting summaries, source data, extended data, supplementary information, acknowledgements, peer review information; details of author contributions and competing interests; and statements of data and code availability are available at https://doi.org/10.1038/s41591-021-01284-y.
Methods
AAV6 vector design, production and purification.
All AAV6 vectors were cloned into the pAAV-MCS plasmid (Agilent Technologies), which contains inverted terminal repeats (ITRs) derived from AAV2. Gibson Assembly MasterMix (New England Biolabs) was used for the creation of each vector as per the manufacturer’s instructions. Cut site vectors were designed such that the left and right homology arms (LHA and RHA, respectively) are immediately flanking the cut site at either the HBA2 or HBA1 gene. WGR vectors have a LHA flanking the 5′ UTR of either the HBA2 or HBA1 gene, while the RHA immediately flanks downstream of its corresponding cut site. The LHA and RHA of every vector is 400 bp, unless otherwise noted, with the vector name (HBA2/HBA1 and CS/WGR) referencing the target integration type and homology arms used, respectively. Within Fig. 1, CS and WGR vectors consisted of a SFFV-GFP-BGH expression cassette. An alternative promoter, UbC, was also used in creating a WGR vector for HBA1 (Supplementary Fig. 10). In Fig. 2, WGR-T2A-YFP vectors consisted of the full-length HBB gene, unless otherwise noted, with a T2A-YFP expression cassette immediately following exon 3 of the HBB gene using the LHA and RHA described previously for WGR. These full-length HBB-T2A-YFP vectors were flanked by either 5′ and 3′ UTRs of HBB, HBA2 or HBA1, as shown in Fig. 2a. In subsequent experiments, for the targeting of SCD or CD34+ HSPCs derived from patients with β-thalassemia, WGR vectors were designed to target the HBA1 site and contained a full-length HBB gene flanked by either HBA1 or HBB UTRs. While the HBB and HBA1 UTR vectors both share 400-bp HAs, the HBA1 UTRs long HAs vector was modified to have 880-bp HAs. Several modifications were made to the production of AAV6 vectors, as previously described44. We seeded 293 T cells (Life Technologies) in ten 15-cm2 dishes at 13–15 × 106 cells per plate; 24 h later, each dish was transfected with a standard polyethylenimine transfection containing 6 μg of ITR-containing plasmid and 22 μg of pDGM6 (gift from D. Russell, University of Washington), which contains the AAV6 cap genes, AAV2 rep genes and Ad5 helper genes. After 48–72 h of incubation, cells were lysed by three freeze–thaw cycles, treated with benzonase (Thermo Fisher Scientific) at 250 U ml−1 and the vector was then purified through iodixanol gradient centrifugation at 48,000 r.p.m. for 2.25 h at 18 °C. Afterwards, full capsids were isolated at the 40–58% iodixanol interface and then stored at 80 °C until further use. As an alternative method, an AAVPro Purification Kit (All Serotypes, Takara Bio USA) was also used following the 48–72-h incubation period, to extract full AAV6 capsids as per the manufacturer’s instructions. AAV6 vectors were titered using a Bio-Rad QX200 ddPCR machine and QuantaSoft software (v.1.7, Bio-Rad) to measure the number of vector genomes, as previously described45.
Culture of CD34+ HSPCs.
Human CD34+ HSPCs were cultured as previously described18,24,33,36,46,47. CD34+ HSPCs were sourced from fresh cord blood (generously provided by the Binns Family program for Cord Blood Research); from frozen cord blood and Plerixafor- and/or G-CSF-mobilized peripheral blood (AllCells and STEMCELL Technologies); from frozen Plerixafor- and/or G-CSF-mobilized peripheral blood from patients with SCD; and from frozen Plerixafor- and Filgrastim-mobilized peripheral blood from a patient with β-thalassemia (compound heterozygous - c.−138C > T and c.92 + 5 G > C). β-Thalassemia-derived HSPCs were collected under protocol no. 14-H-0077 (registered on clinicaltrials.gov, no. NCT02105766), which was approved and is renewed annually by the NHLBI Institutional Review Board (IRB). The patient provided informed consent for the study. CD34+ HSPCs were cultured at 2.5–5 × 10⁵ cells ml−1 in StemSpan SFEM II (STEMCELL Technologies) base medium supplemented with stem cell factor (SCF) (100 ng ml−1), thrombopoietin (100 ng ml−1), FLT3–ligand (100 ng ml−1), IL-6 (100 ng ml−1), UM171 (35 nM), streptomycin (20 mg ml−1) and penicillin (20 U ml−1). Cell incubation conditions were 37 °C, 5% CO2 and 5% O2.
Genome editing of CD34+ HSPCs.
Chemically modified sgRNAs used to edit CD34+ HSPCs at either HBA2 or HBA1 were purchased from Synthego and TriLink BioTechnologies, and were purified by HPLC. The sgRNA modifications added were 2′-O-methyl-3′-phosphorothioate at the three terminal nucleotides of the 5′ and 3′ ends, as described previously30. The target sequences for sgRNAs were as follows: sg1: 5′-CTACCGAGGCTCCAGCTTAA-3′; sg2: 5′-GGCAGGAGGAACGGCTACCG-3′; sg3: 5′-GGGGAGGAGGGCCCGTTGGG-3′; sg4: 5′-CCACCGAGGCTCCAGCTTAA-3′; and sg5: 5′-GGCAAGAAGCATGGCCACCG-3′. All Cas9 protein (Alt-R S.p. Cas9 Nuclease V3) used was purchased from Integrated DNA Technologies. RNPs were complexed at a Cas9/sgRNA molar ratio of 1:2.5 at 25 °C for 10 min before electroporation. CD34+ cells were resuspended in P3 buffer (Lonza) with complexed RNPs and electroporated using the Lonza 4D Nucleofector (program DZ-100). Cells were plated at 2.5 × 10⁵ ml−1 following electroporation in the cytokine-supplemented media described previously. Immediately following electroporation, AAV6 was supplied to the cells at between 5 × 10³ and 1 × 10⁴ vector genomes per cell, based on titers determined using a Bio-Rad QX200 ddPCR machine and QuantaSoft software (v.1.7; Bio-Rad).
Indel frequency analysis by TIDE.
Between 2 and 4 days post targeting, HSPCs were harvested and QuickExtract DNA extraction solution (Epicentre) was used to collect gDNA. The following primers were then used to amplify respective cut sites at HBA2 and HBA1 along with CleanAmp PCR 2× MasterMix (TriLink), according to the manufacturer’s instructions: HBA2 (sg1–3): forward: 5′-CCCGAAAGGAAAGGGTGGCG-3′; reverse: 5′-TGGCACCTGCACTTGCACTG-3′; HBA1 (sg4–5): forward: 5′-TCCGGGGTGCACGAGCCGAC-3′; reverse: 5′-GCGGTGGCTCCACTTTCCCT-3′. PCR reactions were then run on a 1% agarose gel and appropriate bands were cut and gel extracted using a GeneJET Gel Extraction Kit (Thermo Fisher Scientific) according to the manufacturer’s instructions. Gel-extracted amplicons were then Sanger sequenced with the following primers: HBA2 (sg1-3): forward: 5′-GGGGTGCGGGCTGACTTTCT-3′; reverse: 5′-CTGAGACAGGTAAACACCTCCAT-3′; HBA1 (sg4-5): forward: 5′-TGGAGACGTCCTGGCCCC-3′; reverse: 5′-CCTGGCACGTTTGCTGAGG-3′. The resulting Sanger chromatograms were then used as input for indel frequency analysis by TIDE (v.3.2.0) as previously described31.
Gene-targeting analysis by flow cytometry.
Between 4 and 8 days post targeting with fluorescent gene replacement vectors, CD34+ HSPCs were harvested and the percentage of edited cells was determined by flow cytometry. Cells were analyzed for viability using Ghost Dye Red 780 (Tonbo Biosciences), and reporter expression was assessed using either the Accuri C6 flow cytometer and software (v.9.4.11; BD Biosciences) or the FACS Aria II cytometer and FACS Diva software (v.8.0.3; BD Biosciences). The data were subsequently analyzed using FlowJo (v.10.6.1; FlowJo LLC).
Allelic targeting analysis by ddPCR.
Between 2 and 4 days post targeting, HSPCs were harvested and QuickExtract DNA extraction solution (Epicentre) was used to collect gDNA. gDNA was then digested using BAMH1-HF as per the manufacturer’s instructions (New England Biolabs). The percentage of targeted alleles within a cell population was measured with a Bio-Rad QX200 ddPCR machine and QuantaSoft software (v.1.7; Bio-Rad) using the following reaction mixture: 1–4 μl of digested gDNA input, 10 μl of ddPCR SuperMix for Probes (no dUTP) (Bio-Rad), primer/probes (1:3.6 ratio; Integrated DNA Technologies) and volume up to 20 μl with H2O. ddPCR droplets were then generated following the manufacturer’s instructions (Bio-Rad): 20 μl of ddPCR reaction, 70 μl of droplet generation oil and 40 μl of droplet sample. Thermocycler (Bio-Rad) settings were as follows: 98 °C (10 min), 94 °C (30 s), 57.3 °C (30 s), 72 °C (1.75 min) (return to step 2 × 40–50 cycles) and 98 °C (10 min). Analysis of droplet samples was performed using the QX200 Droplet Digital PCR System (Bio-Rad). To determine percentages of alleles targeted, the numbers of Poisson-corrected integrant copies ml−1 were divided by the numbers of Poisson-corrected reference DNA copies ml−1. The following primers and 6-FAM/ZEN/IBFQ-labeled hydrolysis probes were purchased as custom-designed PrimeTime quantitative PCR (qPCR) Assays from Integrated DNA Technologies: all HBA2-GFP vectors (spanning from BGH to outside 400-bp HBA2 RHA): forward: 5′-TAGTTGCCAGCCATCTGTTG-3′, reverse: 5′-GGGGACAGCCTATTTTGCTA-3′, probe: 5′-AAATGAGGAAATTGCATCGC-3′; all HBA1-GFP vectors (spanning from BGH to outside 400-bp HBA1 RHA): forward: 5′-TAGTTGCCAGCCATCTGTTG-3′, reverse: 5′-TAGTGGGAACGATGGGGGAT-3′, probe: 5′-AAATGAGGAAATTGCATCGC-3′; HBA2-HBB-T2A-YFP vector (spanning from YFP to outside 400-bp HBA2 RHA): forward: 5′-AGTCCAAGCTGAGCAAAGA-3′, reverse: 5′-GGGGACAGCCTATTTTGCTA-3′, probe: 5′-CGAGAAGCGCGATCACATGGTCCTGC-3′; all HBA1-HBB-T2A-YFP vectors (spanning from YFP to outside 400-bp HBA1 RHA): forward: 5′-AGTCCAAGCTGAGCAAAGA-3′, reverse: 5′-TAGTGGGAACGATGGGGGAT-3′, probe: 5′-CGAGAAGCGCGATCACATGGTCCTGC-3′; HBA1-HBB vectors (with 400-bp HAs, without T2A-YFP) (spanning from HBB exon 3 to outside 400-bp HBA1 RHA): forward: 5′-GCTGCCTATCAGAAAGTGGT-3′, reverse: 5′-TAGTGGGAACGATGGGGGAT-3′, probe: 5′-CTGGTGTGGCTAATGCCCTGGCCC-3′; HBA1-HBB vector (with 880-bp HAs, without T2A-YFP) (spanning from HBB exon 3 to outside 880-bp HBA1 RHA): forward: 5′-GCTGCCTATCAGAAAGTGGT-3′, reverse: 5′-ATCACAAACGCAGGCAGAG-3′, probe: 5′-CTGGTGTGGCTAATGCCCTGGCCC-3′. The primers and HEX/ZEN/IBFQ-labeled hydrolysis probe, purchased as custom-designed PrimeTime qPCR Assays from Integrated DNA Technologies, were used to amplify the CCRL2 reference gene: forward: 5′-GCTGTATGAATCCAGGTCC-3′, reverse: 5′-CCTCCTGGCTGAGAAAAAG-3′, probe: 5′-TGTTTCCTCCAGGATAAGGCAGCTGT-3′. Due to the length of the HBA1 UTRs long HAs vector and to ensure that episomal AAV was not detected, the ddPCR amplicon exceeds the template size recommended by the ddPCR manufacturer. Following analysis of the data, the percentage of targeted alleles of this vector was underestimated. Therefore, in these instances a correction factor to account for this underestimation was determined by amplifying gDNA harvested from HSPCs targeted with the HBA1 UTRs vector with 400-bp HAs with both sets of ddPCR primers and probes (those for vectors with both 400- and 880-bp HAs), as well as CCRL2 reference probes. The resulting correction factor was then applied to the targeted allele percentage from samples targeted with, and amplified with, primers and probe for 880-bp HAs.
Off-target activity analysis by rhAmpSeq.
Predicted off-target sites for HBA1 sg5 were identified using COSMID, with up to three mismatches allowed in the 19-protospacer adjacent motif (PAM)-proximal bases and the PAM sequence NGG. rhAmpSeq-targeted sequencing was performed for the 40 most highly predicted off-target sites, as described previously. The raw sequencing files have been uploaded to the public NCBI data repository: BioProject ID PRJNA691350, available at http://www.ncbi.nlm.nih.gov/bioproject/691350.
In vitro differentiation of CD34+ HSPCs into erythrocytes.
Following targeting, HSPCs derived from healthy patients or those with SCD or β-thalassemia were cultured for 14–16 d at 37 °C and 5% CO2 in SFEM II medium (STEMCELL Technologies) as previously described34,35. SFEM II base medium was supplemented with 100 U ml−1 penicillin/streptomycin, 10 ng ml−1 SCF, 1 ng ml−1 IL-3 (PeproTech), 3 U ml−1 erythropoietin (eBiosciences), 200 μg ml−1 transferrin (Sigma-Aldrich), 3% antibody serum (heat-inactivated; Atlanta Biologicals), 2% human plasma (umbilical cord blood), 10 μg ml−1 insulin (Sigma-Aldrich) and 3 U ml−1 heparin (Sigma-Aldrich). In the first phase, at days 0–7 (day 0 being 2 d post targeting) of differentiation, cells were cultured at 1 × 10⁵ ml−1. In the second phase (days 7–10), cells were maintained at 1 × 10⁵ ml−1 and IL-3 was removed from the culture. In the third phase (days 11–16), cells were cultured at 1 × 10⁶ ml−1 and transferrin was increased to 1 mg ml−1 within the culture medium.
mRNA analysis.
Following differentiation of HSPCs into erythrocytes, cells were harvested and RNA was extracted using the RNeasy Plus Mini Kit (Qiagen). Subsequently, complementary DNA was made from approximately 100 ng of RNA using the iScript Reverse Transcription Supermix for quantitative PCR with reverse transcription (Bio-Rad). Expression levels of β-globin transgene and α-globin mRNA were quantified with a Bio-Rad QX200 ddPCR machine and QuantaSoft software (v.1.7; Bio-Rad) using the following primers and 6-FAM/ZEN/IBFQ-labeled hydrolysis probes, purchased as custom-designed PrimeTime qPCR Assays from Integrated DNA Technologies: HBB: forward: 5′-GAGAACTTCAGGCTCCTG-3′, reverse: 5′-CGGGGGTACGGGTGCAGGAA-3′, probe: 5′-TGGCCATGCTTCTTGCCCCT-3′; HBA (does not distinguish between HBA2 and HBA1): forward: 5′-GACCTGCACGCGCACAAGCTT-3′, reverse: 5′-GCTCACAGAAGCCAGGAACTTG-3′, probe: 5′-CAACTTCAAGCTCCTAAGCCA-3′. To normalize for RNA input, levels of the RBC-specific reference gene GPA were determined in each sample using the following primers and HEX/ZEN/IBFQ-labeled hydrolysis probes, purchased as custom-designed PrimeTime qPCR Assays from Integrated DNA Technologies: forward: 5′-ATATGCAGCCACTCCTAGAGCTC-3′, reverse: 5′-CTGGTTCAGAGAAATGATGGGCA-3′, probe: 5′-AGGAAACCGGAGAAAGGGTA-3′. ddPCR reactions were created using the respective primers and probes, and droplets were generated as described above. Thermocycler (Bio-Rad settings were as follows: 98 °C (10 min), 94 °C (30 s), 59.4 °C (30 s), 72 °C (30 s) (return to step 2 × 40–50 cycles) and 98 °C (10 min). Analysis of droplet samples was done using the QX200 Droplet Digital PCR System (Bio-Rad). To determine relative expression levels, the numbers of Poisson-corrected HBA or HBB transgene copies ml−1 were divided by the numbers of Poisson-corrected GPA copies ml−1.
Immunophenotyping of differentiated erythrocytes.
HSPCs subjected to the above erythrocyte differentiation were analyzed at days 14–16 for erythrocyte-lineage-specific markers using a FACS Aria II and FACS Diva software (v.8.0.3; BD Biosciences). Edited and nonedited cells were analyzed by flow cytometry using the following antibodies: hCD45 V450 (1:50 dilution; 2 μl in 100 μl of pelleted RBCs in 1× PBS buffer; HI30; BD Biosciences), CD34 APC (1:50 dilution; 561; BioLegend), CD71 PE-Cy7 (1:500 dilution; OKT9; Affymetrix) and CD235a PE (GPA) (1:500 dilution; GA-R2; BD Biosciences).
Steady-state hemoglobin tetramer analysis.
HSPCs subjected to the above erythrocyte differentiation were lysed using water equivalent to three volumes of pelleted cells. The mixture was incubated at room temperature for 15 min, followed by 30 s of sonication. For separation of lysate from erythrocyte ghosts, centrifugation was performed at 13,000 r.p.m. for 5 min. HPLC analysis of hemoglobins in their native form was performed on a weak cation-exchange PolyCAT A column (100 × 4.6 mm2, 3 μm, 1,000 Å) (PolyLC Inc.) using a Shimadzu UFLC system at room temperature. Mobile phase A (MPA) consisted of 20 mM Bis-tris and 2 mM KCN, pH 6.96. Mobile phase B consisted of 20 mM Bis-tris, 2 mM KCN and 200 mM NaCl, pH 6.55. Clear hemolysate was diluted four times in MPA, and then 20 μl was injected onto the column. A flow rate of 1.5 ml min−1 and the following gradients were used, in time (min)/percentage B organic solvent: (0/10, 8/40, 17/90 and 20/10%; 30/stop).
Reverse-phase HPLC globin chain analysis.
Analysis of globin chains in CD34+-cell-derived erythroblasts was performed by reverse-phase HPLC, as previously described48,49. In brief, the reverse-phase HPLC assay was carried out on an Agilent 1260 Infinity II HPLC system with Diode-Array Detector. The chromatographic column used was an Aeri 3.6-μm WIDEPORE XB-C18 200-Å, LC Column 250 × 4.6 mm2 behind a securityGuard ULTRA cartridge (Phenomenex). Globin chains were separated using a gradient program of 41–47% solvent B (acetonitrile) mixed with solvent A (0.1% trifluoroacetic acid in HPLC-grade water at pH 2.9), and quantified by the area under the curve (AUC) of the corresponding peaks in the reverse-phase HPLC chromatogram.
Methylcellulose colony-forming assessment.
Two days post targeting, HSPCs were stained using CD34 APC (no. 561, BioLegend) and Ghost Dye Red 780 (Tonbo Biosciences), and live CD34+ cells were sorted into 96-well plates containing MethoCult Optimum (STEMCELL Technologies). After 12–16 d, colonies were appropriately scored based on external appearance in a blinded fashion.
CD34+ HSPC transplantation into immunodeficient NSG mice.
Six- to eight-week-old female NSG mice (Jackson Laboratory) were irradiated using 200 rad, 12–24 h before transplantation, with targeted HSPCs (2 d post targeting) via intrafemoral or tail-vein injection. Approximately 2.5 × 10⁵ to 1.3 × 10⁶ electroporated HSPCs (exact numbers noted in individual figures) were injected using an insulin syringe with a 27-G, 0.5-inch (12.7-mm) needle. Mice were housed at an ambient temperature of 22 °C with 50% humidity and a 12/12-h light/dark cycle. This experimental protocol was approved by Stanford University’s Administrative Panel on Laboratory Animal Care. All mouse studies reported in this paper were performed as a minimum of three separate experimental replicates of editing and transplantation. For sample size, we transplanted as many mice as feasible to cover the non-Gaussian distribution that would be expected from experimental and donor variability, while also minimizing the total number of animals as per the FDA Center for Biologics Evaluation and Research guidelines.
Assessment of human engraftment.
Between 15 and 17 weeks post transplantation of CD34+-edited HSPCs, mice were euthanized and bone marrow was harvested from tibia, femur, pelvis, sternum and spine using a pestle and mortar. Mononuclear cells (MNCs) were enriched using a Ficoll gradient centrifugation (Ficoll-Paque Plus, GE Healthcare) for 25 min at 2,000g at room temperature. The samples were then stained for 30 min at 4 °C with the following antibodies: monoclonal anti-human CD33 V450 (1:50 dilution, 6 ul in 300 ul of MNCs pelleted in MACS buffer (1× PBS, 2% fetal bovine serum, 2 mM EDTA); WM53 (BD Biosciences); anti-human HLA-ABC FITC (1:100 dilution; W6/32; BioLegend); anti-human CD19 PerCp-Cy5.5 (1:20 dilution; HIB19; BD Biosciences); anti-mouse PE-Cy5 mTer119 (1:400 dilution; TER-119; eBiosciences); anti-mouse CD45.1 PE-Cy7 (1:200 dilution; A20; eBiosciences); anti-human GPA PE (1:200 dilution; HIR2; eBiosciences); anti-human CD34 APC (1:50 dilution; 581; BioLegend); and anti-human CD10 APC-Cy7 (1:20 dilution; HI10a; BioLegend). Multilineage engraftment was established by the presence of myeloid cells (CD33+) and B cells (CD19+) in engrafted human cells (CD45+; HLA-A/B/C+ cells). For GFP-expressing cells, HLA-FITC was not used in the cocktail. For secondary transplantation, only a portion of the primary mouse mononuclear population was stained while the remainder (between 2.5 × 10⁵ and 1.3 × 10⁶ cells) were transplanted into 6- to 8-week-old NSG mice post irradiation conditioning. Cells were then assessed as above, 16 weeks post transplantation into secondary mice.
Statistical analysis.
All statistical tests on experimental groups were done using GraphPad Prism software (v.8.4). The exact statistical tests used for each comparison are noted in the individual figure legends.
Research animals.
All reported experiments were completed in compliance with the institutional Animal Care and Use Committee (IACUC Protocol no. D16-00134), administered at Stanford University by the Administrative Panel on Laboratory Animal Care (APLAC Protocol no. 25065) in accordance with Stanford University policy.
Human research participants.
We have complied with all relevant ethical regulations for the following sources of primary human cells used in this study. Wild-type CD34+ HSPCs were sourced from fresh cord blood (generously provided by the Binns Family program for Cord Blood Research; Stanford University IRB Protocol no. 33813). β-Thalassemia-derived HSPCs were collected under protocol no. 14-H-0077 (registered on clinicaltrials.gov, NCT02105766), which was approved and is renewed annually by the NHLBI IRB. We obtained informed consent from patients participating in the study. All human-derived samples were deidentified before use in laboratory studies.
Reporting Summary.
Further information on research design is available in the Nature Research Reporting Summary linked to this article.
Data availability
High-throughput sequencing data generated in the Cas9 off-target activity assessment have been uploaded to the public NCBI data repository: BioProject ID PRJNA691350, available at http://www.ncbi.nlm.nih.gov/bioproject/691350. All other data supporting the findings of this study are either included in the published article and/or Supplementary information files or (if too large to be included therein) are available from the corresponding author on reasonable request. These include, but are not limited to, Sanger sequencing, ddPCR, flow cytometry and HPLC data that were used to generate the figures and conclusions in this study. Source data are provided with this paper.
Code availability
No previously unreported computer code or algorithm was generated during the course of this study.
Extended Data
Extended Data Fig. 1 ∣. Analysis of Cas9 sgRNAs targeting α-globin loci.
a, Table with guide RNA sequences. PAM shown in grey, and differences between HBA1 and HBA2 are highlighted in red for each guide. b, Schematic depicting locations of all five guide sequences at genomic loci. c, Representative indel spectrum of HBA1-specific sg5 generated by TIDE software.
Extended Data Fig. 2 ∣. Off-target analysis of HBA1-specific sg5.
a, Summary of rhAmpSeq targeted sequencing results at on-target and 40 most highly predicted off-target sites by COSMID for HBA1 sg5. Values are indel frequency for RNP treatment after subtraction of indel frequency for Mock treatment at each locus for each experimental replicate. N = 3 biologically independent HSPC donors, though not all values are displayed since some were <0.01% after subtraction of Mock indel frequencies. Bars represent median. b, List of genomic coordinates for forty most highly predicted off-target sites by COSMID for HBA1 sg5.
Extended Data Fig. 3 ∣. Targeting α-globin with GFP integration vectors.
a, Timeline for editing and analysis of HSPCs targeted with SFFV-GFP integration vectors. b, Depicted are representative flow cytometry images for human HSPCs 14d post-editing. This indicates that WGR integration yields a greater MFI per GFP+ cell than CS integration at the HBA1 locus. Analysis was performed on BD Accuri C6 platform. Median MFI across all replicates is shown below each flow cytometry image, and schematics of integration vectors are shown above.
Extended Data Fig. 4 ∣. Staining and gating scheme used to analyze editing and differentiation rates of RBCs.
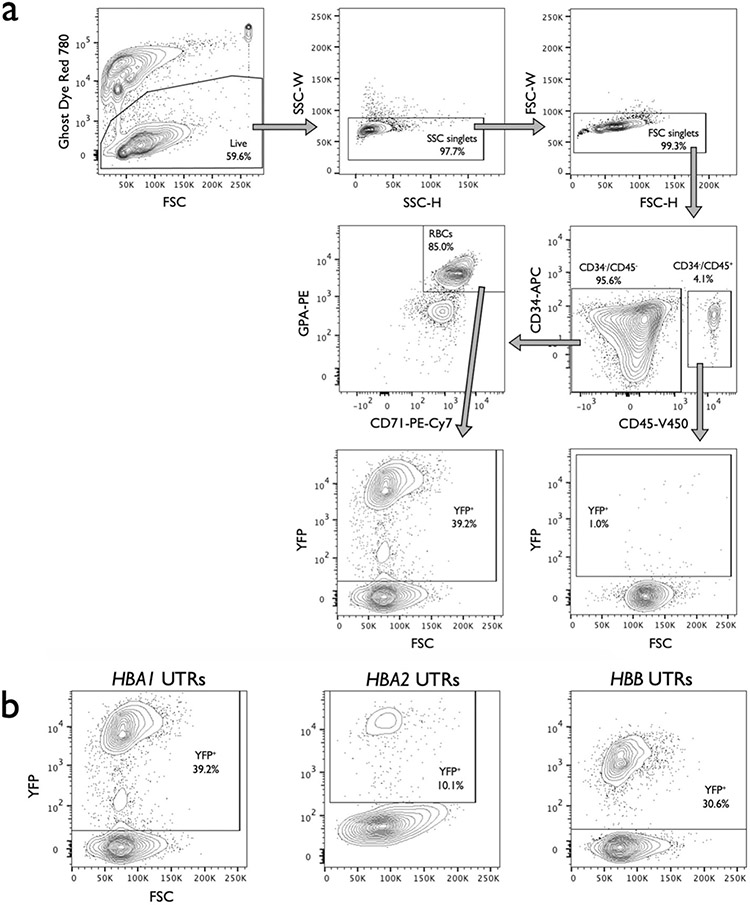
a, Representative flow cytometry staining and gating scheme for human HSPCs targeted at HBA1 with HBB-T2A-YFP (HBA1 UTRs) and differentiated into RBCs. This indicates that only RBCs (CD34−/CD45−/CD71+/GPA+) are able to express the promoterless YFP marker. Analysis was performed on BD FACS Aria II platform. b, Representative flow cytometry images of RBCs (CD34−/CD45−/CD71+/GPA+) derived from HSPCs targeted with HBA1 UTRs, HBA2 UTRs, and HBB UTRs vector. AAV only controls were used for each vector to establish gating scheme, leading to slight variation in positive/negative cut-offs across images.
Extended Data Fig. 5 ∣. Viability of HSPCs post-editing.
HSPC viability was quantified 2-4d post-editing by flow cytometry. Depicted are the percentage of cells that stained negative for GhostRed viability dye. All cells were edited with our optimized HBB WGR vector using standard conditions (that is electroporation of Cas9 RNP + sg5, 5 K MOI of AAV, and no AAV wash at 24 h). Bars represent median ± interquartile range. WT: N = 5 for mock, N = 3 for RNP only, N = 1 for AAV only, and N = 6 for RNP + AAV treatment group; SCD: N = 2 for each treatment group with exception of RNP + AAV with N = 4; β-thal: N = 3 for mock, N = 1 for RNP only, and N = 7 for RNP + AAV treatment group.
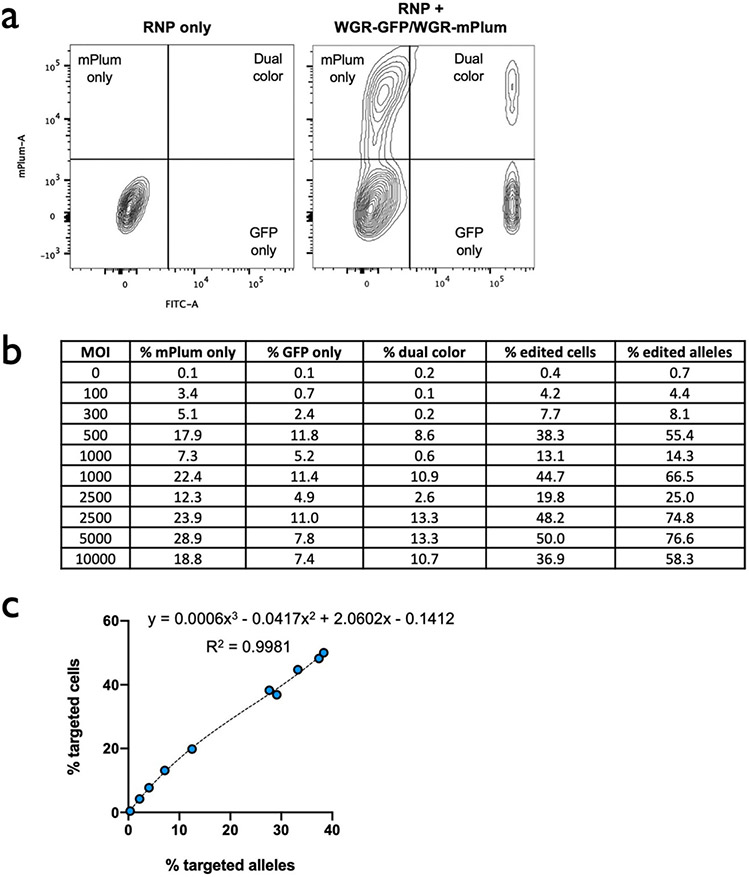
Extended Data Fig. 6 ∣. Relationship between % edited alleles and % edited cells.
a, Representative flow cytometry plots of HSPCs simultaneously targeted at HBA1 with GFP (shown in Fig. 1c) and mPlum integration cassettes. b, Table showing % of populations targeted with GFP only, mPlum only, and both colors. Percent of edited cells was then converted to % edited alleles by the following equation: (total % targeted cells + (% dual color)*2)/2 = total % targeted alleles. c, Percent edited cells is plotted against % edited alleles for data shown in panel B. A polynomial regression (R2 = 0.9981) was used to determine an equation to convert between % edited alleles and % edited cells.
Extended Data Fig. 7 ∣. Colony-forming ability of edited HSPCs.
a, Distribution of genotypes of methylcellulose colonies displayed in Panels B and D. Numbers of clones corresponding to each category are included in the pie chart. b, In vitro (pre-engraftment) live CD34+ HSPCs from healthy donors were single-cell sorted into 96-well plates containing semisolid methylcellulose media for colony forming assays. 14d post-sorting cells were analyzed for morphology. Depicted are number of colonies formed for each lineage (CFU-E = erythroid lineage; CFU-GEMM = multi-lineage; or CFU-GM = granulocyte/macrophage lineage) divided by the total number of wells available for colonies. Columns represent median ± interquartile range. N = 3 experimental replicates with a minimum of 3 96-well methylcellulose-coated plates for mock, RNP only, and WGR-GFP AAV6 treatment groups; N = 2 for AAV only and HBB-HBA1 AAV6 treatment groups. c, Percent distribution of each lineage among all colonies for each treatment for Panel B. d, As above, in vitro (pre-engraftment) live CD34+ β-thalassemia HSPCs were sorted into 96-well plates for colony forming assays. Depicted are number of colonies formed for each lineage (B = BFU-E and C = CFU-E (erythroid lineage); GE = CFU-GEMM (multi-lineage); or GM = CFU-GM (granulocyte/macrophage lineage)) divided by the total number of wells available for colonies. Columns represent median ± interquartile range. For Mock and RNP + AAV, N = 2 experimental replicates with a minimum of 3 96-well methylcellulose-coated plates for each treatment; N = 1 experimental replicate with 3 plates for RNP only treatment. e, Percent distribution of each lineage among all colonies for each treatment for Panel D.
Extended Data Fig. 8 ∣. Engraftment into NSG mice of human HSPCs targeted with GFP at α-globin locus.
a, Timeline for targeting of HSPCs with UbC-GFP integration vector, transplantation into mice (both 1° and 2° engraftment), and subsequent analysis. b, AAV6 DNA repair donor design schematic to introduce a UbC-GFP-BGH integration is depicted at the HBA1 locus. c, 16 weeks after bone marrow transplantation of targeted human CD34+ HSPCs into NSG mice, bone marrow was harvested and rates of engraftment were determined (1°). Depicted is the percentage of mTerr119− cells (non-RBCs) that were hHLA+ from the total number of cells that were either mCd45+ or hHLA+. Bars represent median ± interquartile range. N = 8 biologically independent NSG mouse transplantations. d, Among engrafted human cells, the distribution among CD19+ (B-cell), CD33+ (myeloid), or other (that is HSPC/RBC/T/NK/Pre-B) lineages are indicated. Bars represent median ± interquartile range. N = 8 biologically independent NSG mouse transplantations. e, Percentage of GFP+ cells among pre-transplantation (in vitro, post-sorting) and successfully engrafted populations, both bulk HSPCs and among lineages. Bars represent median ± interquartile range. N = 3 independent HSPC donors from in vitro experiments that were transplanted into N = 6 individual NSG mice, from which N = 4 individual mice were lineage sorted and analyzed. Various green shades correspond to each particular HSPC donor. b, Following primary engraftments, engrafted human cells were transplanted a second time into the bone marrow of NSG mice. 16 weeks post-transplantation, bone marrow was harvested and rates of engraftment were determined (2°). Depicted is the percentage of mTerr119− cells (non−RBCs) that were hHLA+ from the total number of cells that were either mCd45+ or hHLA+. N = 1 NSG mouse transplantation. g, Percentage of GFP+ cells among successfully engrafted population from the secondary transplant depicted in Panel F. N = 1 NSG mouse transplantation.
Extended Data Fig. 9 ∣. Characterization of targeted β-thalassemia HSPCs.
a, Following differentiation of targeted HSPCs into RBCs, mRNA was harvested and converted into cDNA. Expression of HBA (does not distinguish between HBA1 and HBA2) and HBB transgene were normalized to HBG expression. Bars represent median ± interquartile range. N = 3 biologically independent editing experiments for all treatment groups with exception of HBA1 UTRs with N = 1. b, Summary of reverse-phase globin chain HPLC results showing % AUC of β-globin and α-globin. Bars represent median ± interquartile range. Bars represent median ± interquartile range. N = 3 biologically independent erythroid differentiation experiments for all treatment groups with exception of RNP only with N = 5. **P < 0.005; ***P < 0.0001 using unpaired two-tailed t test without adjustment for multiple comparisons.
Supplementary Material
Acknowledgements
The authors thank the following funding sources that made this work possible: Doris Duke Charitable Trust (no. 22399) to M.H.P., NIH NHLBI (no. R01-HL135607) to M.H.P. and D.P.D., and NIH NHLBI (no. T32-HL120824) to M.K.C.
Footnotes
Competing interests
M.H.P. is a member of the scientific advisory board of Allogene Therapeutics. M.H.P. is on the Board of Directors of Graphite Bio. M.H.P. has equity in CRISPR Tx. C.A.V., N.M.B., G.K., M.A.C., G.R.R. and M.A.B. are employees of Integrated DNA Technologies. D.P.D. is an employee of Graphite Bio.
Extended data is available for this paper at https://doi.org/10.1038/s41591-021-01284-y.
Supplementary information The online version contains supplementary material available at https://doi.org/10.1038/s41591-021-01284-y.
Peer review information Nature Medicine thanks the anonymous reviewers for their contribution to the peer review of this work. Kate Gao and Joao Monteiro were the primary editors on this article and managed its editorial process and peer review in collaboration with the rest of the editorial team.
Publisher’s note Springer Nature remains neutral with regard to jurisdictional claims in published maps and institutional affiliations.
References
- 1.Galanello R & Origa R Beta-thalassemia. Orphanet J. Rare Dis 5, 11 (2010). [DOI] [PMC free article] [PubMed] [Google Scholar]
- 2.Mentzer WC & Kan YW Prospects for research in hematologic disorders: sickle cell disease and thalassemia. JAMA 285, 640–642 (2001). [DOI] [PubMed] [Google Scholar]
- 3.Ehlers KH, Giardina PJ, Lesser ML, Engle MA & Hilgartner MW Prolonged survival in patients with beta-thalassemia major treated with deferoxamine. J. Pediatr 118, 540–545 (1991). [DOI] [PubMed] [Google Scholar]
- 4.Mettananda S, Gibbons RJ & Higgs DR alpha-Globin as a molecular target in the treatment of beta-thalassemia. Blood 125, 3694–3701 (2015). [DOI] [PMC free article] [PubMed] [Google Scholar]
- 5.Dye DE, Brameld KJ, Maxwell S, Goldblatt J & O’Leary P The impact of single gene and chromosomal disorders on hospital admissions in an adult population. J. Community Genet 2, 81–90 (2011). [DOI] [PMC free article] [PubMed] [Google Scholar]
- 6.Fleischhauer K et al. Graft rejection after unrelated donor hematopoietic stem cell transplantation for thalassemia is associated with nonpermissive HLA-DPB1 disparity in host-versus-graft direction. Blood 107, 2984–2992 (2006). [DOI] [PubMed] [Google Scholar]
- 7.Puthenveetil G et al. Successful correction of the human beta-thalassemia major phenotype using a lentiviral vector. Blood 104, 3445–3453 (2004). [DOI] [PubMed] [Google Scholar]
- 8.Negre O et al. Gene therapy of the beta-hemoglobinopathies by lentiviral transfer of the beta(A(T87Q))-globin gene. Hum. Gene Ther 27, 148–165 (2016). [DOI] [PMC free article] [PubMed] [Google Scholar]
- 9.Thompson AA et al. Gene therapy in patients with transfusion-dependent beta-thalassemia. N. Engl. J. Med 378, 1479–1493 (2018). [DOI] [PubMed] [Google Scholar]
- 10.Breda L et al. Therapeutic hemoglobin levels after gene transfer in beta-thalassemia mice and in hematopoietic cells of beta-thalassemia and sickle cells disease patients. PLoS ONE 7, e32345 (2012). [DOI] [PMC free article] [PubMed] [Google Scholar]
- 11.Cavazzana-Calvo M et al. Transfusion independence and HMGA2 activation after gene therapy of human beta-thalassaemia. Nature 467, 318–322 (2010). [DOI] [PMC free article] [PubMed] [Google Scholar]
- 12.Marktel S et al. Intrabone hematopoietic stem cell gene therapy for adult and pediatric patients affected by transfusion-dependent ss-thalassemia. Nat. Med 25, 234–241 (2019). [DOI] [PubMed] [Google Scholar]
- 13.Xu L et al. CRISPR-edited stem cells in a patient with HIV and acute lymphocytic leukemia. N. Engl. J. Med 381, 1240–1247 (2019). [DOI] [PubMed] [Google Scholar]
- 14.Stadtmauer EA et al. CRISPR-engineered T cells in patients with refractory cancer. Science 367, eaba7365 (2020). [DOI] [PMC free article] [PubMed] [Google Scholar]
- 15.Canver MC et al. BCL11A enhancer dissection by Cas9-mediated in situ saturating mutagenesis. Nature 527, 192–197 (2015). [DOI] [PMC free article] [PubMed] [Google Scholar]
- 16.Alter BP Fetal erythropoiesis in stress hematopoiesis. Exp. Hematol 7, 200–209 (1979). [PubMed] [Google Scholar]
- 17.Stamatoyannopoulos G, Veith R, Galanello R & Papayannopoulou T Hb F production in stressed erythropoiesis: observations and kinetic models. Ann. N. Y. Acad. Sci 445, 188–197 (1985). [DOI] [PubMed] [Google Scholar]
- 18.Bak RO, Dever DP & Porteus MH CRISPR/Cas9 genome editing in human hematopoietic stem cells. Nat. Protoc 13, 358–376 (2018). [DOI] [PMC free article] [PubMed] [Google Scholar]
- 19.Martin RM et al. Highly efficient and marker-free genome editing of human pluripotent stem cells by CRISPR-Cas9 RNP and AAV6 donor-mediated homologous recombination. Cell Stem Cell 24, 821–828 (2019). [DOI] [PubMed] [Google Scholar]
- 20.Pavel-Dinu M et al. Gene correction for SCID-X1 in long-term hematopoietic stem cells. Nat. Commun 10, 1634 (2019). [DOI] [PMC free article] [PubMed] [Google Scholar]
- 21.Gomez-Ospina N et al. Human genome-edited hematopoietic stem cells phenotypically correct mucopolysaccharidosis type I. Nat. Commun 10, 4045 (2019). [DOI] [PMC free article] [PubMed] [Google Scholar]
- 22.Schiroli G et al. Precise gene editing preserves hematopoietic stem cell function following transient p53-mediated DNA damage response. Cell Stem Cell 24, 551–565 e558 (2019). [DOI] [PMC free article] [PubMed] [Google Scholar]
- 23.Schiroli G et al. Preclinical modeling highlights the therapeutic potential of hematopoietic stem cell gene editing for correction of SCID-X1. Sci. Transl. Med 9, eaan0820 (2017). [DOI] [PubMed] [Google Scholar]
- 24.Dever DP et al. CRISPR/Cas9 beta-globin gene targeting in human haematopoietic stem cells. Nature 539, 384–389 (2016). [DOI] [PMC free article] [PubMed] [Google Scholar]
- 25.Pattabhi S et al. In vivo outcome of homology-directed repair at the hbb gene in hsc using alternative donor template delivery methods. Mol. Ther. Nucleic Acids 17, 277–288 (2019). [DOI] [PMC free article] [PubMed] [Google Scholar]
- 26.DeWitt MA et al. Selection-free genome editing of the sickle mutation in human adult hematopoietic stem/progenitor cells. Sci. Transl. Med 8, 360ra134 (2016). [DOI] [PMC free article] [PubMed] [Google Scholar]
- 27.De Ravin SS et al. CRISPR-Cas9 gene repair of hematopoietic stem cells from patients with X-linked chronic granulomatous disease. Sci. Transl. Med 9, eaah3480 (2017). [DOI] [PubMed] [Google Scholar]
- 28.Thein SL The molecular basis of beta-thalassemia. Cold Spring Harb. Perspect. Med 3, a011700 (2013). [DOI] [PMC free article] [PubMed] [Google Scholar]
- 29.Weatherall D 2003 William Allan Award address. The thalassemias: the role of molecular genetics in an evolving global health problem. Am. J. Hum. Genet 74, 385–392 (2004). [DOI] [PMC free article] [PubMed] [Google Scholar]
- 30.Hendel A et al. Chemically modified guide RNAs enhance CRISPR-Cas genome editing in human primary cells. Nat. Biotechnol 33, 985–989 (2015). [DOI] [PMC free article] [PubMed] [Google Scholar]
- 31.Brinkman EK, Chen T, Amendola M & van Steensel B Easy quantitative assessment of genome editing by sequence trace decomposition. Nucleic Acids Res. 42, e168 (2014). [DOI] [PMC free article] [PubMed] [Google Scholar]
- 32.Cradick TJ, Qiu P, Lee CM, Fine EJ & Bao G COSMID: a Web-based tool for identifying and validating CRISPR/Cas off-target sites. Mol. Ther. Nucleic Acids 3, e214 (2014). [DOI] [PMC free article] [PubMed] [Google Scholar]
- 33.Charlesworth CT et al. Priming human repopulating hematopoietic stem and progenitor cells for Cas9/sgRNA gene targeting. Mol. Ther. Nucleic Acids 12, 89–104 (2018). [DOI] [PMC free article] [PubMed] [Google Scholar]
- 34.Dulmovits BM et al. Pomalidomide reverses gamma-globin silencing through the transcriptional reprogramming of adult hematopoietic progenitors. Blood 127, 1481–1492 (2016). [DOI] [PMC free article] [PubMed] [Google Scholar]
- 35.Hu J et al. Isolation and functional characterization of human erythroblasts at distinct stages: implications for understanding of normal and disordered erythropoiesis in vivo. Blood 121, 3246–3253 (2013). [DOI] [PMC free article] [PubMed] [Google Scholar]
- 36.Bak RO et al. Multiplexed genetic engineering of human hematopoietic stem and progenitor cells using CRISPR/Cas9 and AAV6. eLlife 6, e27873 (2017). [DOI] [PMC free article] [PubMed] [Google Scholar]
- 37.Andreani M et al. Persistence of mixed chimerism in patients transplanted for the treatment of thalassemia. Blood 87, 3494–3499 (1996). [PubMed] [Google Scholar]
- 38.Andreani M et al. Long-term survival of ex-thalassemic patients with persistent mixed chimerism after bone marrow transplantation. Bone Marrow Transpl. 25, 401–404 (2000). [DOI] [PubMed] [Google Scholar]
- 39.Ferrari S et al. Efficient gene editing of human long-term hematopoietic stem cells validated by clonal tracking. Nat. Biotechnol 38, 1298–1308 (2020). [DOI] [PMC free article] [PubMed] [Google Scholar]
- 40.Sharma R et al. The TRACE-Seq method tracks recombination alleles and identifies clonal reconstitution dynamics of gene targeted human hematopoietic stem cells. Nat. Commun 12, 472 (2021). [DOI] [PMC free article] [PubMed] [Google Scholar]
- 41.Magoc T & Salzberg SL FLASH: fast length adjustment of short reads to improve genome assemblies. Bioinformatics 27, 2957–2963 (2011). [DOI] [PMC free article] [PubMed] [Google Scholar]
- 42.McDermott SP, Eppert K, Lechman ER, Doedens M & Dick JE Comparison of human cord blood engraftment between immunocompromised mouse strains. Blood 116, 193–200 (2010). [DOI] [PubMed] [Google Scholar]
- 43.Wunderlich M et al. AML xenograft efficiency is significantly improved in NOD/SCID-IL2RG mice constitutively expressing human SCF, GM-CSF and IL-3. Leukemia 24, 1785–1788 (2010). [DOI] [PMC free article] [PubMed] [Google Scholar]
- 44.Khan IF, Hirata RK & Russell DW AAV-mediated gene targeting methods for human cells. Nat. Protoc 6, 482–501 (2011). [DOI] [PMC free article] [PubMed] [Google Scholar]
- 45.Aurnhammer C et al. Universal real-time PCR for the detection and quantification of adeno-associated virus serotype 2-derived inverted terminal repeat sequences. Hum. Gene Ther. Methods 23, 18–28 (2012). [DOI] [PubMed] [Google Scholar]
- 46.Cromer MK et al. Global transcriptional response to CRISPR/Cas9-AAV6-based genome editing in CD34(+) hematopoietic stem and progenitor cells. Mol. Ther 26, 2431–2442 (2018). [DOI] [PMC free article] [PubMed] [Google Scholar]
- 47.Bak RO & Porteus MH CRISPR-mediated integration of large gene cassettes using aav donor vectors. Cell Rep. 20, 750–756 (2017). [DOI] [PMC free article] [PubMed] [Google Scholar]
- 48.Park SH et al. Highly efficient editing of the beta-globin gene in patient-derived hematopoietic stem and progenitor cells to treat sickle cell disease. Nucleic Acids Res. 47, 7955–7972 (2019). [DOI] [PMC free article] [PubMed] [Google Scholar]
- 49.Nemati H, Bahrami G & Rahimi Z Rapid separation of human globin chains in normal and thalassemia patients by RP-HPLC. Mol. Biol. Rep 38, 3213–3218 (2011). [DOI] [PubMed] [Google Scholar]
Associated Data
This section collects any data citations, data availability statements, or supplementary materials included in this article.
Supplementary Materials
Data Availability Statement
High-throughput sequencing data generated in the Cas9 off-target activity assessment have been uploaded to the public NCBI data repository: BioProject ID PRJNA691350, available at http://www.ncbi.nlm.nih.gov/bioproject/691350. All other data supporting the findings of this study are either included in the published article and/or Supplementary information files or (if too large to be included therein) are available from the corresponding author on reasonable request. These include, but are not limited to, Sanger sequencing, ddPCR, flow cytometry and HPLC data that were used to generate the figures and conclusions in this study. Source data are provided with this paper.


