

Abstract
Mutant KRAS tumors are associated with poor outcomes at least in part due to decreased therapeutic sensitivity. Here we show that KRAS mutations are associated with resistance to monotherapy and combination therapy with Poly-(ADP-ribose) polymerase inhibitors (PARPi) and immune checkpoint blockade with anti-PD-L1 antibodies. In mutant KRAS tumors, inhibition of KRAS signaling with MEK inhibitors (MEKi) triggered and amplified PARPi-induced DNA damage, cytosolic double-stranded DNA accumulation, STING pathway activation and CD8+ T cell recruitment. Moreover, MEKi decreased myeloid-derived suppressor cell infiltration in part by inhibiting IL-6 and GM-CSF production. Importantly, addition of MEKi to PARPi and anti-PD-L1 resulted in marked tumor inhibition in immunocompetent mutant KRAS tumor models. These studies provide the underlying mechanistic data to support evaluation of PARPi, MEKi, and anti-PD-L1 combination in clinical trials of mutant KRAS tumors.
Introduction
Poly-(ADP-ribose) polymerase inhibitors (PARPi) entered the clinic as a result of studies showing synthetic lethality with defects in homologous recombination (HR) DNA damage repair (DDR) such as those caused by BRCA mutations (1). PARPi have been approved for treatment of HR defective (HRD) tumors including ovarian, breast, pancreatic and prostate cancers (2). Unfortunately, in the majority of patients, resistance to PARP inhibition develops, leading to treatment failure (3). Additionally, a proportion of patients exhibit primary resistance to PARPi despite harboring genomic features of HR deficiency (4). Therefore, efforts are underway to develop new therapeutic strategies with novel drug combinations to extend the population of patients who would benefit from PARPi beyond HRD and to increase the depth and duration of response to PARPi.
Recent studies have provided a compelling rationale for combining PARPi with immunotherapy with ICBs to broaden responding populations as well as to delay and overcome emerging resistance leading to improved response duration and overall survival. Many potential mechanisms by which PARPi could increase the activity of immunotherapy have been proposed:Ⅰ) PARPi triggers cGAS/STING signaling through an accumulation of cytosolic double-stranded DNA (dsDNA), favoring lymphoid-attractant chemokine secretion, and increasing immune cell infiltration and cytotoxic T-cell activation (5); Ⅱ) In the context of defective DDR, PARPi triggers cancer cell death through replication stress and a mitotic catastrophe that is proposed to expose tumor-specific antigens to immune surveillance (6); Ⅲ) PARPi, by inducing DNA damage as well as decreasing DDR, is proposed to increase the mutational burden and promote immunogenicity and immune priming by increasing neoantigen expression (7); Ⅳ) PARPi upregulates PD-L1 through interferon dependent pathways (8), or tumor cell-intrinsic mechanisms (9). Based on these observations, a number of clinical trials are currently on-going (ClinicalTrials.gov) with four different PARPi/anti-PD-1/L1 combinations being tested: Olaparib/Durvalumab (10,11), Niraparib/Pembrolizumab (12), Talazoparib/Avelumab (13,14), and BGB-A317/BGB-290 (15). Overall, clinical studies conducted to date suggest combinations of PARP inhibition and anti-PD-1/L1 agents are well tolerated and demonstrate encouraging antitumor activity in a wide range of solid malignancies independent of DDR status including mutations in BRCA1 or BRCA2. However, several key questions remain unanswered. Most critically: what is the magnitude and nature of benefit from combination treatment versus monotherapy? Does benefit vary across different tumor types? What is the contribution of HRD status? And What approaches can be used to overcome resistance? Answers to these questions will be necessary to identify patient populations most likely to benefit from PARPi plus immune checkpoint blockade and to increase the depth and duration of responses.
Increasing evidence suggests that activation of oncogenic pathways is associated with the generation of an immune desert or non-T cell-inflamed tumor microenvironment (TME) with consequent immunotherapy resistance (16). KRAS represents one of the most frequently mutated oncogenes in cancer with alterations most common in pancreatic carcinoma (PAAD, 72%), colorectal cancer (69%), lung adenocarcinoma (33%), endometrial cancer (10–31%), and low-grade serous ovarian cancer (35%) (17). KRAS mutant cancers are refractory to targeted therapies and anti-PD-1/PD-L1 therapies (18). The limited response to therapy could be attributed to an immunosuppressive TME, decreased cytotoxic T cells (19), increased Tregs (20), and myeloid-derived suppressor cells (MDSCs) (19). This may be explained in part by KRAS mutations being associated with increased IL-6 production, which recruits neutrophils, decreases T-cell infiltration, increases T-cell exhaustion markers (PD-1, CTLA-4, and TIM3), and increases expression of PD-L1 on tumor cells (21). Interestingly mitogen-activated protein kinase (MAPK) pathway gene signatures are enriched in anti-PD-1 non-responding patients (16).
We demonstrate that KRAS mutant tumor models are resistant to PARPi, anti-PD-L1, and PARPi plus anti-PD-L1 combinations. MEK inhibitors (MEKi) both trigger and amplify PARPi-induced DNA damage, cytosolic dsDNA accumulation, STING pathway activation, and CD8+ T cell recruitment. Moreover, MEKi decreases myeloid-derived suppressor cell (MDSC) infiltration, at least in part, by decreasing IL-6 and GM-CSF. Importantly, our results demonstrate remarkable efficacy of the triplet combination of PARPi, MEKi, and anti-PD-L1 blockade in immunocompetent KRAS mutant tumor models.
Materials and methods
Cell lines and cell culture
CT26, MC38, OVCAR3, A2780, HOC7, TOV-21G, LOVO and A549 were obtained from ATCC. NCI-H441 and NCI-H1793 were obtained from China Center for Type Culture Collection (CCTCC). MCAS, HeyA8 were from MD Anderson Cancer Center Characterized Cell Line Core. Pa02c, Pa16c, and iKRAS murine cells (primary murine pancreatic cancer cells established from p48 Cre_tetO_LKrasG12D ROSA_rtTAL+p53L+mice) were gifted from Prof. Anirban Maitra (Division of Pathology/Lab Medicine, The University of Texas MD Anderson Cancer Center). iKRAS cells were induced in the medium with doxycycline (Sigma D9891) 2μg/mL (Dox-on) for 48h or without doxycycline (Dox-off). All cell lines were authenticated through STR profiling and tested monthly for Mycoplasma by PCR. Cell lines were not passaged more than 30 times. All cells were maintained in humidified incubators under 37°C, 5% CO2. KRAS mutation status about each cell lines are listed in Supplementary Table 1.
Antibodies and Compounds
GAPDH (AC033), STING (A3575), phosphorylated MEK1/2 (pMEK1/2) (AP0209), TBK1 (A14641), IRF3 (A11373) antibodies were from ABclonal. CD4 (ab183685), CD8 (ab209775), pERK1/2 (ab 214362), pSTAT1 (ab109461) and phosphorylated TBK1 (pTBK1) (ab 109272) antibodies were from Abcam. phosphorylated ERK1/2 (pERK1/2) (4370), pIRF3 (29047), STAT1 (14994) and phosphorylation of histone H2AX at Ser139 (γH2AX) (2577) antibodies were from Cell Signaling Technology.
Olaparib, BMN673, and trametinib were from Selleck. Cobimetinib, H151 and C176 were from MCE. Compounds were dissolved in DMSO and stored as 10 mM aliquots at instructions temperature. anti-PD-L1 antibody (BE0101, clone B7-H1) and IgG isotype control (BE0090) was from BioXcell. CD45 (BV605 30-F11), CD3e (APC-Cy7 145–2C11), mouse CD4 (FITC RM4–5), CD25 (PE-Cy7 PC61), Foxp3 (BV421 MF23), CD8a (PerCP-Cy5.5 53–6.7), Granzyme B (D2H2F), IFN-γ (PE XMG1.2), CD11c (PE-Cy HL3), I-A/I-E (BV421 M5/114.15.2), F4/80 (PE T45–2342), CD11b (FITC M1/70), CD49b (APC DX5), CD3e (APC-Cy7 145-2C11), ly-6G (PE 1A8), ly-6C (APC AL-21), Gr-1 (PerCP-Cy5.5), Fixable Viability Stain (BV510), Transcription Factor Buffer Set were from BD Biosciences.
RPPA
Protein lysates were analyzed by Reverse Phase Protein Array (RPPA) performed as previously described (22) in the MDACC CCSG (The Cancer Center Support Grant) supported RPPA Core. Antibodies and approaches are described at the RPPA website (https://www.mdanderson.org/research/research-resources/core-facilities/functional-proteomics-rppa-core.html).
Immunohistochemical staining (IHC)
Briefly, formalin-fixed, paraffin-embedded tissues were subsequently sectioned at 4 μm and mounted on coated glass slides. Tissues were subjected to deparaffinization, antigen retrieval prior to antibody staining. And then stained with primary antibody overnight at 4°C. Primary antibodies included pERK1/2 (1:500), CD4 (1:800), CD8 (1:800). Negative controls were treated identically, but with normal serum. After mounting, slides were observed under microscope and pictures taken. The expression of the CD4+, CD8+ T cells were evaluated using an optical microscope (BX53F; Olympus). Quantitation of the positive cells in the tumor sections was performed using methods described in Chunling Ma et al. Briefly, the number of positive cells were counted in 5 areas that included both cancer nest and stromal areas at a high-power field (200×), and the average number of positive cells per high-power field was calculated. pERK staining was assigned a score using a semi-quantitative six-category grading system: 0, no staining; 1, 1–10% staining; 2, 11–25% staining; 3, 26–50% staining; 4, 51–75% staining; and 5, >75% staining. Staining intensity was assigned a score using a semi-quantitative four-category grading system: 0, no staining; 1, weak staining; 2, moderate staining; and 3, Strong staining. Every core was assessed individually and the mean of five readings was calculated for every slide. Staining score was determined separately by two experts under the same conditions. In rare cases, discordant scores were reevaluated and scored by another expert.
Alkaline single-cell agarose gel electrophoresis (Comet) assays
Alkaline single-cell agarose gel electrophoresis assays were performed according to the manufacturer’s instructions of Trevigin’s Comet Assays Kit. Briefly, cells were suspended in LMA agarose gel and then mounted on comet slides, followed by incubation in lysis solution for one hour at 4°C and freshly prepared alkaline unwinding solution (pH>13) for 20 minutes at 25°C in the dark. Electrophoresis was performed at 21V for 30 minutes in electrophoresis solution (pH>13). Tail DNA content was analyzed with Comet score 1.6 software after staining with SYBR Green I. The tail moment, which is stand for DNA strand breakage, was measured for 100 cells at least per sample, and average damage from three independent experiments was calculated.
RNA interference treatment
siRNA (100 μM) for human TMEM173 (SASI_Hs02_00371843, SASI_Hs01_00031033) and mouse TMEM173 (SASI_Mm02_00424289, SASI_Mm02_00424293) were from Sigma-Aldrich and were transfected separately according to the manufacturer instructions with Lipo3000 (Invitrogen, USA). Proteins were assessed 48 hours after transfection.
Western Blot analysis
Cells were lysed with RIPA buffer (Servicebio, G2002–100) supplemented with Protease and Phosphatase Inhibitor Cocktail (Servivebio, G2006). After thorough mixing and incubation at 4 °C for 45 min, lysates were centrifuged at 12000 g at 4°C for 25 min, and supernatants collected. Protein content was determined, and separated by 10% SDS-PAGE, and electro-transferred onto 0.45 μm polyvinylidene difluoride (PVDF) membranes. After blocking with 5% BSA in TBST at room temperature for 1 hour, membranes were incubated with primary antibodies at 4°C overnight, followed by 1:3000 horseradish peroxidase (HRP) –conjugated secondary antibody (Antgene) for 1 hr at room temperature. Bands were visualized using WesternBright™ ECL kit (Advansta, 190113-13).
dsDNA90 stimulation
dsDNA90 was prepared as follows: a single-stranded DNA (ssDNA) sense strand (5’-TACAGATCTACTAGTGATCTATGACTGATCTGTACATGATCTACATACAGATCTACTAGTGATCTATGACTGATCTGTACATGATCTACA-3’) was annealed to an ssDNA90 antisense sequence. Cells were seeded onto a 6-well culture plate for 24 hours and then transfected with dsDNA90 (0.5 μg/ml) according to the manufacturer instructions of Lipo 3000 (Invitrogen, USA). After transfection for 24 hours, cells were collected and used for further experiments.
Immunofluorescence staining and microscopy
Briefly, cells were fixed with 4% paraformaldehyde and then blocked with 5% normal blocking serum for 25 minutes and incubated with primary antibody of γH2AX (Ser139, #2577, 1:400 from Cell Signaling Technology) for 2 hours, followed by secondary antibody incubation for 1 hour at 25°C. Mounting in the medium containing DAPI (Sigma-Aldrich, D9542) for further image acquisition. OLYMPUS U-HGLGPS imaging acquisition system equipped with a 40x objective lens was used to capture images. At least 100 cells per slide were analyzed to count percentages for γH2AX foci positive cells.
PicoGreen staining
PicoGreen staining was performed according to the manufacture instructions of QuantiT Pico-Green dsDNA reagent (Thermo Fisher Scientific). For confocal microscopy, cells were incubated with PicoGreen 3 μl/ml for 1 hour at 37°C. Then cells were washed by PBS for 5 mins × 5 times and fixed for confocal microscopy with DAPI counterstaining.
RT-qPCR assays
Total RNA (1 μg) was reversely transcribed into cDNA with the Hiscript Q-RT SuperMix for qPCR (Vazyme Biotech) according to the manufacture instructions. The SYBR Green Real-Time PCR Master Mixes kit (Life Technologies) was used for the thermocycling reaction in a BioRad CFX96 Real-Time system. The mRNA levels analysis was carried out in triplicate and normalized by GAPDH. Primers sequences are listed in Supplementary Table 2.
ELISA
The cell culture supernatants were collected and processed according to the manufacturer’s instructions. The IL6 (EHC007(H).96) and GM-CSF (EHC105.96) levels were determined using ELISA kit for Human from Neobioscience. Human CXCL10 (EHC157.96) ELISA kit from Neobioscience, human CCL5 (DRN00B) ELISA kit from R&D, while the mouse CXCL10 ELISA kit from Thermo Fisher Science (BMS6018).
Flow cytometry and intercellular cytokine staining
Tumor tissues were washed in PBS, minced into small fragments, and incubated in collagenase solution (1 mg/ml collagenase IV in RPMI-1640) and DNase I (Sigma-Aldrich) at 37°C, 120 rpm for 2.5 hours. Dissociated cells were passed through a 40 μm strainer to achieve single cell suspensions followed by erythrocyte lysis. The following monoclonal antibodies were used in flow cytometry: Fixable Viability Stain 510, anti-CD45 (BV605; 30-F11), anti-CD3e (APC-Cy7; 145–2C11), anti-CD4 (FITC; RM4–5), anti-CD25 (PE-Cy7; PC61), anti-CD8a (PerCP-Cy5.5; 53–6.7),, anti-CD11c (PE-Cy7; HL3), anti-I-A/I-E (BV421; M5/114.15.2), anti-F4/80 (PE; T45–2342), anti-CD11b (FITC; M1/70), anti-CD49b (APC; DX), anti-Gr-1 (BV510), anti-Ly-6G (PE; 1A8), anti-Ly-6C (APC; AL-21) (all from BD Biosciences). Single cell suspensions were stained with 1 μg/sample fluorochrome-labeled antibodies for specific surface marker at 4 °C for 30 min in 100 μl PBS. Then the cells were fixed, permeabilized and stained for intracellular cytokines including anti-Foxp3 (BV421; MF23) and anti-IFN-γ (PE; XMG1.2) by using a fixation/permeabilization kit (BD Biosciences). Stained single-cell suspensions of tumor tissue were processed to flow cytometry using CytoFlex. The data was analysis by FlowJo v10 software. Gating strategies are displayed in supplementary figure 6.
Mass Cytometry (CyTOF)
Single cell suspensions were achieved as above. Tumor-infiltrating lymphocytes (TILs) were enriched on a gradient Ficoll (Sigma-Aldrich) solution. TILs were incubated with mouse anti-CD16/32 antibody (eBioscience, San Diego, CA, USA) to block FcγR binding for 10 minutes and then applied to CyTOF. For CyTOF analysis, TILs were incubated with a mixture of metal-labeled antibodies (listed below) for 30 minutes at 25°C, washed twice by PBS, and incubated with Cell-ID Intercalator-103Rh (Fluidigm, San Francisco, CA, USA) overnight at 4°C. The samples were analyzed with the CyTOF2 instrument (Fluidigm) in the Flow Cytometry and Cellular Imaging Core Facility at MD Anderson. Detailed antibodies used for CyTOF analysis are presented in Supplemental Table 3 (provided by Fluidigm).
Cytokine protein arrays
HOC7 cells were treated with vehicle, olaparib (5 μM), trametinib (500 nM) and combined therapy for 24 hours and collected supernatant for cytokine analysis. A semiquantitative membrane-based RayBio Human Inflammation Antibody Array kit (Human inflammation Array C3) was used to analyze a panel of 40 inflammatory mediators according to manufactory instructions. After immunoblotting, the reaction intensity was quantified using NIH ImageJ software. The data were normalized expressed as Z-score of the mean fold changes as a ratio of vehicle cohort.
Animal Models
All manipulations were performed in accordance with the Guide for the Care and Use of Laboratory Animals of Tongji Hospital. Female, 8 weeks old NOD/SCID mice, FVB mice, nude mice, C57BL-6J mice and Balb/C mice were purchased from Beijing HFK Bioscience and housed in laminar flow cabinets under specific pathogen-free conditions. Tumor size and mouse weight were monitored every 3 days. Tumor volumes were calculated using tumor volume = 1/2 (length×width2).
LPA1-T22 and LPA1-T127 syngeneic breast cancer model
LPA1-T22 tissues were obtained from a transgenic mouse model which expressed LPA1 receptor in mammary epithelium. And LPA1-T127 tissues were obtained from a transgenic mouse model which expressed LPA1 receptor in mammary epithelium and spontaneous KRASQ61H mutation. Minced fresh tumor tissue (0.1cm3 per mouse) was transplanted into the mammary fat pads of FVB mice. After the tumor were palpable, the mice were randomly assigned to treatment cohorts. In Figure 1A–B, mice were randomized into treatment cohorts as: vehicle (0.5% hydroxypropylmethylcellulose and 0.2% Tween 80 and IgG isotype control), BMN673 (0.333 mg/kg/day), anti-PD-L1 antibody (αPD-L1, 200 μg/mouse every 3 days for six time) and doublet (n=8 for each group); In Figure 6A, LPA1-T127 mice were randomized into treatment cohorts as: vehicle (0.5% methylcellulose or 10% DMSO in (2-Hydroxypropyl)-b-cyclodextrin/PBS solution), olaparib (50mg/kg/QD), trametinib (1 mg/kg/QD) and doublet (n=6 for each group); In Figure 7A, LPA1-T127 mice were randomized into treatment cohorts as: vehicle (0.5% methylcellulose or 10% DMSO in (2-Hydroxypropyl)-b-cyclodextrin/PBS solution and IgG isotype control), olaparib (50mg/kg/QD), trametinib (1 mg/kg/QD),αPD-L1 (200 μg/mouse every 3 days for six time), the combination of olaparib and trametinib, the combination of olaparib and anti-PD-L1, the combination of trametinib and anti-PD-L1 and triplet treatment (n=6 for each group).
Figure 1. Mutant KRAS is associated with PARPi, anti-PD-L1, and doublet combination therapy resistance in vivo.

(A and B) KRASWT(LPA1-T22)and KRASQ61H mutation (LPA1-T127) tumors were transplanted into the mammary fat pads of FVB mice. Eight days later, mice were randomized into treatment cohorts: vehicle (0.5% hydroxypropylmethylcellulose and 0.2% Tween 80), BMN673 (0.333 mg/kg per day), anti-PD-L1 antibody (200 μg/mouse every three days) or the combination of BMN673 and anti-PD-L1 (n=8 for each group). Tumor measurements were performed every 3 days by calipers, and average tumor volume ± SEM for each cohort is displayed. P values were determined by One-way analysis of variance test.
(C) PCA analysis was performed on each protein from RPPA data. Ellipses indicate 95% confidence interval of group membership. Axis percentages indicate variance contribution.
(D) Volcano plot shows differentially expressed proteins from RPPA data of LPA1-T22 and LPA1-T127. Proteins above the horizontal line and to the left and right of the vertical line exhibited over- (red circle) and under expression (green circle), respectively. Black circles represent non-differentially expressed proteins.
(E) Heatmap of RPPA data represents differentially expressed proteins (Log2 (Fold Change) ≥ 1, p<0.001). Different passages showed in X axis. Statistically significant changes (z- scores) indicated in boxes.
(F) Box plot of differentially expressed pMAPK, pMEK1 from RPPA data, Student’s t test.
(G) Murine MC38 colorectal cancer cells (5×10⁵) were subcutaneously injected into the right flank of C57BL-6J mice (6–8 weeks old). When tumors were palpable, mice were randomized into treatment cohorts accordingly (n=8).
(H) Murine CT26 colorectal cancer cells (2×10⁵) were subcutaneously injected into the right flank of Balb/C mice (6–8 weeks old). When tumors were palpable, mice were randomized into treatment cohorts accordingly (n=5).
In A-B, G and H data represent mean ± SEM.*p<0.05, **p<0.01, ***p<0.001, Non-parametric pairwise comparisons (Mann-Whitney).
Figure 6. MEKi reshapes the TME by decreasing myeloid cells in KRAS mutant tumors.
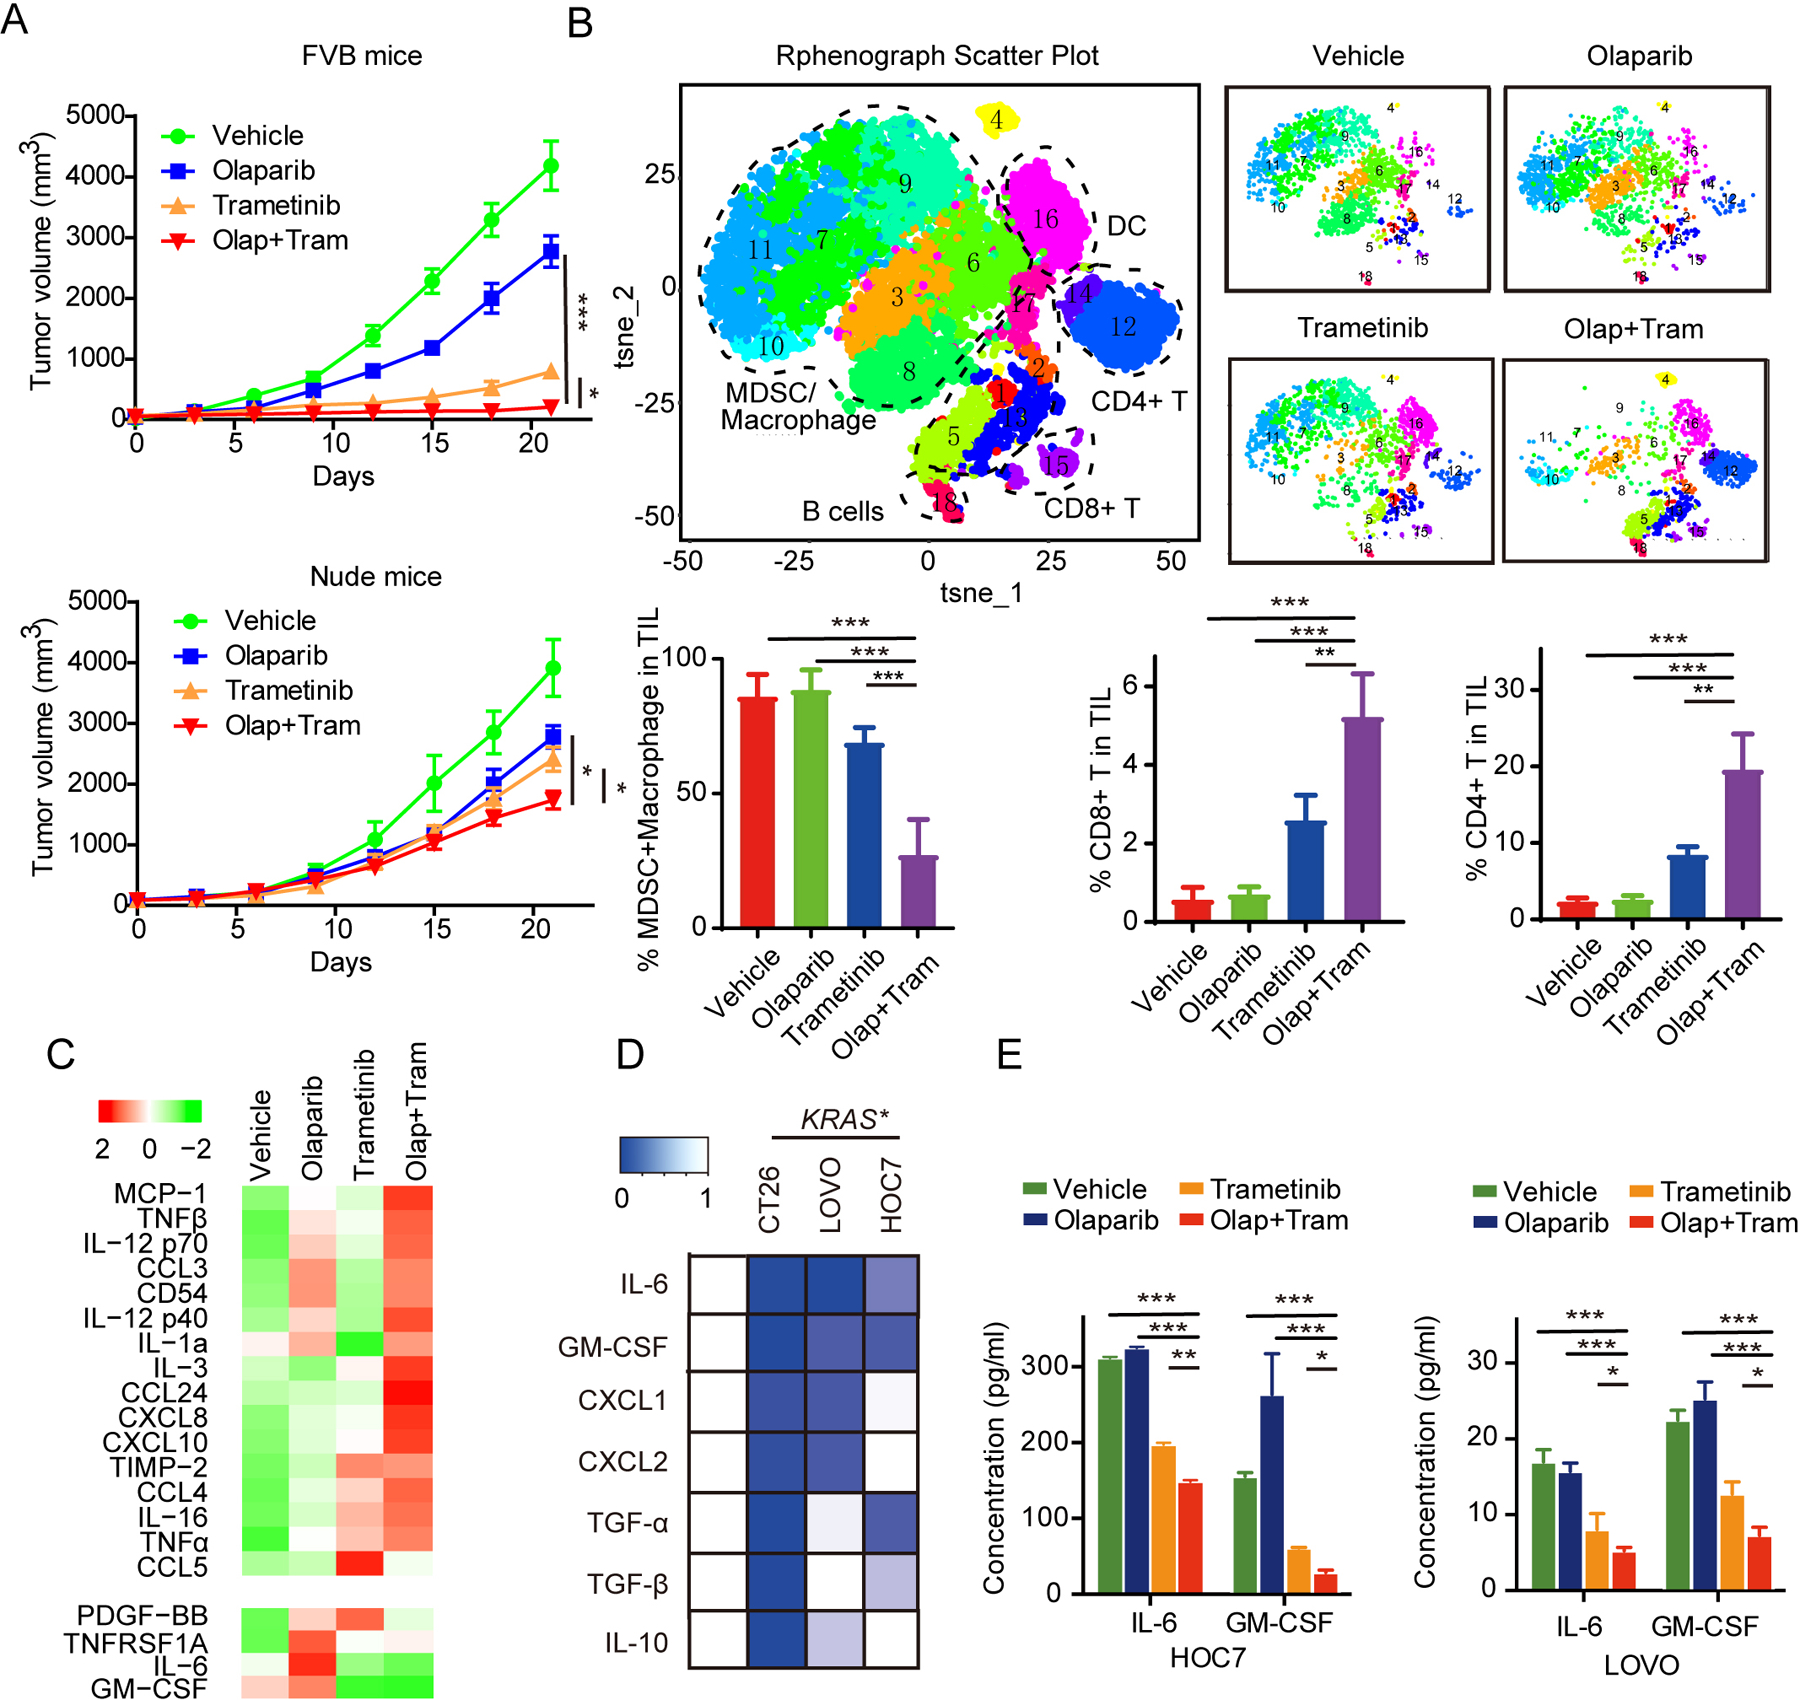
(A) LPA1-T127 tumors were transplanted into the mammary fat pads of FVB immune-competent mice (upper) or Nude mice (bottom). Eight days later, mice were randomized into treatment cohorts: vehicle (0.5% hydroxypropylmethylcellulose and 0.2% Tween 80), olaparib (50 mg/kg per day), trametinib (1 mg/kg per day) or the combination of olaparib and trametinib (n=6 for each group). Average tumor volumes ± SEM for each cohort is displayed. P values were determined by non-parametric pairwise comparisons (Mann-Whitney).
(B) LPA1-T127 tumors in FVB mice treated as in (A) were harvested on day 21 for CyTOF analysis. t-SNE analysis of immune cells by relative expression of CyTOF markers, with population indicated. Quantification of MDSCs/macrophage (CD45+CD11b+), CD8+ T (CD45+ CD3+ CD8+) and CD4+ T (CD45+ CD3+ CD4+) cells in different therapy cohorts. Data across panels are mean ± SEM. p values were determined by ANOVA. **p < 0.01. ***p<0.001.
(C) HOC7 cells were treated with vehicle, olaparib (5 μM), trametinib (500 nM) and combined therapy for 24 hours, and then culture supernatants were collected for assessment of cytokines and chemokines by inflammatory cytokines arrays. Heatmap of statistically difference (z-score) cytokines were shown.
(D) Heatmap of relative expression of IL6, GM-CSF, CXCL1, CXCL2, TGF-α, TGF-β and IL10 in KRASMT (HOC7, LOVO and CT26) cell lines after treatment with vehicle or trametinib (500 nM) for 24 hours.
(E) HOC7 and LOVO were treated as in (C) and IL6 and GM-CSF secretion were quantified in culture media by ELISA. Data are mean ± SEM. *p<0.05. **p < 0.01. ***p<0.001. One-way ANOVA.
Figure 7. MEKi, PARPi, and anti-PD-L1 combination is highly effective in KRAS mutant tumors.

(A) LPA1-T127 tumor tissues were transplanted into the mammary fat pads of FVB immune-competent mice. Eight days later, mice were randomized into treatment cohorts: vehicle (0.5% hydroxypropylmethylcellulose, 0.2% Tween 80 and IgG isotype control), olaparib (50 mg/kg per day), trametinib (1 mg/kg per day) or the combination of olaparib and trametinib and/or αPD-L1 antibody (200 μg/mouse every three days, six times) (n=6 for each group). Treatment were terminated at Day 20, while trametinib plus olaparib and triplet therapy groups continued to be observed the change of tumor volume (Left panel). CT26 cells (2×10⁵) were subcutaneously injected into the right flank of Balb/C mice (6–8 weeks old). After the tumor were palpable, the mice were randomly assigned to treatment cohorts accordingly (n = 6 for each group). Treatment were terminated at day 15, and then tumors growth was kept be observed for another two weeks (Right panel). p values were determined by non-parametric pairwise comparisons (Mann-Whitney). *p<0.05. **p < 0.01. ***p<0.001. Red line stands for vehicle group; green line stands for olaparib group; blue line stands for trametinib group; carmine line stands for the αPD-L1 group; purple line stands for the combination of trametinib and olaparib group; orange line stands for the doublet combination of olaparib and αPD-L1 group; blue green line stands for triplet therapy group.
(B) CT26 cells (2×10⁵) were subcutaneously injected into the left flank of Balb/C mice (6–8 weeks old). After the tumor volume reached 200–500 mm3, CT26 mice were randomized into treatment cohorts accordingly (n=6 for each group). Tumor size and mouse weight were monitored every 3 days. We stopped treatment at day 15 and then tumors growth was kept be observed for another 16 days. p values were determined by non-parametric pairwise comparisons (Mann-Whitney). *p<0.05. **p < 0.01. ***p<0.001.
(C) Quantification of MDSCs, PMN-MDSCs, M-MDSCs proportions in tumors from each group respectively. n = 3. p values were determined by ANOVA. **p < 0.01. ***p<0.001.
(D) Representative images of IHC with indicated antibodies in tumor tissues from CT26 models (A) (upper panel). Quantification of number of CD4+, CD8+ cells, and pERK scores after treatments (bottom panel). Scale bars, 50 μm. p values were determined by ANOVA. *p<0.05, **p < 0.01. ***p<0.001.
CT26 subcutaneous model
2×10⁵ CT26 cells were injected s.c. into right flank of the Balb/c mice (female, 6–8 weeks) in a 1:1 mix of PBS and Matrigel. After the tumor were palpable, the mice were randomly assigned to treatment cohorts. In Figure 1H, mice were randomized into treatment cohorts as: vehicle (0.5% hydroxypropylmethylcellulose and 0.2% Tween 80 and IgG isotype control), olaparib (50 mg/kg/QD), αPD-L1 (200 μg/mouse every 3 days for six time) and doublet (n=5 each group). In Figure 7A, CT26 mice were randomized into treatment cohorts as: vehicle (0.5% methylcellulose or 10% DMSO in (2-Hydroxypropyl)-b-cyclodextrin/PBS solution and IgG isotype control), olaparib (50mg/kg/QD), trametinib (1 mg/kg/QD), αPD-L1 (200 μg/mouse every 3 days for six time), the combination of olaparib and trametinib, the combination of olaparib and anti-PD-L1, the combination of trametinib and anti-PD-L1 and triplet treatment (n=5 for each group). Treatment were terminated at day 15, and then tumors growth was kept be observed for another two weeks. In Figure 7B, 2×10⁵ CT26 cells were injected s.c. into left flank of the Balb/c mice (female, 6–8 weeks). After the tumor volume reached 200–500 mm3, CT26 mice were randomized into treatment cohorts as accordingly (n=6 for each group).
MC38 subcutaneous model
5×10⁵ MC38 cells were injected s.c. into right flank of C57BL/6J mice (female, 6–8 weeks). After tumors were palpable, mice were randomly assigned to treatment cohorts. In Figure 1G, mice were randomized into treatment cohorts as: vehicle (0.5% hydroxypropylmethylcellulose and 0.2% Tween 80 and IgG isotype control), olaparib (50 mg/kg/QD), αPD-L1 (200 μg/mouse every 3 days for six time) and doublet (n=8 each group). Treatment was terminated at day 21.
Nude mouse model
Minced LPA1-T127 tumor tissue (0.1 cm3 per mouse) was transplanted into the mammary fat pads of nude mice. In Figure 6A, after the tumor were palpable, the mice were randomly assigned to four groups which were vehicle (0.5% methylcellulose or 10% DMSO in (2-Hydroxypropyl)-b-cyclodextrin/PBS solution), olaparib (50 mg/kg/QD), trametinib (1 mg/kg/QD) and doublet (n=6 for each group).
Computational Analysis
The gene expression datasets of patient-derived xenografts (PDX) from patients with pancreatic adenocarcinoma (PDAC), an inducible mouse model of NRAS-mutant melanoma, human pancreatic ductal epithelial (HPDE) cells transduced with KRASG12D and bronchial epithelial cells 16HBE (GEO access number: GSE98399, GSE58055, GSE39984, GSE63229) were got from the NCBI GEO database (http://www.ncbi.nlm.nih.gov/geo/). Samples included were innately or inducible to be RAS mutant. The following information was also extracted from each identified study: GEO accession number, sample type, number of cases and controls, and gene expression data.
For GSEA analysis, the expression value of each gene was regarded as the average value corresponding to the same gene and was normalized using the LIMMA package of the R platform (version 3.5.1.; www.r-project.org). The biological pathways were further explored with GSEA using data derived from the Molecular Signatures Database of c2. P values were calculated by the clusterProfiler package, and p<0.05 were determined to confer statistical significance.
Gene list of interferon responsive genes for heat map analysis was obtained from QIAGEN RT2 Profiler PCR Arrays (https://www.qiagen.com).
The analysis of correlation between activities of KRAS signaling and expression of MDSCs signature was performed as previously described (23).
Quantification and Statistical Analysis
Two-sided Student’s t test was used to compare differences between two groups of cells in vitro. If the multiple groups data followed a normal distribution, we used ANOVA test for multiple comparisons. Non-parametric pairwise comparisons (Mann-Whitney) were conducted where xenograft size did not follow a Gaussian distribution in vivo. Data are presented as means ± SEM and p<0.05 is considered significant. Correlation between groups was determined by Pearson’s correlation test. Analysis of variance was used to compare differences among multiple groups. Data were analyzed and plotted using GraphPad Prism 7 software. Statistical parameters including sample size and statistical significance are reported in the figures and corresponding figure legends.
Results
Mutant KRAS is associated with PARPi, anti-PD-L1, and combination therapy resistance in vivo.
To identify biomarkers for sensitivity to combined PARPi and anti-PD-L1 blockade, we assessed the effects of PARPi and anti-PD-L1 combinations in immunocompetent syngeneic MMTV-LPA receptor transgene-induced transplantable tumor models which are a heterogeneous group of genetically engineered breast cancer mouse models (GEMMs) (24). Like human PDX, the tumors have never been cultured on plastic and thus may be more representative of human tumors (24). Strikingly, while combination therapy induced complete tumor regression and durable response in LPA1-T22 tumors (Figure 1A), the LPA1-T127 model was not only highly resistant to PARPi or anti-PD-L1 monotherapy but also to combination therapy (Figure 1B). No significant changes in body weight were observed, indicating the overall safety of the therapy (Supplemental Figure 1A). To reveal mechanisms underlying resistance of the LPA1-T127 tumors, we performed whole-exome sequencing (WES) and identified a spontaneous KRASQ61H mutation (24). Principal component analysis (PCA) of reverse phase protein arrays (RPPA) with 170 total and phosphoproteins (Supplemental Figure 1B, (25)) showed distinctive functional protein profiles between LPA1-T127 and LPA1-T22 tumors (Figure 1C). Consistent with the acquired functional KRAS mutation, pMEK1/2 and pMAPK were remarkably upregulated in LPA1-T127 tumors (Figure 1D–F). Fibronectin (a mesenchymal marker gene) and vascular endothelial growth factor receptor (VEGFR), both of which are induced by KRAS mutation to promote tumor growth and migration (25), were elevated in LPA1-T127 tumors (Figure 1E). Moreover, phospho-NF-κB p65 (pNF-κB) and STAT5a, two key inflammatory cytokine regulators, were decreased in LPA1-T127, consistent with MAPK pathway activation inducing an immunosuppressive TME (Figure 1D, Supplemental Figure 1C).
To confirm that the resistance of KRAS mutant tumors to PARPi and anti-PD-L1 is not model specific, we investigated the effect of the PARPi and anti-PD-L1 combination in two additional murine colon cancer models with different KRAS mutant status (CT26: (KRASG12D) and MC38 (KRAS Wildtype)). Consistent with the observations in LPA1-T22 tumors, combination therapy with PARPi and anti-PD-L1 induced significant tumor regression in MC38 (KRASWT) tumors. However, CT26 tumors did not respond to olaparib or anti-PD-L1 alone or in combination (Figure 1G–H). No significant weight changes were observed consistent with a lack of toxicity (Supplemental Figure 1D).
PARPi induced STING signaling and interferon responses are decreased in KRAS mutant cancer cells
PARPi induces DNA double-strand breaks (DSBs), causes cell cycle arrest in S phase, induces accumulation of cytosolic dsDNA, and activates the STING signaling pathway (26). STING, in turn, induces phosphorylation and nuclear translocation of the IFN transcriptional regulatory factor TANK-binding kinase 1 (TBK1) and IFN regulatory factor 3 (IRF3) (27,28). To verify causal effects of KRAS mutation on PARPi induced STING activation, we took advantage of an iKRASG12D cell (primary murine pancreatic cancer cells established from p48 Cre_tetO_LKrasG12D ROSA_rtTAL+p53L+mice) (29), in which oncogenic KRAS allele is inducible with Doxycycline (Dox) (29). Remarkably, while PARPi increased activation of TBK1, IRF3 and STAT1 in the absence of Dox, induction of KRASG12D with Dox abrogated the effects of PARPi (Figure 2A). Consistent with this observation, CCL5, CXCL10, two major target genes downstream of STING activation that are involved in T-cell chemotaxis (30), as well as ISG15 and IFI44 mRNA, two IFN-stimulated genes (ISGs) (31), were upregulated in the absence of Dox, and induction of KRASG12D with Dox abrogated the effects of PARPi (Figure 2B). Further, PARPi did not increase CXCL10 secretion as detected by ELISA in Dox on cells (Figure 2C). This potent and specific effect supports a causal role for KRAS in blocking PARPi-induced STING activation.
Figure 2. PARPi induced STING signaling and interferon responses were alleviated in KRAS mutant cancer cells.

(A) Dox-inducible iKRAS cells were incubated with Dox (2μg/mL) for 48hours, then treated with vehicle or olaparib (5 μM) for another 24 hours with or withdraw Dox. Then cells were collected for western blot with indicated antibodies.
(B-C) Quantification of CCL5, CXCL10, ISG15 and IFI44 expression by RT-qPCR, and CXCL10 secretion levels by ELISA (C) in iKRAS cell in the presence or absence of Dox (2μg/mL) after treatment with vehicle or 5 μM olaparib for 24 hours.
(D and E) Expression of pERK, and STING pathway signaling (STING, pTBK1, pIRF3 and pSTAT1) in both KRAS WT (MC38) and KRASG12D (CT26) cell lines after vehicle or 5 μM olaparib treatment for 24 hours by Western blot (left panel). CCL5, CXCL10, ISG15 and IFI44 gene expressions were quantified by RT-qPCR (middle panel), and CXCL10 secretion in culture media was quantified by ELISA (right panel). Data are shown as mean±SEM from each of three independent experiments. n=3.
(F) Heatmap showed z-score of relative expression changes of CCL5, CXCL10, ISG15 and IFI44 expression by RT-qPCR in KRAS WT (A2780, MC38, NCI-H1793 and OVCAR3) and KRASMut (TOV-21G, HOC7, LOVO, A549, CT26, Pa02C, Pa16C, MACS, HEYA8 and NCI-H441) cell lines treated with 5 μM olaparib for 24 hours (olaparib/vehicle).
(G) Western blot pERK, and STING pathway signaling (STING, pTBK1, pIRF3 and pSTAT1) activation levels in CT26, LOVO HOC7 and NCI-H441 after treatment with vehicle, or trametinib (500nM) for 24 hours.
(H) Quantification of CXCL10 secretion by ELISA in iKRAS cells induced by DOX for 48 hours and subsequently treated with or without 500nM trametinib for 24 hours.
(I) Heatmap showed relative expression changes of CCL5, CXCL10, ISG15 and IFI44 by RT-qPCR in KRAS WT (A2780, MC38, NCI-H1793 and OVCAR3) and KRASMut (HOC7, LOVO, CT26, Pa02C, Pa16C, MACS, A549 HEYA8 and NCI-H441) cell lines treated with 500 nM trametinib for 24 hours.
(J) Gene Set Enrichment Analysis (GSEA) identified the IFN-stimulate genes (ISGs) significantly elevated after treating with MEK, ERK inhibitor and iKRAS depletion with Dox withdraw in indicated GEO datasets. The bar graph shows enrichment score (ES) in indicated datasets. The top symbol indicates the suppression methods of MAPK pathway. The p values were calculated by the clusterProfiler package of the R platform (version 3.5.1.; www.r-project.org).
In B-C, data represent mean ± SEM.*p<0.05, **p<0.01, ***p<0.001 calculated by One-way ANOVA. In D-E, H were analysis by Student’s t test.
To explore if mutant KRAS would block PARPi-induced STING activation, we assessed the effects of olaparib on STING signaling in MC38 and CT26 cells in vitro by western blot. While pIRF3, pTBK1, and pSTAT1were markedly elevated by olaparib in MC38, STING activation by olaparib was suppressed in CT26 (Figure 2D–E, left). CCL5, CXCL10, ISG15 and IFI44 mRNA and CXCL10 secretion were elevated in MC38 cells but not in CT26 cells (Figure 2D–E).
To determine the generalizability of the effects of KRAS on PARPi induced STING signaling, we assessed CCL5, CXCL10, ISG15 and IFI44 mRNA levels with or without PARPi on 12 well-characterized cancer cell lines, including 9 KRAS mutant cell lines (4 ovarian, 2 colon, 2 lung, and 2 pancreatic) and 4 KRAS wild type cancer cell lines (2 ovarian, 1 lung and 1 colon) (Figure 2F and Supplemental Figure 2A–C). As expected, olaparib markedly elevated CCL5, CXCL10, ISG15 and IFI44 mRNA and CXCL10 secretion in KRASWT cells. In contrast, olaparib failed to induce STING activation in a broad array of KRAS mutant cells demonstrating generalizability (Figure 2F).
Interestingly, inhibition of the MAPK pathway in KRAS mutant cells with trametinib was sufficient to increase IRF3, STAT1 and TBK1 activation in murine CT26 cells (KRAS mutant) and in human HOC7 (KRASG12A) and LOVO (KRASG13D) and NCI-H441 (KRASG12V) (Figure 2G), and induce CXCL10 protein secretion in iKRAS cells with Dox-on (Figure 2H). To determine the generalizability of the effects of trametinib-induced STING signaling in KRAS mutant cells, we assessed CCL5, CXCL10, ISG15 and IFI44 mRNA levels with or without MEKi on 12 well-characterized cancer cell lines (Figure 2I). As expected, trametinib markedly elevated CCL5, CXCL10, ISG15 and IFI44 mRNA in all KRAS mutant cells but A549 cells (Supplemental Figure 2D). Considering A549 cells (KRAS mutant, LKB1 mutant) are STING absent (32), this result further support the important role of STING plays in activating ISGs after MEKi. In contrast, MEKi failed to induce STING activation in KRASWT cells (Figure 2I). Moreover, cobimetinib, another MEKi, recapitulated the effects of trametinib on STING and ISG activation (Supplemental Figure 2E–F).
We subsequently assessed the effects of MAPK inhibition on ISG levels in KRAS mutant tumors by gene set enrichment analysis (GSEA) (Supplemental Figure 2G–J). Four GEO datasets (GSE98399, GSE63229, GSE39984, GSE58055) revealed that molecular or genetic inhibition of depletion of MAPK induced IFN signatures and ISG expression (Figure 2J). Thus, inhibition of the RAS/MAPK pathway is sufficient to induce STING signaling and interferon pathway activation in KRAS mutant cells.
MEKi triggers and amplifies PARPi-induced STING signaling and IFN responses in vitro
We subsequently explored the effects of combination MEK and PARP inhibition in activating STING signaling. PARPi did not activate TBK1, IRF3, and STAT1 in iKRAS cells with Dox-induced KRAS expression (Figure 3A–B). In contrast, the MEKi and PAPRi combination remarkably enhanced CCL5, CXCL10, ISG15 and IFI44 levels in Dox-on iKRAS cells (Figure 3A–B).
Figure 3. MEKi triggers and amplifies PARPi-induced STING signaling and IFN responses in vitro.

(A-B) iKRAS cells were pretreated with Dox (2μg/mL) for 48 hours and then treated with vehicle, olaparib (5 μM), trametinib (500 nM), as well as combined therapy for 24 hours. Then cells were collected for Western blot with indicated antibodies (A), and RT-qPCR analysis of CCL5, CXCL10, ISG15 and IFI44 expression (B).
(C) NCI-H441, human lung cancer cells were treated with vehicle, olaparib (5 μM), trametinib (500 nM), as well as combined therapy for 24 hours. Then cells were assessed with indicated antibodies by western blot.
(D-F) Human LOVO (D), HOC7 (E) and murine CT26 cells (F), were treated with vehicle, olaparib (5 μM), trametinib (500 nM), as well as combined therapy for 24 hours. Then cells were assessed with indicated antibodies by western blot, and expression of CCL5, CXCL10, ISG15 and IFI44 by RT-qPCR, and CXCL10 secretion by ELISA.
In B, D-F, data represent mean ± SEM.*p<0.05, **p<0.01, ***p<0.001. n.s, not significant. p values were determined by ANOVA.
To demonstrate generalizability, we assessed STING signaling and IFN in 7 additional KRAS mutant cancer cell lines. Olaparib alone had limited effects on STING signaling (pTBK1, pIRF3, and pSTAT1) or IFN responses detected by RT-qPCR and ELISA (CXCL10, CCL5). Trametinib monotherapy modestly activated STING signaling and IFN responses. Once again, combination therapy with olaparib and trametinib markedly activated STING signaling and downstream IFN responses in NCI-H441, LOVO, HOC7, CT26, HeyA8, Pa02c, and Pa16c cells (Figure 3C–F, Supplemental Figure 3A–E). Furthermore, olaparib and cobimetinib induced similar effects in HOC7 (Supplemental Figure 3F). Together, these data indicate that combined MAPK pathway inhibition and PARPi activates STING and interferon signaling in KRAS mutant cells.
MEKi and combination therapy induce DNA damage and cytosolic dsDNA accumulation in KRAS mutant cells
The presence of cytosolic dsDNA triggers cGAS/STING-mediated innate immune responses (33). Given that MEKi decrease HR capacity in RAS mutant cells (34), we reasoned that MEKi itself might activate and as well exacerbate PARPi-induced STING signaling by generating cytosolic dsDNA. Combination therapy with PARPi and MEKi indeed markedly induced DNA damage (γH2AX) detected by immunofluorescence and western blot in iKRAS with Dox-on, LOVO, CT26, HOC7, and NCI-H441 cells (Figure 4A, Supplemental Figure 4A–D). It is noteworthy that PARPi alone triggered DNA damage in iKRAS cells without Dox, and induction of KRAS with Dox abrogated the effect (Figure 4B). However, trametinib augmented PARPi-induced DNA damage as evidenced by an increased amount of DNA in tails in comet assays in iKRAS cells with Dox-on, CT26, and HOC7 cells (Figure 4B). We further hypothesized that MEKi or combination therapy might specifically favor the formation of cytosolic DNA, so we detected dsDNA with PicoGreen in cells after various treatments. Trametinib, but not olaparib monotherapy, led to cytosolic dsDNA accumulation in iKRAS cells with Dox-on, CT26, and LOVO cells (Figure 4C–D, Supplemental Figure 4E–F). Importantly, dsDNA accumulation was exacerbated by combined PARPi and MEKi treatment (Figure 4C–D, Supplemental Figure 4E–F).
Figure 4. MEKi and combination therapy induce DNA damage and cytosolic dsDNA accumulation in KRAS mutant cells.

(A) CT26, HOC7, iKRAS with Dox-on and NCI-H441 cells were treated with vehicle, olaparib (5 μM), trametinib (500 nM) and combined therapy for 24 hours and subjected to western blot with pERK1/2 and γH2AX.
(B) iKRAS cells were pretreated with Dox (2μg/mL) for 24 hours and then treated with vehicle, olaparib (5 μM), trametinib (500 nM), as well as combined therapy for 24 hours and iKRAS cells were directly treated with vehicle, olaparib (5 μM) for 24 hours and subjected to Comet analysis. HOC7 and CT26 were treated as in (A) and subjected to Comet analysis. DNA damage is quantified as percentage DNA in tails from three independent experiments.
(C-D) Representative images and quantification of PicoGreen staining after treatment as in B in iKRAS cells.
(E-F) RT-qPCR analysis of CCL5, CXCL10, ISG15 and IFI44 expression in HOC7 with depletion of STING by STING inhibition (1 μM H151) for 24 hours (E) or si-STING (100μM) for 48 hours (F).
(G) iKRAS cells with or without Dox were treated with dsDNA90 (the well-known cGAS/STING activator), CCL5, CXCL10, ISG15 and IFI44 expression were quantified by RT-qPCR.
In B, E-G data represent mean ± SEM of three independent experiments. * p<0.05, **p<0.01, ***p<0.001, p values were determined by One-way ANOVA. n.s, not significant. In D data represent mean ± SEM of three independent experiments and p values was determined by student’s t test when compared two groups of iKRAS cell, while One-way ANOVA was performed when compared four groups of iKRAS Dox-on.
Pharmacological or siRNA-mediated STING inhibition resulted in significantly reduced expression of CCL5, CXCL10, and ISG post-MEKi or combination treatment in human HOC7 (Figure 4E–F, Supplemental Figure 4G–I) and murine CT26 (Supplemental Figure 4G and J) cells, indicating the involvement of cGAS/ STING in this process. To exclude the possibility of dsDNA sensor defects caused by KRAS, iKRAS cells were treated with dsDNA90 to directly activate cGAS/STING (35) with or without Dox. Interestingly, Dox-induced KRAS expression did not alleviate dsDNA90 induced CCL5, CXCL10, and ISG expression indicating that the STING pathway was intact (Figure 4G). Moreover, iKRAS depletion did not further enhance dsDNA90 induced ISG expression (Supplemental Figure 4K). Collectively, these results support the notion that MEKi was sufficient to trigger and exacerbate PARPi induced innate immune activation in KRAS mutant cells by inducing DNA damage and cytosolic dsDNA accumulation in a STING dependent manner.
Induction of MAPK activity in KRAS wild type cells alleviates PARPi induced IFN activation
Fetal bovine serum (FBS) contains growth factors such as epidermal growth factor (EGF) (36) and lysophosphatidic acid (37) that are sufficient to induce activation of the MAPK pathway in KRAS wild type Hela S3 cells. Remarkably, while PARPi increased CCL5, CXCL10, ISG15 and IFI44 mRNA under serum-starvation conditions, in the presence of FBS, the effects of PARPi on chemokine production were abrogated (Figure 5A). Inhibition of MEKi reversed the effects of serum on PARPi induced production of chemokines (Figure 5B). The effects of serum were recapitulated by EGF including the inhibition of the effect of EGF by MEKi (Figure 5B). Furthermore, MEKi was sufficient to increase STING signaling (pTBK1, pIRF3, and pSTAT1) (Figure 5C), CCL5, CXCL10, ISG15 and IFI44 mRNA (Figure 5D) and CXCL10 secretion in Hela S3 cells cultured with FBS (Figure 5E). Together, these data indicate that MAPK pathway activation in KRAS wild type cells can alleviate PARPi-induced STING and IFN signaling.
Figure 5. Induction of MAPK activity in KRAS wild type cells alleviates PARPi induced IFN activation.

(A) First, Hela-S3 cells precultured in serum-free or complete medium for 48 hours. DMSO (vehicle) or olaparib (5 μM) was then added to cells, and the cells were further incubated for 24 hours in the same medium. Cell lysates were subjected to RT-qPCR with expression of CCL5, CXCL10, ISG15 and IFI44 genes.
(B) Serum-starved Hela-S3 cells treated as indicated: DMSO (vehicle), olaparib (5 μM), EGF (50 ng/ml), olaparib (5 μM) and trametinib (500 nM) for further 24 hours. Expression of CCL5, CXCL10, ISG15 and IFI44 genes assessed by RT-qPCR.
(C-D) Hela-S3 cell treated with DMSO (vehicle), olaparib (5 μM), trametinib (500 nM) for 24 hours and combinational therapy and subjected to WB with indicated proteins (C) and RT-qPCR with expression of CCL5, CXCL10, ISG15 and IFI44 genes (D).
(E) Hela-S3 cell treated with DMSO (vehicle), olaparib (5 μM), trametinib (500 nM) for 24 hours and combinational therapy and subjected to evaluation of CXCL10 secretion in different treatment cohorts and different time points (6h, 24h and 48h) by ELISA.
(F) Hela-S3 cell were treated as in (C) and subjected to western blot with γH2AX.
(G) Representative images and quantification (left) for γH2AX foci and dsDNA by Immunofluorescence staining and PicoGreen staining in Hela-S3 cell treated as in (A). DAPI (blue) was used to visualize the nuclei. data represent mean ± SEM of three independent experiments. *p<0.05, **p<0.01, ***p<0.001, One-way ANOVA.
(H) Hela-S3 cell were treated as in (C) and subjected to Comet analysis. DNA damage is quantified as percentage DNA in tails from three independent experiments. ***p<0.001, One way ANOVA.
Further, in Hela cells cultured with FBS, where the MAPK pathway was activated (Figure 5A), combination therapy with PARPi and MEKi markedly induced DNA damage as assessed by γH2AX protein (Figure 5F), γH2AX foci (Figure 5G) and Comet assay (Figure 5H). Combination therapy also increased cytosolic dsDNA (Figure 5G), mimicking the effects observed in KRAS mutant cells.
MEKi reshape the TME by decreasing myeloid cells in KRAS mutant tumors
Interestingly, the effects of MEKi and PARPi on growth of KRAS mutant LPA1-T127 tumors in immune-competent FVB mice were mitigated in immune-compromised nude mice (Figure 6A), consistent with the adaptive immune system participating in the antitumor activity of olaparib and trametinib. We thus determined whether MEKi and a combination of MEKi and PARPi would induce changes in tumor-infiltrating immune cells. Using mass cytometry (CyTOF) immunophenotyping with 11 lineage markers, we profiled TME of LPA1-T127 tumors in FVB mice (Figure 6A, Supplemental Figure 5A). Cytobank-based viSNE analysis revealed a complex cellular landscape of DC cells, T/B cells, and MDSCs/Macrophage cells with a high level of myeloid cells in LPA1-T127 tumors (Figure 6B). MEKi treatment slightly decreased myeloid cells, and in combination with PARPi dramatically diminished myeloid cells (Figure 6B). In contrast, PARPi alone had only modest effects on the TME. CyTOF analysis revealed that MEKi significantly increased the percentage of T cells, including CD4+ and CD8+ cells, which was further enhanced by combination treatment with PARPi (Figure 6B). These data suggest that KRAS mutant tumors are characterized by an immune-suppressive TME with high myeloid cell and low T cell infiltration. MEKi remodel immunity by decreasing myeloid cells and elevating T cell infiltration to activate antitumor immune effects, while the addition of PARPi to the MEKi reinforces these effects.
Cytokines secreted from tumor cells are critical determinants of immune cell recruitment. We thus audited 40 cytokines and chemokines in culture supernatants of HOC7 cells treated with vehicle, olaparib, trametinib or combined therapy (Supplemental Figure 5B). Densitometry analysis of these protein arrays revealed that several proinflammatory cytokines, including CXCL10, CCL3, CCL5, and TNFα/β were modestly increased after trametinib monotherapy and markedly enhanced by combination with PARPi (Figure 6C). Similar to the modest effects on the immune TME, PARPi had limited effects on the production of proinflammatory cytokines. Interestingly, immunosuppressive factors, including IL-6, GM-CSF and TNFRSF1A, were decreased by trametinib monotherapy or combination treatment with PARPi, but in contrast were increased by olaparib monotherapy (Figure 6C). GM-CSF and IL6 contribute to MDSC recruitment (38,39). Consistent with the protein arrays, MEKi inhibited mRNA levels for IL6 and GM-CSF, and other immunosuppressive chemokines including CXCL1 and CXCL2, IL10 and TGFβ, expression in CT26, HOC7 and LOVO cells (Figure 6D). Furthermore, trametinib alone or combined with olaparib substantially downregulation the secretion of IL6 and GM-CSF as detected by ELISA in HOC7 and LOVO cells (Figure 6E). GSEA analysis of the GSE58055 dataset also revealed that IL6 and GM-CSF pathway activity was suppressed when KRAS was decreased by removal of Dox (Supplemental Figure 5C). In conclusion, these data point to a potential effect of MEKi on modulating the immune repressive environment in KRAS mutant tumors through decreasing IL6 and GM-CSF and thus MDSCs recruitment resulting in a shift of the balance from a pro-tumorigenic to an anti-tumorigenic immune TME.
To assess a potential link between KRAS mutations and MDSCs in the TME in human tumors, we analyzed TCGA pan-cancer data using an established MDSCs signature (40) in ten tumor types in which RAS family mutational frequency was more than 10%. These tumor types showed a strong positive correlation between high MAPK signaling and enrichment of the MDSCs signature consistent with the effects of KRAS mutations on the immune microenvironment being manifest in human tumors (Supplemental Figure 5D).
MEKi, PARPi, and anti-PD-L1 combination is highly effective in KRAS mutant tumors
We next investigated the efficacy of triplet therapy with PARPi, MEKi and anti-PD-L1 in LPA1-T127 tumors. Neither PARPi or anti-PD-L1 alone nor the combination had a significant impact on tumor growth (Figure 7A, left). While MEKi alone modestly decreased tumor growth, combination treatment with anti-PD-L1 augmented the decreased tumor burden. MEKi plus PARPi, and triplet therapy showed similar anti-tumor activity at day 20, when therapy was stopped due to control tumors reaching a tumor volume endpoint requiring termination. Importantly following therapy termination, triplet therapy with MEKi, PARPi and anti-PD-L1 induced a statistically significant more durable response (Figure 7A, left).
We further assessed triplet combination therapy in the CT26 KRAS mutant tumor model. Trametinib monotherapy was highly effective in CT26 models. We thus stopped treatment at day 15 and continued observation until tumors in the vehicle group reached the designated tumor volume endpoint at day 24. Combination of MEKi with PARPi or anti-PD-L1 were more active than trametinib alone. Importantly, combination therapy of PARPi and MEKi with anti-PD-L1 achieved optimal effects with prolonged tumor control after cessation of therapy (Figure 7A, right). To further explore the anti-tumor effects of the triple combination of PARPi, MEKi, and anti-PD-L1, we initiated therapy after tumors reached a larger volume of approximately 200–500 mm3. Interestingly, while tumors grow gradually in PARPi and MEKi combination treatment after 14 days, 7/8 mice in the triplet cohort remained tumor-free at day 31 (Figure 7B) consistent with the potential that mice were “cured” by the combination. There was no evidence of toxicity as indicated by weight loss in mice with any therapy (Supplemental Figure 6A–B).
CT26 tumors were analyzed by multicolor flow cytometry for changes in the immune TME (Supplemental Figure 6C–E, Figure 7C). Consistent with sensitivity to trametinib monotherapy, trametinib markedly diminished MDSCs (both monocytic (mMDSCs) and granulocytic (gMDSCs) subsets. In contrast, olaparib or olaparib plus anti-PD-L1, which were ineffective as therapy, had limited effects on MDSCs. Further, olaparib or anti-PD-L1, or triple combinations did not reduce MDSCs populations compared to MEKi alone (Figure 7C). Trametinib monotherapy also increased CD3+ T cell infiltration and CD4+ helper T cells compared to vehicle-treated tumors. In contrast to the effects on MDSCs, addition of PARPi or PARPi and PD-L1 to MEKi increased CD3+ T cell and CD4+ helper T cell infiltration (Figure 7D and Supplemental Figure 6E). Interestingly, despite a substantial increase in total CD4+ T cells, we observe a significant decrease in the percentage of immunosuppressive CD4+ CD25+/FOXP3+ Tregs in response to trametinib, or in combinations including trametinib (Supplemental Figure 6E). Further, IFNγ+ cytotoxic CD8+ T cells were remarkably increased by trametinib alone and in combinations with PARPi and anti-PD-L1 (Supplemental Figure 6E).
Discussion
PARPi combined with PD-1/PD-L1 blockade has recently shown promising activity in preclinical models and clinical trials (41). Our previous study, which has been confirmed by others, showed that MEKi decrease expression of a number of members of the homologous recombination pathway (BRCA1, MRE11, BRCA2, or RAD51) as well as DNA damage repair in KRAS mutant cells (29,34). These studies confirm a critical role of the RAS/MAPK pathway in protecting cells from DNA damage potentially induced by KRAS-mediated oncogenic stress. Multiple studies, although somewhat controversial, indicated that PARPi induce an effective STING response potentially contributing to the efficacy of PARPi and anti-PD-L1 (26,42).
Here, we demonstrate that KRAS mutations mediate resistance to PARPi and anti-PD-L1 combinations, which could be effectively reversed by RAS/MAPK pathway inhibition. Mechanistically, KRAS mutant tumors are resistant to PARPi-induced DNA damage as well as subsequent STING-TBK1-IRF3 and interferon pathway activation. The important role of STING in ISGs activation after MEKi was demonstrated by the remarkably diminished ISG activation following depletion STING activity by siRNAs or inhibitors in HOC7 and CT26 cells. However, ISGs were not entirely reduced by knocking down STING (Figure 4F and Supplemental Figure 4H), indicating that additional STING-independent mechanisms could contribute to cytokine release after MEKi. For example, MEKi augments IRF3-driven type I and III IFN response in primary human AECs (43). Moreover, PARPi and MEKi have been reported to modulate dsRNA-related immune responses, with upregulation of the related cytokines (44).
Here we found the intrinsic cytosolic DNA sensor pathway remains intact in KRAS mutant tumors. Notably, MEKi itself generates a low level of cytoplasmic dsDNA that activates cGAS/STING and downstream interferon signaling. MEKi also facilitate CCL5, CXCL10 secretion in KRAS mutant tumors consistent with STING pathway activation. Importantly, MEKi sensitize KRAS mutant cells to PARPi, amplifying PARPi induced DNA damage and cytosolic dsDNA accumulation. In addition, MEKi reshapes the TME by depleting MDSCs likely through decreasing GM-CSF and IL-6 production, modifies recruitment of CD8+ T lymphocytes, and importantly alters the types of CD3+ and CD8+ present to a more tumor suppressive environment. Together, TME reprogramming results in an adaptive immune response dependent decrease in tumor growth. Although the PARPi and MEKi combination engages the immune system, addition of PD-L1 blockade augments the therapeutic efficacy of the combination in KRAS mutant tumors.
KRAS mutant cancers are characterized by abundant myeloid cell infiltration (45) with the extensive immunosuppressive myeloid cell environment including MDSCs being postulated as a key cause of immunotherapy resistance (46). KRAS driven cancers secrete high levels of GM-CSF and IL6 that contribute to the accumulation of immunosuppressive MDSCs (45). Here we showed that MEKi decreased GM-CSF and IL-6 production and reshaped the tumor immune microenvironment (TIME) to unleash the immune system by excluding MDSCs and increasing TIL infiltration in KRAS mutant tumors. Consistent with these results, BRAF and/or MEK inhibitors reduce immunosuppressive cytokine levels and increase T cell infiltration in melanoma (47). Importantly, when combined with PARPi, MEKi enhances DNA damage and cancer cell death and also provokes a more favorable immune microenvironment that sensitizes the tumor to the effects of immune checkpoint inhibitors.
Recently, AMG 510 (48) or MRTX849 (49), two selective KRASG12C inhibitors, have been shown to enhance immune cell infiltration and render tumors sensitive to immunotherapy. These data also support the role of MAPK pathway activation in inhibiting anti-tumor immune responses. However, the restriction of this class of inhibitors to KRASG12C mutant tumors limits their application in tumors with other forms of mutant KRAS. The approaches described herein with trametinib may have applicability to tumors with all types of KRAS mutations.
We delivered PARPi, MEKi and anti-PD-L1 simultaneously with a high anti-tumor activity. However, although it appears that there was minimal toxicity (in terms of body weights loss of mice) using the triplet combination, caution should be paid to utilizing the triplet combination in patients with KRAS WT tumors, especially when the doublet combination of PARPi and anti-PD-L1 is already effective in controlling tumor growth. While the potential for added toxicity may be acceptable for patients with KRAS mutant tumors, the potential added toxicity of the triplet may not be justified for patients with wild type KRAS tumors. It remains to be determined whether concurrent therapy is needed or whether there are more optimal schedules. For example, pulsatile MEKi treatment may be more effective at controlling tumor progression and enhancing T cell activation (50). We evaluated two alternative dosing schedules which could potentially minimize toxicity. Importantly, 48 hours of MEK inhibition with specific inhibitors (trametinib or cobimetinib) at low concentrations around their IC50 for inhibiting downstream ERK1/ERK2 phosphorylation, was sufficient to activate and amplify PARPi induced STING pathway activation in KRAS mutant cells (Supplemental Figure 7A–B). Moreover, sequential therapy with 24 hours of trametinib followed by a PARPi induced STING signaling in the HOC7 cell line more efficiently than either agent alone (Supplemental Figure 7C). Thus, it will be important to establish a dose and schedule able to maintain efficacy while ameliorating toxicity in clinical trials.
Supplementary Material
Statement of significance:
This study provides key insights into the potential for using MEKi combined with PARPi and anti-PD-L1 for the treatment of all mutant KRAS tumors.
Acknowledgments
We thank A. Maitra (Division of Pathology/Lab Medicine, University of Texas MD Anderson Cancer Center) for iKRAS cells. This study is supported by a grant Nature and Science Foundation of China (81572569, 81874106, to GC), National Key R&D Program of China (2016YFC1303100, to GC) and Nature and Science Foundation of China (81402163, 81974408, to CS). GBM has support from NIH P50CA217685, and U01 CA217842, the Ovarian Cancer Research Foundation, and a kind gift from the Miriam and Sheldon Adelson Medical Research Fund.
Footnotes
Conflict of interest statement
GBM has licensed an HRD assay to Myriad Genetics and on Digital Spatial Profiling to Nanostring; is a SAB member/consultant with Amphista, AstraZeneca, Chrysallis Biotechnology, GSK, ImmunoMET, Ionis, Lilly, PDX Pharmaceuticals, Signalchem Lifesciences, Symphogen, Tarveda, Turbine, and Zentalis Pharmaceuticals.
References
- 1.Fong PC, Boss DS, Yap TA, Tutt A, Bono JSd. Inhibition of Poly(ADP-Ribose) Polymerase in Tumors from BRCA Mutation Carriers. N Engl J Med 2009;361(17):123–34. [DOI] [PubMed] [Google Scholar]
- 2.Ray CA, Nussenzweig A. The multifaceted roles of PARP1 in DNA repair and chromatin remodelling. Nature Reviews Molecular Cell Biology 2017;18(10). [DOI] [PMC free article] [PubMed] [Google Scholar]
- 3.Stover EH, Konstantinopoulos PA, Matulonis UA, Swisher EM. Biomarkers of Response and Resistance to DNA Repair Targeted Therapies. Clinical Cancer Research An Official Journal of the American Association for Cancer Research 2016;22(23):5651. [DOI] [PubMed] [Google Scholar]
- 4.Kaufman B, Shapirafrommer R, Schmutzler RK, Audeh MW, Friedlander M, Balmaña J, et al. Olaparib Monotherapy in Patients With Advanced Cancer and a Germline BRCA1/2 Mutation. Journal of Clinical Oncology Official Journal of the American Society of Clinical Oncology 2015;33(3):244. [DOI] [PMC free article] [PubMed] [Google Scholar]
- 5.Shen J, Zhao W, Ju Z, Wang L, Peng Y, Labrie M, et al. PARPi triggers the STING-dependent immune response and enhances the therapeutic efficacy of immune checkpoint blockade independent of BRCAness. Cancer Research 2018. [DOI] [PMC free article] [PubMed]
- 6.Cerrato A, Morra F, Celetti A. Use of poly ADP-ribose polymerase [PARP] inhibitors in cancer cells bearing DDR defects: the rationale for their inclusion in the clinic. Journal of experimental & clinical cancer research : CR 2016;35(1):179 10.1186/s13046-016-0456-2. [DOI] [PMC free article] [PubMed] [Google Scholar]
- 7.Criscuolo D, Morra F, Giannella R, Visconti R, Cerrato A, Celetti A. New combinatorial strategies to improve the PARP inhibitors efficacy in the urothelial bladder Cancer treatment. Journal of experimental & clinical cancer research : CR 2019;38(1):91 10.1186/s13046-019-1089-z. [DOI] [PMC free article] [PubMed] [Google Scholar]
- 8.Wang Z, Sun K, Xiao Y, Feng B, Mikule K, Ma X, et al. Niraparib activates interferon signaling and potentiates anti-PD-1 antibody efficacy in tumor models. Scientific reports 2019;9(1):1853 10.1038/s41598-019-38534-6. [DOI] [PMC free article] [PubMed] [Google Scholar]
- 9.Sato H, Niimi A, Yasuhara T, Permata TBM, Hagiwara Y, Isono M, et al. DNA double-strand break repair pathway regulates PD-L1 expression in cancer cells. Nature Communications 2017;8(1) 10.1038/s41467-017-01883-9. [DOI] [PMC free article] [PubMed] [Google Scholar]
- 10.Karzai F, Madan RA, Owens H, Couvillon A, Hankin A, Williams M, et al. A phase 2 study of olaparib and durvalumab in metastatic castrate-resistant prostate cancer (mCRPC) in an unselected population. American Society of Clinical Oncology; 2018.
- 11.Drew Y, M. dJ, S.H. H, Y.H. P, A. W, J. B, et al. An open-label, phase II basket study of olaparib and durvalumab (MEDIOLA): Results in germline BRCA -mutated ( gBRCA m) platinum-sensitive relapsed (PSR) ovarian cancer (OC). Gynecologic Oncology 2018;149:246–7. [Google Scholar]
- 12.Konstantinopoulos P, Sachdev J, Schwartzberg L, Matulonis U, Sun P, Wang J, et al. 1143PDDose-finding combination study of niraparib and pembrolizumab in patients (pts) with metastatic triple-negative breast cancer (TNBC) or recurrent platinum-resistant epithelial ovarian cancer (OC)(TOPACIO/Keynote-162). Annals of Oncology 2017;28(suppl_5). [Google Scholar]
- 13.Hyman DM, Zelnak AB, Bauer TM, Ulahannan SV, Ford JM, Cesari R, et al. JAVELIN BRCA/ATM: A phase 2 trial of avelumab (anti–PD-L1) plus talazoparib (PARP inhibitor) in patients with advanced solid tumors with a BRCA1/2 or ATM defect. American Society of Clinical Oncology; 2019.
- 14.Yap T, Beck J, Stewart R, Dahm S, Chappey C, Cesari R, et al. 1241TiP JAVELIN PARP medley: A phase Ib/II study of avelumab (anti–PD-L1) plus talazoparib in locally advanced or metastatic solid tumors. Annals of Oncology 2018;29(suppl_8):mdy288. 112. [Google Scholar]
- 15.Friedlander M, Meniawy T, Markman B, Mileshkin LR, Harnett P, Millward M, et al. A phase 1b study of the anti-PD-1 monoclonal antibody BGB-A317 (A317) in combination with the PARP inhibitor BGB-290 (290) in advanced solid tumors. American Society of Clinical Oncology; 2018.
- 16.Hugo W, Zaretsky JM, Sun L, Song C, Moreno BH, Hulieskovan S, et al. Genomic and Transcriptomic Features of Response to Anti-PD-1 Therapy in Metastatic Melanoma. Cell 2016;165(1):35–44. [DOI] [PMC free article] [PubMed] [Google Scholar]
- 17.Gad S, Robert O, Yoram C, Wang BG, David S, Kurman RJ, et al. Mutations in BRAF and KRAS characterize the development of low-grade ovarian serous carcinoma. J Natl Cancer Inst 2003;95(6):484–6. [DOI] [PubMed] [Google Scholar]
- 18.Rosenbaum MW, Bledsoe JR, Moralesoyarvide V, Huynh TG, Minokenudson M. PD-L1 expression in colorectal cancer is associated with microsatellite instability, BRAF mutation, medullary morphology and cytotoxic tumor-infiltrating lymphocytes. Modern Pathology An Official Journal of the United States & Canadian Academy of Pathology Inc 2016;29(9):1104. [DOI] [PubMed] [Google Scholar]
- 19.Liao W, Overman MJ, Boutin AT, Shang X, Zhao D, Dey P, et al. KRAS-IRF2 Axis Drives Immune Suppression and Immune Therapy Resistance in Colorectal Cancer. Cancer Cell 2019;35(4):559–72 10.1016/j.ccell.2019.02.008. [DOI] [PMC free article] [PubMed] [Google Scholar]
- 20.Gjerdrum LM, Woetmann A, Odum N, Burton CM, Rossen K, Skovgaard GL, et al. FOXP3|[plus]| regulatory T cells in cutaneous T-cell lymphomas: association with disease stage and survival. Leukemia 2007;21(12):2512. [DOI] [PubMed] [Google Scholar]
- 21.Coelho MA, Trécesson SDC, Rana S, Zecchin D, Moore C, Molina-Arcas M, et al. Oncogenic RAS Signaling Promotes Tumor Immunoresistance by Stabilizing PD-L1 mRNA. Immunity 2017;47(6):1083–99.e6. [DOI] [PMC free article] [PubMed] [Google Scholar]
- 22.Paweletz CP, Charboneau L, Bichsel VE, Simone NL, Chen T, Gillespie JW, et al. Reverse phase protein microarrays which capture disease progression show activation of pro-survival pathways at the cancer invasion front. Oncogene 2001;20(16):1981. [DOI] [PubMed] [Google Scholar]
- 23.Wang G, Lu X, Dey P, Deng P, Wu C, Jiang S, et al. Targeting YAP-dependent MDSC infiltration impairs tumor progression. Journal for ImmunoTherapy of Cancer;3(Suppl 2):P421. [DOI] [PMC free article] [PubMed] [Google Scholar]
- 24.Federico L, Chong Z, Zhang D, Mcgrail DJ, Zhao W, Kang JJ, et al. A murine preclinical syngeneic transplantation model for breast cancer precision medicine. Science Advances 2017;3(4):e1600957. [DOI] [PMC free article] [PubMed] [Google Scholar]
- 25.Spangler JB, Manzari MT, Rosalia EK, Chen TF, Wittrup KD. Triepitopic Antibody Fusions Inhibit Cetuximab-Resistant BRAF and KRAS Mutant Tumors via EGFR Signal Repression. Journal of Molecular Biology 2012;422(4):532–44. [DOI] [PMC free article] [PubMed] [Google Scholar]
- 26.Ding L, Kim H-J, Wang Q, Kearns M, Jiang T, Ohlson CE, et al. PARP Inhibition Elicits STING-Dependent Antitumor Immunity in Brca1-Deficient Ovarian Cancer. Cell Reports 2018;25(11):2972–80. 10.1016/j.celrep.2018.11.054. [DOI] [PMC free article] [PubMed] [Google Scholar]
- 27.Corrales L, Mcwhirter SM Jr DT, Gajewski TF. The host STING pathway at the interface of cancer and immunity. Journal of Clinical Investigation 2016;126(7):2404. [DOI] [PMC free article] [PubMed] [Google Scholar]
- 28.Ma Z, Damania B. The cGAS-STING Defense Pathway and Its Counteraction by Viruses. Cell Host & Microbe 2016;19(2):150–8. [DOI] [PMC free article] [PubMed] [Google Scholar]
- 29.Sun C, Fang Y, Yin J, Chen J, Ju Z, Zhang D, et al. Rational combination therapy with PARP and MEK inhibitors capitalizes on therapeutic liabilities in RAS mutant cancers. Science Translational Medicine 2017;9(392). [DOI] [PMC free article] [PubMed] [Google Scholar]
- 30.Parkes EE, Walker SM, Taggart LE, Mccabe N, Knight LA, Wilkinson R, et al. Activation of STING-Dependent Innate Immune Signaling By S-Phase-Specific DNA Damage in Breast Cancer. Journal of the National Cancer Institute 2017;109(1). [DOI] [PMC free article] [PubMed] [Google Scholar]
- 31.Wie S-H, Du P, Luong TQ, Rought SE, Beliakova-Bethell N, Lozach J, et al. HIV Downregulates Interferon-Stimulated Genes in Primary Macrophages. Journal of Interferon & Cytokine Research the Official Journal of the International Society for Interferon & Cytokine Research 2013;33(2):90. [DOI] [PMC free article] [PubMed] [Google Scholar]
- 32.Kitajima S, Ivanova E, Guo S, Yoshida R, Campisi M, Sundararaman SK, et al. Suppression of STING associated with LKB1 loss in KRAS-driven lung cancer. Cancer discovery 2019;9(1):34–45. [DOI] [PMC free article] [PubMed] [Google Scholar]
- 33.Andrea A, Marion G, Taner C, Tobias D, Gregor W, Ingo RH, et al. cGAS produces a 2’–5’-linked cyclic dinucleotide second messenger that activates STING. Nature 2013;498(7454):380. [DOI] [PMC free article] [PubMed] [Google Scholar]
- 34.Maertens O, Kuzmickas R, Manchester HE, Emerson CE, Gavin AG, Guild CJ, et al. MAPK Pathway Suppression Unmasks Latent DNA Repair Defects and Confers a Chemical Synthetic Vulnerability in BRAF-, NRAS-, and NF1-Mutant Melanomas. Cancer Discov 2019;9(4):526–45 10.1158/2159-8290.CD-18-0879. [DOI] [PMC free article] [PubMed] [Google Scholar]
- 35.Abe T, Harashima A, Xia T, Konno H, Konno K, Morales A, et al. STING recognition of cytoplasmic DNA instigates cellular defense. Molecular cell 2013;50(1):5–15. [DOI] [PMC free article] [PubMed] [Google Scholar]
- 36.Pinilla-Macua I, Watkins SC, Sorkin A. Endocytosis separates EGF receptors from endogenous fluorescently labeled HRas and diminishes receptor signaling to MAP kinases in endosomes. Proceedings of the National Academy of Sciences of the United States of America 2016;113(8):2122–7. [DOI] [PMC free article] [PubMed] [Google Scholar]
- 37.Mills GB, Moolenaar WH. The emerging role of lysophosphatidic acid in cancer. Nature Reviews Cancer 2003;3(8):582. [DOI] [PubMed] [Google Scholar]
- 38.Caetano MS, Zhang H, Cumpian AM, Gong L, Unver N, Ostrin EJ, et al. IL6 Blockade Reprograms the Lung Tumor Microenvironment to Limit the Development and Progression of K-ras-Mutant Lung Cancer. Cancer Research 2016;76(11):3189–99 10.1158/0008-5472.can-15-2840. [DOI] [PMC free article] [PubMed] [Google Scholar]
- 39.Marigo I, Bosio E, Solito S, Mesa C, Fernandez A, Dolcetti L, et al. Tumor-induced tolerance and immune suppression depend on the C/EBPbeta transcription factor. Immunity 2010;32(6):790–802 10.1016/j.immuni.2010.05.010. [DOI] [PubMed] [Google Scholar]
- 40.Wang G, Xin L, Dey P, Deng P, Wu CC, Shan J, et al. Targeting YAP-dependent MDSC infiltration impairs tumor progression. Cancer Discovery 2015;3(S2):P421. [DOI] [PMC free article] [PubMed] [Google Scholar]
- 41.Brown JS, Sundar R, Lopez J. Combining DNA damaging therapeutics with immunotherapy: more haste, less speed. Br J Cancer 2018;118(3):312–24 10.1038/bjc.2017.376. [DOI] [PMC free article] [PubMed] [Google Scholar]
- 42.Pantelidou C, Sonzogni O, De Oliveria Taveira M, Mehta AK, Kothari A, Wang D, et al. PARP Inhibitor Efficacy Depends on CD8+ T-cell Recruitment via Intratumoral STING Pathway Activation in BRCA-Deficient Models of Triple-Negative Breast Cancer. Cancer Discovery 2019;9(6):722–37 10.1158/2159-8290.cd-18-1218. [DOI] [PMC free article] [PubMed] [Google Scholar]
- 43.Baturcam E, Vollmer S, Schlüter H, Maciewicz RA, Kurian N, Vaarala O, et al. MEK inhibition drives anti-viral defence in RV but not RSV challenged human airway epithelial cells through AKT/p70S6K/4E-BP1 signalling. Cell Communication and Signaling 2019;17(1):78. [DOI] [PMC free article] [PubMed] [Google Scholar]
- 44.Liu H, Golji J, Brodeur LK, Chung FS, Chen JT, deBeaumont RS, et al. Tumor-derived IFN triggers chronic pathway agonism and sensitivity to ADAR loss. Nature medicine 2019;25(1):95–102. [DOI] [PubMed] [Google Scholar]
- 45.Dias Carvalho P, Guimaraes CF, Cardoso AP, Mendonca S, Costa AM, Oliveira MJ, et al. KRAS Oncogenic Signaling Extends beyond Cancer Cells to Orchestrate the Microenvironment. Cancer Res 2018;78(1):7–14 10.1158/0008-5472.CAN-17-2084. [DOI] [PubMed] [Google Scholar]
- 46.Ostrand-Rosenberg S, Fenselau C. Myeloid-Derived Suppressor Cells: Immune-Suppressive Cells That Impair Antitumor Immunity and Are Sculpted by Their Environment. Journal of Immunology 2018;200(2):422. [DOI] [PMC free article] [PubMed] [Google Scholar]
- 47.Frederick DT, Piris A, Cogdill AP, Cooper ZA, Lezcano C, Ferrone CR, et al. BRAF inhibition is associated with enhanced melanoma antigen expression and a more favorable tumor microenvironment in patients with metastatic melanoma. Clinical cancer research : an official journal of the American Association for Cancer Research 2013;19(5):1225–31 10.1158/1078-0432.CCR-12-1630. [DOI] [PMC free article] [PubMed] [Google Scholar]
- 48.Canon J, Rex K, Saiki AY, Mohr C, Cooke K, Bagal D, et al. The clinical KRAS(G12C) inhibitor AMG 510 drives anti-tumour immunity. Nature 2019. 10.1038/s41586-019-1694-1. [DOI] [PubMed]
- 49.Hallin J, Engstrom LD, Hargis L, Calinisan A, Aranda R, Briere DM, et al. The KRASG12C Inhibitor, MRTX849, Provides Insight Toward Therapeutic Susceptibility of KRAS Mutant Cancers in Mouse Models and Patients. Cancer Discovery 2019: 10.1158/2159-8290.cd-19-1167. [DOI] [PMC free article] [PubMed]
- 50.Choi H, Deng J, Li S, Silk T, Dong L, Brea EJ, et al. Pulsatile MEK Inhibition Improves Anti-tumor Immunity and T Cell Function in Murine Kras Mutant Lung Cancer. Cell Rep 2019;27(3):806–19 10.1016/j.celrep.2019.03.066. [DOI] [PMC free article] [PubMed] [Google Scholar]
Associated Data
This section collects any data citations, data availability statements, or supplementary materials included in this article.