Abstract
Objectives
To evaluate the long-term effects of natalizumab (NTZ) on different features of intrathecal immunoglobulin (Ig) synthesis in patients with multiple sclerosis (MS) and to quantify the expression of α4-integrin in stages of B-cell maturation.
Methods
We combined a cross-sectional (49 NTZ-treated MS patients, mean treatment duration 5.1 years, and 47 untreated MS patients) and a longitudinal study (33 patients with MS before and during NTZ, mean treatment duration: 4.8 years), analyzing paired serum and CSF samples for IgG, IgA, and IgM levels, reactivity against selected viruses (measles virus, rubella virus, and varicella zoster virus [MRZ] reaction), and oligoclonal bands (OCBs). Banding patterns before and after therapy were directly compared by isoelectric focusing in 1 patient. In addition, we determined the expression of α4-integrin by FACS analysis on blood-derived B-cell subsets (plasmablasts, memory B cells, and naive B cells) of healthy controls.
Results
In serum, NTZ decreased IgM and IgG, but not IgA, levels. IgM hypogammaglobulinemia occurred in 28% of NTZ-treated patients. In CSF, NTZ treatment resulted in a strong reduction of intrathecally produced IgG and, to a lesser extent, IgA, whereas IgM indices [(Ig CSF/Serum)/(Albumin CSF/Serum)] remained largely unchanged. Reduction of the IgG index correlated with NTZ treatment duration, as did serum IgM and IgA levels. MRZ reaction was unchanged and OCB persisted. Direct comparison of OCB pattern before and after NTZ revealed the persistence of individual bands. α4-Integrin expression was highest on plasmablasts (CD19+CD38+CD27+).
Conclusion
Our data indicate that NTZ reduces short-lived plasmablasts in the CNS compartment but has little effect on locally persisting long-lived plasma cells.
A hallmark of multiple sclerosis (MS) is intrathecal immunoglobulin (Ig) production,1,2 which has different features. First, oligoclonal bands (OCBs), mainly formed by IgG11; second, local IgG production against different pathogens such as measles, rubella, and varicella zoster virus (MRZ reaction)3,4; third, a large part of the intrathecal IgG production exceeds OCB and MRZ reaction.5 Principally, there are 2 types of Ig-producing cells: short-lived plasmablasts and long-lived plasma cells.6 The latter persist in survival niches, physiologically in the bone marrow, but also in the inflamed CNS.5,7 Intrathecal IgG production strongly correlates with the number of plasmablasts in the CSF.8,9
Although the bidirectional migration of B cells between blood and CNS has been elaborated,10 the role of adhesion molecules in maintenance of plasmablasts and plasma cells in the CNS is poorly understood. Natalizumab (NTZ) is a highly effective therapy for relapsing-remitting MS (RRMS) and prevents migration of immune cells into the CNS by targeting α4-integrin. NTZ has strong effects on the B-cell compartment in the periphery11-14 and in the CNS.15-19 Here, we analyzed the CSF of 49 patients with MS who were treated with NTZ for a mean of more than 5 years and underwent another lumbar puncture (LP) to exclude progressive multifocal leukoencephalopathy (PML) before switching to a different therapy. We analyzed effects of NTZ treatment on the different features of intrathecal Ig production and additionally determined α4-integrin expression on blood-derived B-cell subsets of healthy controls (HCs).
Methods
Patients and Samples
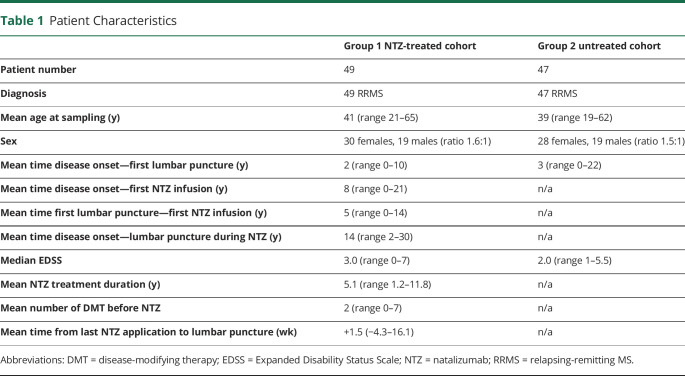
In this monocentric study, we investigated 2 groups of patients: group 1 consisted of 49 patients with RRMS treated with NTZ; group 2 consisted of 47 consecutive, age-matched, untreated patients with RRMS. Six of 49 NTZ-treated patients (12%) received NTZ at an extended interval dosing (EID) of 6 weeks, 3 of them started EID after up to 3.5 years (mean total time of EID: 1.4 years), and 3 patients only after more than 9 years of NTZ treatment (mean total time of EID: 0.9 years); all 6 continued EID until cessation of NTZ treatment. Clinical features of all patients including disease duration, disease severity (Expanded Disability Status Scale), NTZ therapy duration, and disease-modifying treatments (DMTs) before NTZ are summarized in table 1.
Table 1.
Patient Characteristics
All patients underwent LP for clinical and diagnostic purposes. OCB status was available for 33 patients before NTZ treatment. Immunoglobulin data from a LP before NTZ therapy were available for 27 patients with MS in the NTZ-treated group. All 49 NTZ-treated patients switched therapy because of the risk of PML and underwent another LP to exclude PML before timely start of subsequent cell-depleting therapies. CSF and blood sampling at second LP was performed around the time point of patients' last NTZ application (mean time from the last NTZ infusion to lumbar puncture +11 days; range −30 to 113 days). Untreated MS patients had a diagnostic LP usually at first diagnosis. CSF and serum were analyzed by routine methods for cell count, total protein and albumin levels, OCB, IgG, IgM, and IgA. Whenever possible, residual CSF/serum samples were immediately centrifuged and supernatants stored at −80°C. None of the patients, NTZ treated or untreated, underwent plasma exchange therapy in the 30 days before LP.
Cross-Sectional Study
We compared serum and CSF IgG, IgA, and IgM levels, OCB status, and MRZ reaction of the NTZ-treated patient cohort (49 patients) with corresponding data of 47 untreated RRMS patients.
Longitudinal Study
Within the NTZ-treated cohort, we performed paired analyses of serum and CSF IgG, IgA, and IgM levels. In addition, percentage of OCB-positive patients with MS before and during NTZ therapy was determined and compared. Complete data sets before NTZ were not available for all patients of group 1; hence, patient number varied for the individual analyses (for details, see figure legends).
Determination of IgG, IgA, IgM, and Albumin Levels
The quantitative determination of immunoglobulins IgG, IgA, and IgM and albumin in serum as well as in the CSF was performed by means of immunonephelometry on an Atellica NEPH 630 analyzer using the diagnostic reagents supplied from Siemens Healthcare Diagnostics Products GmbH, Marburg, Germany, in accordance with the manufacturer's instructions. For CSF IgM values below the quantification limit of the assay reaching from 0.12 to 0.15 mg/L, these values were used for further calculations. Ig indices were calculated as ( ) and used as measures of intrathecal Ig synthesis.
MRZ Reaction
MRZ reaction was detected by the calculation of the respective antibody indices (AIs) as described earlier.20 ELISAs (Euroimmun, Lübeck, Germany) were measured on an automated ELISA processing system (Analyzer I, Euroimmun). Virus-specific AI ≥1.5 was considered indicative of intrathecal antibody production against the respective virus. We analyzed MRZ reaction status of untreated and NTZ-treated patients as one-fold positive (MRZ-1: reactivity against 1 of the 3 viruses) and 2-fold positive (MRZ-2: reactivity against 2 viruses) MRZ reaction.
Determination of Oligoclonal Bands
Detection of OCBs was performed as part of routine CSF analysis using a high-sensitive isoelectric focusing technique on agarose gel followed by immunofixation (Hydrasis Focusing instrument using the Hydragel 9 CSF Isofocusing kit, both Sebia, France). The presence of OCB was assumed if there was >1 OCB exclusively in the CSF. A sample stored at −80°C in the biobank of the Institute of Clinical Neuroimmunology (LMU Klinikum, Munich) was used to analyze Ig band patterns of a patient in direct comparison before and during NTZ treatment.
Flow Cytometric Analysis of α4-Integrin Expression
We analyzed the intensity of α4-integrin expression on B-cell subsets using blood samples of HCs. Human peripheral blood mononuclear cells (PBMCs) of 8 HCs (mean age 30.5 years, male:female 5:3) were isolated using Pancoll solution (PAN-Biotech Pancoll human, density: 1.077 g/mL) and stored in liquid nitrogen until further use. After thawing, cells were incubated with the FcR blocking reagent (Miltenyi Biotec, Bergisch Gladbach, Germany) and stained using anti-human CD3-Alexa Fluor 700 (OKT3; eBioscience, San Diego, CA), CD14-Alexa Fluor 700 (M5E2, BioLegend, San Diego, CA), CD20-PerCP (2H7 BioLegend), IgD-PerCP (IA6-2, BioLegend), CD19-APC/Fire 750 (HIB19, BioLegend), CD27-Brilliant Violet 605 (O323; BioLegend), CD38-eFluor 450 (HB7; eBioscience), α4-integrin—(CD49d) FITC (9F10, BioLegend), and FITC Mouse IgG1, κ Isotype Control (MOPC-21, BioLegend). B-Cell subpopulations were analyzed within the CD3−CD14−, CD19+ population. In this article, naive B cells were defined as CD38− CD27−; memory B cells were defined as CD38−CD27+ and plasmablasts as CD38+CD27+. Expression levels of α4-integrin were analyzed as delta-mean fluorescence intensity (ΔMFI) (MFI of VLA-4-FITC-staining − MFI of fluorescence minus one control without α4-integrin—FITC). Flow cytometry (FACS) data were analyzed using FlowJo 10.6.1 software (Ashland, OR).
Statistical Analysis
Data were analyzed using Graphpad Prism 7 software (GraphPad Software Inc., La Jolla, CA). Differences in Ig levels were evaluated using the Mann-Whitney test for cross-sectional and Wilcoxon matched-pairs signed-rank tests for longitudinal comparisons. OCB and MRZ data were analyzed using the Fisher exact test. Changes in antibody levels and indices with NTZ therapy duration were evaluated using Spearman nonparametric correlation. Potential differences in α4-integrin expression levels were analyzed using the Quade all-pairs test. Differences were considered statistically significant for p values of *p < 0.05, **p < 0.01, ***p < 0.001, and ****p < 0.0001 and marked accordingly in the figures.
Data Availability
After publication, anonymized data will be made available on reasonable request to the corresponding author.
Standard Protocol Approvals, Registrations, and Patient Consents
The local ethics committee (Ethik-Kommission der Medizinischen Fakultät der LMU, protocol number 159-03 and 163-16) approved the study. All patients and controls gave written informed consent.
Results
Patient Characteristics
The mean time of NTZ treatment duration in group 1 was 5.1 years. Patients had been on a mean of 2 DMT before starting NTZ. Most (n = 31) had been treated with basic DMT (interferon beta, glatiramer acetate, dimethyl fumarate, and teriflunomide) before starting NTZ, 10 patients with fingolimod, and 6 with other immunotherapies. Two patients were untreated before commencing NTZ treatment. None of the patients underwent cell-depleting MS therapies before NTZ. Clinical characteristics of all patients are shown in table 1.
Results of routine CSF parameters (cell count, total protein, and blood-brain barrier dysfunction) of both groups before and after NTZ can be seen in table e-1 links.lww.com/NXI/A500.
Isotype-Specific Effect of NTZ on Systemic and Intrathecal Ig Production
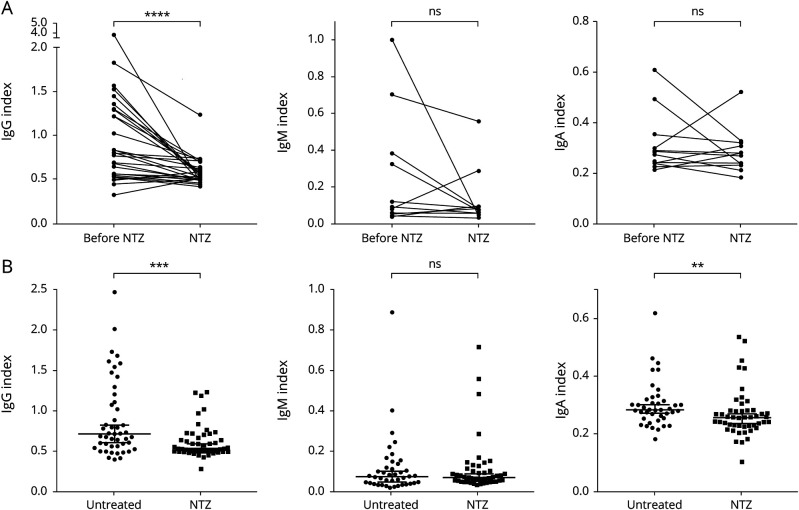
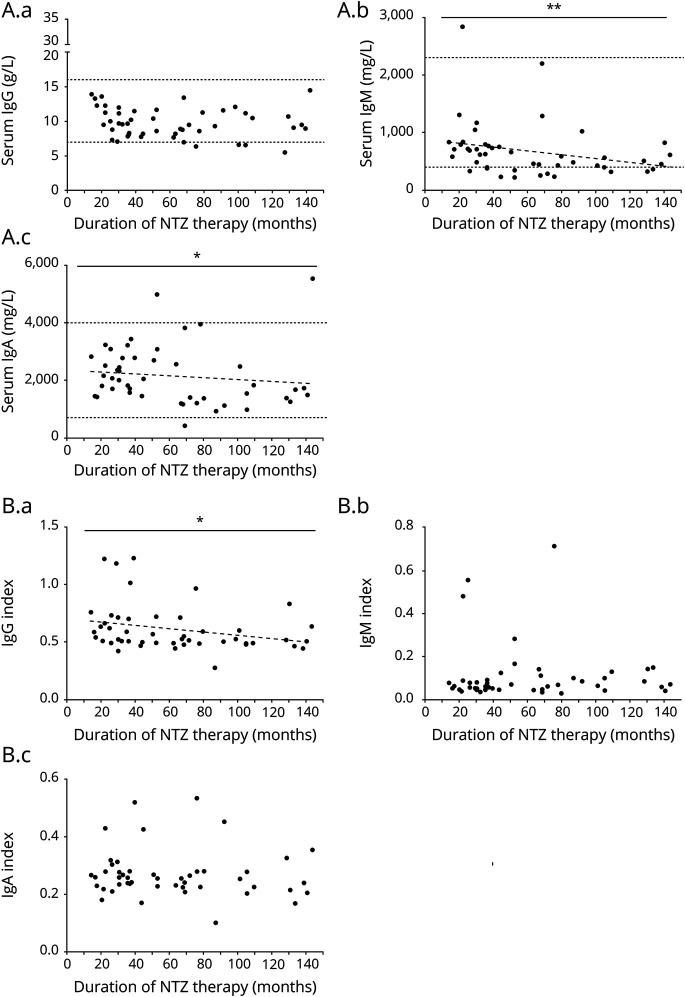
NTZ strongly reduced the IgG index reflecting total intrathecal IgG production but had no effect on the IgM index as seen in both the cross-sectional and longitudinal part of our study (figure 1A, B). We noted a reduction of the IgA index in the cross-sectional study (figure 1B). In serum, NTZ therapy reduced IgM levels in both the longitudinal and cross-sectional comparison; furthermore, we noted a slight reduction of IgG in only the longitudinal part of the study. IgA levels remained unchanged (figure e-1 links.lww.com/NXI/A501). The reduction in serum IgM was substantial, from a mean of 1,307 to 653 mg/L (50% reduction) after a mean of 3.7 years of NTZ treatment. In 3 patients, the serum IgM level decreased below the reference value during NTZ treatment (figure e-1 links.lww.com/NXI/A501). IgG reduction was much less pronounced with a mean of 10.9 g/L before and 9.8 g/L during NTZ treatment (10% reduction, 4.7 years of treatment). In the cross-sectional part of the study, 13 patients (28%) in the NTZ group showed serum IgM levels below the reference value compared with only 2 patients (5%) in the untreated group (p = 0.0048, Fisher exact test). We further analyzed the effect of duration of NTZ application. In the CSF, we found a significant negative correlation between the duration of NTZ therapy and IgG index; in serum, IgA and IgM levels also decreased significantly with therapy duration (figure 2A, B). We observed a stronger decrease of IgM indices in the 4 patients with the highest IgM indices, but overall IgM indices in the CSF did not decline significantly after NTZ treatment (figure 1A). The total amount of IgM in the CSF declined significantly (p = 0.0012, data not shown). This indicates that reduced overall IgM in the CSF is due to reduced intrathecal IgM production in a few patients with a high IgM index and due to reduction of IgM in the serum. Taken together, NTZ strongly reduced systemic IgM levels and intrathecal IgG production.
Figure 1. Isotype-Specific Effect of NTZ on Intrathecal Immunoglobulin (Ig) Production.
The Ig indices as a measure of intrathecal Ig production were calculated as described under Methods. Ig indices for IgG (left), IgM (middle), and IgA (right) are shown. (A) Longitudinal analysis: Paired data on Ig indices of patients before and during NTZ therapy were available for 26 patients for IgG, 13 patients for IgM, and 12 patients for IgA. IgG index (mean 1.0 before vs 0.6 during NTZ) was significantly reduced during NTZ therapy (p < 0.0001). Four patients with high IgM indices before NTZ showed a stronger reduction of IgM indices during NTZ treatment, but when the whole group was considered, the decrease in IgM indices (mean 0.2 before vs 0.1 during NTZ) did not reach statistical significance (p = 0.3054). IgA indices (mean before 0.3 vs 0.3 during NTZ) remained stable (p = 0.4697). Wilcoxon matched-pairs signed-rank test. (B) Cross-sectional analysis: Each dot represents 1 patient. Patient numbers: IgG index: untreated n = 47, NTZ n = 49; IgM index: untreated n = 41, NTZ n = 47; IgA index untreated n = 41, NTZ = 47. IgG and, to a lesser extent, IgA indices were lower in NTZ-treated compared with untreated MS patients (p = 0.0007 and p = 0.0076). Mann-Whitney U test. ns = non significant; NTZ = natalizumab. ** p < 0.01, *** p < 0.001, and **** p < 0.0001.
Figure 2. Differential Effects of NTZ Treatment Duration on Peripheral and Intrathecal Immunoglobulin (Ig) Levels.
Levels of IgG (left), IgM (middle) and IgA (right) in serum (A.a−A.c) and CSF (B.a−B.c) are shown along with NTZ therapy duration (months). Dotted horizontal lines represent upper and lower reference values. Linear regression analysis and Spearman nonparametric correlation analysis were performed. Regression lines (dashed) are shown for significant correlations. (A.b) Duration of NTZ therapy correlated strongly with a decrease of serum IgM (p = 0.0031, n = 47, Spearman r = −0.4227) and (A.c) weakly with a decrease of serum IgA (p = 0.0354, n = 49, Spearman r = −0.3077), while (A.a) serum IgG levels remained stable over time. (B.a) Analysis of Ig indices showed a reduction of intrathecal IgG production over time (p = 0.0198, n = 51, Spearman r = −0.3318). NTZ = natalizumab. *p < 0.05 and **p < 0.01.
OCB Status and Individual OCBs Remain During NTZ Therapy
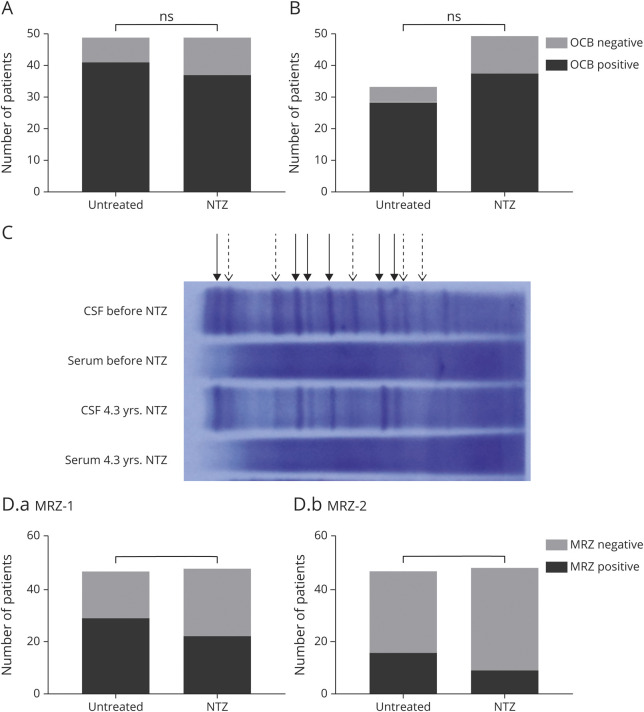
The cross-sectional part of our study revealed no significant differences in OCB status between the untreated (OCB positive: 41/47, 87%) and NTZ-treated cohort (OCB positive: 37/49, 76%; figure 3A). A comparison of OCB in patients with MS before NTZ (OCB positive: 28/33, 85%) and during NTZ treatment (OCB positive: 37/49, 76%) also revealed similar proportions of OCB-positive patients (figure 3B). Overall, only 5 patients (18%) lost their OCB during NTZ therapy. Taken together, long-term NTZ treatment does not have an effect on OCB status in most individuals.
Figure 3. Persistence of OCB and MRZ Reaction During NTZ Therapy.
(A) Cross-sectional analysis of CSF-specific OCB: No differences in OCB status could be detected between untreated and NTZ-treated MS patients (p = 0.1923, untreated patients n = 47, NTZ-treated patients n = 49; OCB positive: 87% [n = 41] of untreated patients vs 76% of NTZ patients [n = 37]). Fisher exact test. (B) Longitudinal analysis of CSF-specific OCB: OCB status was similar in patients before and during NTZ treatment (p = 0.4082, patients before NTZ n = 33, patients during NTZ n = 49; OCB positive: 86% of patients before [28 patients] vs 76% of patients during NTZ [n = 37]). Fisher exact test. (C) Comparison of serum-CSF pairs of 1 patient with MS before NTZ therapy and after 4.3 years of NTZ treatment. The majority of bands persist during treatment (solid arrows), whereas some become weaker or disappear entirely (dashed arrows). (D) Cross-sectional analysis: MRZ reaction status of untreated and NTZ-treated patients. Positive MRZ reaction was defined as an intrathecal antibody reaction against 1 (D.a, MRZ-1) or 2 (D.b, MRZ-2) viruses (measles, rubella, or varicella zoster virus). No clear differences could be detected between untreated and NTZ-treated patients for MRZ-1 (p = 0.1513, MRZ-1 positive: 61% and 46%, respectively) or MRZ-2 (p = 0.1069, MRZ-2 positive: 34% and 19%, respectively). Fisher exact test. MRZ = measles virus, rubella virus, and varicella zoster virus; ns = non significant; NTZ = natalizumab; OCB = oligoclonal band.
To analyze the persistence or disappearance of individual OCB, we analyzed CSF/serum pairs of 1 patient, stored before the beginning of NTZ therapy and obtained after 4.3 years of treatment, in parallel on the same gel. This revealed the persistence of individual OCB. However, some of the OCB lost intensity or disappeared entirely (figure 3C).
MRZ Reaction Status Remains Largely Unchanged During NTZ Treatment
MRZ-1 reaction status was similar between untreated (MRZ-1 positive: 29/47, 62%) and NTZ-treated patients (22/48, 46%). Likewise, 16 of 47 (34%) untreated MS patients were MRZ-2 positive compared with 9 of 48 (19%) NTZ-treated patients (figure 3D). NTZ treatment does not appear to affect the intrathecal IgG response to MRZ.
Highest α4-Integrin Expression on Plasmablasts
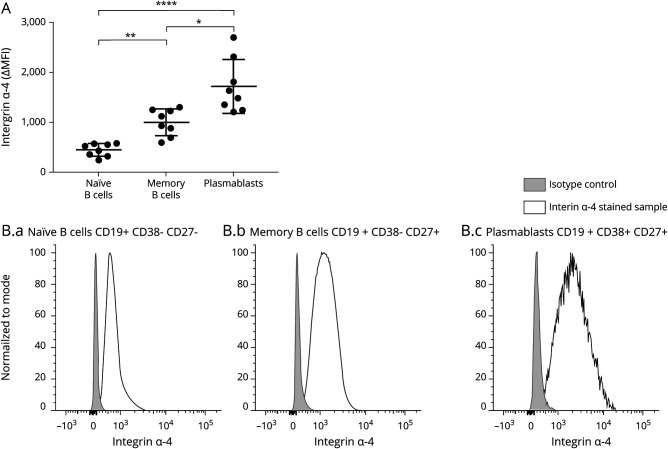
Analysis of α4-integrin expression on B-cell subsets in the blood of HCs revealed a different intensity level of α4-integrin expression on various B-cell subsets (figure 4). We observed the highest levels of α4-integrin on plasmablasts (CD19+ CD38+ CD27+), followed by memory B cells (CD19+ CD38− CD27+) and naive B cells (CD19+ CD38− CD27−).
Figure 4. α4-Integrin Expression on B-Cell Subsets.
PBMCs of healthy donors (n = 8) were stained for α4-integrin (CD49d) and markers for flow cytometric differentiation of lymphocyte subsets. α4-Integrin expression on naive B cells (CD3− CD19+ CD38− CD27−), memory B cells (CD3− CD19+ CD38− CD27+), and plasmablasts (CD3− CD19+ CD38+ CD27+) was analyzed. (A) Each dot represents ΔMFI (MFI[stained sample] − MFI[FMO control]) of 1 donor. α4-Integrin expression levels of memory cells and plasmablasts were significantly higher than those of naive B cells (p = 0.0071 and p < 0.00001, respectively). α4-Integrin expression was higher on plasmablasts than on memory B cells (p = 0.0176). Quade all-pairs test. (B) Representative α4-integrin staining of 1 donor. Light gray curves represent isotype controls, and black curves represent α4-integrin staining on naive B cells (B.a), memory B cells (B.b), and plasmablasts (B.c). MFI = mean fluorescence intensity. * p < 0.05, ** p < 0.01, and **** p < 0.0001.
Discussion
Details of the intrathecal Ig production in MS are useful for distinguishing MS from other neuroinflammatory diseases1,4 and are of prognostic relevance: intrathecal IgM production is linked to conversion of clinically isolated syndrome to MS21 and correlates with disease activity22; in addition, intrathecal IgG production is associated with worsening.23 Here, we present a comprehensive analysis of the effects of long-term NTZ therapy on different features of intrathecal Ig production and show that α4-integrin is expressed more highly on plasmablasts than on naive and memory B cells. NTZ reduced total intrathecal IgG production, correlating with treatment duration, but the intrathecal polyspecific IgG response (MRZ reaction) and OCB (consisting of IgG) remained. This was seen in both the longitudinal and the cross-sectional part of our analysis. Moreover, we found that individual OCBs persisted in a patient despite 4.3 years of NTZ treatment.
In the MS brain, Ig-producing cells are found in parenchymal, perivascular, and meningeal areas7,24 as well as in the spinal fluid.1,8,25 Both short-lived plasmablasts8 and long-lived plasma cells7 are considered to contribute to intrathecal Ig production in MS. In patients with MS, OCBs in the CSF remain stable for many years,26 indicating that individual long-lived plasma cells migrate to a survival niche in the CNS and remain there.5 The presence of OCB after a shorter period of NTZ treatment than in this study has been analyzed before with mixed results.15,17-19 A more recent study revealed the persistence of OCB in more than 90% of patients with MS after 1 year of NTZ therapy.15 Both the longitudinal and cross-sectional part of our study showed that the OCB status remained largely unchanged even after long-term NTZ therapy. We could further directly compare individual OCB in CSF samples obtained before and more than 4 years after NTZ treatment on the same gel. This revealed that not only OCB status but also individual bands remained, indicating that NTZ did not remove the corresponding plasma cells from their niche. We also noted that a few bands became weaker or disappeared. It is unclear whether this is due to NTZ or reflects a natural disease process because changes in OCB banding patterns have been described in some patients with MS.27,28
A limitation of this study is the relatively long time span between the first LP and the beginning of NTZ therapy; hence, effects of other disease-modifying drugs before NTZ or even disease course itself on the development of the analyzed parameters over time cannot be entirely excluded. Furthermore, we were only able to analyze the persistence of individual OCBs after long-term treatment in 1 individual patient.
Intrathecal IgG production in patients with MS often involves a polyspecific response against different pathogens (MRZ reaction), which in some countries is used to support the diagnosis. MRZ reaction is typically present at the beginning of the disease and relatively specific for MS, whereas OCB can also be detected in other entities of CNS inflammation, e.g., neuroborreliosis.4 Quantitatively, the MRZ reaction represents only a minor part of intrathecally produced IgG, estimated around 2%.3 The MRZ reaction may indicate an enhanced B-cell–promoting environment long before the onset of clinical disease and may also reflect the individual's history of infections.5 In the absence of treatment, MRZ reaction persists,5 presumably reflecting—like persisting OCB—that long-lived plasma cells have found a survival niche in the brain. In our study, the MRZ reaction was not abrogated by 5.1 years of treatment with NTZ. A previous study reported the persistence of MRZ reaction after 1 year of NTZ therapy but differential effects on other antiviral IgG responses.13 It is tempting to speculate that this is due to a differential formation of long-lived plasma cells by these different antiviral responses. Both the persisting OCB and the persisting MRZ reaction indicate that α4-integrin is not a major component of the survival niche of plasma cells in the CNS. In the bone marrow, laminin β1 has been identified as an important adhesion molecule for IgG-secreting plasma cells.29 The role of laminin β1 in maintenance of plasma cells in the CNS remains to be identified.
The magnitude of intrathecal IgG production was reported to correlate with the number of short-lived plasmablasts in the CSF.8 We assume that the reduction of intrathecal IgG production by NTZ is based on its effect on plasmablasts and comprises 2 mechanisms: First, NTZ might reduce the new formation of plasmablasts because B-cell activation is facilitated by VLA-4 (integrin α4β1) interacting with VCAM-1.30 Second, NTZ could reduce homing of plasmablasts to the CNS. Plasmablasts are circulating cells,31 and B cells exchange between the CNS and peripheral compartment.10 Our finding of a high expression of integrin α4 on plasmablasts suggests that NTZ also reduces the migration of plasmablasts to the CNS. Animal models underscore the importance of integrin α4–dependent migration of B cells for disease development and show different effects depending on the particular model.32-35
In serum, we found that NTZ strongly reduced IgM, with little or no effect on IgG and IgA levels, in accordance with previous reports.12,15 This differential effect of NTZ on systemic IgG and IgM levels can also be explained by an inhibition of plasmablasts but not long-lived plasma cells. Serum IgG levels are largely maintained by long-lived plasma cells,6 whereas IgM is produced to a greater extent by short-lived plasmablasts, although also long-lived IgM plasma cells have been described.36 These may contribute to IgM remaining in the presence of NTZ.30 Whether patients who switch from NTZ to B-cell–depleting therapies might subsequently develop earlier and more pronounced hypogammaglobulinemias has not been investigated in detail. Although this has to be evaluated in larger studies, we would recommend determination of serum immunoglobulin levels in patients with infections during NTZ therapy and close monitoring in patients before and after switching to cell-depleting therapies.
In summary, we show that long-term treatment with NTZ has differential effects on features of intrathecal IgG production: NTZ time dependently reduces the intrathecal IgG index and serum IgM levels, but OCB status, MRZ reaction, and individual OCB remain largely unchanged. This indicates that NTZ targets short-lived plasmablasts, but not long-lived plasma cells in their survival niche in the brain.
Acknowledgment
The authors are grateful to Sabine Lüngen, Angelika Bamberger, and Martina Sölch for their support and Dr. Hannah Pellkofer for comments on the manuscript. The authors thank Dr. Stephan Endres, Department of Medical Technology and IT, LMU Klinikum, Munich, for providing integrated structured patient data for analysis and Dr. Markus Krumbholz, Department of Neurology, Eberhard Karls University, Tübingen, for his valuable support. The authors acknowledge the Core Facility Flow Cytometry at the Biomedical Center, Ludwig-Maximilians-Universität München, for providing equipment and expertise.
Glossary
- DMT
disease-modifying therapy
- EID
extended interval dosing
- HC
healthy control
- Ig
immunoglobulin
- LP
lumbar puncture
- MFI
mean fluorescence intensity
- MRZ
measles virus, rubella virus, and varicella zoster virus
- NTZ
natalizumab
- OCBs
oligoclonal bands
- PML
progressive multifocal leukoencephalopathy
- RRMS
relapsing-remitting MS
Appendix. Authors
Contributor Information
Miriam Schlüter, Email: miriam.schlueter@med.uni-muenchen.de.
Eva Oswald, Email: eva.oswald@med.uni-muenchen.de.
Stephan Winklmeier, Email: stephan.winklmeier@med.uni-muenchen.de.
Ingrid Meinl, Email: ingrid.meinl@med.uni-muenchen.de.
Joachim Havla, Email: joachim.havla@med.uni-muenchen.de.
Peter Eichhorn, Email: peter.eichhorn@med.uni-muenchen.de.
Edgar Meinl, Email: edgar.meinl@med.uni-muenchen.de.
Study Funding
DFG (SFB TR128).
Disclosure
M. Schlüter, E. Oswald, and S. Winklmeier report no disclosures relevant to the manuscript. I. Meinl received travel expenses from MedDay and Roche Pharma and compensation from Serono and Roche Pharma. J. Havla reports grants for OCT research from the Friedrich-Baur-Stiftung and Merck; personal fees and nonfinancial support from Celgene, Merck, Alexion, Novartis, Roche, Santhera, Biogen, Heidelberg Engineering, and Sanofi Genzyme; and nonfinancial support of the Guthy-Jackson Charitable Foundation, all outside the submitted work. J. Havla is partially funded by the German Federal Ministry of Education and Research (DIFUTURE) (grant nos. 01ZZ1603[A-D] and 01ZZ1804[A-H]). P. Eichhorn reports no disclosures relevant to the manuscript. E. Meinl received honorarium from Roche, Novartis, Merck, Sanofi, Biogen, and Bioeq and grant support from Novartis, Sanofi, Roche, and Merck. T. Kümpfel received speaker honoraria/personal compensation from Bayer HealthCare, Merck, Novartis Pharma, Roche Pharma, and Biogen as well as grant support from Novartis; advisory board for Roche Pharma. Go to Neurology.org/NN for full disclosures.
References
- 1.Stangel M, Fredrikson S, Meinl E, Petzold A, Stüve O, Tumani H. The utility of cerebrospinal fluid analysis in patients with multiple sclerosis. Nat Rev Neurol. 2013;9(5):267-276. [DOI] [PubMed] [Google Scholar]
- 2.Milstein JL, Barbour CR, Jackson K, Kosa P, Bielekova B. Intrathecal, not systemic inflammation is correlated with multiple sclerosis severity, especially in progressive multiple sclerosis. Front Neurol. 2019;10:1232. [DOI] [PMC free article] [PubMed] [Google Scholar]
- 3.Reiber H, Ungefehr S, Jacobi C. The intrathecal, polyspecific and oligoclonal immune response in multiple sclerosis. Mult Scler. 1998;4(3):111-117. [DOI] [PubMed] [Google Scholar]
- 4.Jarius S, Eichhorn P, Franciotta D, et al. The MRZ reaction as a highly specific marker of multiple sclerosis: re-evaluation and structured review of the literature. J Neurol. 2017;264(3):453-466. [DOI] [PubMed] [Google Scholar]
- 5.Meinl E, Krumbholz M, Hohlfeld R. B lineage cells in the inflammatory central nervous system environment: migration, maintenance, local antibody production, and therapeutic modulation. Ann Neurol. 2006;59(6):880-892. [DOI] [PubMed] [Google Scholar]
- 6.Manz RA, Hauser AE, Hiepe F, Radbruch A. Maintenance of serum antibody levels. Annu Rev Immunol. 2005;23:367-386. [DOI] [PubMed] [Google Scholar]
- 7.Pollok K, Mothes R, Ulbricht C, et al. The chronically inflamed central nervous system provides niches for long-lived plasma cells. Acta Neuropathol Commun. 2017;5(1):88. [DOI] [PMC free article] [PubMed] [Google Scholar]
- 8.Cepok S, Rosche B, Grummel V, et al. Short-lived plasma blasts are the main B cell effector subset during the course of multiple sclerosis. Brain. 2005;128:1667-1676. [DOI] [PubMed] [Google Scholar]
- 9.Gasperi C, Andlauer TFM, Keating A, et al. Genetic determinants of the humoral immune response in MS. Neurol Neuroimmunol Neuroinflamm. 2020;7(5):e827. [DOI] [PMC free article] [PubMed] [Google Scholar]
- 10.von Budingen HC, Kuo TC, Sirota M, et al. B cell exchange across the blood-brain barrier in multiple sclerosis. J Clin Invest. 2012;122(12):4533-4543. [DOI] [PMC free article] [PubMed] [Google Scholar]
- 11.Krumbholz M, Meinl I, Kümpfel T, Hohlfeld R, Meinl E. Natalizumab disproportionately increases circulating pre-B and B cells in multiple sclerosis. Neurology. 2008;71(17):1350-1354. [DOI] [PubMed] [Google Scholar]
- 12.Selter RC, Biberacher V, Grummel V, et al. Natalizumab treatment decreases serum IgM and IgG levels in multiple sclerosis patients. Mult Scler. 2013;19(11):1454-1461. [DOI] [PubMed] [Google Scholar]
- 13.Planas R, Jelčić I, Schippling S, Martin R, Sospedra M. Natalizumab treatment perturbs memory- and marginal zone-like B-cell homing in secondary lymphoid organs in multiple sclerosis. Eur J Immunol. 2012;42(3):790-798. [DOI] [PubMed] [Google Scholar]
- 14.Niino M, Bodner C, Simard ML, et al. Natalizumab effects on immune cell responses in multiple sclerosis. Ann Neurol. 2006;59(5):748-754. [DOI] [PubMed] [Google Scholar]
- 15.Largey F, Jelcic I, Sospedra M, Heesen C, Martin R, Jelcic I. Effects of natalizumab therapy on intrathecal antiviral antibody responses in MS. Neurol Neuroimmunol Neuroinflamm. 2019;6(6):e621. [DOI] [PMC free article] [PubMed] [Google Scholar]
- 16.Stüve O, Marra CM, Jerome KR, et al. Immune surveillance in multiple sclerosis patients treated with natalizumab. Ann Neurol. 2006;59(5):743-747. [DOI] [PubMed] [Google Scholar]
- 17.Warnke C, Stettner M, Lehmensiek V, et al. Natalizumab exerts a suppressive effect on surrogates of B cell function in blood and CSF. Mult Scler. 2015;21(8):1036-1044. [DOI] [PubMed] [Google Scholar]
- 18.Harrer A, Tumani H, Niendorf S, et al. Cerebrospinal fluid parameters of B cell-related activity in patients with active disease during natalizumab therapy. Mult Scler. 2013;19(9):1209-1212. [DOI] [PubMed] [Google Scholar]
- 19.Mancuso R, Franciotta D, Rovaris M, et al. Effects of natalizumab on oligoclonal bands in the cerebrospinal fluid of multiple sclerosis patients: a longitudinal study. Mult Scler. 2014;20(14):1900-1903. [DOI] [PubMed] [Google Scholar]
- 20.Reiber H, Lange P. Virus-spezifische Antikörper in Liquor und Serum. ELISA-Analytik und Auswertung mittels Antikörper-Index und Quotientendiagramm. Lab Med. 1991;15:204-207. [Google Scholar]
- 21.Pfuhl C, Grittner U, Gieß RM, et al. Intrathecal IgM production is a strong risk factor for early conversion to multiple sclerosis. Neurology. 2019;93(15):e1439-e1451. [DOI] [PubMed] [Google Scholar]
- 22.Magliozzi R, Mazziotti V, Montibeller L, et al. Cerebrospinal fluid IgM levels in association with inflammatory pathways in multiple sclerosis patients. Front Cell Neurosci. 2020;14(338):569827. [DOI] [PMC free article] [PubMed] [Google Scholar]
- 23.Gasperi C, Salmen A, Antony G, et al. Association of intrathecal immunoglobulin G synthesis with disability worsening in multiple sclerosis. JAMA Neurol. 2019;76(7):841-849. [DOI] [PMC free article] [PubMed] [Google Scholar]
- 24.Magliozzi R, Howell O, Vora A, et al. Meningeal B-cell follicles in secondary progressive multiple sclerosis associate with early onset of disease and severe cortical pathology. Brain. 2007;130(pt 4):1089-1104. [DOI] [PubMed] [Google Scholar]
- 25.Obermeier B, Mentele R, Malotka J, et al. Matching of oligoclonal immunoglobulin transcriptomes and proteomes of cerebrospinal fluid in multiple sclerosis. Nat Med. 2008;14(6):688-693. [DOI] [PubMed] [Google Scholar]
- 26.Walsh MJ, Tourtellotte WW. Temporal invariance and clonal uniformity of brain and cerebrospinal IgG, IgA, and IgM in multiple sclerosis. J Exp Med. 1986;163(1):41-53. [DOI] [PMC free article] [PubMed] [Google Scholar]
- 27.Thompson EJ, Kaufmann P, Rudge P. Sequential changes in oligoclonal patterns during the course of multiple sclerosis. J Neurol Neurosurg Psychiatry. 1983;46(6):547-550. [DOI] [PMC free article] [PubMed] [Google Scholar]
- 28.Axelsson M, Mattsson N, Malmeström C, Zetterberg H, Lycke J. The influence of disease duration, clinical course, and immunosuppressive therapy on the synthesis of intrathecal oligoclonal IgG bands in multiple sclerosis. J Neuroimmunol. 2013;264(1-2):100-105. [DOI] [PubMed] [Google Scholar]
- 29.Männe C, Takaya A, Yamasaki Y, et al. Salmonella SiiE prevents an efficient humoral immune memory by interfering with IgG(+) plasma cell persistence in the bone marrow. Proc Natl Acad Sci U S A. 2019;116(15):7425-7430. [DOI] [PMC free article] [PubMed] [Google Scholar]
- 30.Carrasco YR, Batista FD. B-cell activation by membrane-bound antigens is facilitated by the interaction of VLA-4 with VCAM-1. EMBO J. 2006;25(4):889-899. [DOI] [PMC free article] [PubMed] [Google Scholar]
- 31.Odendahl M, Mei H, Hoyer BF, et al. Generation of migratory antigen-specific plasma blasts and mobilization of resident plasma cells in a secondary immune response. Blood. 2005;105(4):1614-1621. [DOI] [PubMed] [Google Scholar]
- 32.Lehmann-Horn K, Sagan SA, Bernard CC, Sobel RA, Zamvil SS. B-cell very late antigen-4 deficiency reduces leukocyte recruitment and susceptibility to central nervous system autoimmunity. Ann Neurol. 2015;77(5):902-908. [DOI] [PMC free article] [PubMed] [Google Scholar]
- 33.Lehmann-Horn K, Sagan SA, Winger RC, et al. CNS accumulation of regulatory B cells is VLA-4-dependent. Neurol Neuroimmunol Neuroinflamm. 2016;3(2):e212. [DOI] [PMC free article] [PubMed] [Google Scholar]
- 34.Glatigny S, Wagner CA, Bettelli E. Cutting edge: integrin α4 is required for regulatory B cell control of experimental autoimmune encephalomyelitis. J Immunol. 2016;196(9):3542-3546. [DOI] [PMC free article] [PubMed] [Google Scholar]
- 35.Hussain RZ, Cravens PD, Miller-Little WA, et al. α4-integrin deficiency in B cells does not affect disease in a T-cell-mediated EAE disease model. Neurol Neuroimmunol Neuroinflamm. 2019;6(4):e563. [DOI] [PMC free article] [PubMed] [Google Scholar]
- 36.Bohannon C, Powers R, Satyabhama L, et al. Long-lived antigen-induced IgM plasma cells demonstrate somatic mutations and contribute to long-term protection. Nat Commun. 2016;7:11826. [DOI] [PMC free article] [PubMed] [Google Scholar]
Associated Data
This section collects any data citations, data availability statements, or supplementary materials included in this article.
Data Availability Statement
After publication, anonymized data will be made available on reasonable request to the corresponding author.


