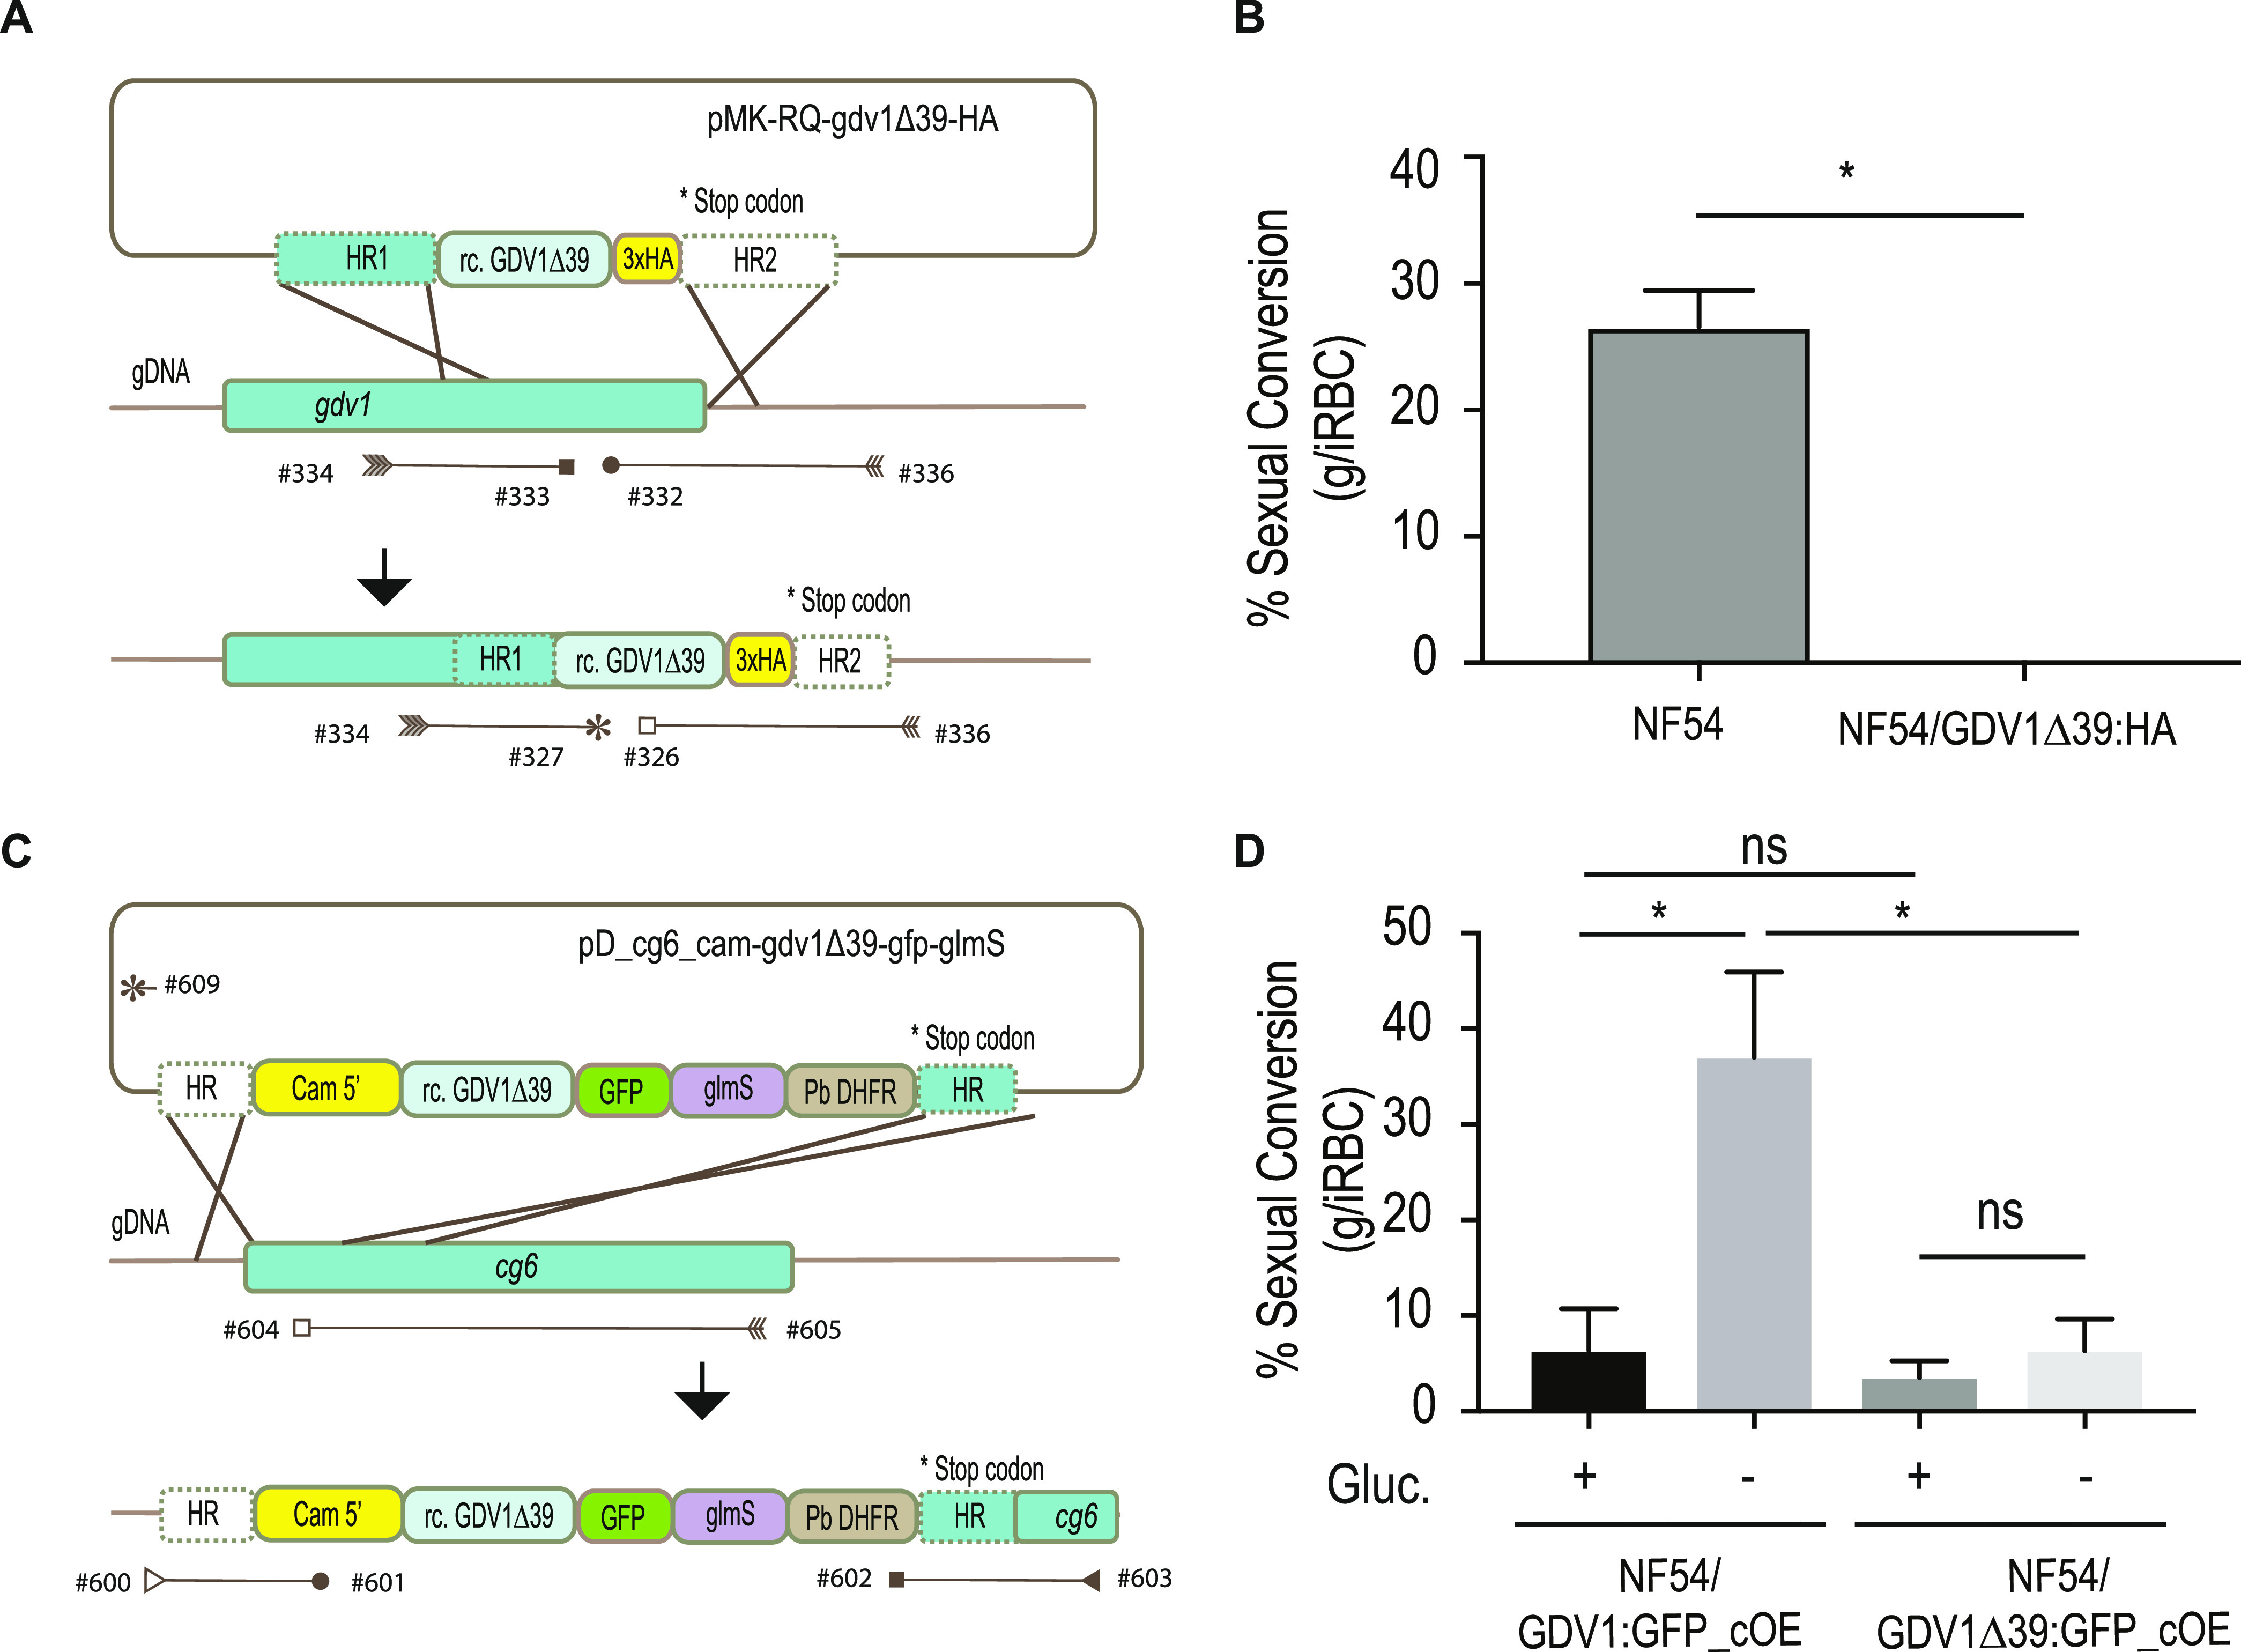
FIG 3.

Quantification of gametocyte production in GDV1Δ39 mutant parasite lines. (A) Illustration of the strategy used to generate the 3×HA-tagged GDV1Δ39 mutant line (NF54/GDV1Δ39:HA) as well as the primers used to confirm integration (Table S2). The pMK-RQ-gdv1Δ39-HA donor plasmid contains a recodonized version of the gdv1Δ39 mutant and a 3×HA tag, flanked by homology regions. (B) Comparison of sexual conversion rates between NF54 and NF54/GDV1Δ39:HA parasite lines. Each column represents the mean of duplicate (NF54) and triplicate (NF54/GDV1Δ39:HA) microscope counts, each of at least 500 cells, analyzed using paired t test, ± SD, (*, P < 0.05; NF54 versus NF54/GDV1Δ39:HA, P = 0.0489). (C) Schematic of the strategy used to make the NF54/GDV1Δ39:GFP_cOE overexpressing line as well as the primers used to verify integration of the transgene cassette into the cg6 (glp3) locus (Table S2). The pD_cg6_cam-gdv1Δ39-gfp-glmS donor plasmid contains a recodonized version of the gdv1Δ39 mutant followed by the in-frame gfp sequence and the glmS ribozyme element, flanked by homology regions. (D) Comparison of sexual conversion rates between NF54/GDV1:GFP_cOE and NF54/GDV1Δ39:GFP_cOE parasite lines in the presence (prevents sexual conversion) or absence of glucosamine (induces sexual conversion). Each column represents the mean of triplicate counts of at least 500 cells, analyzed using paired t test, ± SD, (*, P < 0.05; ns, not significant, P ≥ 0.05; NF54/GDV1:GFP_cOE noninduced versus induced, P = 0.0094; noninduced NF54/GDV1:GFP_cOE versus NF54/GDV1Δ39:GFP_cOE, P = 0.2276; NF54/GDV1Δ39:GFP_cOE noninduced versus induced, P = 0.4038; induced NF54/GDV1:GFP_cOE versus NF54/GDV1Δ39:GFP_cOE, P = 0.0281).
