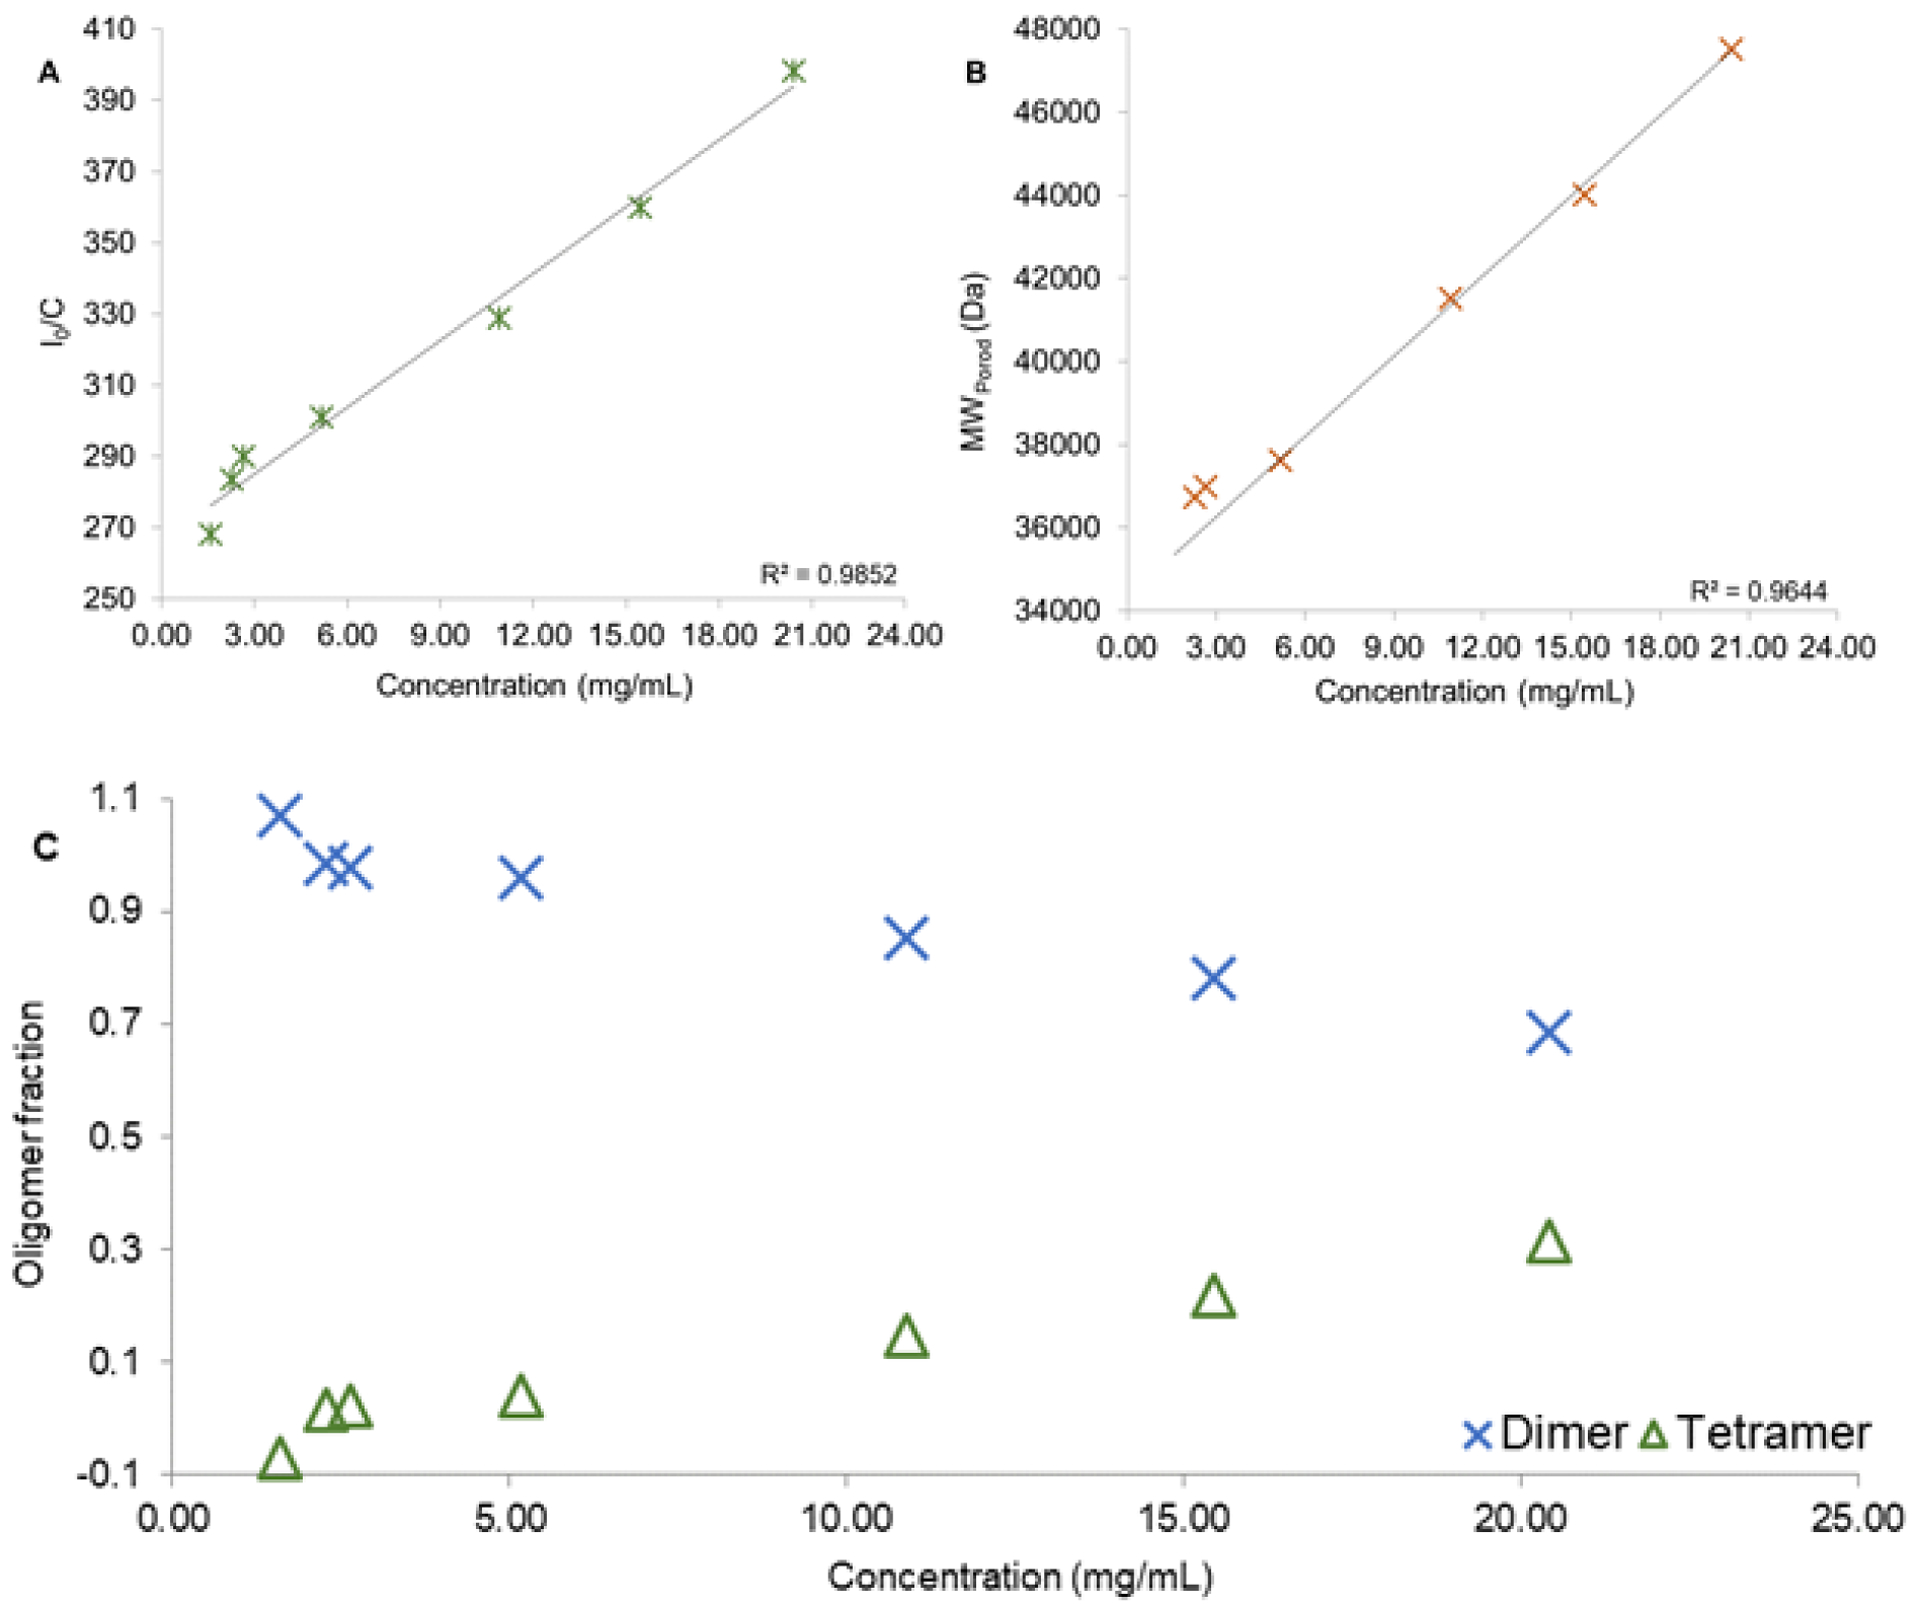
Figure 4.

OxyHbIII plausible oligomers (dimer and tetramer) as a function of concentration. A) Relationship of I0/c with sample concentration. B) Calculated Porod’s molecular weight (MWPorod) relationship to sampling concentration. C) Oligomer fraction in solution as a function of sample concentration. Blue ‘X’ represents the dimer population, while the green triangle represents the tetramer.
