

ABSTRACT
ATP metabolism during mitosis needs to be coordinated with numerous energy-demanding activities, especially in cancer cells whose metabolic pathways are reprogramed to sustain rapid proliferation in a nutrient-deficient environment. Although strategies targeting the energy metabolic pathways have shown therapeutic efficacy in preclinical cancer models, how normal cells and cancer cells differentially respond to energy shortage is unclear. In this study, using time-lapse microscopy, we found that cancer cells displayed unique mitotic phenotypes in a dose-dependent manner upon decreasing ATP (i.e. energy) supply. When reduction in ATP concentration was moderate, chromosome movements in mitosis were barely affected, while the metaphase–anaphase transition was significantly prolonged due to reduced tension between the sister-kinetochores, which delayed the satisfaction of the spindle assembly checkpoint. Further reduction in ATP concentration led to a decreased level of Aurora-B at the centromere, resulting in increased chromosome mis-segregation after metaphase delay. In contrast to cancer cells, ATP restriction in non-transformed cells induced cell cycle arrest in interphase, rather than causing mitotic defects. In addition, data mining of cancer patient database showed a correlation between signatures of energy production and chromosomal instability possibly resulted from mitotic defects. Together, these results reveal that energy restriction induces differential responses in normal and cancer cells, with chromosome mis-segregation only observed in cancer cells. This points to targeting energy metabolism as a potentially cancer-selective therapeutic strategy.
KEYWORDS: ATP, energy restriction, cancer cells, metaphase-anaphase transition, chromosome mis-segregation
Introduction
The key function of mitosis is to separate duplicated DNA equally into two daughter cells. To ensure accurate chromosome segregation, a surveillance mechanism called the spindle assembly checkpoint (SAC) was evolved [1]. Mitosis is a highly dynamic process, involving a series of remarkable structural and morphological changes, such as cytoskeleton re-organization, membrane-organelles re-distribution, nuclear membrane breakdown and reformation, and chromosome alignment and separation. Notably, all of these mitotic activities consume energy. Although the anabolic metabolism is reduced to a low level during mitosis, the energy demand is still considerably high [2,3]. To meet this energy demand, cells promote ATP production by several mechanisms that increase OXPHOS activity and glycolytic rates. For instance, CDK1 was found to promote ATP generation by phosphorylating multiple components of the mitochondrial respiration chain complex I in cancer cells [4] and the mitochondrial outer membrane protein TOM6 in yeast [5]. Interestingly, a recent work reported that AMPK-mediated phosphorylation of MCU triggered Ca2+ transit and mitochondrial entry, rapidly enhancing OXPHOS activity and mitotic progression [6]. In addition to the mitochondrial respiratory, glycolysis and lactate production were also shown to be up-regulated during mitosis, which might contribute to the increased ATP production [2]. Although the regulation of energy metabolism in mitosis has been studied for years, the mechanism by which different cell types response to energy limitation at each stage of the mitotic progression is poorly understood, especially for cancer cells whose metabolic pathways are extensively reprogrammed.
Cancer cells in the solid tumor generally proliferate in a hypoxic and nutrient-deficient microenvironment that limits energy production [7]. Targeting energy metabolism has been suggested as a promising strategy for cancer treatment [8], with a number of preclinical studies showing efficient tumor regression when glycolysis and oxidative phosphorylation were inhibited [7,9]. However, toxicities limit the efficacy and applicability of compounds that target key components in the energy production process. Hence, understanding how normal and cancer cells differentially respond to energy restrictions would help to further develop more cancer-selective strategies via targeting energy metabolism.
In the current study, by monitoring the division process of normal vs. cancer cells under reduced ATP concentrations, we found that the metaphase–anaphase transition, not chromosome movements, has the highest demand of ATP during mitosis. In cancer cells, slight ATP restriction led to delay in the establishment of stable kinetochore-microtubule attachments and metaphase arrest. And severe ATP shortage caused aberrant attachments and chromosome mis-segregation after metaphase arrest. In contrast, ATP restriction prevents mitotic entry in non-transformed cells. Such differential responses to energy restriction may be exploited to develop new strategies to selectively target cancers.
Materials and methods
Cell culture
Cells were cultured in a 5% CO2 humidified incubator at 37°C and were maintained in Dulbecco’s modified Eagle’s medium (Gibco, Grand Island, NY, USA) supplemented with 5% fetal bovine serum and 5% new born calf serum (Gibco, Grand Island, NY, USA), 100 units/ml penicillin and 100 μg/ml streptomycin (Beyotime Bio-technology, Jiangsu, China). All the cell lines were fully authenticated and tested free of mycoplasma.
Reagents and antibodies
NADH was from Sangon Biotech (Shanghai, China; A600642) or Sigma (St Louis, MO, USA; N8129), and was dissolved in PBS at a stock concentration of 0.5 M. ATP was from Sigma (St Louis, MO, USA; A2383) and dissolved in water at 0.2 M and adjusted to pH 7.0, Thymidine was from Sigma (St Louis, MO, USA; T1895) and was dissolved in PBS at 0.1 M. Reversine was from Sigma (St Louis, MO, USA; R3904) and was dissolved in DMSO at 1 mM. Other reagents include Glucose (Sigma, St Louis, MO, USA; G7021), Glutamine (Gibco, Grand Island, NY, USA; 1847242), Pyruvate (Gibco, Grand Island, NY, USA; 11360–070), 2DG (Sigma, St Louis, MO, USA; D8375), STLC (Sigma, St Louis, MO, USA; 164739), MG132 (Selleck, Shanghai, China; S2619) and Hesperadin (Selleck, Shanghai, China; S1259).
Primary antibodies used in the study include Rat anti-α-tubulin (NOVUS Biologicals, Littleton, CO, USA; NB600-506), anti-Aurora-B (BD Transduction Laboratories, New Jersey, USA; 611082) and Human anti-ACA (Antibodies, Inc., Davis, CA, USA; 15–235). Secondary antibodies used were goat anti-rat Alexa 568 and goat anti-human FITC (Jackson Immuno-Research, Westgrove, PA, USA).
ATP measurement
HeLa cells were synchronized via a thymidine block and released to fresh medium. Ten hours later, the mitotic cells were harvested by shake-off and centrifuged at 1200 rpm for 5 min. Then, the ATP in the ensemble samples was measured with an ATP quantification kit (Beyotime Bio-technology, Jiangsu, China; S0026) following the manufacturer’s instruction. The values were normalized to the cell numbers. To measure cellular ATP levels in single cells, RPE and HeLa were infected with cytosolic ATP indicator ATeam1.03 [10]. Cells were first synchronized with thymidine for 19 hours and then released to fresh medium. After incubation for 8 hours, the original medium was changed to imaging medium. Cells were visualized with a DeltaVision Deconvolution microscope equipped with a 60× objective lens (NA = 1.42). For ATeam1.03 imaging, two channels were simultaneously monitored as follows: channel 1 for CFP only (425 nm excitation with 475 nm emission) and channel 2 for FRET (425 nm excitation with 525 nm emission). The relative level of ATP in individual mitotic cells was calculated as described previously [10].
ATP replenishment assay
HeLa cells were synchronized via a thymidine block [11] and released to fresh medium. Seven hours later, 1 mM ATP or NADH was added to the medium and incubated for another 2 hours [6,12]. The mitotic cells were collected and measured with the ATP quantification kit or the cells were fixed with 4% paraformaldehyde for immunofluorescence analysis.
Time-lapse imaging of mitotic progression
HeLa/RPE (GFP-H2B) cells were seeded on an 8-chambered cover glass (µ-Slide 8 Well, ibidi; 80826). For live cell imaging, the original culture medium was replaced by L15 (Galactose, 5 mM, Thermo Fisher Scientific, Inc., Waltham, MA, USA; 21083027) or DMEM (Glucose, 25 mM, Gibco, Grand Island, NY, USA; A1443001). Images were collected every 3 min with an exposure time of 0.2 second for 10–20 hours, using a 20× objective on an inverted fluorescence microscope (Nikon Eclipse Ti-E) or Delta Vision microscope (GE Healthcare, Buckinghamshire, UK). The temperature of the imaging medium was kept at 37°C. Image sequences were viewed and analyzed with Image J.
HeLa (GFP-Bub3) stable cells were seeded on the glass-bottom cell culture dish (NEST; 801001). Images were acquired on a Delta Vision microscope with a 60× objective at 4 minutes intervals, with optical sections acquired at 1 μm apart in the z-axis. The final data were shown as maximal intensity projections. The temperature of the imaging medium was kept at 37°C. Image sequences were viewed and analyzed with Image J [13].
Immunofluorescence and inter-kinetochore distance analysis
For immunofluorescence analyses, cells were plated on chamber slides. Cells were fixed with 4% paraformaldehyde for 10 minutes. Next, the cells were incubated with 0.2% Triton X-100 in PHEM for 10 minutes and then blocked with 1% BSA in TBST for at least 30 minutes. The primary antibody was incubated 2 hours at room temperature followed by secondary antibody incubation and DAPI staining. Finally, the cells were mounted using DAKO Fluorescence Mounting Medium (Dako North America, Inc, Carpinteria, CA, USA; S3023). Images were acquired using a DeltaVision Deconvolution microscope (GE Healthcare, Buckinghamshire, UK).
For microtubule (MT) stability assay, cold treatment was performed by incubating cells in cold media (4°C) on ice for 10 min before fixed [14].
To determine the inter-kinetochore distance, cells were fixed with 4% paraformaldehyde and processed as described above. The center-to-center distances between sister-kinetochores were measured from different stacks. When sister-kinetochores were in the same focal plane, the inter-kinetochore distance was measured as previously described [15]. Images were collected with a DeltaVision Deconvolution microscope and analyzed with Image J.
STLC wash-out assay
Cells were synchronized with thymidine for 19 hours and released to fresh medium. After incubation for 9 hours, 5 μM STLC was added to the medium. Two hours later, the cells were released to fresh medium containing 10 μM MG132. After incubation for 1 hour, different drugs were added to the medium. One hour later, the cells were fixed and stained with the indicated antibodies.
Analysis of TCGA datasets
Mitosis-related Chromosomal Instability (CIN) signature contains 23 genes that were generated from CIN70 [16]. ATP production-related gene cluster contains 16 genes that were selected from the classic ATP generating enzymes in glycolysis, TCA cycle and Oxidative phosphorylation. TCGA datasets of patients with LIHC (Liver hepatocellular carcinoma) and LUAD (Lung adenocarcinoma) were analyzed with the online tool: GEPIA2 [17] (http://gepia2.cancer-pku.cn/#index)
Statistical analysis
Data was from two or more independent experiments. Statistical analyses were carried out by GraphPad Prism 5 software (La Jolla, CA, USA). The data was presented as Mean ± SD. Student’s t-test was used to calculate p values. Statistical significance is displayed as * p < 0.05, ** p < 0.01. *** p < 0.001, ns: not significant.
Ethical statement
All experimental procedures were approved by the Ethics Committee of the University of Science and Technology of China.
Results
ATP restriction led to delay in metaphase to anaphase transition in cancer cells
To examine the cellular response to reduced ATP (i.e. energy) supply, cell cycle and mitotic progression were monitored by time-lapse imaging in live cells cultured with glucose or galactose. It has been reported when the carbohydrate source is switched from glucose to galactose, there is no net ATP yield from glycolysis [18]. Under this condition ATP is mainly generated from oxidative phosphorylation (OXPHOS) in the mitochondria where the rate of ATP production is relative slow, especially in cancer cells [19,20]. To evaluate the effect of ATP restriction on mitotic progression, the chromosome movements were monitored in HeLa cells expressing a GFP-H2B reporter and cultured in media containing glucose or galactose. We found the duration from nuclear envelope breakdown (NEBD) to anaphase onset was significantly longer in galactose-cultured cells (Figure 1(a–c)). Interestingly, while the process of chromosome alignment in the prometaphase as well as the chromosome separation in anaphase were barely affected, the metaphase–anaphase transition was prolonged significantly (Figure 1(a–c)). And as expected, the ATP level was lower in mitotic cells cultured with galactose than that with glucose (Figure 1(d)). By adding ATP or NADH, two types of energy molecules, to the galactose-cultured cells, we observed an accelerated metaphase–anaphase transition as a result of increase in ATP supply (Figure 1(e–h)), suggesting that ATP shortage accounted for the metaphase delay in the galactose-cultured HeLa cells.
Figure 1.
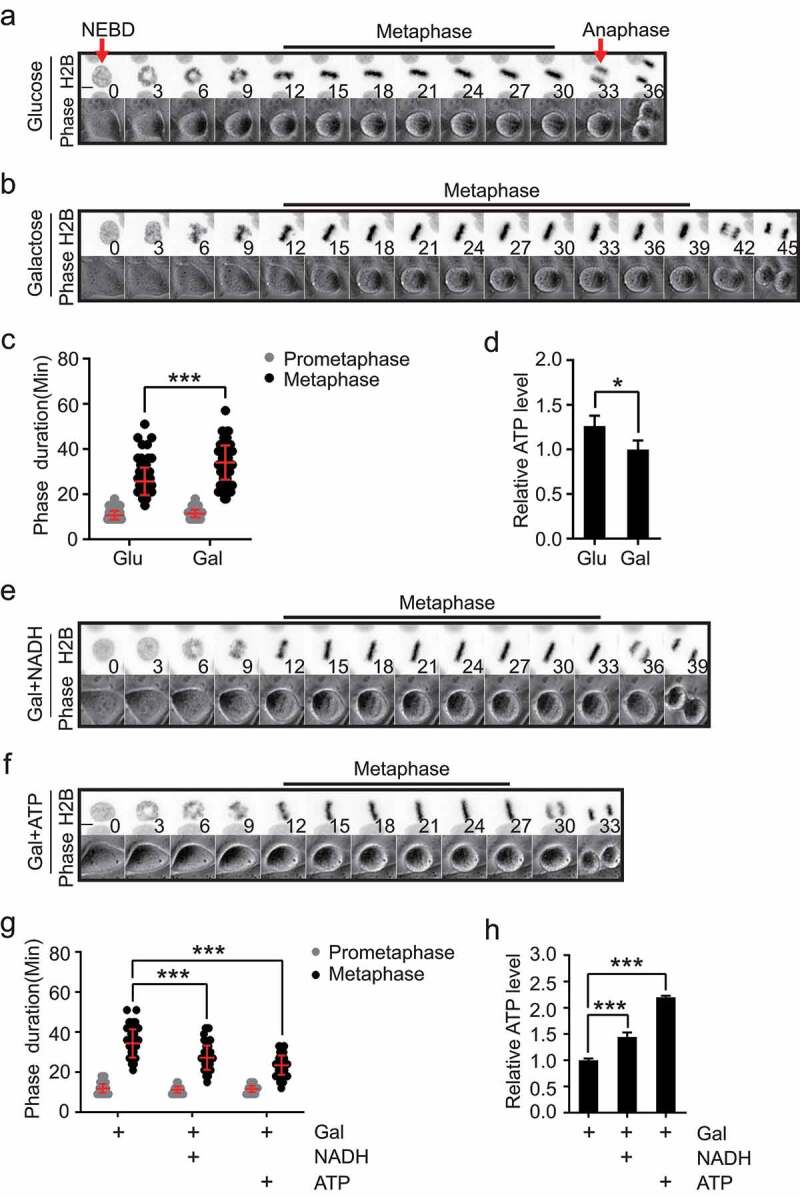
ATP restriction led to delay in metaphase to anaphase transition. (a–d) HeLa cells stably expressing GFP-H2B were imaged using both phase-contrast and fluorescence microscopy to monitor the duration of different mitotic phases in glucose (Glu) or galactose-containing (Gal) culture medium. Time 0 is defined as the NEBD (Nuclear Envelope Breakdown). Scale bar: 5 μm. Arrows indicate the Nuclear Envelope Breakdown and chromosome segregation at anaphase. Representative images are shown in (a, b), and the statistical results are shown in (c), n = 123 cells for Glu and n = 105 cells for Gal. Quantitation of the relative ATP level in mitotic cells cultured in glucose or galactose-containing medium is shown in (d), n = 3 independent experiments. (e-h) HeLa cells stably expressing GFP-H2B were treated with 1 mM NADH or 1 mM ATP and the durations of distinct mitotic phases were analyzed. Representative images are shown in (e, f), and the statistical results are shown in (g), n = 86 cells for Gal, n = 93 cells for Gal+NADH, n = 98 cells for Gal+ATP. Quantitation of the relative ATP level of mitotic HeLa cells cultured in galactose-containing medium with or without 1 mM NADH or 1 mM ATP is shown in (h), n = 3 independent experiments
Next, we investigated whether ATP restriction also caused metaphase delay in other cancer cell lines and normal cell line. Two cancer cell lines (MCF-7 and Siha) and one non-transformed line (RPE) were monitored in media containing galactose. Similar to the response observed for HeLa cells, prolonged metaphase was again observed in the two cancer cell lines, MCF-7 and Siha. And addition of ATP was able to shorten the delay (Supplementary Fig. S1(a, b)), indicating the metaphase delay was due to energy restriction. In contrast, the non-transformed RPE cells rapidly progressed through mitosis without any delay despite being cultured in the galactose medium (Supplementary Fig. S1(c)). Addition of extra ATP in the culture medium did not further accelerate the mitotic process (Supplementary Fig. S1(c)). Moreover, ATP measurement in RPE cells showed its level did not decrease in the galactose culture as compared to the glucose culture (Supplementary Fig. S1(d)), revealing that using galactose as the carbohydrate source did not limit ATP production in RPE cells. Hence, non-transformed cells and cancer cells appeared to differ significantly in their energy metabolism.
ATP restriction delayed the satisfaction of the spindle assembly checkpoint
To further elucidate how the anaphase onset in cancer cells was delayed by reduced ATP supply, we examined the spindle assembly checkpoint (SAC). At the transition from metaphase to anaphase, ATP fuels multiple processes, such as generation of forces at the kinetochore-microtubule attachment before SAC inactivation and protein degradation after SAC inactivation. With SAC disruption by reversine, an inhibitor of Mps1 kinase [21], HeLa cells cultured in galactose medium were no longer arrested in mitosis (Figure 2(a,b)), indicating that the metaphase delay was SAC dependent and protein degradation was not affected when ATP was in limited supply. We also measured SAC signal in live cells by monitoring a GFP-tagged reporter of Bub3, a component of the SAC that dissociates from kinetochore before SAC inactivation (Supplementary Fig. S2(a)). Although most Bub3-positive kinetochores disappeared when chromosomes were aligned at the equator plate, a few kinetochores (arrow in Figure 2(c)) still showed strong GFP-Bub3 signal in HeLa cells cultured in galactose (Figure 2(c)). However, this phenotype was not observed in cells cultured in the glucose medium. While no GFP-Bub3 signal could be detected in cells cultured in the glucose medium on average 11 minutes after chromosome alignment along the equator plate, these dots remained visible until approximately 23 minutes after the chromosome alignment in cells cultured in the galactose medium. This indicated a delay in SAC inactivation (Figure 2(c,d)). Consistent with the results shown in Figure 1, addition of exogenous ATP or NADH markedly accelerated the dissociation of GFP-Bub3 from the kinetochores (Figure 2(c,d)). Together, these data demonstrated that ATP restriction caused a delay in SAC inactivation at the metaphase in cancer cells.
Figure 2.
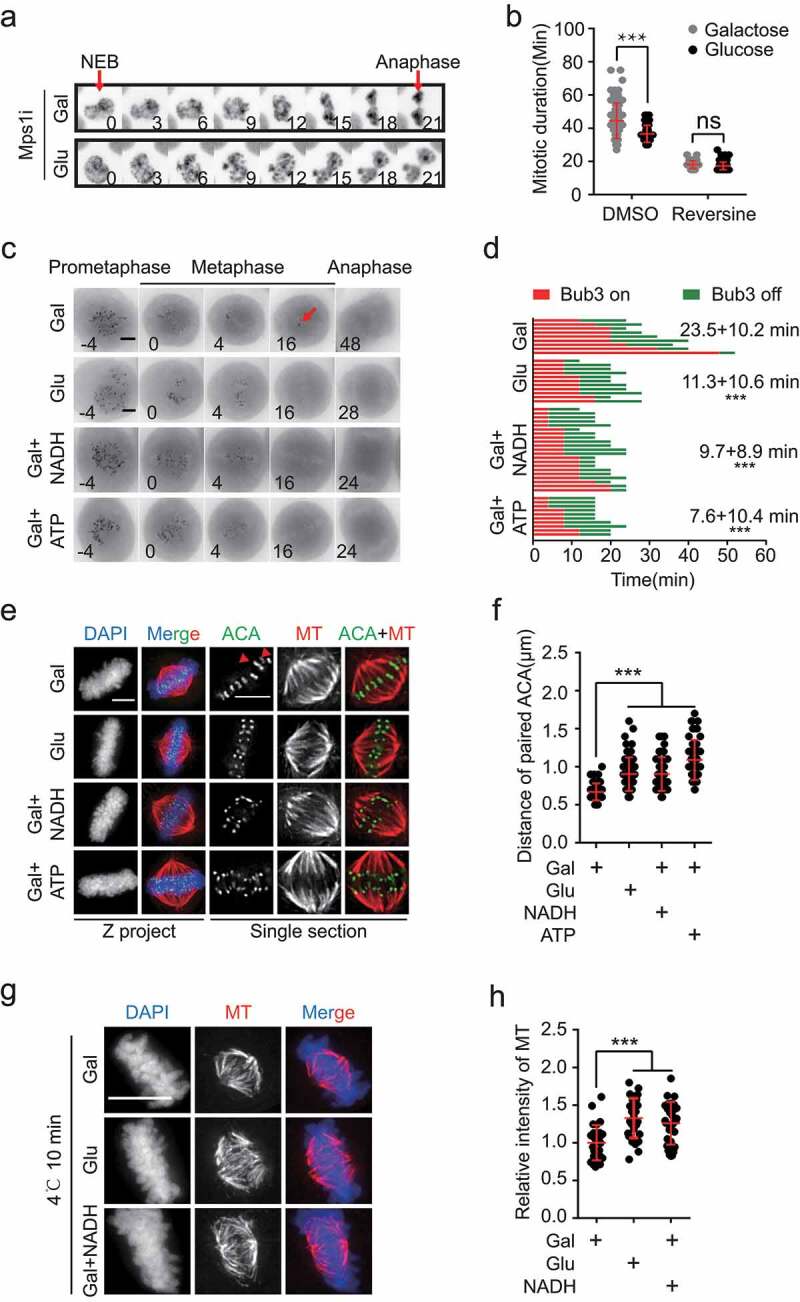
ATP restriction delayed the satisfaction of the spindle assembly checkpoint. (a, b) HeLa cells stably expressing GFP-H2B were treated with 500 nM reversine (an inhibitor of Mps1 kinase) and durations of the mitotic phases in glucose or galactose-containing medium were analyzed. Scale bar: 5 μm. Representative images are shown in (a), and the statistical results are shown in (b), n = 76 cells for Gal, n = 51 cells for Glu, n = 56 cells for Gal+reversine, n = 118 cells for Glu+reversine. (c, d) HeLa cells stably expressing GFP-Bub3 were imaged to monitor kinetochore-microtubule connection in glucose, galactose-containing medium or galactose-containing medium treated with 1 mM NADH or 1 mM ATP. Scale bar: 5 μm. Arrows indicate the GFP-Bub3 positive kinetochore. Representative images are shown in (c), and the statistical results are shown in (d), n = 11 cells for Glu, n = 9 cells for Gal, n = 21 cells for Gal+NADH, n = 10 cells for Gal+ATP. Time 0 is defined at the completion of chromosome alignment. Average duration from time 0 to the time when Bub3 dissociates from kinetochore is labeled. (e,f) HeLa cells were synchronized with thymidine and released to Gal or Glu medium. 7 hours after the release from the thymidine block, 1 mM NADH or 1 mM ATP was added to the Gal medium. 2 hours later, the cells were fixed and stained with DAPI (Blue), α-tubulin (Red) and ACA (Green), Scale bar: 5 μm. Arrows indicate the mis-aligned or unaligned sister-kinetochore pairs. Representative images are shown in (e), and the statistical results of inter-kinetochore (paired ACA) distances are shown in (f), n = 69 for Gal, n = 69 for Glu, n = 62 for Gal+NADH, n = 69 for Gal+ATP. (g, h) HeLa cells were synchronized with thymidine and released to Gal or Glu medium. 7 hours after the release from the thymidine block, 1 mM NADH was added to the Gal medium. 2 hours later, the culture dish was placed on ice (4°C) for 10 minutes. Then the cells were fixed and stained with DAPI (Blue) and α-tubulin (Red). Scale bar: 10 μm. Representative images are shown in (g), and the statistical results of stable α-tubulin are shown in (h), n = 28 cells for Gal, n = 29 cells for Glu, n = 28 cells for Gal+NADH
Modest ATP restriction impaired stable kinetochore-microtubule attachment
Because SAC monitors the attachments of kinetochores and microtubules, it is possible that cancer cells cultured in galactose did not have enough ATP to achieve stable attachments at the metaphase. Indeed, although the spindle structures seemed unaffected, mis-aligned or unaligned sister-kinetochore pairs were frequently observed at the equator of metaphase HeLa cells cultured in galactose (arrow in Figure 2(e)), whereas cells cultured in glucose displayed much less such alignment errors (Figure 2(e)). To evaluate the tension between sister kinetochores, the inter-distances between sister-kinetochores were measured. The distance was much shorter in galactose-cultured cells (Figure 2(f)). When extra ATP or NADH was added into the medium, both the attachment and tension were restored (Figure 2(e,f)), suggesting that generation of tension for kinetochore-microtubule attachment demands high levels of ATP (i.e. energy) at metaphase.
To further examine the stability of kinetochore-fiber (k-fiber), the microtubule bundles attached to kinetochore, HeLa cells were pre-incubated on ice to depolymerize unstable microtubule (MT). Consistent with alterations in tension between the sister-kinetochore, the k-fiber intensity was significantly lower in cells cultured in galactose than that of cells cultured in glucose or with additional NADH (Figure 2(g,h)), indicating that ATP shortage disrupts k-fiber stability at the metaphase. Because chromosome passenger complex (CPC) is involved in tension establishment by activating deploymerization of erroneous attachment, we then investigated the status of CPC component, Aurora-B, at the centromere. The level of Aurora-B at centromere showed no difference when ATP was limited in galactose culture (Supplementary Fig. S2(b, c)).
Severe ATP restriction led to chromosome mis-segregation in cancer cells
To examine the impact of severe ATP shortage on the cell division process, time-lapse microscopy was conducted in HeLa cells treated with 5 mM 2-deoxyglucose (2-DG), a glycolysis inhibitor. Despite significant reduction in ATP level (~40%) upon 2-DG treatment (Figure 3(a)), the mitotic index was only slightly reduced (Supplementary Figure S3(a)), indicating that severe ATP restriction did not prevent mitotic entry of HeLa cells. However, although prometaphase was barely affected, metaphase was considerably prolonged under 2-DG treatment (Figure 3(b)). Strikingly, the incidence of lagging chromosome during anaphase was substantially increased (Figure 3(c,d)). Similar results were observed in the other two cancer cell lines, MCF-7 and Siha (Supplementary Fig. S3(b-e)). The cold-stable k-fibers were also significantly decreased (Supplementary Fig. S3(f, g)). Unlike the responses in cancer cells, the mitotic index of non-transformed RPE cells was significantly reduced under 2-DG treatment (Supplementary Fig. S3(h)), suggesting that RPE cells were arrested in the interphase when ATP production was inhibited.
Figure 3.
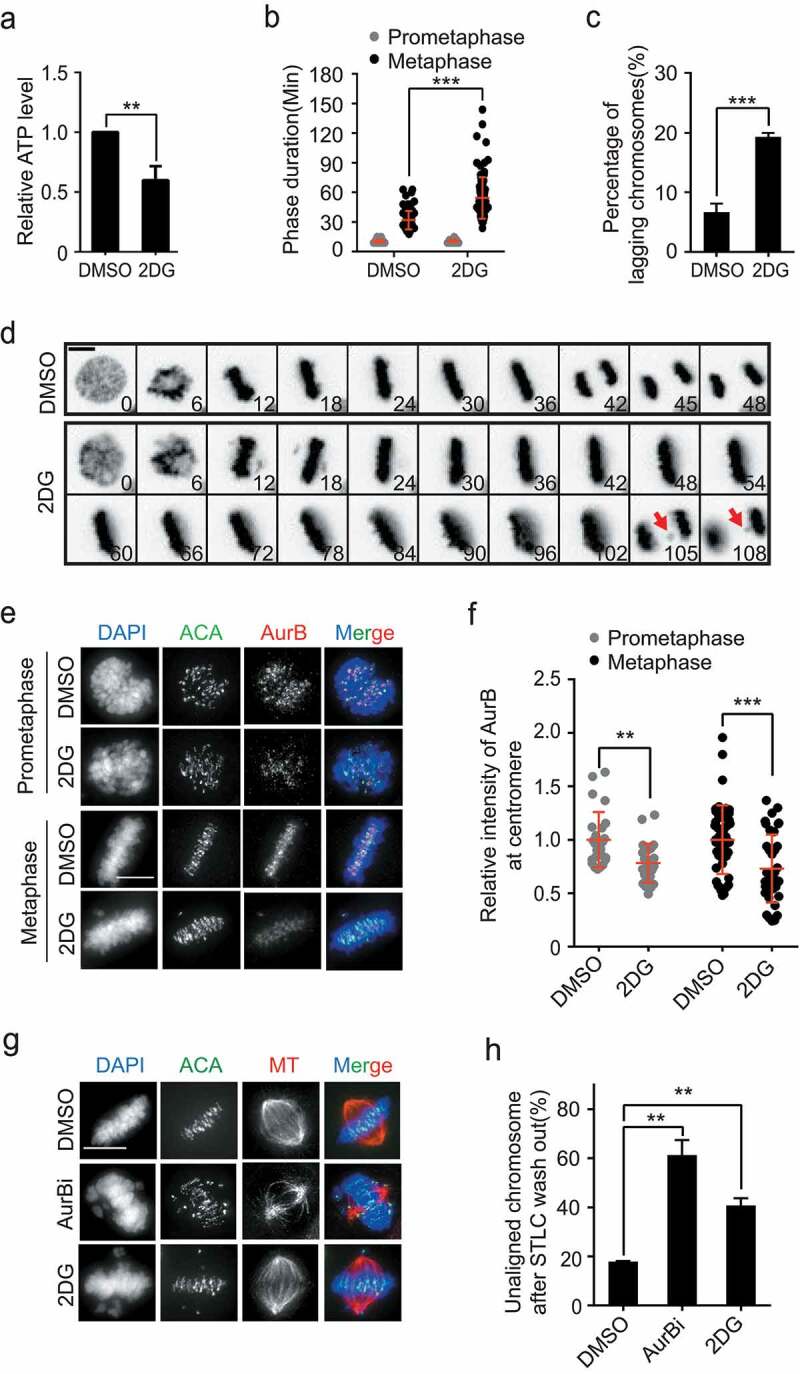
Severe ATP restriction led to errors in chromosome segregation in cancer cells. (a-d) After treatment with or without 5 mM 2DG, the ATP levels of mitotic HeLa cells were detected. The statistical results are shown in (a), n = 4 independent experiments. The phase duration was analyzed. The statistical results are shown in (b), n = 104 cells for DMSO, n = 98 cells for 2DG. The percentage of lagging chromosome is shown in (c), n = 3 independent experiments. Representative images are shown in (d). Scale bar: 5 μm. Arrows indicate the lagging chromosomes. (e, f) Immunofluorescence staining of Aurora-B and ACA in HeLa cells at the prometaphase and metaphase after treatment with or without 5 mM 2DG. Representative images are shown in (e), Scale bar: 10 μm, and the statistical results are shown in (f), n = 25 cells for the prometaphase (DMSO), n = 26 cells for the prometaphase (2DG), n = 49 cells for the metaphase (DMSO), n = 38 cells for the metaphase (2DG). (g, h) HeLa cells were treated as indicated in the Supplementary Figure 4(i) and co-stained for α-tubulin (red), ACA (green), and DNA (blue). The representative immunofluorescence images are shown in (g), Scale bar: 10 μm. The statistical results of unaligned chromosomes are shown in (h), n = 2 independent experiments
Chromosome mis-segregations caused in cancer cells by 2-DG treatment could be due to failures in CPC recruitment, which compromises error-correction efficiency in the kinetochore-microtubule attachment. Indeed, we found 2-DG treatment led to significant reduction of Aurora-B at the centromere in both prometaphase and metaphase cells (Figure 3(e, f)). Similar to the phenotype of Aurora-B inhibition, 2-DG-treated HeLa cells exhibited significantly higher number of unaligned chromosome (Figure 3(g,h)) during the bi-polar spindle reformation (Supplementary Fig. S3(i)). Together, these results indicated that severe ATP shortage compromised the fidelity of chromosome segregation in cancer cells.
Gene expressions associated with ATP production are correlated with those associated with CIN signatures and clinical outcomes in the TCGA datasets
As sufficient energy supply is crucial for an error-free mitosis in cancer cells, we explored whether gene expressions are correlated between pathways of energy production and chromosome segregation in clinical samples. Gene expression and survival data were analyzed using the TCGA datasets for gene clusters (Supplementary Fig. S4) associated with ATP production and chromosome instability (CIN) [16], the hallmark of cancer associated with chromosome mis-segregation [22]. As expected, these two signatures are correlated for both hepatocellular carcinoma and Lung adenocarcinoma (Figure 4(a)). Moreover, high expressions of both CIN signature genes (Figure 4(b)) and ATP-production genes (Figure 4(c)) are associated with poor survival in both cancer types. These results from the clinical data analysis suggested that high energy production promotes tumor progression in CIN cancers.
Figure 4.
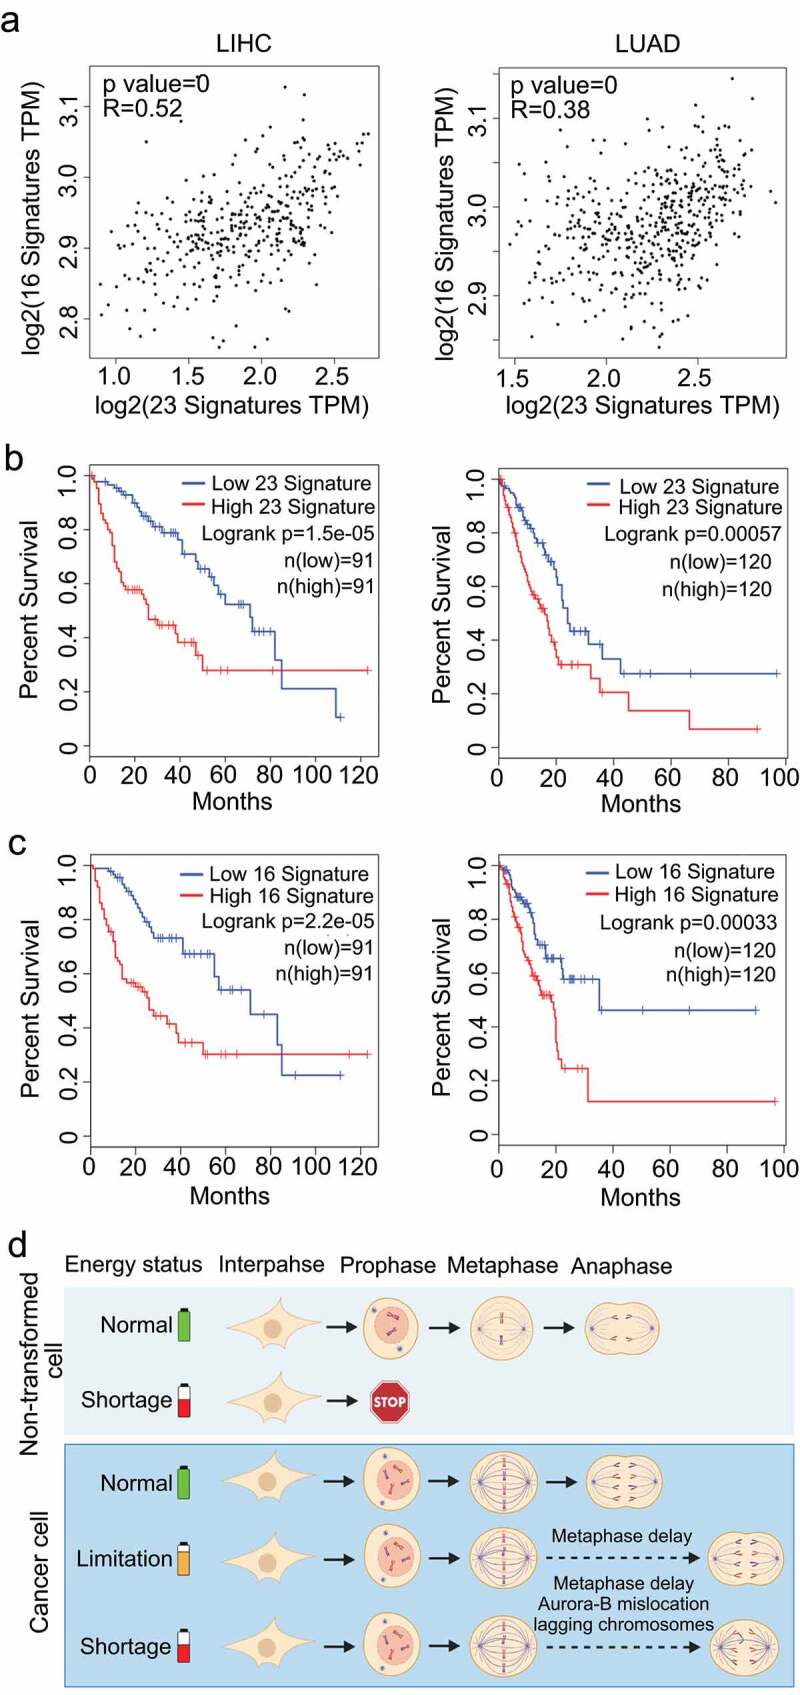
ATP production-related gene cluster and CIN signature are positively correlated in LIHC and LUAD. (a) Data analyses from TCGA datasets showed that the expression of ATP production-related gene cluster and CIN signature are positively correlated in LIHC (Liver hepatocellular carcinoma) and LUAD (Lung adenocarcinoma). (b) Data analyses from TCGA datasets showed that the CIN signature predicts survival in LIHC and LUAD. (c) The ATP production-related gene cluster predicts survival in LIHC and LUAD. (d) Graphic summary
Discussion
Energy metabolisms are markedly enhanced during mitosis, despite that anabolic metabolisms are generally decreased. The newly generated ATP is consumed by a variety of dynamic processes unique in mitosis, requiring intricate coordination of the energy-consuming events. Although several mechanisms have recently been reported for the up-regulation of ATP production [4,6], little is known about how different cells, in particular, normal vs. cancer cells, respond to ATP shortage in mitosis. In this study, we report that normal and cancer cells show differential responses to ATP restriction during cell division. While normal cells are arrested in interphase when energy is in short supply, cancer cells can progress into mitosis. Movements of chromosome assembly and segregation at the prometaphase and anaphase are not notably slowed down upon energy restriction in cancer cells during mitosis, although these processes require substantial energy. The mitotic event that is most sensitive to energy shortage in cancer cells is metaphase–anaphase transition. Severe ATP restriction causes a longer metaphase arrest and increases the incidence of chromosome mis-segregation in various cancer cell lines.
The observed delay in checkpoint inactivation when ATP is not sufficiently available may be attributed to a number of possible mechanisms. A previous study showed that when ATP level was temporally reduced to around 10% of the normal level by sodium azide (AZ) and 2-DG, the microtubule dynamics were reduced [23]. In our study, we reduced the ATP level more moderately, i.e. to 60–80% of the normal level (Figures 1(d) and 3(a)), and maintained this reduced ATP level throughout all our assays. As the rate of chromosome movements during anaphase was not reduced under our experimental condition (Figures 1 and 3), it is plausible that ATP restriction does not significantly reduce the activities of motor proteins or the rate of microtubule depolymerization, which is different from the previous finding under high level of ATP reduction. Nonetheless, the previous study also reported a significant reduction in the localization of outer kinetochore proteins, including cytoplasmic dynein, when the ATP production was inhibited by AZ and 2-DG, whereas neither the kinetochore-microtubule attachment nor the kinetochore outer plate were disrupted [24,25]. In our study system, the localization of dynein motor on outer kinetochore might also be reduced, probably to a lesser extent, compromising the tension generation between sister-kinetochores, which delayed the satisfaction of the SAC. Cancer cells usually have greater number of chromosomes, which may require more energy for tension generation. Previous work has shown that when two centrosomes were ablated from bi-nucleated non-transformed RPE cells, the cells with extra set of chromosomes spent longer time at metaphase [26], suggesting that the increase of tension above a threshold for a larger number of kinetochore-pairs requires more ATP. In addition, previous studies illustrated that high level of ATP was required for Mad2 turnover at the kinetochores [25] as well as Mad2 transportation from the kinetochore to the spindle pole for checkpoint inactivation [24]. ATP is also required for TRIP13-mediated conformational changes of Mad2 [27,28] to enable the disassembly of mitotic checkpoint complex before SAC inactivation. ATP also plays an important role to facilitate the release of APC/C from SAC inhibition [29]. Overall, these findings suggest that high level of ATP is crucial for the necessary conformational and/or positional changes of Mad2 during SAC inactivation. Defects in these processes may also contribute to the delay in metaphase–anaphase transition when the energy supply is limited. Follow-up work is needed to further explore the underlying molecular mechanism.
Compared to 20% ATP reduction, we found a more significant 40% reduction in ATP level resulted in increased chromosome mis-segregation. Howell et al. reported that when the level of ATP was reduced to 5–10% of the normal condition in Ptk1 cells, localizations of only the outer kinetochore proteins were decreased, while the centromere/inner kinetochore proteins were not affected [24]. This differ from our results. In our experimental system, 40% reduction in ATP level decreased the localization of Aurora-B at the centromere/inner kinetochore, which may subsequently compromise the error correction of the kinetochore-microtubule attachments. We indeed observed significantly increased errors in chromosome segregation (Figure 4(d)). Specifically, 2-DG treatment led to ~25% reduction of Aurora-B at centromere and compromised the efficiency of error correction. However, SAC activity remained robust, illustrated by efficient inhibition of the anaphase-onset. Our results thus suggest that the phosphorylation and activation of upstream kinases in SAC activation, e.g., Mps1, are likely not affected by ATP restriction.
The differential responses of normal and cancer cells to ATP restriction that our study revealed is important. Distinct from cancer cells, the non-transformed RPE cells did not show reduced ATP level in galactose culture (Supplementary Figure S1(d)), suggesting that RPE cells are able to produce ATP via OXPHOS using other energy molecules that are abundant in the culture medium, e.g. pyruvate and glutamine. When RPE cells were treated with 2-DG, the mitotic index was significantly reduced (Supplementary Fig. S3(h)), indicating that glycolysis is required for cell cycle progression in RPE cells. In addition to ATP, it is possible that glycolysis inhibition also leads to reduction of other glycolytic intermediate metabolites that are essential for biosynthesis, thus preventing mitotic entry. We observed only a slight reduction of the mitotic index in HeLa cells (Supplementary Fig. S3(a)). These results identified new points of variation between normal and cancer cells in energy metabolism that are cell cycle dependent (Figure 4(d)).
Targeting energy metabolism has shown therapeutic efficacy for multiple tumor types in several preclinical studies [30–32], although the underlying mechanisms are still not well understood. Our work provides a potential new mechanism for therapeutic agents that restrict ATP level in cancer cells. Given that cellular stress arising from energy deficiency was previously observed to induce cell death of aneuploid cancer cells [33], our work also suggests that targeting energy supply may activate cancer cell death by triggering metaphase delay and chromosome mis-segregation that result in aneuploid cells.
Supplementary Material
Acknowledgments
We thank Dr. Xueliang Zhu at Shanghai Institute of Biochemistry and Cell Biology, Chinese Academy of Sciences for providing GFP-Bub3 HeLa cells; Dr. Xin Zhang at High Magnetic Field Laboratory, Chinese Academy of Sciences for providing GFP-H2B RPE cells.
Funding Statement
This research was supported by National Natural Science Foundation of China (31701178, 31970670 to JG; 31771498, 92057104 to ZY; 32000528 to AC; 32000492 to FY); the Strategic Priority Research Program of the Chinese Academy of Sciences, Grant No. XDB19000000 to ZY; the Collaborative Innovation Program of Hefei Science Center, CAS 2019HSC-CIP011 to ZY; This work was also supported by the Hefei National Laboratory for Physical Sciences at the Microscale (KF2020009) and Open Project of the CAS Key Laboratory of Innate Immunity and Chronic Disease; the Fundamental Research Funds for the Central Universities to ZY, KZ, YP, AC and FY.
Data availability statement
Data supporting the findings of this study are available from the corresponding author upon reasonable request.
Disclosure statement
No potential conflict of interest was reported by the author(s).
Author contributions
Study design: J.G., Z.Y. and A.C.; methodology: A.C., Y.J., T.W., F.Y., M.C., D.Z. and X.J.; analysis and investigation: A.C., Y.J., and G.N.; resources: W.X., Q.L., K.Z. and Y.P.; data curation: A.C., and Y.J.; writing original draft preparation: A.C., Y.J. and Z.Y.; review and editing: I.I., Z.Y., J.S. and J.G; supervision: Y.P., Z.Y. and J.G.
Supplementary material
Supplemental data for this article can be accessed here.
References
- [1].Jia L, Kim S, Yu H.. Tracking spindle checkpoint signals from kinetochores to APC/C. Trends Biochem Sci. 2013;38(6):302–311. [DOI] [PubMed] [Google Scholar]
- [2].Skog S, Tribukait B, Sundius G. Energy metabolism and ATP turnover time during the cell cycle of Ehrlich ascites tumour cells. Exp Cell Res. 1982;141:23–29. [DOI] [PubMed] [Google Scholar]
- [3].Salazar-Roa M, Malumbres M. Fueling the cell division cycle. Trends Cell Biol. 2017;27:69–81. [DOI] [PubMed] [Google Scholar]
- [4].Wang Z, Fan M, Candas D, et al. Cyclin B1/Cdk1 coordinates mitochondrial respiration for cell-cycle G2/M progression. Dev Cell. 2014;29:217–232. [DOI] [PMC free article] [PubMed] [Google Scholar]
- [5].Harbauer AB, Opalińska M, Gerbeth C, et al. Mitochondria. Cell cycle-dependent regulation of mitochondrial preprotein translocase. Science. 2014;346:1109–1113. [DOI] [PubMed] [Google Scholar]
- [6].Zhao H, Li T, Wang K, et al. AMPK-mediated activation of MCU stimulates mitochondrial Ca(2+) entry to promote mitotic progression. Nat Cell Biol. 2019;21:476–486. [DOI] [PubMed] [Google Scholar]
- [7].Pavlova NN, Thompson CB. The emerging hallmarks of cancer metabolism. Cell Metab. 2016;23:27–47. [DOI] [PMC free article] [PubMed] [Google Scholar]
- [8].Tennant DA, Duran RV, Gottlieb E. Targeting metabolic transformation for cancer therapy. Nat Rev Cancer. 2010;10:267–277. [DOI] [PubMed] [Google Scholar]
- [9].Ganapathy-Kanniappan S, Geschwind JF. Tumor glycolysis as a target for cancer therapy: progress and prospects. Mol Cancer. 2013;12:152. [DOI] [PMC free article] [PubMed] [Google Scholar]
- [10].Imamura H, Huynh Nhat KP, Togawa H, et al. Visualization of ATP levels inside single living cells with fluorescence resonance energy transfer-based genetically encoded indicators. Proc Natl Acad Sci U S A. 2009;106(37):15651–15656. [DOI] [PMC free article] [PubMed] [Google Scholar]
- [11].Cheng A, Zhang P, Wang B, et al. Aurora-A mediated phosphorylation of LDHB promotes glycolysis and tumor progression by relieving the substrate-inhibition effect. Nat Commun. 2019;10(1):5566. [DOI] [PMC free article] [PubMed] [Google Scholar]
- [12].Zhao Y, Jin J, Hu Q, et al. Genetically encoded fluorescent sensors for intracellular NADH detection. Cell Metab. 2011;14(4):555–566. [DOI] [PMC free article] [PubMed] [Google Scholar]
- [13].Yu F, Jiang Y, Lu L, et al. Aurora-A promotes the establishment of spindle assembly checkpoint by priming the Haspin-Aurora-B feedback loop in late G2 phase. Cell Discov. 2017;3(1):16049. [DOI] [PMC free article] [PubMed] [Google Scholar]
- [14].Yang Z, Guo J, Chen Q, et al. Silencing mitosin induces misaligned chromosomes, premature chromosome decondensation before anaphase onset, and mitotic cell death. Mol Cell Biol. 2005;25(10):4062–4074. [DOI] [PMC free article] [PubMed] [Google Scholar]
- [15].Gao Y-F, Li T, Chang Y, et al. Cdk1-phosphorylated CUEDC2 promotes spindle checkpoint inactivation and chromosomal instability. Nat Cell Biol. 2011;13(8):924–933. [DOI] [PubMed] [Google Scholar]
- [16].Carter SL, Eklund AC, Kohane IS, et al. A signature of chromosomal instability inferred from gene expression profiles predicts clinical outcome in multiple human cancers. Nat Genet. 2006;38(9):1043–1048. [DOI] [PubMed] [Google Scholar]
- [17].Tang Z, Kang B, Li C, et al. GEPIA2: an enhanced web server for large-scale expression profiling and interactive analysis. Nucleic Acids Res. 2019;47(W1):W556–W560. [DOI] [PMC free article] [PubMed] [Google Scholar]
- [18].Swerdlow RH, Aires EL, Lu J. Glycolysis-respiration relationships in a neuroblastoma cell line. Biochim Biophys Acta. 2013;1830:2891–2898. [DOI] [PMC free article] [PubMed] [Google Scholar]
- [19].Rossignol R, Gilkerson R, Aggeler R, et al. Energy substrate modulates mitochondrial structure and oxidative capacity in cancer cells. Cancer Res. 2004;64(3):985–993. [DOI] [PubMed] [Google Scholar]
- [20].Zhdanov AV, Waters AH, Golubeva AV, et al. Availability of the key metabolic substrates dictates the respiratory response of cancer cells to the mitochondrial uncoupling. Biochim Biophys Acta. 2014;1837:51–62. [DOI] [PubMed] [Google Scholar]
- [21].Santaguida S, Tighe A, D’Alise AM, et al. Dissecting the role of MPS1 in chromosome biorientation and the spindle checkpoint through the small molecule inhibitor reversine. J Cell Biol. 2010;190:73–87. [DOI] [PMC free article] [PubMed] [Google Scholar]
- [22].Sansregret L, Vanhaesebroeck B, Swanton C. Determinants and clinical implications of chromosomal instability in cancer. Nat Rev Clin Oncol. 2018;15:139–150. [DOI] [PubMed] [Google Scholar]
- [23].Wadsworth P, Salmon ED. Spindle microtubule dynamics: modulation by metabolic inhibitors. Cell Motil Cytoskeleton. 1988;11:97–105. [DOI] [PubMed] [Google Scholar]
- [24].Howell BJ, McEwen BF, Canman JC, et al. Cytoplasmic dynein/dynactin drives kinetochore protein transport to the spindle poles and has a role in mitotic spindle checkpoint inactivation. J Cell Biol. 2001;155:1159–1172. [DOI] [PMC free article] [PubMed] [Google Scholar]
- [25].Howell BJ, Hoffman DB, Fang G, et al. Visualization of Mad2 dynamics at kinetochores, along spindle fibers, and at spindle poles in living cells. J Cell Biol. 2000;150:1233–1250. [DOI] [PMC free article] [PubMed] [Google Scholar]
- [26].Yang Z, Loncarek J, Khodjakov A, et al. Extra centrosomes and/or chromosomes prolong mitosis in human cells. Nat Cell Biol. 2008;10:748–751. [DOI] [PMC free article] [PubMed] [Google Scholar]
- [27].Eytan E, Wang K, Miniowitz-Shemtov S, et al. Disassembly of mitotic checkpoint complexes by the joint action of the AAA-ATPase TRIP13 and p31(comet). Proc Natl Acad Sci U S A. 2014;111:12019–12024. [DOI] [PMC free article] [PubMed] [Google Scholar]
- [28].Alfieri C, Chang LF, Barford D. Mechanism for remodelling of the cell cycle checkpoint protein MAD2 by the ATPase TRIP13. Nature. 2018;559:274-+. [DOI] [PMC free article] [PubMed] [Google Scholar]
- [29].Miniowitz-Shemtov S, Teichner A, Sitry-Shevah D, et al. ATP is required for the release of the anaphase-promoting complex/cyclosome from inhibition by the mitotic checkpoint. Proc Natl Acad Sci U S A. 2010;107:5351–5356. [DOI] [PMC free article] [PubMed] [Google Scholar]
- [30].Shi Y, Lim SK, Liang Q, et al. Gboxin is an oxidative phosphorylation inhibitor that targets glioblastoma. Nature. 2019;567:341–346. [DOI] [PMC free article] [PubMed] [Google Scholar]
- [31].Jian C, Fu J, Cheng X, et al. Low-dose sorafenib acts as a mitochondrial uncoupler and ameliorates nonalcoholic steatohepatitis. Cell Metab. 2020;31:892–908 e811. [DOI] [PMC free article] [PubMed] [Google Scholar]
- [32].Muir A, Vander Heiden MG. The nutrient environment affects therapy. Science. 2018;360:962–963. [DOI] [PMC free article] [PubMed] [Google Scholar]
- [33].Tang YC, Williams BR, Siegel JJ, et al. Identification of aneuploidy-selective antiproliferation compounds. Cell. 2011;144:499–512. [DOI] [PMC free article] [PubMed] [Google Scholar]
Associated Data
This section collects any data citations, data availability statements, or supplementary materials included in this article.
Supplementary Materials
Data Availability Statement
Data supporting the findings of this study are available from the corresponding author upon reasonable request.