

Abstract
Background
Charcot Marie Tooth disease type 1A (CMT1A) is the most common inherited neuropathy, a debilitating disease without known cure. Among CMT1A patients, disease manifestation, progression and severity are strikingly variable, which poses major challenges for the development of new therapies. Hence, there is a strong need for sensitive outcome measures such as disease and progression biomarkers, which would add powerful tools to monitor therapeutic effects in CMT1A.
Methods
We established a pan-European and American consortium comprising 9 clinical centers including 311 patients with CMT1A in total. From all patients, the CMT neuropathy score (CMTNS) and secondary outcome measures were obtained and a skin biopsy collected. In order to assess and validate disease severity and progression biomarkers, we performed qPCR on a set of 16 animal model derived potential biomarkers in skin biopsy mRNA extracts.
Results
In 266 CMT1A patients, a cluster of eight cutaneous transcripts differentiates disease severity with a sensitivity and specificity of 90% and 76.1%, respectively. In an additional cohort of 45 CMT1A patients, from whom a second skin biopsy was taken after two to three years, the cutaneous mRNA expression of GSTT2, CTSA, PPARG, CDA, ENPP1 and NRG1-I is changing over time and correlates with disease progression.
Conclusions
In summary, we provide evidence that cutaneous transcripts in patients with CMT1A serve as disease severity and progression biomarkers and, if implemented into clinical trials, they could markedly accelerate the development of a therapy for CMT1A.
Keywords: Charcot Marie Tooth disease 1A, biomarker, disease severity, disease progression, skin biopsy
Introduction
Charcot-Marie-Tooth (CMT) diseases or hereditary motor and sensory neuropathies (HMSN) comprise a family of the most common inherited disorders of the peripheral nervous system with a prevalence of up to 1 in 1214 (1,2). So far, over 1000 different mutations have been discovered in more than 90 genes linked to hereditary neuropathy (3). In >60% of all cases, the genetic defect underlying CMT is duplication of the gene encoding the 22kDa peripheral myelin protein (PMP22) (4–9). Affected individuals develop a slowly progressive demyelinating neuropathy with distally pronounced muscle atrophy and sensory impairment, resulting in steppage gait, altered deep tendon reflexes and skeletal deformities (e.g. pes cavus)(10). CMT1A typically manifests within the first two decades of life, and walking disabilities, foot deformities and electrophysiological abnormalities in most patients present already in childhood (11,12). However, CMT1A disease onset, progression and severity are strikingly variable within families and even among monozygotic twins (13,14). Despite several promising trials in animal models, no causal treatment is available for any form of CMT yet (15,16). Neither trials of exercise and orthosis, nor pharmacological approaches with ganglioside, creatine and, more recently, oral administration of ascorbic acid showed beneficial effects in patients with CMT subtype 1A (17–21). For ascorbic acid, it was suggested that a treatment effect may have been missed because of an unexpectedly slow disease progression (21). Hence, insensitive outcome measures harbor the risk to mask therapeutic effects in clinical trials (21,22). Improvement of outcome measures is therefore essential to facilitate the development of a treatment for CMT1A disease (23,24). To date, only physical and electrophysiological examinations are available to determine disease severity in patients with CMT. The CMT neuropathy score (CMTNS) is a valid and reliable nine-item composite scale taking into account sensory and motor symptoms (25). In order to standardize patient assessment and to improve the scale’s sensitivity to change, a novel version of the CMTNS has been proposed (23,26). Surrogate biomarkers of disease severity and progression would add powerful tools to monitor therapeutic effects in clinical trials (15,21,27–29). Recently, non-invasive magnetic resonance imaging study of muscle water changes and intramuscular fat accumulation in the lower limbs were shown to be correlated to clinical impairment (30,31). While promising as a surrogate outcome measure for clinical trials, this approach is technically demanding and has so far only been tested in proof of principle in a small group of patients suffering from CMT and various other neuromuscular disorders. Molecular analysis of body fluids or tissue biopsies is a promising strategy for the development of clinically more practical surrogate biomarkers for disease severity in CMT1A.
The development of valid biomarker assays, however, requires a fit-for-purpose approach (32,33), that can be separated into four iterative phases: (I) The pre-validation phase defines the intended purpose of the biomarker, considering pre-analytical variables and bioanalytical method feasibility. (II) The exploratory validation phase assesses the basic assay performance. (III) The advanced validation phase characterizes the formal performance of the assay with regard to its intended use. (IV) The in-study validation phase that ensures that the assay method performs robustly across studies according to predefined specification and facilitates the establishment of definitive acceptance criteria (32,33).
Within an exploratory pre-validation phase (fit-for purpose step I), employing a Pmp22 transgenic rat model for CMT1A (CMT rat, (34)), we could previously show that transcriptional profiling in skin biopsies can be utilized to identify prognostic and disease severity biomarkers which correlate with clinical impairment (16). Importantly, in a translational proof of concept approach, we could validate rodent cutaneous mRNA biomarkers in skin biopsies from 46 patients with CMT1A (16). Building on these preliminary results, here we aimed at the exploratory validation (fit-for-purpose step II) of 16 CMT rat derived potential transcriptional biomarkers within a large pan-European and American consortium providing skin biopsies from 266 clinically well characterized genetically proven patients with CMT1A. Next to the assessment of clinical impairment, the ability to measure disease progression is an indispensable prerequisite for the successful conduction of therapeutic trials. Given the poor detectability of clinical impairment over time (21), disease progression biomarkers could markedly accelerate the development of a therapy. Hence, we aimed on the advanced validation phase of potential biomarkers with regard to disease progression (fit-for-purpose step III) and collected 45 paired skin biopsies from patients with CMT1A that were re-assessed after 2–3 years.
Methods
Patient recruitment
All clinical centers involved obtained prior ethical approval of their local institutional review board and their respective regional ethics committee. An overall description of the patient recruitment and a detailed listing of all assessed outcome measures outcome measures can be found in the supplemental material
Skin biopsy
Skin biopsies with a diameter of 3 mm were taken from the proximal, medial part of the index finger of the non-dominant hand. Sterile disposables of 3 mm diameter, “Biopsy Punch” by Stiefel were used. The skin biopsy was split into two equal parts, one placed in 4% paraformaldehyde in 1 phosphate-buffered saline, the other part was stored in RNAlater (Ambion).
RNA Isolation, Precipitation and cDNA Synthesis
For the gene expression measurements the total RNA was extracted from one half of the skin biopsies (in RNA later). The sample was homogenized in RLT buffer (Qiagen) using a rotor stator and processed using the Qiagen manufacture protocol for non-fatty tissue (RNeasy Mini Kit, Qiagen). Before cDNA synthesis the RNA was precipitated by adding 0.5 volumes ammoniumacetate (7M, RNA grade), 2μl pellet paint (EMD Millipore) and 2.5 volumes pure ethanol (RNA grade) and resuspended in RNAse free. The preparation and processing of all samples were performed in parallel by the same person using the same protocol and the quality of RNA was verified by integrity check (Agilent). Only samples with a RNA integrity number (RIN) higher than 7 were used for further analyses. The cDNA synthesis was carried out using the Superscript III RT kit (invitrogen). To reversely transcribe mRNA we used dT Primer (0.6 μM) and random nonamer primers (N9 Primers 120 μM) in a single polymerase chain reaction step. The obtained cDNA was diluted 1 to 10 before qPCR analyses.
Real-time semiquantative PCR with TaqMan and SYBRgreen
The qPCR was operated in the LightCycler 480 Systems (384 well format, Roche Applied Science) using 2μl of diluted cDNA from skin biopsies in each reaction. For all genes except NRG1-I, TaqMan qPCR assays were performed using the manufacturers protocol (TaqMan Universal PCR Master Mix, Applied Biosystems). Intron spanning primers (0.9 μM, each) and FAM-TAMRA tagged probes (0.25 μM) were designed by Microsynth (Switzerland) for each assay (see sequences in supplemental material). For NRG1-I no primer probe set could be designed and we designed primers amplifying the type I specific 5’ region of the NRG1 gene using Primer Express Software V.1.65 (Applied Biosystems, see sequences in supplemental material). For NRG1-I we performed qPCR using the SYBRGreen PCR master mix (Applied Biosystems).
For all qPCR assays, the reaction mix was prepared to the final volume of 10μl and all reactions were performed in four replicates. Due to the high number of samples, six 384 well plates for each assay were used and the plates were calibrated to each other by analysis of three calibrator samples on each plate for each gene. For quantification of expression levels, the threshold cycles (Ct) for each gene of interest was normalized against two stable housekeeping genes (B2M and RPLP0).
Data analysis and Statistics
Four technical replicates were available for each qPCR measurement which were summarized by their median for further analysis. The difference to the mean expression of the two housekeeper genes B2M and RPLP0 was calculated per patient. To remain on the Ct scale, for each plate the median of all housekeeper gene measurements was added. Three reference patients were quantified on each qPCR plate and their mean expression was subtracted to normalize for plate effects. Again, to remain on Ct scale, the median of all reference patient measurements was added. The resulting normalized expression data are ΔΔCt values rescaled to a Ct comparable scale.
The secondary clinical parameters were transformed into z scores using mean and standard deviation (SD) of healthy controls of corresponding age class, and gender. The z scores were further categorized into one of the levels normal, very mild, mild, moderate, severe (0,1,2,3,4).
Cohort specific mean and SD were calculated for age, BMI, all primary and secondary clinical parameters as well as different CMT scores.
The normalized Ct values from the PCR experiment were used for correlation based hierarchical clustering, where patients were clustered on the correlation of their expression profiles across the potential biomarkers. Similarly, the potential biomarkers were clustered based on the correlation of the expression profiles across patients, where both, positive and negative correlation, were interpreted as small distance. Additionally, the potential biomarkers were clustered by their pairwise correlations.
Supervised principal component analysis (PCA) was performed on the PCR data. To account for potential center and plate effects, linear mixed effects models were fit to the expression data controlling for CMTNS and estimating coefficients for the genes, the plates and the centers. The data was then corrected by the estimated plate and center effects. CMTNS values were genewise regressed onto the expression values and the expression values were scaled by the resulting coefficient so that the rescaled expression values were in CMTNS unit scale. A canonical PCA was performed on these data. CMT patients were classified as mild (CMTNS < 10), moderate (CMTNS between 10 and 20) or severe (CMTNS > 20). A support vector machine (SVM) classifier separating mild and severe CMT cases based solely on gene expression profiles was trained and evaluated using a 10 times repeated 10-fold cross validation.
The association between CMT scores, as well as primary and secondary sub-scores with the expression of the potential biomarkers was assessed by fitting linear models to the expression values with the score as predictor while controlling for center, plate, age, gender, and BMI.
Using the data from patients with measurements in two points in time linear mixed effect models were fit to the CMTNS quantifying the progression effect while controlling for BMI, gender, and age effects. Similar mixed effects repeated measures regression models were fit per gene to the expression data, where the effect of time was assessed controlling for BMI, gender, age, and center effects.
A predictive random forest model that classifies patients into progressive patients (CMTNS score increase) and non-progressive patients (CMTNS score does not increase) was trained on the genes with significant change in expression over time. Prediction performance was evaluated in a 10 times repeated 10-fold cross validation.
Gene set enrichment analysis was performed by the web based gene list enrichment analysis tool Enrichr (http://amp.pharm.mssm.edu/Enrichr/, (35))
Results
266 plus 45 CMT1A patients were examined in 9 centers around the world (95 from Germany, 56 from the Czech Republic, 50 from Spain, 26 from Belgium, 20 from the UK, 10 from Italy and 9 from France were examined once for the testing of disease severity biomarkers, and 16 from Germany, 14 from Italy and 15 from the USA were examined twice for disease progression biomarkers) (Fig. 1A). From all patients the CMTNS and related outcome measures were obtained and the patients were characterized according to standardized operating procedures (see methods) and the patients were further characterized for their gender, age and BMI (Tab. 1). The overall patient cohort (n=266) splits into 155 (58%) female and 111 (42%) male CMT1A patients, with a mean age of 43 years (SD 14, range 18–80). The CMTNS ranged from 4 to 29 with a median value of 14 (Tab.1). Importantly, the patient cohorts from the different centers display significant differences in a majority of the obtained parameters (Tab. 1). This inter-center variability may partially be explained by regional differences in the composition of the patient cohort. However, small cohort sizes in some centers or differences in routine clinical examination and assessment of the CMTNS, despite standardized operating procedures, are more likely to account for the inter-center variability. Indeed, e.g. the very disparate scores for the dynamometrical secondary outcome measures are in favor for this notion (Tab. 1). Therefore, to avoid disruptive influences of center effects in the clinical parameters on the biomarker analyses, the subsequent expression data analysis was controlled for the co-variables center, age, gender and BMI (Tab. 2).
Figure 1: Previously identified potential cutaneous mRNA biomarkers tested in skin biopsies of 266 patients with CMT1A.
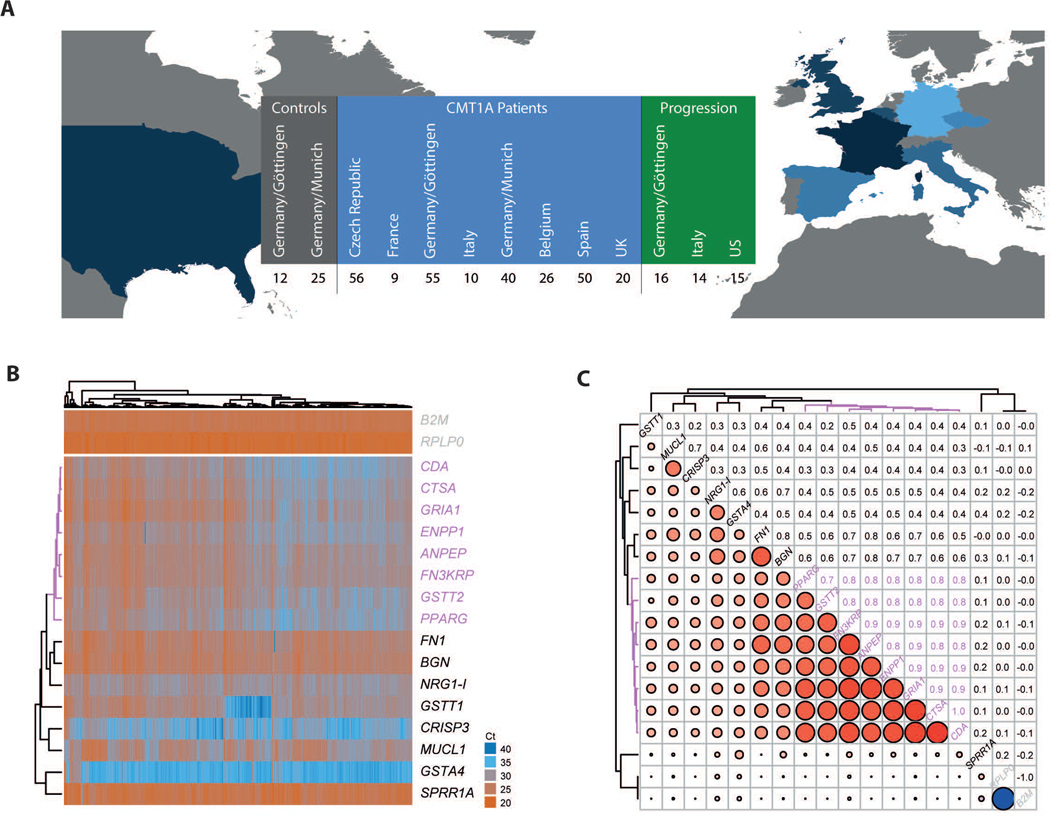
A Participating centers in Europe and the USA with number of assessed patients and contributed skin biopsies for biomarker analyses (see Table 1 for further details). Next to 266 patients from Europe that were assessed once (in blue) additional 45 patients from Europe and the USA were sampled twice within 2–3 years giving information on the progression (in green). 37 healthy humans were included as controls from two centers in Germany (grey). B Heatmap displaying normalized Ct values from the qPCR analyses of all patients (columns) for all genes (rows). High values (in blue) correspond to low expression while low values (in red) indicate high expression. Both dimensions, patients and genes, are re-ordered by means of correlation based hierarchical clustering to group by expression profile similarities. The dendrogram on the top shows the clustering of patients, the dendrogram on the left shows the clustering of the genes. The biggest cluster of eight similarly regulated genes is highlighted in magenta. The two rows at the top show the two housekeeper genes for reference.
C Correlation of the gene expression profiles across the patients. Both, rows and columns show genes, the upper triangle shows the numerical values of the correlation coefficients the lower triangle visualizes the correlations coefficients where blue colored circles represent negative correlations and red colored circles represent positive correlations. The size of the circles indicates the strength of correlation. The genes are clustered by their correlation profile. Eight out of 16 genes cluster with correlation coefficients >0.7 (highlighted in magenta). Most notably, there is no negative correlation among the genes, except for the perfectly negatively correlated housekeeper genes.
Table 1: Patient characteristics.
This table holds descriptive statistics about the main clinical parameters of all the patients in the study cohort. The statistics are computed separately within each contributing clinical center. Grey: basic characteristics; white: CMT scores; green: subscores to the CMTNS; orange: secondary parameters.
| parameter | level | Czech Republic | France | Italy | Belgium | Spain | UK | Germany/Munich | Germany/Gottingen | p value |
| n | 56 | 9 | 10 | 26 | 50 | 20 | 40 | 55 | ||
| Gender | female | 37(66.1%) | 5 (55.6%) | 6 (60.0%) | 17 (65.4%) | 33 (66.0%) | −75.00% | 15 (37.5%) | 27 (49.1%) | 0.04 |
| male | 19 (33.9%) | 4 (44.4%) | 4 (40.0%) | 9 (34.6%) | 17 (34.0%) | 5 (25.0%) | 25 (62.5%) | 28 (50.9%) | ||
| Age at Examination [years] | mean ± sd | 40 ±12 | 46 ±18 | 54 ±16 | 51 ±16 | 39 ± 14 | 46 ±12 | 44 ±14 | 43 ±12 | 0.01 |
| BMI [kg/(m2)] | mean ± sd | 25 ±5.1 | 25 ± 4.8 | 24 ±3.1 | 25 ±4.4 | 27 ±5.6 | 24 ± 4.8 | 26 ±5.5 | 0.32 | |
| CMTNS [0/.../36] | mean ± sd | 14 ±4.6 | 13 ±4.5 | 13 ±7.5 | 17 ±4.2 | 12 ±4.3 | 16 ±4.9 | 14 ±5.1 | 14 ±5 | <0.01 |
| CMTNSJull [0/.../60] | mean ± sd | 27 ±8.4 | 22 ±8.7 | 25 ±11 | 28 ± 8.4 | 19 ± 6.7 | 36 ±11 | 24 ±8.4 | 26 ±6.6 | <0.01 |
| CMTNS_sig [0/.../48] | mean ± sd | 22 ±6.2 | 20 ±6.3 | 20 ± 9.4 | 24 ± 6.4 | 16 ±5.5 | 25 ±6.2 | 20 ±6.7 | 22 ±5 | <0.01 |
| CMTNS_mod 0/.../32] | mean ± sd | 14 ±4.6 | 12 ±5.1 | 12 ±5.6 | 16 ± 5.4 | 8.1 ±4.2 | 16 ±4.5 | 13 ±5.1 | 16 ±3.8 | <0.01 |
| Sensory Symptoms [0/1/2/3/4] | mean ± sd | 1.1 ±1.1 | 0.78 ±0.83 | 0.56 ±0.73 | 1.3 ±1 | 0.58 ±1.1 | 2.1 ±0.64 | 1.3 ±0.99 | 1.7 ±0.83 | <0.01 |
| Motor Symptoms Legs [0/1/2/3/4] | mean ± sd | 1.2 ±0.9 | 1.1 ±0.78 | 1.4 ±1.1 | 2 ±1.2 | 0.84 ±0.68 | 1.6 ±0.82 | 1.6 ± 1.1 | 1.3 ±0.96 | <0.01 |
| Motor Symptoms Arms [0/1/2/3/4] | mean ± sd | 0.57 ±0.57 | 0.67 ±0.71 | 0.56 ±0.73 | 1.1 ±0.56 | 0.38 ±0.64 | 1.1 ±0.51 | 0.62 ±0.71 | 0.81 ±0.74 | <0.01 |
| Pin Sensibility [0/1/2/3/4] | mean ± sd | 1.4 ±0.85 | 1.7 ±1 | 1.1 ±1.3 | 1.7 ±0.88 | 0.74 ±1.1 | 1.6 ±0.81 | 1.1 ±0.81 | 1.4 ±0.91 | <0.01 |
| Vibration [0/1/2/3/4] | mean ± sd | 2.4 ±0.88 | 1.3 ±0.5 | 1.8 ±1.4 | 2.8 ±0.51 | 3.7 ±1 | 1.4 ±0.69 | 1.7 ±0.86 | 2 ± 1.2 | <0.01 |
| Strength of Legs[0/1/2/3/4] | mean ± sd | 1.4 ±0.87 | 1.3 ±1 | 1.1 ±1.3 | 1.4 ±1 | 1.4 ±1.1 | 1.9 ±1 | 1.7 ±1.2 | 1.4 ±0.99 | 0.32 |
| Strength of Arms [0/1/2/3/4] | mean ± sd | 0.79 ±0.71 | 1 ± 0.87 | 1.2 ±1.3 | 0.81 ±0.69 | 0.2 ±0.4 | 1.3 ±0.86 | 0.67 ±0.87 | 0.48 ±0.78 | <0.01 |
| Ulnar CMAP (Median) [0/1/2/3/4] | mean ± sd | 1.7 ± 1.1 | 1.4 ±1.3 | 1.7 ±1.3 | 2 ± 0.87 | 1.2 ±1.1 | 1.1 ± 1.2 | 2.2 ±1 | 2.1 ±1.1 | <0.01 |
| Ulnar SNAP (Median) [0/1/2/3/4] | mean ± sd | 3.4 ±0.99 | 3.3 ±0.5 | 3.8 ±0.67 | 3.6 ±0.94 | 3.3 ±0.85 | 3.9 ± 0.45 | 3.5 ±0.55 | 2.9 ±1.1 | <0.01 |
| 10m Walk Test [sec] | mean ± sd | 7.8 ± 1.7 | 8 ±2.8 | 13 ± 6.4 | 16 ± 18 | 6.7 ±1.4 | 8.7 ±2.4 | 6.1 ±1.7 | 9.5 ±3.4 | <0.01 |
| 9 Peg Hole Test (dominant hand) [sec] | mean ± sd | 27 ±11 | 27 ±7.1 | 25 ±8.8 | 33 ±23 | 22 ± 4.4 | 32 ± 14 | 24 ±8.9 | 29 ± 14 | <0.01 |
| Fist Grip (dominant hand) [kg] | mean ± sd | 128 ±80 | 197 ±121 | 105 ± 41 | 147 ± 79 | 169 ± 77 | 104 ±107 | 196 ± 77 | 139 ±75 | <0.01 |
| Three Point Grip (dominant hand) [kg] | mean ± sd | 54 ±24 | 59 ±31 | 50 ±27 | 48 ±28 | 52 ±24 | 29 ±16 | 55 ±25 | 55 ±26 | 0.68 |
| Foot Dorsal (dominant foot) [kg] | mean ± sd | 51 ±35 | 105 ± 78 | 50 ±29 | 51 ±38 | 201 ±75 | 30 ±17 | 36 ±28 | 33 ±21 | <0.01 |
| Foot Plantar (dominant foot) [kg] | mean ± sd | 75 ±46 | 244 ±118 | 75 ±37 | 113 ±50 | 263 ± 80 | 56 ±29 | 45 ±25 | 71 ±46 | <0.01 |
Table 2: Regression coefficients for clinical parameters modeling biomarker expression.
Using multiple linear modeling, the effect of each of the CMT scores as well as each primary and secondary parameter (y axis) on the expression of each of the potental biomarkers (x axis) was assessed while controlling for effects from the co-variables center, plate, age, gender, and BMI. The table shows the regression coefficients from the individual models. The background color graphically represents the regression coefficients. The modeling was done on the Ct scale that is negative logarithmic to the gene expression, thus: blue shades: positive effect on gene expression, red shade negative effect on gene expression. Significant (on a non-adjusted 5% level) values are printed in black.
| SPRR1A | PPARG | NRG1-I | MUCL1 | GSTT2 | GSTT1 | GSTA4 | GRIA1 | FN3KRP | FN1 | ENPP1 | CTSA | CRISP3 | CDA | BGN | ANPEP | |
|---|---|---|---|---|---|---|---|---|---|---|---|---|---|---|---|---|
| CMTNS | 0,05 | 0,04 | 0,03 | 0,07 | 0,03 | 0,05 | 0,03 | 0,04 | 0,04 | 0,03 | 0,04 | 0,03 | 0,07 | 0,04 | 0,04 | 0,03 |
| CMTNS_full | 0,03 | 0,03 | 0,01 | 0,03 | 0 | 0,04 | 0,02 | 0,01 | 0,01 | 0,01 | 0,02 | 0,01 | 0,04 | 0,02 | 0,02 | 0,01 |
| CMTNS_sig | 0,04 | 0,04 | 0,02 | 0,05 | 0,02 | 0,08 | 0,03 | 0,03 | 0,03 | 0,02 | 0,03 | 0,03 | 0,05 | 0,03 | 0,03 | 0,02 |
| CMTNS_mod | 0,06 | 0,05 | 0,02 | 0,04 | 0,02 | 0,1 | 0,03 | 0,04 | 0,04 | 0,03 | 0,03 | 0,04 | 0,05 | 0,04 | 0,04 | 0,03 |
| Sensory Symptoms | 0,01 | 0,09 | 0,17 | 0,13 | −0,01 | 0,3 | 0,04 | 0,08 | 0,01 | 0,11 | 0,11 | 0,04 | 0,11 | 0,04 | 0,08 | 0,07 |
| Motor Symptoms Legs | 0,22 | 0,24 | 0,12 | 0,16 | 0,13 | 0,52 | 0,13 | 0,22 | 0,19 | 0,08 | 0,12 | 0,16 | 0,17 | 0,24 | 0,16 | 0,1 |
| Motor Symptoms Arms | 0,4 | 0,13 | 0,02 | 0,11 | 0,07 | 0,3 | 0,1 | 0,07 | 0,14 | 0,01 | 0,16 | 0,05 | 0,24 | 0,08 | 0,13 | 0,05 |
| Pin Sensibility | 0,11 | −0,02 | 0,08 | 0,06 | −0,15 | 0,25 | 0,03 | −0,01 | −0,02 | 0,08 | 0,05 | −0,11 | 0,04 | −0,02 | 0,08 | −0,05 |
| Vibration | 0,07 | 0,23 | 0,14 | 0,34 | 0,24 | 0,2 | 0,09 | 0,26 | 0,23 | 0,1 | 0,31 | 0,23 | 0,36 | 0,26 | 0,13 | 0,15 |
| Strength of Legs | 0,31 | 0,3 | 0,13 | 0,14 | 0,22 | 0,25 | 0,15 | 0,28 | 0,23 | 0,16 | 0,23 | 0,22 | 0,31 | 0,3 | 0,26 | 0,21 |
| Strength of Arms | 0,27 | 0,12 | 0,1 | 0,14 | 0,07 | 0,42 | 0,2 | 0,04 | 0,04 | 0,09 | 0,1 | 0 | 0,34 | 0,08 | 0,13 | 0,01 |
| Ulnar CMAP (Median) | 0,07 | 0,1 | −0,03 | 0,12 | 0,13 | −0,04 | 0,11 | 0,08 | 0,12 | 0,08 | −0,04 | 0,07 | 0,08 | 0,05 | 0,02 | 0,05 |
| Ulnar SNAP (Median) | 0,01 | −0,03 | 0,14 | 0,64 | 0,08 | 0,13 | 0,06 | −0,07 | 0,02 | 0,11 | 0,02 | −0,01 | 0,39 | 0,03 | 0,14 | 0,07 |
| 10m Walk Test | 0,15 | 0,09 | −0,04 | −0,06 | −0,05 | 0,2 | 0,03 | 0,08 | 0,1 | 0,01 | 0,07 | 0,06 | 0,06 | 0,07 | 0,03 | 0,03 |
| 9 Peg Hole Test (dominant hand) | 0,12 | 0,04 | 0,08 | 0,21 | 0,03 | 0,32 | 0,07 | 0,01 | 0,05 | 0,11 | 0,05 | 0,06 | 0,16 | 0,05 | 0,13 | 0,08 |
| Fist Grip (dominant hand) | 0,15 | 0,12 | 0 | 0,15 | −0,01 | 0,07 | 0,06 | 0,07 | −0,01 | 0,1 | 0,14 | 0,05 | 0,21 | 0,07 | 0,12 | 0,07 |
| Three Point Grip (dominant hand) | 0,02 | 0,06 | −0,06 | 0,15 | −0,05 | 0,08 | 0,05 | 0,04 | 0 | 0,08 | 0,07 | −0,02 | 0,14 | 0 | 0,03 | 0,03 |
| Foot Dorsal (dominant foot) | 0,12 | 0,18 | 0,04 | 0,27 | 0,11 | −0,05 | 0,09 | 0,16 | 0,12 | 0,14 | 0,15 | 0,12 | 0,33 | 0,15 | 0,17 | 0,17 |
| Foot Plantar (dominant foot) | 0,19 | −0,04 | 0,01 | −0,11 | −0,1 | 0,09 | 0,1 | −0,11 | −0,01 | −0,02 | −0,2 | −0,09 | 0,12 | −0,07 | −0,05 | −0,08 |
Distinct cutaneous gene expression profiles reflect disease severity in CMT1A
After clinical examination, the patients were asked to undergo a skin biopsy for biomarker analysis (Fig. 1A). From the collected skin biopsies the RNA was purified and qPCR performed for 16 transcripts derived from the previously identified disease severity biomarkers in CMT rats (16). The selected mRNA biomarkers were readily detectable and display a highly variable expression when compared to housekeeping genes (Fig. 1B). Of note, the expression values among potential biomarkers demonstrate a positive correlation with each other throughout the entire dataset (Fig. 1C). In detail, eight out of 16 tested biomarkers (CDA, CTSA, GRIA1, ENPP1, ANPEP, FN3KRP, GSTT2 and PPARG) show a similar expression pattern among patients with correlation coefficients >0.7 (Fig. 1A-B). Next, we asked whether we can identify the components in the expression of these eight biomarkers that provide information with respect to CMT1A disease severity. A supervised principal component analysis (PCA) indeed revealed a principal component 1 (PC1) that can explain 95% of the variance observed in the expression of the biomarker cluster (Fig.2A). Importantly, mapping the transcriptional profiles of the available samples to the first two principal components (PC1 and PC2) allows for the separation of the patient cohort according to the CMT status (Fig. 2B). In detail, PC1 not only separates patients with CMT1A from healthy controls, but also differentiates for disease severity within the patient group (mildly affected: CMTNS<10; moderately affected: CMTNS 10–20; severely affected: CMTNS>20) (Fig.2B). Of note, severely affected patients in PC1 cluster in close proximity to healthy controls, whereas mildly affected patients display a more distinct expression profile (Fig. 2B). A support vector machine (SVM) classifier, that was only trained on gene expression profiles of the identified eight biomarkers, separates mildly from severely affected patients (based on the CMTNS) with a sensitivity of 90% and a specificity of 76% (Fig. 2C). To test to which extent the expression of single genes correlates with disease severity, we next analyzed their relation to the CMTNS and individual primary and secondary outcome measures (Tab. 2). As mentioned above, to avoid disruptive influence of center effects on biomarker correlation, effects were controlled for the co-variables center, age, gender and BMI. Linear models were fit to the expression data to quantify the influence of each (sub)-score on the expression of each biomarker. The resulting regression coefficients (i.e. the factor by which the biomarker expression is changing when the assessed clinical parameter is changing for one unit) show a number of potential biomarkers significantly related to variants of CMTNS and one or more of the sub-scores (Tab. 2). Importantly, some primary clinical sub-scores, e.g. ‘Strength of Legs’ and ‘Vibration’, show numerous significant correlations when compared to the number of significant hits in the cumulative CMTNS variants (Tab. 2).
Figure 2: Cutaneous biomarker expression separates CMT1A disease severity and controls.

A Principal Component Analysis (PCA) was performed on the PCR data of the biomarker cluster identified in Fig.1B-C. A scree plot shows the percentage of the explained variance for each of the principal components (PCs). PC1 captures most of the information and explains 95% of the observed variance while PC2 explains already only 1% of the observed variance.
B Mapping of the samples on the first two principal components from A with PC1 on the x axis and PC2 on the y axis. All samples are color coded by their CMT disease severity status (red: healthy, green: mildly affected (CMTNS <= 10), blue: moderately affected (10 > CMTNS < 20), purple: severely affected (CMTNS >= 20). The ellipses are 70% probability ellipses assuming two dimensional normally distributed data drawn separately for each of the 4 groups.
C A support vector machine (SVM) classifier separating mild and severe CMT cases based solely on gene expression profiles of the eight biomarkers (Fig. 1B-C) was trained. Shown are the results from a 10 times repeated 10-fold cross validation. The presented ROC curve plots sensitivity (y axis) vs. specificity (x-axis). A perfect classifier would reach the top left corner (100% sensitivity and 100% specificity). The closest point (youden index) of the trained SVM reaches 90% sensitivity and 76.1% specificity.
The mRNA expression of single genes is changing with disease progression
To assess whether the previously identified biomarkers also harbor information about disease progression we analyzed mRNA expression in 45 sets of paired skin biopsies that were sampled from the very same patients over a 2–3 years’ timeframe (16 from Germany, 14 from Italy and 15 from the USA, Fig. 1A). In total, gene expression values were available for two time points for 45 patients, clinical data were available for 46 patients, with 30 CMT1A patients (mildly affected: n=3, moderately affected: n=23, severely affected: n=4) having both, clinical and gene expression values. We could confirm the low mean change in CMTNS of about ~0.7 points per year in our cohort of 46 patients with CMT1A (Fig. 3A-B), a value that matches previously published data (36). Mixed model linear regression on repeated measures analysis show a highly significant effect of ‘time’ (i.e. disease progression) on the CMTNS, controlling for gender, age and BMI, pointing to clinical detectability of disease progression in a 2–3 year’s timeframe (Fig. 3C). In 45 skin biopsies from CMT1A patients, we found six genes with significantly increased expression over time: GSTT2, CTSA, PPARG, CDA, ENPP1, NRG1-I (Fig. 4A). The extent of increase in gene expression per year ranges from 20.28=1.2 fold for NRG1-I to 20.66=1.6 fold for CTSA (Fig. 4B). A predictive random forest model was trained on these six genes. The 30 CMT1A patients from whom both, clinical and biomarker data were available, were classified into progressive (CMTNS increased, n=19) and non-progressive (CMTNS not increased, n=11), and the classifier had a specificity of 100% and a sensitivity of 63.2% in the detection of disease progression (Fig. 4C). Importantly, five out of the six disease progression biomarkers (GSTT2, CTSA, PPARG, CDA, ENPP1) are also part of the disease severity biomarker cluster of the 266 CMT1A patients cohort (Fig. 1B-C), further supporting their eligibility as biomarkers in CMT1A.
Figure 3: Disease progression is clinically detectable over a two to three year’s time period.
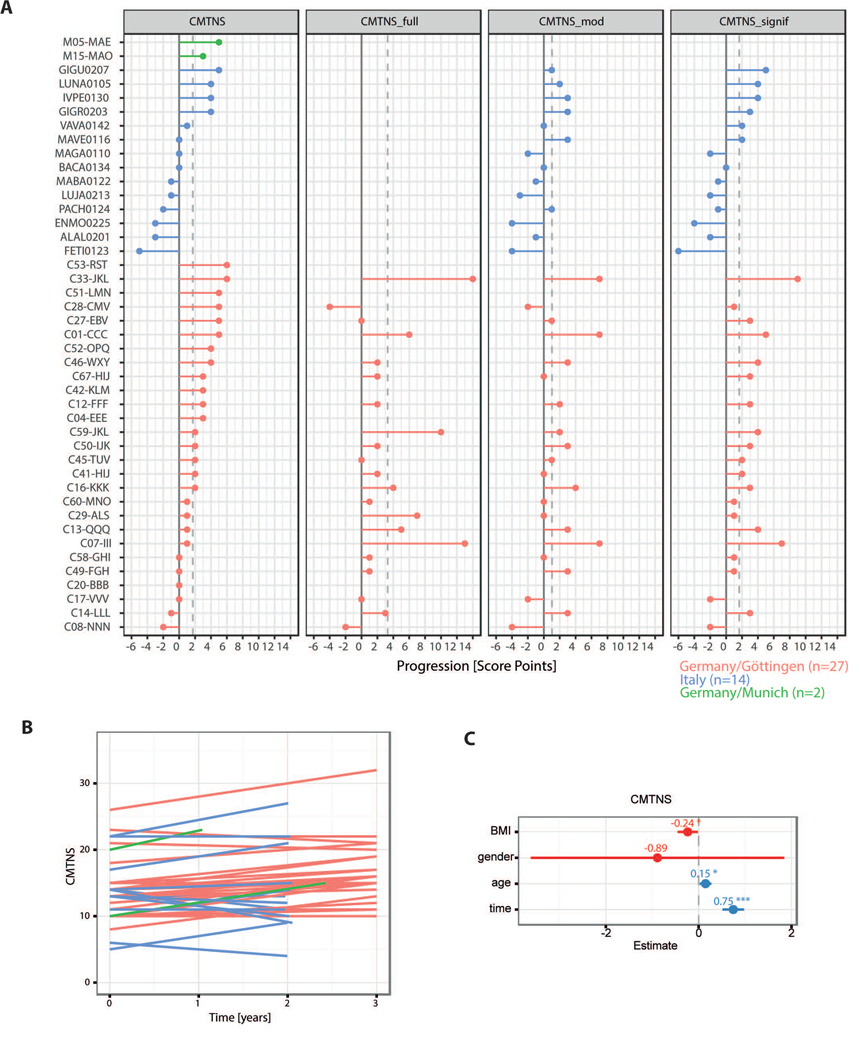
A Progression of CMT measured by the scores CMTNSv1, CMTNS_full, CMTNS_mod, and CMTNS_signif with patients (colored by contributing center) on the y-axis and the score difference on the x axis where positive difference correspond to higher scores at the second examination.
B The change of CMTNS is shown over time. The time between measurements ranges from 2 to 3 years (with one exception of only 1 year time difference). Each line represents one patient.
C Regression coefficients with 95% confidence intervals from the fit of a linear mixed effect model for CMTNS with fixed effects BMI, gender, age, and time and a random effect accounting for the repeated measures in the patients. The factor ‘time’ has a significant influence on the CMTNS with an estimated increase in CMTNS of 0.75 per year.
Figure 4: Cutaneous expression of selected biomarkers changes with disease progression.

A Mixed effects repeated measures regression models were fit per gene to the expression data. The effect of time was assessed controlling for BMI, gender, age, and center effects. Shown are the p values for the time effect (orange: adjusted p value significant) for all genes. B Shown is the progression data underlying the regression models from D displayed as Ct value (gene expression) as a function of time. Each colored line represents one patient and the black lines show the average patient at time 0 progressing by the modeled time effect.
C A predictive random forest model that classifies patients into progressive patients (CMTNS increase) and non-progressive patients (CMTNS does not increase) was trained on the six genes with significant change in expression over time. Data was available for 19 progressive and 11 non-progressive patients. The consensus ROC curve from a 10 times repeated 10-fold cross validation reveals an AUC of 0.74 and the sensitivity/specificity at the youden index (marked with a dot) are estimated to be 63.2% / 100%.
Thus, skin biopsy is a valuable source for the identification of biomarkers in CMT1A (Fig. 2, Tab. 2). Moreover, we identified six genes with changing expression over time that may serve as disease progression biomarkers and could directly be implemented into ongoing clinical trials (Fig. 3).
Discussion
Despite promising results from experimental therapies in animal models, CMT1A remains a disease without known cure. Clinical trials are hampered by the slow CMT1A disease progression and the availability of outcome measures with limited sensitivity to change (30,37,38). Next to improvement of clinical outcome measures, molecular biomarkers, when available, would add powerful tools to assess and track disease progression in clinical trials. Molecular biomarkers may ideally derive from body fluids or minimally invasively sampled tissue. Although it is not known so far whether CMT1A is reflected by alteration of body fluid characteristics which then could be harnessed for biomarker development, skin biopsies have proven powerful tools to study CMT1A (39–41). In a preliminary study we could identify CMT rat derived cutaneous disease severity biomarkers in skin biopsies from a small cohort of 46 patients with CMT1A. By applying a post hoc multiple linear regression model, in this study we were able to show that 47% of the observed variance in disease severity (as measured by the CMTNS) can be predicted by gene expression and age (16). The development of applicable biomarkers of disease severity in CMT1A, however, requires a four step fit-for-purpose approach (see introduction) (32,33). To validate the basic assay performance (fit-for-purpose step II), we initiated a worldwide prospective study and 9 centers in Europe and the US contributing clinical data and skin biopsies from 266 patients with CMT1A. The expression of 16 previously identified potential cutaneous disease severity biomarkers were tested in skin biopsies from the new patient cohort and we confirmed that disease severity is indeed reflected by cutaneous gene expression (Fig. 2). The number of individual genes, however, that significantly correlate with the cumulative CMTNS variants (maximum 7/16 genes) is relatively low compared to correlations of biomarker expression with selected single parameters (e.g. with ‘Strength of legs reached 13/16 hits, Tab. 2). The notion that some items of the outcome measures do in fact reflect the actual disease severity more sensitively than others has been reported previously (24) and could explain that biomarker correlations vary between CMTNS variants and sub-scores. However, cutaneous expression of a cluster of eight genes (CDA, CTSA, GRIA1, ENPP1, ANPEP, FN3KRP, GSTT2 and PPARG, correlates with disease severity (as assessed by the CMTNS) with very high sensitivity (90%, Fig. 2C) confirming that expression analyses is suitable to develop biomarkers (fit-for-purpose step II). A major caveat, however, is the difficulty to improve outcome sensitivity solely on the basis of a rather insensitive anchor as the CMTNS. To overcome this problem, we performed an analysis of change in gene expression over time (fit-for-purpose step III). From 16 tested genes, we found PPARG, GSTT2, CTSA, CDA, ENPP1 and NRG1-I to show a statistically significant increase in expression over time, all of which (except NRG1-I) were identified as a component of a biomarker cluster within the 266 CMT1A patients cohort (Fig. 1B-C, Fig. 4). Independent from the cluster analysis (Fig. 1), the expression of individual genes showed significant correlations with various CMTNS related items (Tab. 2). For example, the progression biomarker NRG1-I (Fig. 4A-B) correlates with the CMTNS was the only gene found to correlate with sensory symptoms (Tab. 2), although this gene was not part of the identified cluster. However, on the basis of the insensitive CMTNS, the potential disease progression biomarkers display a sensitivity of 63.2% (Fig. 4C). Here, the only moderate sensitivity of progression biomarkers towards clinical impairment may directly result from the insensitive CMTNS anchor. The maximum specificity of 100%, in turn, demonstrates that non-progressive patients were easily detectable by biomarker expression in the examined patient cohort. As a consequence, patients which respond to a therapy (and thereby display a halt in disease progression) could be identified more easily with the help of the here reported disease progression biomarkers. The validation of these biomarkers in the disease progression of further CMT1A patients in natural history studies (also by next generation sequencing approaches) may show whether a higher sensitivity can be achieved and may reveal further evidence for the potential practical use of these biomarkers.
Enrichment analyses of the eight clustered genes (Tab. 3) revealed an involvement in metabolism (Reactome pathway), negative regulation of cell growth (Gene Ontology, biological process), vacuolar/lysosomal membrane (Gene Ontology, cellular component) and exopeptidase activity (Gene Ontology, molecular function). This functional annotation may fit to the reported impact of the duplicated disease gene PMP22 on lysosomal alteration upon overexpression in CMT1A (42).
Table 3: Gene enrichment analysis and functional annotation of CDA, CTSA, GRIA1, ENPP1, ANPEP, FN3KRP, GSTT2 and PPARG.
Enriched terms are shown for the databases a) Reactome Pathway, b) Gene Ontology (GO), biological process, c) GO, cellular component and d) GO, molecular function. The maximum 20 significant hits are displayed with term, database identifier, gene set overlap, adjusted p-value, Z-score, combined score and genes involved (only hits with more than one gene).
| Reactome pathway | ||||||
|---|---|---|---|---|---|---|
| Term | Identifier | Overlap | Adjusted P-value | Z-score | Combined Score | Genes |
| Metabolism | R-HSA-1430728 | 5/1908 | 0,01167 | −2,25 | 9,99 | CTSA;CDA;ENPP1;GSTT2;PPARG |
| Metabolism of proteins | R-HSA-392499 | 4/1074 | 0,01167 | −2,14 | 9,54 | CTSA;GRIA1;ANPEP;FN3KRP |
| Post-translational protein modification | R-HSA-597592 | 3/521 | 0,01428 | −2,18 | 9,25 | CTSA;GRIA1;FN3KRP |
| Asparagine N-linked glycosylation | R-HSA-446203 | 2/259 | 0,03554 | −2,08 | 6,95 | CTSA;GRIA1 |
| GO biological process | ||||||
| Term | Identifier | Overlap | Adjusted P-value | Z-score | Combined Score | Genes |
| negative regulation of cell growth | GO:0030308 | 3/150 | 0,00619 | −2,25 | 11,44 | CDA;ENPP1;PPARG |
| negative regulation of growth | GO:0045926 | 3/221 | 0,00984 | −2,31 | 10,68 | CDA;ENPP1;PPARG |
| regulation of cell growth | GO:0001558 | 3/322 | 0,01999 | −2,34 | 9,17 | CDA;ENPP1;PPARG |
| receptor metabolic process | GO:0043112 | 2/71 | 0,02359 | −2,12 | 7,94 | GRIA1;PPARG |
| regulation of fat cell differentiation | GO:0045598 | 2/87 | 0,02832 | −2,32 | 8,26 | ENPP1;PPARG |
| cellular response to peptide hormone stimulus | GO:0071375 | 2/261 | 0,03832 | −2,39 | 7,80 | ENPP1;PPARG |
| cellular response to peptide | GO:1901653 | 2/273 | 0,03832 | −2,38 | 7,76 | ENPP1;PPARG |
| cellular response to insulin stimulus | GO:0032869 | 2/195 | 0,03832 | −2,36 | 7,68 | ENPP1;PPARG |
| response to insulin | GO:0032868 | 2/246 | 0,03832 | −2,33 | 7,60 | ENPP1;PPARG |
| protein maturation | GO:0051604 | 2/222 | 0,03832 | −2,29 | 7,46 | ANPEP;PPARG |
| receptor-mediated endocytosis | GO:0006898 | 2/152 | 0,03832 | −2,27 | 7,41 | GRIA1;ENPP1 |
| protein processing | GO:0016485 | 2/201 | 0,03832 | −2,24 | 7,32 | ANPEP;PPARG |
| endocytosis | GO:0006897 | 2/323 | 0,03832 | −2,24 | 7,30 | GRIA1;ENPP1 |
| cellular response to organonitrogen compound | GO:0071417 | 2/411 | 0,03955 | −2,40 | 7,75 | ENPP1;PPARG |
| cellular response to nitrogen compound | GO:1901699 | 2/438 | 0,03955 | −2,37 | 7,64 | ENPP1;PPARG |
| response to peptide | GO:1901652 | 2/384 | 0,03955 | −2,31 | 7,47 | ENPP1;PPARG |
| response to peptide hormone | GO:0043434 | 2/364 | 0,03955 | −2,31 | 7,47 | ENPP1;PPARG |
| cellular response to hormone stimulus | GO:0032870 | 2/462 | 0,03955 | −2,29 | 7,39 | ENPP1;PPARG |
| negative regulation of phosphate metabolic process | GO:0045936 | 2/458 | 0,03955 | −2,26 | 7,30 | CDA;ENPP1 |
| anion transport | GO:0006820 | 2/443 | 0,03955 | −2,14 | 6,91 | ENPP1;PPARG |
| GO cellular component | ||||||
| Term | Identifier | Overlap | Adjusted P-value | Z-score | Combined Score | Genes |
| vacuolar part | GO:0044437 | 3/285 | 0,00730 | −2,32 | 11,42 | CTSA;ANPEP;ENPP1 |
| lysosomal membrane | GO:0005765 | 2/196 | 0,04628 | −2,26 | 6,93 | ANPEP;ENPP1 |
| vacuolar membrane | GO:0005774 | 2/208 | 0,04628 | −2,25 | 6,93 | ANPEP;ENPP1 |
| GO molecular function | ||||||
| Term | Identifier | Overlap | Adjusted P-value | Z-score | Combined Score | Genes |
| exopeptidase activity | GO:0008238 | 2/111 | 0,03047 | −2,49 | 8,69 | CTSA;ANPEP |
| zinc ion binding | GO:0008270 | 4/1256 | 0,03047 | −2,31 | 8,05 | CDA;ANPEP;ENPP1;PPARG |
Taken together, the validity of the identified biomarkers was tested twice, first as disease severity biomarkers in a cohort including 266 CMT1A patients and 37 healthy controls and, second, as progression markers in an additional longitudinal cohort including 45 patient with CMT1A. We confirmed that gene expression analyses of the skin is suitable for the assessment of the disease severity, and that the cutaneous expression of individual genes is changing over time in patients with CMT1A. We suggest, that the expression of five genes that were part of an identified biomarker cluster and correlated with disease progression over time (CDA, CTSA, ENPP1, GSTT2, PPARG) is a valid set of biomarkers in CMT1A. When implemented and successfully validated in ongoing clinical trials, the here reported biomarkers could markedly accelerate the development of a therapy for CMT1A.
Supplementary Material
Acknowledgement
MWS was or is supported by the German Ministry of Education and Research (BMBF, CMT-BIO, FKZ: 01ES0812, CMT-NET, FKZ: 01GM1511C, CMT-NRG, ERA-NET “ERARE 3”, FKZ: 01GM1605) and by the Association Francaise contre Les Myopathies (AFM, Nr: 15037). MWS holds a DFG Heisenberg Professorship (SE 1944/1-1).
TP is supported by the European Leukodystrophie Society (ELA 2014-020I1 to MWS).
J.H. and PS were supported by Ministry of Health of the Czech Republic grant AZV 16-30206A and DRO 00064203.
JBa and PDJ were supported by the Association Belge contre les Maladies Neuromusculaire (ABMM) - Aide à la Recherche ASBL and the EU FP7/2007-2013 under grant agreement number 2012-305121 (NEUROMICS). JBa is also supported by a Senior Clinical Researcher mandate of the Research Fund - Flanders (FWO).
DP and CMT-TRIAAL were supported by Telethon-UILDM (GUP04002, GUP05007) and AIFA (Italian Medicines Agency, FARM53APAH) grants in Italy
APPENDIX
The CMT-TRIAAL Group (all in Italy)
IRCCS Foundation, C. Besta Neurological Institute, Milan: D.Pareyson, D. Calabrese, C. Marchesi, E. Salsano, L. Nanetti, C. Marelli, V. Scaioli, C. Ciano, M. Rimoldi, G. Lauria, G. Ferrari, E. Rizzetto, F. Camozzi;
Department of Neurology, Ophthalmology and Genetics, University of Genoa, Genoa: A. Schenone, E. Narciso, M. Grandis, M. Monti-Bragadin, L. Nobbio;
Department of Neurological, Neuropsychological, Morphological and Motor Sciences, University of Verona, Verona: G.M. Fabrizi, T. Cavallaro, A. Casano, L. Bertolasi, I. Cabrini, K. Corrà, N. Rizzuto;
Department of Neurological Sciences, Federico II University of Naples, Naples: L. Santoro, F. Manganelli, C. Pisciotta; Department of Neurology, “Salvatore Maugeri” Foundation, IRCCS, Telese Terme: M. Nolano;
Department of Neurosciences, University of Messina, Messina: G. Vita, A. Mazzeo, R. Di Leo, G. Majorana, M. Russo;
Magna Graecia University, Neurology Clinic, and Neuroimaging Research Unit, National Research Council, Catanzaro: A. Quatrone, P. Valentino, R. Nisticò, D. Pirritano, A. Lucisano, M. Canino;
Institute of Neurology, Department of Neurosciences, Sacro Cuore Catholic University, and Don Gnocchi Foundation, Rome: L. Padua, C. Pazzaglia, G. Granata, M. Foschini;
Department of Neurosciences, University of Parma, Parma: F. Gemignani, F. Brindani, F. Vitetta; I. Allegri;
Department of Pharmacological Sciences, School of Pharmacy, University of Milan, Milan: F. Visioli, P. Bogani.
References
- 1.Skre H.Genetic and clinical aspects of Charcot-Marie-Tooth’s disease. Clin Genet [Internet]. 1974. January [cited 2013 Oct 1];6(2):98–118. Available from: http://www.ncbi.nlm.nih.gov/pubmed/4430158 [DOI] [PubMed] [Google Scholar]
- 2.Braathen GJ, Sand JC, Lobato a, Høyer H, Russell MB. Genetic epidemiology of Charcot-Marie-Tooth in the general population. Eur J Neurol Off J Eur Fed Neurol Soc [Internet]. 2011. January [cited 2013 Mar 8];18(1):39–48. Available from: http://www.ncbi.nlm.nih.gov/pubmed/20482598 [DOI] [PubMed] [Google Scholar]
- 3.Timmerman V, Strickland A V, Züchner S. Genetics of Charcot-Marie-Tooth (CMT) Disease within the Frame of the Human Genome Project Success. 2014;13–32. [DOI] [PMC free article] [PubMed] [Google Scholar]
- 4.Lupski JR, De Oca-Luna RM, Slaugenhaupt S, Pentao L, Guzzetta V, Trask BJ, et al. DNA duplication associated with Charcot-Marie-Tooth disease type 1A. Cell [Internet]. 1991;66(2):219–32. Available from: http://www.ncbi.nlm.nih.gov/pubmed/1677316 [DOI] [PubMed] [Google Scholar]
- 5.Raeymaekers P, Timmerman V, Nelis E, De Jonghe P, Hoogendijk JE, Baas F, et al. Duplication in chromosome 17p11.2 in Charcot-Marie-Tooth neuropathy type 1a (CMT 1a). The HMSN Collaborative Research Group. Neuromuscul Disord [Internet]. 1991. January [cited 2013 Oct 1];1(2):93–7. Available from: http://www.ncbi.nlm.nih.gov/pubmed/1822787 [DOI] [PubMed] [Google Scholar]
- 6.Matsunami N, Smith B, Ballard L, Lensch MW, Robertson M, Albertsen H, et al. Peripheral myelin protein-22 gene maps in the duplication in chromosome 17p11.2 associated with Charcot-Marie-Tooth 1A. Nat Genet [Internet]. 1992. June [cited 2014 Feb 12];1(3):176–9. Available from: http://www.ncbi.nlm.nih.gov/pubmed/1303231 [DOI] [PubMed] [Google Scholar]
- 7.Patel PI, Roa BB, Welcher AA, Schoener-Scott R, Trask BJ, Pentao L, et al. The gene for the peripheral myelin protein PMP-22 is a candidate for Charcot-Marie-Tooth disease type 1A. Nat Genet. 1992;1(3):159–65. [DOI] [PubMed] [Google Scholar]
- 8.Timmerman V, Nelis E, Van Hul W, Nieuwenhuijsen BW, Chen KL, Wang S, et al. The peripheral myelin protein gene PMP-22 is contained within the Charcot-Marie-Tooth disease type 1A duplication. Nat Genet [Internet]. 1992. June [cited 2014 Feb 12];1(3):171–5. Available from: http://www.ncbi.nlm.nih.gov/pubmed/1303230 [DOI] [PubMed] [Google Scholar]
- 9.Valentijn LJ, Baas F, Wolterman RA, Hoogendijk JE, van den Bosch NH, Zorn I, et al. Identical point mutations of PMP-22 in Trembler-J mouse and Charcot-Marie-Tooth disease type 1A. Nat Genet [Internet]. 1992. December [cited 2013 Oct 1];2(4):288–91. Available from: http://www.ncbi.nlm.nih.gov/pubmed/1303281 [DOI] [PubMed] [Google Scholar]
- 10.Dyck PJ, Thomas PK. Peripheral Neuropathy, 4th Edition | P. K. Thomas, Peter Dyck; | ISBN 9780721694917 [Internet]. Book. 2005. [cited 2013 Sep 16]. Available from: http://store.elsevier.com/Peripheral-Neuropathy/P_-K_-Thomas/isbn-9780721694917/ [Google Scholar]
- 11.Harding A, Thomas P. The clinical features of hereditary motor and sensory neuropathy types I and II. Brain a J Neurol [Internet]. 1980. [cited 2013 Oct 1];17(2):259–80. Available from: http://www.ncbi.nlm.nih.gov/pubmed/7397478 [DOI] [PubMed] [Google Scholar]
- 12.Yiu EM, Burns J, Ryan MM, Ouvrier RA. Neurophysiologic abnormalities in children with Charcot-Marie-Tooth disease type 1A. J Peripher Nerv Syst [Internet]. 2008. September [cited 2014 Feb 13];13(3):236–41. Available from: http://www.ncbi.nlm.nih.gov/pubmed/18844790 [DOI] [PubMed] [Google Scholar]
- 13.Kaku D, Parry G, Malamut R, Lupski J, Garcia C. Uniform slowing of conduction velocities in Charcot‐Marie‐Tooth polyneuropathy type 1. Neurology [Internet]. 1993. [cited 2013 Oct 1]; Available from: http://www.neurology.org/content/43/12/2664.short [DOI] [PubMed] [Google Scholar]
- 14.Garcia CA, Malamut RE, England JD, Parry GS, Liu P, Lupski JR. Clinical variability in two pairs of identical twins with the Charcot-Marie-Tooth disease type 1A duplication. Neurology [Internet]. 1995. November [cited 2013 Oct 1];45(11):2090–3. Available from: http://www.ncbi.nlm.nih.gov/pubmed/7501164 [DOI] [PubMed] [Google Scholar]
- 15.Reilly MM, Shy ME, Muntoni F, Pareyson D. 168th ENMC International workshop: Outcome measures and clinical trials in Charcot-Marie-Tooth disease (CMT). Neuromuscul Disord [Internet]. 2010;20(12):839–46. Available from: 10.1016/j.nmd.2010.08.001 [DOI] [PubMed] [Google Scholar]
- 16.Fledrich R, Schlotter-Weigel B, Schnizer TJ, Wichert SP, Stassart RM, Zu Hörste GM, et al. A rat model of Charcot-Marie-Tooth disease 1A recapitulates disease variability and supplies biomarkers of axonal loss in patients. Brain A J Neurol [Internet]. 2012;135(Pt 1):72–87. Available from: http://www.ncbi.nlm.nih.gov/pubmed/22189569 [DOI] [PubMed] [Google Scholar]
- 17.Young P, De Jonghe P, Stögbauer F, Butterfass-Bahloul T. Treatment for Charcot-Marie-Tooth disease. Cochrane database Syst Rev [Internet]. 2008. January [cited 2013 Oct 1];(1):CD006052. Available from: http://www.ncbi.nlm.nih.gov/pubmed/18254090 [DOI] [PMC free article] [PubMed] [Google Scholar]
- 18.Burns J, Ouvrier RA, Yiu EM, Joseph PD, Kornberg AJ, Fahey MC, et al. Ascorbic acid for Charcot-Marie-Tooth disease type 1A in children: a randomised, double-blind, placebo-controlled, safety and efficacy trial. Lancet Neurol [Internet]. 2009. June [cited 2013 Oct 1];8(6):537–44. Available from: http://www.ncbi.nlm.nih.gov/pubmed/19427269 [DOI] [PubMed] [Google Scholar]
- 19.Micallef J, Attarian S, Dubourg O, Gonnaud P-M, Hogrel J-Y, Stojkovic T, et al. Effect of ascorbic acid in patients with Charcot-Marie-Tooth disease type 1A: a multicentre, randomised, double-blind, placebo-controlled trial. Lancet Neurol [Internet]. 2009. December [cited 2013 Oct 1];8(12):1103–10. Available from: http://www.ncbi.nlm.nih.gov/pubmed/19818690 [DOI] [PubMed] [Google Scholar]
- 20.Verhamme C, de Haan RJ, Vermeulen M, Baas F, de Visser M, van Schaik IN. Oral high dose ascorbic acid treatment for one year in young CMT1A patients: a randomised, double-blind, placebo-controlled phase II trial. BMC Med [Internet]. 2009. January [cited 2013 Oct 1];7:70. Available from: http://www.pubmedcentral.nih.gov/articlerender.fcgi?artid=2784478&tool=pmcentrez&rendertype=abstract [DOI] [PMC free article] [PubMed] [Google Scholar]
- 21.Pareyson D, Reilly MM, Schenone A, Fabrizi GM, Cavallaro T, Santoro L, et al. Ascorbic acid in Charcot–Marie–Tooth disease type 1A (CMT-TRIAAL and CMT-TRAUK): a double-blind randomised trial. Lancet [Internet]. 2011. April [cited 2013 Mar 8];10(4):320–8. Available from: http://discovery.ucl.ac.uk/1304687/ [DOI] [PMC free article] [PubMed] [Google Scholar]
- 22.de Visser M, Verhamme C. Ascorbic acid for treatment in CMT1A: What’s next? Lancet Neurol [Internet]. 2011;10(4):291–3. Available from: 10.1016/S1474-4422(11)70042-4 [DOI] [PubMed] [Google Scholar]
- 23.Murphy SM, Herrmann DN, McDermott MP, Scherer SS, Shy ME, Reilly MM, et al. Reliability of the CMT neuropathy score (second version) in Charcot-Marie-Tooth disease. J Peripher Nerv Syst. 2011;16(3):191–8. [DOI] [PMC free article] [PubMed] [Google Scholar]
- 24.Mannil M, Solari A, Leha A, Pelayo-Negro AL, Berciano J, Schlotter-Weigel B, et al. Selected items from the Charcot-Marie-Tooth (CMT) Neuropathy Score and secondary clinical outcome measures serve as sensitive clinical markers of disease severity in CMT1A patients. Neuromuscul Disord. 2014;24(11):1003–17. [DOI] [PubMed] [Google Scholar]
- 25.Shy ME, Blake J, Krajewski K, Fuerst DR, Laura M, Hahn a F, et al. Reliability and validity of the CMT neuropathy score as a measure of disability. Neurology [Internet]. 2005. April 12 [cited 2013 Mar 8];66(7):614–615-615. Available from: http://discovery.ucl.ac.uk/157383/ [DOI] [PubMed] [Google Scholar]
- 26.Sadjadi R, Reilly MM, Shy ME, Pareyson D, Laura M, Murphy S, et al. Psychometrics evaluation of Charcot-Marie-Tooth Neuropathy Score (CMTNSv2 ) second version, using Rasch analysis. 2014;196:192–6. [DOI] [PMC free article] [PubMed] [Google Scholar]
- 27.Fledrich R, Stassart RM, Sereda MW. Murine therapeutic models for Charcot-Marie-Tooth (CMT) disease. Br Med Bull [Internet]. 2012. June [cited 2013 Mar 8];102:89–113. Available from: http://www.ncbi.nlm.nih.gov/pubmed/22551516 [DOI] [PubMed] [Google Scholar]
- 28.Willcocks RJ, Rooney WD, Triplett WT, Forbes SC, Lott DJ, Senesac CR, et al. Multicenter Prospective Longitudinal Study of Magnetic Resonance Biomarkers in a Large Duchenne Muscular Dystrophy Cohort. 2016; [DOI] [PMC free article] [PubMed] [Google Scholar]
- 29.Filler AG, Maravilla KR, Tsuruda JS. MR neurography and muscle MR imaging for image diagnosis of disorders affecting the peripheral nerves and musculature. 2004;22:8619. [DOI] [PubMed] [Google Scholar]
- 30.Morrow JM, Sinclair CDJ, Fischmann A, Machado PM, Reilly MM, Yousry TA, et al. MRI biomarker assessment of neuromuscular disease progression : a prospective observational cohort study. Lancet Neurol [Internet]. 2016;15(1):65–77. Available from: 10.1016/S1474-4422(15)00242-2 [DOI] [PMC free article] [PubMed] [Google Scholar]
- 31.Dortch RD, Dethrage LM, Gore JC, Smith SA. Proximal nerve magnetization transfer MRI relates to disability in Charcot-Marie-Tooth diseases. 2014;1545–54. [DOI] [PMC free article] [PubMed] [Google Scholar]
- 32.Gramont A de, Watson S, Ellis LM, Rodón J, Tabernero J, Gramont A de, et al. Pragmatic issues in biomarker evaluation for targeted therapies in cancer. Nat Rev Clin Oncol. 2015;12:197–2012. [DOI] [PubMed] [Google Scholar]
- 33.Lee JW, Devanarayan V, Barrett YC, Weiner R, Allinson J, Fountain S, et al. Fit-for-Purpose Method Development and Validation for Successful Biomarker Measurement. 2006;23(2):312–28. [DOI] [PubMed] [Google Scholar]
- 34.Sereda M, Griffiths I, Pühlhofer a, Stewart H, Rossner MJ, Zimmerman F, et al. A transgenic rat model of Charcot-Marie-Tooth disease. Neuron [Internet]. 1996;16(5):1049–60. Available from: http://www.ncbi.nlm.nih.gov/entrez/query.fcgi?cmd=Retrieve&db=PubMed&dopt=Citation&list_uids=8630243 [DOI] [PubMed] [Google Scholar]
- 35.Kuleshov M V, Jones MR, Rouillard AD, Fernandez NF, Duan Q, Wang Z, et al. Enrichr: a comprehensive gene set enrichment analysis web server 2016 update. Nucleic Acids Res [Internet]. 2016;44(W1):W90–7. Available from: http://www.ncbi.nlm.nih.gov/pubmed/27141961 [DOI] [PMC free article] [PubMed] [Google Scholar]
- 36.Shy ME, Chen L, Swan ER, Taube R, Krajewski KM, Herrmann D, et al. Neuropathy progression in Charcot-Marie-Tooth disease type 1A. Cancer [Internet]. 2008. January 29 [cited 2013 Mar 8];77(7):1356–62. Available from: http://www.ncbi.nlm.nih.gov/pubmed/18227419 [DOI] [PubMed] [Google Scholar]
- 37.Berciano J, Gallardo E, Garcia A, Ramón C, Infante J, Combarros O. Clinical progression in Charcot – Marie-Tooth disease type 1A duplication : clinico-electrophysiological and MRI longitudinal study of a family. J Neurol. 2010;257:1633–41. [DOI] [PubMed] [Google Scholar]
- 38.Piscosquito G, Reilly MM, Schenone A, Fabrizi GM, Cavallaro T, Santoro L, et al. Responsiveness of clinical outcome measures in Charcot À Marie À Tooth disease. 2015;1556–63. [DOI] [PubMed] [Google Scholar]
- 39.Manganelli F, Stancanelli A, Caporaso G, Shy ME. Charcot-Marie-Tooth disease. 2015; [DOI] [PMC free article] [PubMed] [Google Scholar]
- 40.Fledrich R, Schlotter-Weigel B, Schnizer TJ, Wichert SP, Stassart RM, Zu Hörste GM, et al. A rat model of Charcot-Marie-Tooth disease 1A recapitulates disease variability and supplies biomarkers of axonal loss in patients. Brain A J Neurol [Internet]. 2012. January [cited 2013 Mar 8];135(Pt 1):72–87. Available from: http://www.ncbi.nlm.nih.gov/pubmed/22189569 [DOI] [PubMed] [Google Scholar]
- 41.Dacci P, Dina G, Cerri F, Previtali SC, Lopez ID, Lauria G, et al. Foot Pad Skin Biopsy in Mouse Models of Hereditary Neuropathy. Glia [Internet]. 2010. December [cited 2013 Mar 8];58(16):2005–16. Available from: http://www.pubmedcentral.nih.gov/articlerender.fcgi?artid=3034192&tool=pmcentrez&rendertype=abstract [DOI] [PMC free article] [PubMed] [Google Scholar]
- 42.Fortun J, Go JC, Li J, Amici S a, Dunn W a, Notterpek L. Alterations in degradative pathways and protein aggregation in a neuropathy model based on PMP22 overexpression. Neurobiol Dis [Internet]. 2006. April [cited 2013 Mar 8];22(1):153–64. Available from: http://www.ncbi.nlm.nih.gov/pubmed/16326107 [DOI] [PubMed] [Google Scholar]
Associated Data
This section collects any data citations, data availability statements, or supplementary materials included in this article.