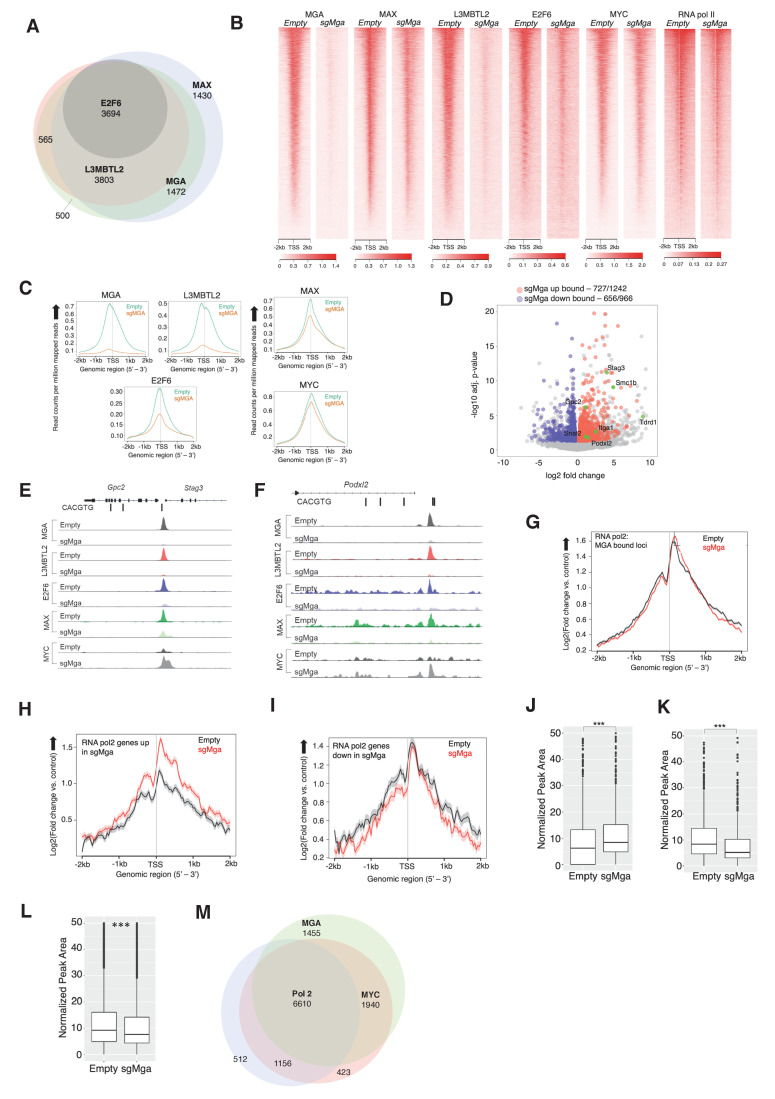
Figure 5. MGA is essential for PRC1.6 genomic binding in tumor cells.
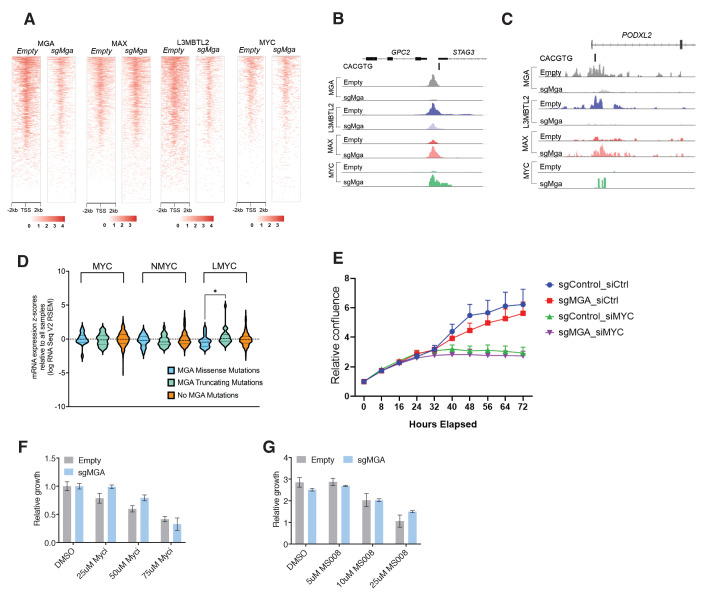
(A) Venn diagram showing overlap between MAX, MGA, E2F6, and L3MBTL2 bound genes in KP cells. (B) Heatmaps showing genome-wide promoter proximal (±2 kb) binding by the indicated transcription factors in control and sgMga KP cells. (C) Meta-plots of occupancy by the indicated transcription factors in Empty and sgMga KP cells. (D) Volcano plot of differentially expressed genes that are directly bound by MGA (red and blue dots indicate bound genes, up and down as indicated; green dots with labels indicate genes functionally implicated in MGA activity). (E, F) representative tracks for MGA, L3MBTL2, E2F6, MAX, and MYC binding at the (E) Stag3/Gpc2 promoter and (F) Podxl2 loci in KP cells and sgMGA KP cells. (G–I) Meta-plots of RNA pol2 enrichment at the TSS ±2 kb in sgMGA KP cells (red lines) vs KP cells with wild-type MGA (black lines) at (G) MGA-bound genes, (H) genes upregulated, and (I) genes downregulated in sgMGA KP cells. (J–L) Box plots of RNA pol2 peak areas at TSS ±2 kb in KP vs sgMGA KP cells for (J) loci upregulated (p-value=2.1e-07), (K) loci downregulated (p=1.6e-06). The p-values in (J–L) calculated by Welch two sample t-test. (L) Box plots of RNA pol2 peak areas at MYC-bound loci in KP and sgMGA-KP cells (p=8.7e-05). (M) Venn diagram depicting the numbers of genes bound by RNA polymerase II, MYC, and MGA and their extent of overlap in KP cells.


