

Abstract
Tight control of cell division is essential for survival of most organisms. For prokaryotes, the regulatory mechanisms involved in the control of cell division are mostly unknown. We show that the small non-coding sRNA StsR has an important role in controlling cell division and growth in the alpha-proteobacterium Rhodobacter sphaeroides. StsR is strongly induced by stress conditions and in stationary phase by the alternative sigma factors RpoHI/HII, thereby providing a regulatory link between cell division and environmental cues. Compared to the wild type, a mutant lacking StsR enters stationary phase later and more rapidly resumes growth after stationary phase. A target of StsR is UpsM, the most abundant sRNA in the exponential phase. It is derived from partial transcriptional termination within the 5′ untranslated region of the mRNA of the division and cell wall (dcw) gene cluster. StsR binds to UpsM as well as to the 5′ UTR of the dcw mRNA and the sRNA-sRNA and sRNA-mRNA interactions lead to a conformational change that triggers cleavage by the ribonuclease RNase E, affecting the level of dcw mRNAs and limiting growth. These findings provide interesting new insights into the role of sRNA-mediated regulation of cell division during the adaptation to environmental changes.
Graphical Abstract
Graphical Abstract.
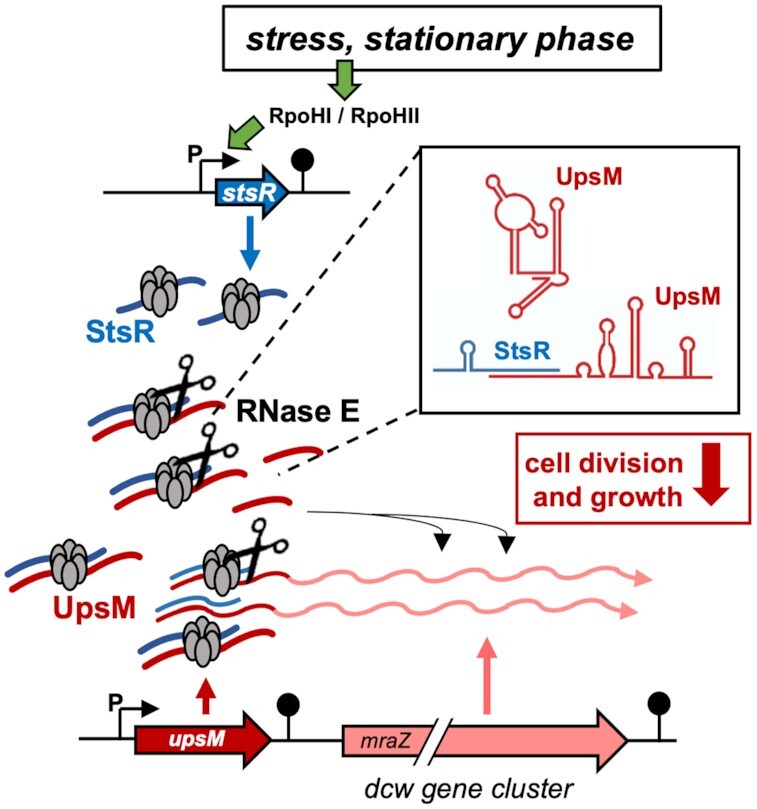
Under different stress conditions or in stationary phase, high amounts of the sRNA StsR are produced from a RpoHI/HII promoter. StsR base pairs to the sRNA UpsM and to the 5′UTR of the dcw mRNA by the RNA chaperone Hfq. The RNA-RNA interaction leads to a structural change that promotes cleavage of the StsR targets by RNase E. Cleavage of the dcw 5′UTR reduces dcw transcript levels, while the UpsM 3′processing product can interact with dcw mRNA in trans and reduce the expression.
INTRODUCTION
No matter where bacteria live, they face various stresses and have to adjust their growth behaviour accordingly. Limitation of growth under stress conditions and resumption of growth at the proper time after stress can be essential for survival. This requires control of cell division that is responsive to changes in the environment. Bacterial division and cell wall synthesis (dcw) gene clusters are highly conserved among both Gram-negative and Gram-positive bacteria (1,2). They contain multiple open reading frames that are frequently overlapping, suggesting expression as a single transcriptional unit (3). How dcw gene expression is regulated in response to changing environmental conditions remains unknown.
Bacteria are capable of rapid adjustment of transcription in response to changes in environmental conditions. Coordination and fine-tuning of gene expression also occur at the post-transcriptional level through small regulatory RNAs (sRNAs), which usually act via base-pairing with the targeted mRNAs. sRNAs can activate or suppress translation of target mRNAs, and/or affect mRNA degradation (4,5). Occasionally, pairing results in coupled degradation of sRNA and target mRNA (6). Since trans-encoded sRNAs are only partially complementary to their target mRNAs, most of them require the RNA chaperone Hfq for hybrid formation and consequently for their regulatory function (7,8) and can modulate expression of multiple targets (1,2).
Vice versa, many RNAs (designated traps, sponges, decoys, competing endogenous RNAs) can bind sRNAs and thereby affect their level and/or availability for sRNA-based action on their cognate target mRNAs (9,10). In Escherichia coli the chbBC mRNA traps the sRNA ChiX and thereby allows translation of the chiP mRNA and production of ChiP (chitoporin) (11). A sponge function was also identified for a ncRNA fragment derived from pre-tRNA (12). SroC, generated as a stable sRNA product of the gltIJKL mRNA (encoding an amino acid transporter) sponges the sRNA GcvB and thereby de-represses GcvB regulated targets (13). Two Hfq-bound sRNAs from E. coli prophages act as anti-sRNAs by trapping the seed regions of the sRNAs GcvB and FnrS (14). Thus, tight control of sRNA synthesis, coupled degradation of sRNA and target mRNA and trapping of sRNAs provide the cell with the means to rapidly switch on and off gene expression according to growth conditions.
In the facultative phototrophic alpha-proteobacterium Rhodobacter sphaeroides, RNAseq-based studies have identified the sRNAs RSs0827 (15, now named StsR) and UpsM (previously RSs0682) (16,17) (Figure 1). RSs0827 is strongly induced in response to iron limitation and shows the highest increased level among all detected RNAs in late stationary phase (15,18,19). In contrast, UpsM is the most abundant sRNA in exponential phase, representing about 60% of all Hfq bound sRNAs (20). Upon several stress conditions, the endoribonuclease RNase E cleaves UpsM in an Hfq- and target-dependent manner at an AU-rich sequence (17,21). The stable 130 nt 3′ processing product is conserved in sequence and structure among Rhodobacteraceae (16). Deletion of upsM from the chromosome or strong overexpression of UpsM from a plasmid is not possible; moderate overexpression affects the levels of a limited number of mRNAs (17). The sRNA gene is located in the 5′ UTR of mraZ, the first gene of the dcw gene cluster and transcription of mraZ depends on the UpsM promoter (Figure 1). The dcw gene cluster consists of 20 genes including the mur genes and ddlA for murein synthesis, fts genes for the formation of the cell division ring and genes for cell division proteins. An unusual element in the topology of the dcw gene cluster in Rhodobacteraceae is the presence of a terminator in the 5′ UTR of mraZ. This terminator results in the generation of the unprocessed form of UpsM (206 nt), but also allows low-level read-through, resulting in the transcription of mraZ and the following dcw genes (17). Prior to this study, the target responsible for processing of UpsM was unknown.
Figure 1.
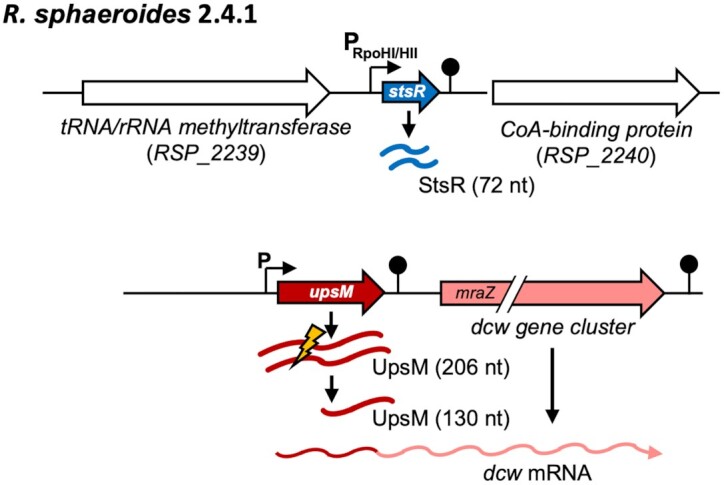
Genomic context of the stsR and upsM genes. StsR (72 nt) is preceded by a RpoHI/RpoHII promoter (black arrow) and a transcriptional terminator structure is located at the 3′end (hairpin structure). The sRNA UpsM (206 nt) is located upstream of mraZ, the first gene of the dcw (division and cell wall) gene cluster, and transcription of mraZ depends on the UpsM promoter (black arrow). The terminator of UpsM is shown as hairpin structure and the processing site is marked by a flash.
By combining in vitro and in vivo experiments, we show that RSs0827 base pairs in the 5′region of UpsM and triggers the RNase E-dependent processing of UpsM. We therefore renamed RSs0827 as StsR (sRNA targeting sRNA). Cells lacking StsR showed increased expression of mraZ, as well as an extended exponential phase and much faster outgrowth from stationary phase than the wild type (WT). Our study was focussed on understanding the causal mechanism behind this phenotype. This led to the uncovering of a regulatory pathway that explains how the cell responds to environmental conditions and controls the expression of genes essential for cell division and growth. The components of this regulatory pathway are the sigma factors RpoHI and RpoHII, the RNA chaperone Hfq, the endoribonuclease RNase E and sRNAs. Most importantly, we have unravelled a novel mechanism regulating cell division genes based on RNA-RNA interaction. Firstly, sRNA-mRNA interaction leads to RNase E-mediated cleavage of the 5′ UTR of the dcw genes and regulates their expression. Secondly, sRNA–sRNA interaction promotes RNase E-mediated cleavage of UpsM sRNA, releasing the conserved 3′ processing product that affects dcw gene expression in trans. The consequence of this sRNA–sRNA interaction is very different from the known sponging effects.
MATERIALS AND METHODS
Bacterial strains and growth conditions
Bacterial strains and plasmids used in this study are listed in Supplementary Table S1. For cultivation of R. sphaeroides strains at 32°C, malate minimal-salt medium was used (15). For microaerobic growth conditions, having a dissolved oxygen concentration of about 25–30 μM within the exponential phase, Erlenmeyer flasks containing 80% culture by volume were shaken at 140 rpm. For aerobic conditions, bacteria were cultivated in sealed flat glass bottles filled to the top with medium and were aerated with a dissolved oxygen concentration of about 160–180 μM. When necessary, kanamycin (25 μg ml−1), tetracycline (2 μg ml−1) or spectinomycin (10 μg ml−1) was added to liquid and solid growth media (1.6% agar). Photooxidative stress conditions were generated as described earlier (22). Other stress conditions were generated by a final concentration of 250 mM NaCl, 10 μM CdCl2, 100 μM FeCl2, 100 μM ZnSO4, 300 μM tBOOH (tertiary butyl hydroperoxide), 1 mM H2O2 and 250 μM paraquat (O2−) or by a temperature shift to 42°C under microaerobic conditions.
To culture E. coli strains, cells were continuously shaken at 180 rpm in Luria–Bertani medium at 37°C or grown on solid growth medium containing 1.6% (w/v) agar. When necessary, kanamycin (25 μg ml−1), ampicillin (20 μg ml−1) or tetracycline (20 μg ml−1) was added to the media. For the induction of StsR overexpression, 1 mM IPTG was added at an OD600 of 0.5.
Plasmid construction
For construction of an overexpression plasmid of StsR under control of its own promoter (pBBR_stsR), a 233 bp fragment was amplified via PCR using oligonucleotides StsR_f and StsR_r (Supplementary Table S2). For an overexpression plasmid of the seed-region under control of its own promoter (pBBR_seed), a 53 bp fragment was amplified by PCR using oligonucleotides StsRseedregion_f and StsRseedregion_r (Supplementary Table S2). For construction of a StsR mutant (pBBR_stsRmut), site-directed mutagenesis was used. Primers StsRmut_f and StsRmut_r (Supplementary Table S2) were used to change the nucleotides of the seed region of StsR from ACUU to UGAA by inverse PCR. pBBR_stsR was used as template. All corresponding fragments were sub-cloned into the BamHI and EcoRI sites of the pJET1.2 cloning vector (ThermoFisher Scientific, Waltham, MA, USA) and, after digestion with the corresponding restriction enzymes, ligated into the expression vector pBBR1-MCS2 (23).
For construction of an overexpression plasmid that includes the 3′ 130 nucleotides of UpsM (pBBR_UpsM(130nt)), a 155 bp fragment was amplified via PCR using oligonucleotides UpsM130nt_f and UpsM130nt_r (Supplementary Table S2). The corresponding fragment was sub-cloned into the BamHI and EcoRI sites of the pJET1.2 cloning vector (ThermoFisher Scientific, Waltham, MA, USA) and, after digestion with the corresponding restriction enzymes, ligated into the expression vector pBBR1-MCS2 (23).
To measure the effect of UpsM on the expression of mraY and ftsW, these genes were translationally fused to the reporter gene mVenus in the plasmids pP_Ptrp_mraY::mVenus and pP_Ptrp_ftsW::mVenus. In these plasmids, the fragments from mraY and ftsW began with the native RBS and extended through the predicted interaction sites with UpsM (IntaRNA), but did not contain the whole genes. Located upstream of the fusion construct was the Ptrp promoter, which provided constitutive transcription activity in exponential as well as in stationary phase.
The plasmids were transferred to R. sphaeroides 2.4.1 by diparental conjugation with E. coli S17-1.
Construction of a stsR deletion mutant
R. sphaeroides strain 2.4.1ΔstsR was generated by transferring the suicide plasmid pPHU2.4.1ΔstsR:Sp into R. sphaeroides 2.4.1, and screening for insertion of the spectinomycin resistance cassette into the chromosome by homologous recombination. Briefly, a 613 bp upstream and a 578 bp downstream fragment of the IGR0827 locus were amplified using oligonucleotides StsRKOup_f/StsRKOup_r and StsRKOdown_f/StsRKOdown_r, respectively (Supplementary Table S2). The corresponding fragments were cloned into the KpnI/EcoRI and EcoRI/HindIII sites of suicide plasmid pPHU281 (24) generating the plasmid pPHU2.4.1ΔstsR. A 2.0 kb EcoRI fragment containing the spectinomycin cassette from pHP45Ω (25) was inserted into the EcoRI site of pPHU2.4.1ΔstsR to generate pPHU2.4.1ΔstsR::Sp. This plasmid was transferred to R. sphaeroides by diparental conjugation with E. coli S17-1 and recombinants were selected on malate minimal medium agar plates containing spectinomycin (25 μg ml−1).
Construction for inducible expression of cell division genes
Control of mraZ expression was ensured through the use of a suicide plasmid, pK18mobII (26), which confers kanamycin resistance. We modified this plasmid by inserting the lacI gene (Primers GOI-X-mraZ-f GACTTCTAGGATCCGCCGCTTTCGTTTCC and GOI-K-mraZ-r GACTGGTACCTTGAGCGTGCCCGCAAAGG). Three additional modifications of the suicide plasmid included a LacI repressed (IPTG inducible) promoter, a 438 nt DNA fragment coding for the 5′ end of mraZ (507 nt) to ensure homologous recombination between the chromosome and the suicide plasmid, and a dual transcription terminator cassette to terminate native transcript read-through from the UpsM promoter. Upon homologous recombination, the terminator cassette was inserted into the chromosome at 438 bp downstream of the mraZ translation start, creating a truncated copy of mraZ. The terminator was followed by the IPTG-inducible promoter which controls the expression of a full copy of mraZ as well as all downstream co-transcribed genes in the division and cell wall (dcw) gene cluster.
RNA isolation
R. sphaeroides cultures were grown to OD660nm 0.5 under the different growth conditions (see bacterial strains and growth conditions). Cells were harvested by centrifugation at 10,000 rpm for 10 min at 4°C. For northern blot analysis, RNA was isolated using hot phenol (27,28) and precipitated with 1/10x vol. 3 M sodium acetate pH 4.5 and 2.5× 96 vol.% ethanol. For quantitative real-time RT-PCR, 1 ng per μl of DNA-free spike-in RNA was added to the cell pellet and RNA was isolated by peqGOLD TriFast™ (peqLab).
Northern blot analysis
Ten percent polyacrylamide/urea gels were used to fractionate RNA as described earlier (16). Oligodeoxynucleotides used for end-labelling with [γ-32P]-ATP (Hartmann Analytic; SRP-301) by T4 polynucleotide kinase (Fermentas; #EK0031) are listed in Table S2. A low stringency Church buffer was used for hybridization. Membranes were washed in 5 × SCC buffer + 0.1% SDS. After exposure on phosphoimaging screens (Bio-Rad), images were analysed by the 1D-Quantity One software (Bio-Rad).
Gel retardation assay
RNA was transcribed in vitro using T7 Polymerase (NEB) and PCR products as template, which contained the T7 promoter region at the 5′ ends. Gel retardation assays were carried out with 150 fmol radio-labelled transcript and various molar ratios of non-labelled transcripts in a final volume of 7.5 μl. RNAs were denatured separately for 1 min at 95°C and renatured by cooling for 2 min on ice and for 5 min at 32°C. After these de- and renaturing steps, the radio-labelled and non-labelled RNAs were mixed and 2 μl of 5× structure buffer (25 mM MgCl2 and 300 mM KCl) were added for a final volume of 10 μl. For complex formation of the RNAs, the samples were incubated together for 30 min at 32°C. Afterwards, the reactions were mixed with 3 μl of loading dye (50% glycerol, 0.5× TBE, 0.2% bromophenol blue) and loaded onto a 6% non-denaturing polyacrylamide gel containing 0.5× TBE. Gels were pre-run at 100 V for 60 min at 4°C before loading. Electrophoresis was performed at 4°C by applying 200 V for 4 h. Gels were dried, exposed on phosphoimaging screens (Bio-Rad) and analysed using the 1D-Quantity One software (Bio-Rad).
RNA structure probing
To analyse the structure of UpsM and its conformational changes upon binding to StsR, RNA structure probing was performed. The in vitro synthesized, unlabelled RNAs were denatured separately at 90°C for 1 min and cooled on ice for 5 min. The RNAs were then mixed at various molar ratios (see Figure 4 for details) and were allowed to renature for 20 min at room temperature in AN buffer (50 mM sodium cacodylate, pH 7.5, 5 mM MgCl2, 60 mM KCl). At this point, 1 μl yeast tRNA (2 mg/ml, Ambion) was added. For the RNA modification, either 1 unit of T1 RNase (ThermoFisher Scientific) or 0.1–1.0 unit of S1 RNase (ThermoFisher Scientific) was added and the mixture was incubated for 5 min at room temperature. The reaction was terminated by precipitation with 10 x vol. of 96% ethanol and 1/10× vol. of 3 M sodium acetate pH 5.2. Enzymatic modifications of specific nucleotides by T1 or S1 RNase were determined by primer extension analysis. For this, the modified RNAs were hybridized with 3 pmol of 5′ radio-labelled oligonucleotides in a total volume of 6 μl. These oligonucleotides are listed in Supplementary Table S2. For hybridization the modified RNA and the radio-labelled oligonucleotides were heated to 90°C for 2 min and then cooled stepwise (70°C for 5 min, 50°C for 10 min, 37°C for 5 min and 20°C for 10 min). The reverse transcription reaction was performed in 1 × SuperScript® III RTase reaction buffer supplemented with 170 units of SuperScript® III RTase (Invitrogen), 20 units RNaseOUT (Invitrogen) and 1 mM of each dNTP in a total volume of 20 μl for 50 min at 42°C and 60 min at 55°C. The reaction was terminated by precipitation with 10× vol. 96% ethanol and 1/10 x vol. sodium acetate pH 5.2 overnight at –20°C. After precipitation samples were treated with 6 μl DNA-free RNase A (0.2 mg/ml, Invitrogen) for 20 min at 37°C and with 3 μl proteinase K (1 mg/ml, Invitrogen) for 15 min at 55°C. The reactions were stopped by adding formamide-urea-mix (6 M urea, 80% deionized formamide, 1 × TBE, 0.1% (w/v) bromophenol blue, and 0.1% (w/v) xylene cyanol). Reaction products were separated in TBE-buffered 10% polyacrylamide gels containing 7 M urea. Signals were visualized using a phosphoimaging-screen (Bio-Rad) and analysed using Quantity One software (BioRad).
Figure 4.

UpsM processing depends on a direct interaction with the sRNA StsR. (A) 28 nt fragment containing the seed region of the StsR-UpsM duplex structure as predicted by the web tool Mfold (34). The location of the exchanged 4 nt of the seed region of StsR is shown in blue and of UpsM is shown in red. (B) Northern blot analysis revealing altered StsR transcript and UpsM processing levels in the knockout mutant (ΔstsR), in a strain overexpressing StsR (pBBR_stsR), in a strain overexpressing 28 nt comprising the seed region at the 5′end of StsR (pBBR_seed), and in a strain overexpressing StsR with a 4 nt exchange in the seed region before and 90 min after 1O2 stress (StsRmut). For comparison, the WT (lanes 1 and 2) and StsR mutant with an empty vector control (ΔstsR pBBR (EVC), lanes 5 and 6) were included. (C) Left panels, gel retardation assay of 206 (full length), 76 or 30 nt (from the 5′end) UpsM with StsR. Right panels, gel retardation assay with wild type UpsM (UpsM(206 nt)) and mutated StsR (StsRmut; exchange of 4 nt in the seed region), mutated UpsM (UpsM(206 nt)mut; exchange of 4 nt in the seed region) and wild type StsR and mutated UpsM (UpsM(206 nt)mut) and mutated StsR (StsRmut). Various 32P-labelled UpsM in vitro transcripts [15 fmol] were incubated together with increasing concentrations of unlabelled StsR or StsRmut. Unlabelled sRNA StsR or StsRmut were added at an equimolar concentration (15 nM), at 10-fold (150 nM) or 100-fold (1.5 μM) molar excess to the 32P-labelled UpsM fragment. As a negative control, 15 nM of 32P-labelled UpsM fragment was incubated with the sRNA PcrZ (1.5 μM) at 100-fold excess. For positive and negative controls 15 nM of 32P-labelled UpsM was incubated with 100-fold (1.5 μM) excess StsR or StsRmut (+) and without StsR or StsRmut (−), respectively. For quantification of the retarded and non-retarded bands see Supplementary Figure S7.
Growth behaviour, survival assay and microscopy
To monitor growth behaviour, all R. sphaeroides strains were cultivated in microaerobic growth conditions (see bacterial strains and growth conditions) in three independent experiments. The optical density (OD) was measured every 1.5 h at 660 nm (Specord 50, Analytic Jena AG). 48 h and 72 h after inoculation part of the cultures were diluted in fresh medium to OD660 0.1 and outgrowth was monitored, while the remaining culture was further incubated for monitoring the OD.
For survival assays, R. sphaeroides cultures of three independent experiments were plated at different time points in a dilution of 10−5 or 10−6 on solid growth media (1.6% agar) without IPTG (Figure 2B) or with 0.5 mM IPTG for inducible expression of dcw genes (Figure 7B) and incubated for 48 h at 32°C.
Figure 2.

StsR strongly affects the growth behaviour of R. sphaeroides. (A) Growth behaviour of R. sphaeroides WT cells (black) and the stsR deletion mutant (grey) was monitored over 95 h. The plotted optical densities at 660 nm (OD660) represent the mean of at least three independent experiments and the standard deviation (only visible at few time points). 48 and 72 h after inoculation, part of the cultures was diluted into fresh medium and outgrowth was monitored, while the remaining culture was further incubated for monitoring the OD. (B) Plating assay of R. sphaeroides WT (black) and stsR deletion mutant (grey). At the indicated time points, cells of the cultures used for (A) were diluted and plated on agar, and the resulting colonies were counted. The plating assay represents the mean of three independent experiments and the error bars indicate the standard deviation. (C) Cell size distribution and microscopic images of cells from R. sphaeroides 2.4.1 (WT) and the stsR deletion mutant in exponential growth phase, after 48 h and during outgrowth (3 h after transferring the cells to fresh medium). The length of ≥200 individual cells from each strain was measured and the distribution of cell length was plotted against frequency.
Figure 7.

Inducible expression of cell division genes and growth behaviour of R. sphaeroides. (A) Scheme of the suicide plasmid construct for inducible expression of cell division genes from the chromosome. The suicide plasmid backbone (broken line) carries a dual transcription terminator cassette to terminate native transcript read-through from the UpsM promoter. The construct also carries a LacI repressed (IPTG inducible) promoter which controls the expression of a full copy of mraZ as well as all downstream co-transcribed genes in the dcw gene cluster. (B) Growth behaviour of WT strain carrying the inducible transcription construct (ITC) grown with 0 mM IPTG (black) or 0.5 mM IPTG (grey) was monitored over 48 h. The plotted optical densities at 660 nm (OD660) represent the mean of at least three independent experiments. The standard deviation is too small to be visible in the plot. 48 h after inoculation, part of the cultures was diluted into fresh medium and outgrowth was monitored. (C) Survival (determined by colony forming units) of R. sphaeroides WT and StsR mutant strains each with the inducible transcription construct (ITC) grown with 0 mM IPTG (black) or 0.5 mM IPTG (grey) was measured using samples taken from cultures at different time points of growth (exponential growth phase, 48 h and the following outgrowth (OG) 90 min, OG 3h). The plating assay represents the mean of three independent experiments and the error bars indicate the standard deviation.
For microscopy, 3 μl of R. sphaeroides culture were spotted on an agarose pad (LM media solidified by 1% (w/v) agarose). DIC images were recorded using a Leica DMI 6000 B inverse microscope and further processed using ImageJ and Adobe Illustrator CS6. The cell lengths of at least 200 individual cells were measured and the frequency of cell sizes was plotted.
Fluorescence measurement
The mVenus fluorescence (excitation wavelength 515 nm; emission wavelength 548 nm) was measured with a Tecan Infinty M Nano and normalized against the optical density at 660 nm (calculation: fluorescence/OD660). All fluorescence measurements show means and standard deviations of biological triplicates, each performed in technical duplicates. All strains were grown under the conditions described above.
RESULTS
The highly conserved sRNA StsR impacts cell division in R. sphaeroides
StsR was identified in R. sphaeroides as a ∼72 nt sRNA that is induced upon iron limitation (15,18). It showed the strongest induction of all RNAs in late stationary phase in a microarray analysis, which was dependent on the alternative sigma factor RpoHI (19). The sRNA is transcribed from an intergenic region (Figure 1). The genomic context of this sRNA gene is highly conserved in the family of Rhodobacteraceae (Supplementary Figure S1).
A mutant lacking StsR showed a remarkable phenotype (Figure 2A): while WT cells stopped growing after about 20 h at a maximal OD of 1.6, the strain lacking StsR continued growing for an extended period of time and reached a maximal OD of ∼2.5. When cultures were diluted into fresh medium after 48 or 72 h of incubation, the mutant resumed growth much faster than the WT. Thus, the mutant strain showed improved growth over the WT, especially during outgrowth from stationary phase. Since cell size may vary in different growth stages and OD measurements may not correlate well to cell number, we also determined survival rates. Plating assays confirmed that the StsR mutant indeed survives stationary phase much better than the WT (Figure 2B). The difference in the survival rates was even more pronounced than the difference measured at the OD. This suggests that compared to the WT cells that contribute to optical density but frequently are not capable of resuming growth following stationary phase, cells of the StsR mutant are more effective at resuming growth.
Microscopic inspection revealed a similar cell size of WT and mutant cells in exponential phase (Figure 2C). In stationary phase the cell size was considerably reduced in both strains, in agreement with earlier observations for different bacterial species (29). In outgrowth after 48 h of stationary phase, 180 min after transferring cells to fresh medium, the cell size distribution for the WT was still small, similar to that observed in stationary phase, while the cell size of the mutant was clearly increased. When the mutant strain was complemented by a plasmid carrying the stsR gene under control of its own promoter, WT-like growth behaviour was restored (Supplementary Figure S2A). A strain overexpressing StsR showed slower growth and reached a lower maximal OD compared to the WT (Supplementary Figure S2B).
sRNA StsR is RpoHI/RpoHII-dependently induced by several stress factors, which also promote processing of UpsM
While all stsR genes of the family of Rhodobacteraceae (for selected members see Supplementary Figure S1) contain a transcriptional terminator structure at the 3′ end, the upstream region matches the known RpoHI/RpoHII promoter consensus sequence -35 (TTG) and -10 (CCATGT) only in R. sphaeroides, R. capsulatus and Jannaschia sp. strain CCS1. We tested the expression of StsR in R. sphaeroides strains lacking one or both sigma factors (Figure 3A and B). Northern blot analysis revealed that RpoHII is required for strong induction upon singlet oxygen (1O2) stress (Figure 3A lanes 7–9), while RpoHI is required for a heat-dependent induction of StsR (Figure 3B, lanes 4–6). This agrees with earlier observations that RpoHI and RpoHII regulons are somewhat overlapping, with RpoHI having a major role in the heat shock response and RpoHII being more important for the oxidative stress response in R. sphaeroides (30–32). StsR was not detected when both sigma factors were lacking.
Figure 3.

The sRNA StsR is RpoHI/RpoHII-dependently induced by several stress factors which also promote processing of UpsM. (A–C) Detection of StsR and UpsM by northern blot in R. sphaeroides WT and in strains lacking RpoHI, RpoHII or both after 0, 30 and 60 min of 1O2 stress (A) or 0, 30 and 60 min of heat stress (42°C) (B). Signals of 5S rRNA serve as loading control. (C, left panel) Induction of the sRNA StsR under various stress conditions combined with the processing pattern of the sRNA UpsM monitored by northern blot analysis of total RNA isolated from R. sphaeroides. Stress-inducing reagents were added as described in the Methods section and samples were taken at 0 min (no stress) and 90 min after the addition. Signals of 5S rRNA serve as loading control. (C, right panel) The relative signal intensity from the northern blot (signal intensity from no stress equals 100%) was plotted for StsR and the processed UpsM (130nt). The plotted values represent the mean of at least three independent experiments and the standard deviation is indicated.
R. sphaeroides genes under control of RpoHI/II promoters often respond to multiple stresses (31–33). We therefore tested the expression of StsR under various stress conditions in the WT. In addition to heat and 1O2 stress, StsR is strongly induced by NaCl, CdCl2, ZnSO4 and hydrogen peroxide (H2O2), while super oxide or the organic tert-butyl hydroperoxide (tBOOH) only slightly trigger StsR expression (Figure 3C). tBOOH represents organic hydroperoxides that are generated in the cell upon singlet oxygen exposure.
Interestingly, the northern analysis shown in Figure 3C reveals a clear pattern: in each tested stress condition (with the exception of heat) where StsR is abundant, the cleaved form of UpsM (130 nt) was also abundant. Figure 3A provides further evidence for this observation, while Figure 3B indicates that the abundance patterns of StsR and UpsM (130 nt) under heat stress is indeed an exception. Not only the processed form of UpsM (130 nt), but also the unprocessed form (206 nt) was less abundant under heat stress, suggesting weaker transcription or higher turnover of UpsM. A decreased level of UpsM at 42°C was reported previously (17,21).
Fusing the promoter of UpsM to the gene for mVenus (in a transcriptional fusion construct that omitted UpsM) revealed that the activity of the UpsM promoter increases about two-fold with high aeration and in the presence of CdCl2, but shows no increase in activity upon heat stress (Supplementary Figure S3). This is consistent with the data in Figure 3A and B which reveals that the expression of UpsM is independent of the heat stress-activated transcription factors RpoHI and RpoHII. Furthermore, the half-life of UpsM (206 nt) decreased from about 8.5 min at 32°C to about 6.5 min at 42°C contributing to the low UpsM levels under heat stress.
sRNA StsR regulates processing of sRNA UpsM by direct interaction
UpsM is the most abundant orphan sRNA of R. sphaeroides in exponential phase and was originally identified as an sRNA processed upon 1O2 stress (16). Terminator exonuclease-treated RNA from 1O2-stressed cultures confirmed a processing step from UpsM (206 nt) to UpsM (130 nt), which requires the RNA chaperone Hfq, the endoribonuclease RNase E and the RpoHI/II sigma factors (17). A global mapping of RNase E cleavage sites to the transcriptome of R. sphaeroides (21) revealed cleavage sites in close proximity within UpsM (206 nt) giving rise to two abundant processing products of UpsM (both around 130 nt) that come from its 3′ part (16).
A Mfold search (34) using sequences of full-length UpsM and StsR as inputs suggested base pairing between StsR position 16–34 and position 0–23 of UpsM with a predicted energy value of −18.7 kcal/mol (Figure 4A). To elucidate a putative interaction of the two sRNAs in vivo, we monitored the pattern of UpsM accumulation in a strain lacking or overexpressing StsR upon 1O2 stress in R. sphaeroides. The strong decrease in the level of processed UpsM (130 nt) in the stsR deletion mutant (Figure 4B, lanes 3 and 4) supports a role for StsR in processing UpsM and an in vivo interaction between the sRNAs. Furthermore, when stsR was present on a multi copy plasmid under control of its own promoter, strong UpsM processing occurred even under non-stress conditions (Figure 4B, lanes 7 and 8). Strong processing of UpsM was also stimulated when only 28 nt comprising the seed region at the 5′end of StsR were overexpressed (lanes 9 and 10, see Figure 4A for sequence), demonstrating that this region was responsible for the effect.
Furthermore, when the complete StsR sequence containing four altered nucleotides within the seed region was overexpressed (pBBR_stsRmut, Figure 4B lanes 11 and 12), UpsM processing was almost completely lacking. When additional plasmids with other mutations at four different locations within the predicted interaction region and slightly downstream were introduced into R. sphaeroides, the resulting transcripts were unfortunately not detected or only at very low amounts, possibly due to instability. Therefore, the effect of these other mutations could not be studied in vivo. Taken together the in vivo results support the idea that StsR and UpsM interact, and that this interaction strongly promotes the processing of UpsM.
Also of interest is the temporal pattern of accumulation of the sRNAs, which lends more support for the dependence of UpsM processing on StsR. 1O2 stress and northern analysis of the sRNA at 5–30 minutes intervals revealed that the pattern of accumulation of processed UpsM (130 nt) followed that of StsR with a time shift of approximately 30 minutes (Supplementary Figure S4). It is important to note that the level of full-length UpsM (206 nt) is the outcome of two opposing forces: the increase in transcription rate in response to 1O2 stress on one hand, and the increased turn-over by StsR on the other. Quantification of full-length UpsM from the northern analysis (Figure 4B) is provided in Supplementary Figure S5.
To further test for direct interaction between StsR and UpsM in vivo, we also expressed these sRNAs in E. coli and monitored UpsM processing in the presence and absence of StsR. Northern blot analysis confirmed that in E. coli cells harbouring plasmid-borne copies of stsR and upsM, accumulation of StsR and decrease of the primary upsM transcript was detected during 60 minutes of IPTG-induction of StsR expression. While some UpsM processing occurred in the absence of StsR, the presence of StsR greatly increased the processing rate. Already after 5 min of StsR expression, the full-length UpsM began to decrease while the UpsM processing fragments were visible (Supplementary Figure S6A). This result confirmed that UpsM processing depends on StsR and strongly supports a direct interaction between StsR and UpsM in vivo.
Our assumption that both sRNAs directly interact was further supported by an in vitro interaction study using an RNA:RNA gel retardation assay (Figure 4C). Addition of the non-labelled StsR to the 206 nt radio-labelled UpsM resulted in retardation of UpsM in a native gel, while addition of the unrelated sRNA PcrZ (lane 4) (35), here used as a negative control, did not (Figure 4C, upper left panel). We also tested shorter versions of UpsM comprising of only the 76 nt or 30 nt from the 5′end. These 76 nt or 30 nt were sufficient for complex formation with StsR (Figure 4C, middle and lower left panels).
When StsR was mutated (StsRmut*, Figure 4C, upper right panel), retardation of the 206 nt UpsM was much weaker, even with higher amounts of StsRmut*. We also mutated 4 nt of the UpsM sequence (as shown in Figure 4A). This mutated 206 nt UpsM version (UpsM(216 nt)mut*) was less effective at interacting with StsR (Figure 4C, right middle panel). A quantification of the retarded bands is provided in Supplementary Figure S7. Lastly, since the mutations introduced in StsRmut* and UpsM(216 nt)mut* were complementary, we also tested their interaction in a gel retardation assay (Figure 4C, lower right panel). Here, retardation was again strong, comparable to that observed using the native sequences (Supplementary Figure S7). These experiments strongly support interaction of UpsM and StsR as predicted by IntaRNA (Figure 4A).
We also performed an in vitro degradation assay with radio-labelled UpsM to monitor the StsR-dependent processing of UpsM by RNase E (Supplementary Figure S6B and C). For the formation of the UpsM-StsR complex, radio-labelled UpsM was incubated with non-labelled StsR in a molar ratio of 1:5. Purified RNase E (the purified protein contained only the catalytic amino-terminal domain of RNase E) was added to activate the processing. The 206 nt UpsM substrate was rapidly processed, generating the 130 nt processing product in the presence of StsR and RNase E. After three minutes, 90% of the 206 nt UpsM substrate was processed. In contrast, UpsM was only weakly processed in the absence of StsR (Supplementary Figure S6B, C). This demonstrates that the in vitro processing of UpsM by RNase E is strongly enhanced by base pairing to StsR.
A previous study found that UpsM processing was dependent upon Hfq (17), and we have confirmed this result (Supplementary Figure S8A). Furthermore, our data demonstrates that Hfq also strongly impacts the amount of StsR (Supplementary Figure S8A). Co-immunoprecipitation with flag-tagged Hfq revealed direct interaction between StsR and Hfq (Supplementary Figure S8B, lane 7).
Altogether these results demonstrate that StsR not only interacts with UpsM, but also promotes the RNase E-dependent cleavage of UpsM in vitro and in vivo.
Base pairing of StsR to UpsM promotes changes of UpsM structure that make the RNase E site accessible
Mfold predicted base pairing between position 16–34 of StsR and position 0–23 of UpsM (Figure 4A). RNase E cleavage was previously found to occur downstream of this region, mainly at nucleotide position 78 of UpsM (21). In the UpsM structure predicted by Mfold (www.unafold.org/mfold/applications), nucleotide position 78 is located within a double-stranded region of UpsM. The double strand is formed from nucleotides at positions 5–15 and positions 72–82 of UpsM. Thus, position 78 may not be accessible for RNase E, a single strand-specific endoribonuclease (Figure 5A). The StsR interacting site is larger, covering nucleotides at positions 1–22 within UpsM. This situation suggested that StsR competes with the RNase E cleavage region for the StsR binding site. In such a scenario, binding between StsR and UpsM would make the RNase E cleavage sites accessible.
Figure 5.

Base pairing of StsR to UpsM promotes changes of UpsM structure. (A and C) RNA secondary structure model of the sRNA UpsM (A) and UpsM bound to StsR (C) predicted by Mfold and adjusted to the structure probing results. The binding site of StsR to UpsM is indicated by lines and the RNase E (scissors) cleavage site is marked in yellow. Nucleotides modified by the T1 RNase are highlighted in red, by the S1 RNase in blue and in purple when a G is simultaneously mapped by S1 and T1. (B) Enzymatic probing of in vitro transcribed UpsM, UpsM + StsR RNA (in a molar ratio of 1:5, lanes 6–8 and in molar ratio of 1:10, lanes 9–11) with T1 RNase and S1 RNase. Specific RNase modifications were identified by primer extension analysis, separated in an 8% denaturing polyacrylamide gel and visualized by phosphoimaging.
To test this assumption, the UpsM in vitro transcript was subjected to structural probing based on the degradation analysis by the single strand-specific RNases S1 and T1 in the presence and absence of StsR (Figure 5B). A hybrid structure involving both sRNAs was suggested by RNA Co-fold (http://rna.tbi.univie.ac.at/cgi-bin/RNAWebSuite/RNAfold.cgi), shown in Figure 4C. Notably, the UpsM-StsR hybrid structure predicts considerably less base pairing around the RNase E cleavage site than the UpsM structure alone. Positions subjected to cleavage by RNases S1 and T1 are indicated in Figure 5A-C. The S1 nuclease (lane 3–5) cuts any single-stranded regions, while the T1 RNase (lane 1) cuts at single-stranded G residues. Lanes 6–8 and 9–11 reveal processing of UpsM by S1 in the presence of StsR. A 5-fold molar excess of StsR over UpsM did not greatly change the degradation pattern for UpsM. However, a 10-fold molar excess resulted in additional bands indicating processing of extended single-stranded regions (Figure 5B). The high-GC content of UpsM prevented generation of a DNA sequence, despite repeating the experiment with a variety of primers. Nevertheless, identification of the processing sites was possible by using the G residue-specific T1 RNase. Positions processed by T1 reveal the G residues and are indicated by red colour in Figure 5A-C, or purple when S1 processing occurred at the same position.
Analysis of the S1 nuclease pattern of UpsM alone (lanes 2–5) and of UpsM together with a 10-fold molar excess of StsR (lanes 9–11) revealed additional bands around positions 77, 79, 80, 81, 82, 83 and 84 which appeared only in the presence of StsR. These additional bands reflect the accessible positions caused by an opening of the previously double-stranded UpsM region, and thus allow for the detection of single- versus double-stranded regions in the presence and absence of StsR (Figure 5C). These positions are marked with blue circles (purple when a G is simultaneously mapped by S1 and T1) in Figure 5. Supplementary Figure S9 shows two more gels from independent experiments to confirm that the observed structural changes in UpsM in the region of RNase E cleavage were reproducible. Altogether, these results strongly support our hypothesis that pairing of StsR to UpsM makes the RNase E cleavage site accessible.
StsR enhances complete degradation of UpsM in late stationary phase and affects the amount of read-through transcripts
In a microarray study addressing growth phase-dependent gene expression in R. sphaeroides, the stsR gene showed the highest increase in expression in late stationary phase of all genes (19). This strong enrichment is also detectable in RNAseq data from exponential and stationary phase WT cultures (19) (Supplementary Figure S10). While StsR is slightly expressed in exponential phase, reflected by roughly 40 reads, it strongly accumulates in the stationary phase (∼6000 reads). UpsM however, is strongly enriched in exponential phase (∼6000 reads).
To test a putative influence of StsR on UpsM expression in stationary phase, we monitored UpsM expression over 48 hours of growth in the presence or absence of StsR. RNA was extracted at three different time-points of bacterial growth (ranging from early exponential to late stationary phase) and subjected to northern blot analysis. As expected, StsR levels in WT cells strongly increased at 48 h, representing stationary phase (Figure 6A). High levels of UpsM sRNA in WT cells are present in exponential phase and are decreased after 24 h. After 48 h UpsM was hardly detectable. However, in the StsR mutant, UpsM showed strong signals up to 48 h. These results clearly show the importance of StsR for the degradation of UpsM.
Figure 6.

Growth phase-dependent expression of StsR, UpsM and mraZ. (A) Patterns of sRNA StsR and sRNA UpsM over an extended time period (exponential growth phase, 24 h, and 48 h) of growth in the WT and ΔstsR mutant strain as shown by northern blot analysis of total RNA isolated from R. sphaeroides. Signals of 5S rRNA serve as loading control. (B) Expression changes of upsM, of the read-through of the UpsM terminator, and of mraZ were monitored in a stsR deletion strain in comparison to the WT by quantitative real-time RT-PCR. Cells for expression analysis were harvested at exponential phase (white bars), after 24 h of growth (grey bars) and after 48 h of growth (black bars). The expression changes of UpsM, of the read-through of the UpsM terminator, and of mraZ genes were normalized to sinI RNA, an external spike-in RNA of known sequence and quantity. The log2fold difference between the mutant versus wild type shows the mean of biological triplicates, each performed in technical duplicates. Error bars indicate the standard deviation
Since the terminator of UpsM allows read through for transcription of mraZ, the first gene of the dcw gene cluster (17), we wondered whether StsR influenced the expression of mraZ. Indeed, in a strain lacking StsR, not only UpsM levels, but also the level of read-through transcripts harbouring parts of UpsM and mraZ as well as mraZ-only levels were increased (Figure 6B). This result was obtained by quantitative real-time RT-PCR using primer sets according to the scheme shown in Figure 6B. The results demonstrate that StsR not only promotes cleavage of UpsM but also reduces the level of transcripts extending into the dcw gene cluster (Figure 6B). Furthermore, to confirm that StsR-dependent cleavage occurs in both UpsM and the 5′ UTR of the read through mRNA, we performed quantitative real-time RT-PCR for a fragment spanning from the UpsM 5′ part (just upstream of the cleavage site) into mraZ. RNA was isolated from the WT and the StsR mutant strain under non-stress and a stress condition (90 min of 1O2). As shown in Supplementary Figure S11, the amount of the read-through transcript decreases in the WT upon stress (compare lanes 1 and 2), while this is not the case in absence of StsR (lanes 3 and 4).
We also performed real-time RT-PCR for other selected genes of the dcw gene cluster. Supplementary Figure S11 displays the ratio of mRNA levels in the StsR mutant compared to the WT. In each case, a lack of StsR leads to increased mRNA levels for the tested dcw genes, particularly during outgrowth from stationary phase.
Although we could observe a clear effect of StsR on the level of read through transcripts for the cell division genes, as well as a clear growth phenotype, it was unknown whether a causal relationship existed between these observations. We therefore introduced an IPTG-inducible promoter between the terminator of UpsM and the mraZ gene in the chromosome of the WT strain (Figure 7A). Although induction of this promoter by IPTG did not significantly change growth behaviour (Figure 7B), it did increase survival rates (determined by colony forming units) from cultures at stationary phase (48 h) in both the WT and StsR mutant (Figure 7C). We speculate that the lack of an effect on OD is likely because IPTG-induced transcription differs to native transcription with respect to activity and timing. Nonetheless, improved survival rates upon IPTG induced transcription support the idea that higher levels of dcw transcript enhance survival. Since the insertion of the IPTG-inducible promoter excludes the StsR binding site from the 5′ UTR of the dcw mRNA, we expected that StsR should have a significantly reduced impact on survival. This is indeed the case.
Figure 7 shows that the absence of StsR improves survival by approximately 1.5-fold when the IPTG-inducible promoter controls the dcw transcript levels. This is a strong contrast to the ∼30-fold increase in survival in the absence of StsR (Figure 2B) where the dcw transcript levels depended upon the native promoter. Altogether, this data shows that most of the growth limiting effect by StsR is via promoting cleavage of the 5′ UTR of the dcw mRNA and consequently by decreasing the level of dcw mRNA.
sRNA UpsM affects expression of dcw genes in trans by interaction with the ftsW and mraY mRNA
The results presented above demonstrate that StsR regulates expression of the dcw genes by affecting the read through transcript, i.e. the transcripts that are not terminated at the 3′end of UpsM. A previous study also reported changes in the transcriptome by UpsM overexpression in trans (17). The microarray analysis applied in that study did not show significant effects on dcw transcript levels. However, an IntaRNA search using UpsM (206 nt) and the dcw mRNA suggested interactions between UpsM and mraY and ftsW mRNA (Figure 8A) and we therefore analysed this putative interaction in more detail.
Figure 8.

sRNA UpsM affects expression of dcw genes in trans by interaction with the ftsW and mraY mRNA. (A) UpsM (130 nt)-ftsW and UpsM (130nt)-mraY duplex structures as predicted by the web tool IntaRNA and binding assays of UpsM (130nt) with ftsW and mraY mRNA. Gel retardation assays were performed with 15 nM 32P-labeled UpsM (130nt) incubated with increasing concentrations of unlabelled ftsW or mraY. Unlabelled ftsW or mraY were added in an equimolar concentration (15 nM), at 10-fold (150 nM) or 100-fold (1.5 μM) molar excess to the labelled UpsM fragment. As a negative control 15 nM of 32P-labelled UpsM fragment was incubated with the sRNA PcrZ (1.5 μM) at 100-fold excess. For positive and negative control 15 nM of 32P-labelled UpsM (130 nt) was incubated with 100-fold (1.5 μM) ftsW or mraY (+) and without ftsW or mraY (−). For quantification of retarded and non-retarded bands see Supplementary Figures S12 and S13. (B) mVenus fluorescence measurements of WT and ΔstsR with pP_Ptrp_ftsW::mVenus or pP_Ptrp_mraY::mVenus in exponential growth phase or after 48 h under microaerobic conditions. The coding regions of ftsW and mraY (plus their native ribosome binding sites) were cloned between a constitutive promoter and the mVenus reporter gene. (C) The expression changes of the mRNAs ftsW, mraY, ftsZ, envA and of UpsM (130nt) were monitored in the WT strain with or without a plasmid which overexpresses the 3′ 130 nt of UpsM (pBBR_UpsM (130 nt)) by quantitative real-time RT-PCR. Cells for expression analysis were harvested at the exponential phase. The genes were normalized to sinI RNA, an external spike-in RNA of known sequence and quantity. Shown are results from three independent experiments, each performed in technical duplicates (mean values and standard deviations are indicated).
The IntaRNA predicted interaction site within UpsM was located within the 130 nt product, near the 3′ end of UpsM, and interacts with the mRNAs of mraY and ftsW, at sites near the middle of each mRNA. Interaction between UpsM (130 nt) and these target regions was supported by gel retardation assays (Figure 8A). The 5′ 76 nt of UpsM did not result in retardation of the mraY or ftsW transcripts (Supplementary Figures S13 and S14). Base pair exchanges in the predicted interaction regions of ftsW or mraY resulted in weaker interaction with UpsM in vitro (Supplementary Figures S13 and S14). While wild type transcripts of ftsW and mraY shifted 90% and 70% of UpsM, respectively, the mutant version shifted only 30% and 35%. Thus, our results show that the processed form of UpsM is capable of interacting with the mRNA of the dcw genes mraY and ftsW and that the base pairs predicted by IntaRNA are indeed involved in this interaction.
We wondered whether the expression of mraY and ftsW are affected by StsR. To test for an effect of StsR on the expression of mraY and ftsW, the coding regions of these genes (plus their native ribosome binding sites) were cloned between a constitutive promoter and the mVenus reporter gene. Fluorescence was comparable between the WT and mutant during the exponential phase, but became 2- and 3-fold higher in the mutant during stationary phase (Figure 8B). This result reveals the repressive effect of StsR on mraY and ftsW expression, consistent with a scenario where StsR triggers the processing of UpsM which then interacts with the mRNA of mraY and ftsW to repress their expression via an unknown mechanism.
We also overexpressed the 130 nt UpsM processing product in the WT and monitored ftsW and mraZ mRNA levels by real-time RT-PCR. The construct applied in this study resulted in stronger overexpression of UpsM than the construct applied in the study by Weber et al. (17). As shown in Figure 8C overexpression of UpsM (130 nt) reduced the levels of ftsW (log2-fold change: -2.3) and mraY (log2-fold change: –3.6) mRNAs, while the levels of ftsZ and envA mRNAs showed little change. Thus, in vitro and in vivo data together provide evidence for a second, weaker pathway whereby StsR indirectly decreases dcw transcript levels via the processed form of UpsM.
Regulation of the dcw genes is potentially complicated by the presence of a previously identified but uncharacterized ORF (17), which partially overlaps upsM (Supplementary Figure S15A). To see if StsR affects expression of the ORF, we created a plasmid with a translational fusion between the ORF and the gene for mVenus (Supplementary Figure S15B). Analysis of this construct in the WT and the StsR mutant revealed only a slight difference in fluorescence levels, indicating that the expression of this small gene was not greatly affected by StsR. Additionally, to see whether ORF expression could influence downstream expression, we designed a construct which included the strong 16S promoter and an artificial RBS followed either by an ATG or CTG, respectively. Downstream of the ORF in this construct are the first 21 codons of mraZ followed by the gene for mVenus with its own artificial RBS (Supplementary Figure S15C). In this transcriptional fusion, transcriptional read-through of the ORF controls the transcription of the gene for mVenus. Comparing a version with the intact open reading frame and a version which has the ATG changed to CTG reveals that the translation of the ORF did not greatly affect (<1.5-fold) the expression of downstream mVenus (Supplementary Figure S15C).
DISCUSSION
Cell division is an essential process for the survival of bacterial populations. Here, we reveal a novel regulatory pathway in R. sphaeroides that controls expression of genes essential for cell division. The components of this pathway are as follows (Figure 9): (i) UpsM is strongly expressed during active growth and a low-level read through of the upsM gene ensures expression of the dcw genes. (ii) The stsR gene exhibits strong expression upon stress or entry into stationary phase due to RpoHI/HII dependent transcription. (iii) The sRNA StsR directly base-pairs with the sRNA UpsM as well as with the UpsM-dcw co-transcript and thereby triggers their processing by RNase E. (iv) Processing of the UpsM-dcw co-transcript leads to a decrease in its abundance. (v) The processed UpsM base-pairs with the dcw transcript and thereby represses expression of two dcw genes, mraY and ftsW.
Figure 9.

Model for growth phase and stress-dependent regulation of cell division by the sRNA StsR. High amounts of UpsM are produced in the exponential phase from a strong UpsM promoter and by termination at the indicated terminator structure (pin). Partial read-through generates transcripts encoding the Dcw proteins. Under stress conditions or in stationary phase, high amounts of the sRNA StsR are produced from a RpoHI/HII promoter. StsR base pairs to sRNA UpsM and to the 5′ UTR of the dcw mRNA. The RNA-RNA interaction leads to a structural change that promotes cleavage of the StsR targets by RNase E. Cleavage of the dcw 5′ UTR reduces dcw transcript levels, while the UpsM 3′ processing product can interact with dcw mRNA in trans and reduce their expression.
Our results show that the regulation by which StsR limits growth depends upon two mechanisms. The major mechanism is through base pairing between StsR and the dcw 5′ UTR that leads to a structural change of the RNA and promotes cleavage by RNase E. We have shown that this effect limits growth by decreasing the abundance of the dcw transcript. The StsR-dependent cleavage by RNase E has another important consequence, since this cleavage not only impacts the transcript abundance of the essential dcw genes but also that of the highly abundant sRNA UpsM. Such an example of sRNA-sRNA interaction leading to processing and production of an active regulatory sRNA is another important novel finding from this study. The high amounts of the active form of UpsM (130 nt) generated by RNase E cleavage are then involved in a second, minor mechanism that targets the mRNA of mraY and ftsW. This minor mechanism represents a classical sRNA mode of regulation. Our data strongly indicate that StsR does not base pair to the 5′region of these targets, as described for the majority of bacterial trans-acting sRNAs, but to the middle of the coding region. This was also shown for several other sRNAs (36–40), which affect the stability of their targets. The exact mechanisms by which StsR affects levels of ftsW and mraY remain to be determined.
Relevant to this pathway are the titration effects that go along with base-pairing and protein-RNA interactions. For example, the stsR gene exhibits the highest increase in expression in late stationary phase of all R. sphaeroides genes (19). The effect of this strong up-regulation is a correspondingly strong reduction in UpsM levels in mid- and late stationary phase. Since R. sphaeroides UpsM binds 61% of all Hfq hexamers in exponential phase (20), this sRNA limits the available Hfq pool under non-stress conditions. Previously, it was shown that Hfq is a limiting factor for sRNA regulation, since competition for Hfq can contribute to interconnections between different sRNAs (41–43). Although Hfq is very abundant (in E. coli up to 10 000 Hfq hexamers per cell), sRNAs such as OxyS reach similar levels (4 500 molecules per cell) when induced by oxidative stress (44). Thus, stress conditions limit the available Hfq pool and affect the access of sRNAs to Hfq. In this way, overexpression of a single sRNA can result in decreased levels of other sRNAs. A hierarchy of sRNAs competing for Hfq was postulated (42,43). Our present study reveals that the Hfq-binding sRNAs StsR and UpsM are both highly abundant. A major difference between them is that StsR accumulates in late stationary phase while UpsM accumulates in the exponential phase. This implies that the release of Hfq by the decrease in UpsM may be balanced against Hfq-StsR binding in the stationary phase.
Upon entry into stationary phase or under conditions of nutrient deprivation, bacteria exhibit global changes in gene expression that result, for instance, in altered virulence or increased tolerance to stresses (45). To adapt to stresses encountered in stationary phase, E. coli and many other Gram-negative bacteria utilize the stationary phase sigma factor RpoS which controls up to 10% of all genes (46–48). Multiple Hfq-dependent sRNAs (ArcZ, DsrA, RprA) positively regulate expression of RpoS (49–52). However, alpha-proteobacteria lack an obvious homolog of RpoS and our knowledge on how gene expression is coordinated upon entry into stationary phase is limited (53). This study fills this knowledge gap by revealing the mechanisms of StsR regulation and demonstrates how cell division can be regulated according to environmental cues.
Our data demonstrate that StsR binds to and promotes processing of the mraZ 5′ UTR, thereby down-regulating cell division in the stationary phase. This link between growth rate control and sRNA-mediated stress signals may have broad implications for other organisms that lack a RpoS homolog. One possibility is that StsR, which is dependent upon transcription activation by RpoHI and RpoHII, serves a similar function in R. sphaeroides as RpoS in E. coli. However, this model of StsR regulation might not be extendable to all the alpha-proteobacteria. Three important features of StsR regulation that appear to be consistently found in members of the Rhodobacteraceae are the long 5′ UTR of mraZ, strong terminator structures within this 5′ UTR and no additional transcriptional start in front of mraZ (17). There may be other important features of StsR regulation. For example, a moderate over-expression of UpsM was shown to affect levels of a limited number of mRNAs not related to the dcw gene cluster (17). Therefore, it is likely that StsR mediated processing of UpsM affects additional physiological processes, which await further characterization.
In E. coli the prophage derived sRNA, DicF, was shown to affect cell division by targeting the ftsZ mRNA that is required for the formation of the division ring. The ftsZ gene is part of the dcw gene cluster in Gram-negative bacteria. In contrast to the results presented here (a) the DicF-associated growth inhibition is not solely due to its action on ftsZ mRNA, and (b) regulation by DicF is based on classical sRNA-mRNA interaction (54). Our study reveals that unlike E. coli, which does not harbour a long 5′ UTR of the dcw gene cluster, expression of the R. sphaeroides dcw genes is affected by interaction of StsR with the dcw 5′ UTR and on cleavage of this target by RNase E.
Our data reveal that lack of StsR significantly increases growth, via delayed entry into stationary phase and quicker outgrowth. Such a clear advantage shown by a mutant strain lacking a sRNA over the WT is surprising and implies that bacterial populations in nature encounter conditions where the limitation of growth is advantageous. So far, we were not able to define such conditions in the laboratory. However, this may not be surprising considering that we are using a strain that has been cultured in the lab for decades. It is conceivable that in aquatic, natural habitats of Rhodobacteraceae, abounding with competitors and viruses as predators, a limitation of growth may be beneficial under certain conditions. Especially under stressful conditions, it may be disadvantageous to resume growth too quickly (55). Among various E. coli isolates, the number of genomic copies of the growth limiting prophage derived sRNA DicF increases with pathogenicity (54), suggesting that limitation of growth improves survival under certain circumstances, e.g. during infection.
Collectively, this study presents evidence for a novel interaction between two sRNAs and widens our knowledge about the interplay between sigma factors, Hfq, sRNAs, mRNAs and RNases, and their role in controlling cell division in response to external stresses (see graphical abstract). Altogether, our data support the hypothesis that in addition to the conventional sRNA → mRNA or mRNA → sRNA regulation, an additional sRNA → sRNA pathway exists. Although only a marginal number of ncRNA-ncRNA interactions are known to date for both prokaryotes and eukaryotes, we believe that more such interactions will be identified in the future, especially if more attention is given to this possibility.
DATA AVAILABILITY
All data not shown in the manuscript are available as Supplementary data online.
Supplementary Material
ACKNOWLEDGEMENTS
We thank Kerstin Haberzettl and Andrea Weisert for excellent technical support, Tim Rick for valuable help with protein purification, and John Ziebuhr for generously supporting the structural probing.
Author contributions: J.G.: data curation, formal analysis, investigation, validation, methodology, editing draft. B.R.: conceptualization, data curation, formal analysis, investigation, validation, supervision, methodology, writing original draft and editing. K.E.: data curation, formal analysis, investigation, validation, supervision, methodology. D.S.: data curation, formal analysis, investigation, validation, methodology. J.K.: investigation, methodology, editing draft. R.M.: investigation, methodology, editing draft. M.M.: conceptualization, data curation, supervision, editing draft. G.K.: conceptualization, data curation, formal analysis, supervision, funding acquisition, project administration, writing original draft, review and editing.
Notes
Present address: Daniel Scheller, Biology of Microorganisms, Ruhr University Bochum, Universitätsstr. 150, D-44780, Germany.
Contributor Information
Julian Grützner, Institute of Microbiology and Molecular Biology, University of Giessen, Heinrich-Buff-Ring 26-32, D-35392 Giessen, Germany.
Bernhard Remes, Institute of Microbiology and Molecular Biology, University of Giessen, Heinrich-Buff-Ring 26-32, D-35392 Giessen, Germany.
Katrin M H Eisenhardt, Institute of Microbiology and Molecular Biology, University of Giessen, Heinrich-Buff-Ring 26-32, D-35392 Giessen, Germany.
Daniel Scheller, Institute of Microbiology and Molecular Biology, University of Giessen, Heinrich-Buff-Ring 26-32, D-35392 Giessen, Germany.
Jonas Kretz, Institute of Microbiology and Molecular Biology, University of Giessen, Heinrich-Buff-Ring 26-32, D-35392 Giessen, Germany.
Ramakanth Madhugiri, Institute of Medical Virology, University of Giessen, Schubertstr. 81, D-35392 Giessen, Germany.
Matthew McIntosh, Institute of Microbiology and Molecular Biology, University of Giessen, Heinrich-Buff-Ring 26-32, D-35392 Giessen, Germany.
Gabriele Klug, Institute of Microbiology and Molecular Biology, University of Giessen, Heinrich-Buff-Ring 26-32, D-35392 Giessen, Germany.
SUPPLEMENTARY DATA
Supplementary Data are available at NAR Online.
FUNDING
Deutsche Forschungsgemeinschaft [Kl563/20, GRK 1384 ‘Enzymes and multi-enzyme complexes acting on nucleic acids’, and GRK 2355 ‘Regulatory networks in the mRNA life cycle: from coding to noncoding RNA’]. Funding for open access charge: Deutsche Forschungsgemeinschaft.
Conflict of interest statement. None declared.
REFERENCES
- 1. Pucci M., Thanassi J., Discotto L., Kessler R., Dougherty T.. Identification and characterization of cell wall-cell division gene clusters in pathogenic Gram-positive cocci. J. Bacteriol. 1997; 179:5632–5635. [DOI] [PMC free article] [PubMed] [Google Scholar]
- 2. Hara H., Yasuda S., Horiuchi K., Park J.T.. A promoter for the first nine genes of the Escherichia coli mra cluster of cell division and cell envelope biosynthesis genes, including ftsI and ftsW. J. Bacteriol. 1997; 179:5802–5811. [DOI] [PMC free article] [PubMed] [Google Scholar]
- 3. Snyder L.A., Shafer W.M., Saunders N.J.. Divergence and transcriptional analysis of the division cell wall (dcw) gene cluster in Neisseria spp. Mol. Microbiol. 2003; 47:431–442. [DOI] [PubMed] [Google Scholar]
- 4. Papenfort K., Vogel J.. Small RNA functions in carbon metabolism and virulence of enteric pathogens. Front. Cell. Infect. Microbiol. 2014; 4:91. [DOI] [PMC free article] [PubMed] [Google Scholar]
- 5. Gottesman S., Storz G.. Bacterial small RNA regulators: versatile roles and rapidly evolving variations. Cold Spring Harb. Perspect. Biol. 2011; 3:a003798. [DOI] [PMC free article] [PubMed] [Google Scholar]
- 6. Massé E., Escorcia F.E., Gottesman S.. Coupled degradation of a small regulatory RNA and its mRNA targets in Escherichia coli. Genes Dev. 2003; 17:2374–2383. [DOI] [PMC free article] [PubMed] [Google Scholar]
- 7. Vogel J., Luisi B.F.. Hfq and its constellation of RNA. Nat. Rev. Microbiol. 2011; 9:578–589. [DOI] [PMC free article] [PubMed] [Google Scholar]
- 8. Valentin-Hansen P., Eriksen M., Udesen C.. The bacterial Sm-like protein Hfq: a key player in RNA transactions. Mol. Microbiol. 2004; 51:1525–1533. [DOI] [PubMed] [Google Scholar]
- 9. Vogel J. An RNA trap helps bacteria get the most out of chitosugars. Mol. Microbiol. 2009; 73:737–741. [DOI] [PubMed] [Google Scholar]
- 10. Mandin P., Gottesman S.. Regulating the regulator: an RNA decoy acts as an OFF switch for the regulation of an sRNA. Genes Dev. 2009; 23:1981–1985. [DOI] [PMC free article] [PubMed] [Google Scholar]
- 11. Overgaard M., Johansen J., Moller-Jensen J., Valentin-Hansen P.. Switching off small RNA regulation with trap-mRNA. Mol. Microbiol. 2009; 73:790–800. [DOI] [PubMed] [Google Scholar]
- 12. Lalaouna D., Carrier C.M., Semsey S., Brouard J.S., Wang J., Wade J.T., Masse E.. A 3′ external transcribed spacer in a tRNA transcript acts as a sponge for small RNAs to prevent transcriptional noise. Mol. Cell. 2015; 58:393–405. [DOI] [PubMed] [Google Scholar]
- 13. Miyakoshi M., Chao Y., Vogel J.. Cross talk between ABC transporter mRNAs via a target mRNA-derived sponge of the GcvB small RNA. EMBO J. 2015; 34:1478–1492. [DOI] [PMC free article] [PubMed] [Google Scholar]
- 14. Tree J.J., Granneman S., McAteer S.P., Tollervey D., Gally D.L.. Identification of bacteriophage-encoded anti-sRNAs in pathogenic Escherichia coli. Mol. Cell. 2014; 55:199–213. [DOI] [PMC free article] [PubMed] [Google Scholar]
- 15. Remes B., Berghoff B.A., Forstner K.U., Klug G.. Role of oxygen and the OxyR protein in the response to iron limitation inRhodobacter sphaeroides. BMC Genomics. 2014; 15:794. [DOI] [PMC free article] [PubMed] [Google Scholar]
- 16. Berghoff B.A., Glaeser J., Sharma C.M., Vogel J., Klug G.. Photooxidative stress-induced and abundant small RNAs in Rhodobacter sphaeroides. Mol. Microbiol. 2009; 74:1497–1512. [DOI] [PubMed] [Google Scholar]
- 17. Weber L., Thoelken C., Volk M., Remes B., Lechner M., Klug G.. The conserves dcw gene cluster of R. sphaeroides is preceded by an uncommonly extended 5′ leader featuring the sRNA UpsM. PLoS One. 2016; 11:e0165694. [DOI] [PMC free article] [PubMed] [Google Scholar]
- 18. Peuser V., Remes B., Klug G.. Role of the Irr protein in the regulation of iron metabolism in Rhodobacter sphaeroides. PLoS One. 2012; 7:e42231. [DOI] [PMC free article] [PubMed] [Google Scholar]
- 19. Remes B., Riesche-Grahl T., Müller K.H.M, Förstner K.U., Yu S.H., Weber L., Jäger A., Peuser V., Klug G.. An RpoHI-dependent response promotes outgrowth after extended stationary phase in the alphaproteobacterium Rhodobacter sphaeroides. J. Bacteriol. 2017; 199:14. [DOI] [PMC free article] [PubMed] [Google Scholar]
- 20. Berghoff B.A., Glaeser J., Sharma C.M, Zobawa M., Lottspeich F., Vogel J., Klug G.. Contribution of Hfq to photooxidative stress resistance and global regulation in Rhodobacter sphaeroides. Mol. Microbiol. 2011; 80:1479–1495. [DOI] [PubMed] [Google Scholar]
- 21. Förstner K.U., Reuscher C., Haberzettl K., Weber L., Klug G.. RNase E cleavage shapes the transcriptome of Rhodobacter sphaeroides and strongly impacts phototrophic growth. Life Sci. Alliance. 2018; 4:e2010800080. [DOI] [PMC free article] [PubMed] [Google Scholar]
- 22. Glaeser J., Klug G.. Photo-oxidative stress in Rhodobacter sphaeroides: protective role of carotenoids and expression of selected genes. Microbiology. 2005; 151:1927–1938. [DOI] [PubMed] [Google Scholar]
- 23. Kovach M.E., Elzer P.H., Hill D.S., Robertson G.T., Farris M.A., Roop R.M., Peterson K.M.. Four new derivatives of the broad-host-range cloning vector pBBR1MCS, carrying different antibiotic-resistance cassettes. Gene. 1995; 166:175–176. [DOI] [PubMed] [Google Scholar]
- 24. Hubner P., Willison J.C., Vignais P.M., Bickle T.A.. Expression of regulatory nif genes in Rhodobacter capsulatus. J. Bacteriol. 1991; 173:2993–2999. [DOI] [PMC free article] [PubMed] [Google Scholar]
- 25. Prentki P., Binda A., Epstein A.. Plasmid vectors for selecting IS1-promoted deletions in cloned DNA: sequence analysis of the omega interposon. Gene. 1991; 103:17–23. [DOI] [PubMed] [Google Scholar]
- 26. Schäfer A., Tauch A., Jäger W., Kalinowski J., Thierbach G., Pühler A.. Small mobilizable multi-purpose cloning vectors derived from the Escherichia coli plasmids pK18 and pK19: selection of defined deletions in the chromosome of Corynebacterium glutamicum. Gene. 1994; 145:69–73. [DOI] [PubMed] [Google Scholar]
- 27. Janzon L., Läfdahl S., Arvidson S. Evidance for a coodinate transcriptional control of alpha-toxin and protein a synthesis in Staphylococcus aureus. FEMS Microbiol. Lett. 1986; 33:193–198. [Google Scholar]
- 28. Damm K., Bach S., Müller K.M.H., Klug G., Burenina O.Y., Kubareva E.A., Grünweller A., Hartmann R.K.. Impact of RNA isolation protocols on RNA detection by Northern blotting. Methods Mol. Biol. 2015; 1296:19–38. [DOI] [PubMed] [Google Scholar]
- 29. Nyström T. Stationary-phase physiology. Annu. Rev. Microbiol. 2004; 58:161–181. [DOI] [PubMed] [Google Scholar]
- 30. Dufour Y.S., Imam S., Koo B.M., Green H.A., Donohue T.J.. Convergence of the transcriptional responses to heat shock and singlet oxygen stresses. PLos Genet. 2012; 8:e1002929. [DOI] [PMC free article] [PubMed] [Google Scholar]
- 31. Nuss A.M., Glaeser J., Berghoff B.A., Klug G.. Overlapping alternative sigma factor regulons in the response to singlet oxygen in Rhodobacter sphaeroides. J. Bacteriol. 2010; 192:2613–2623. [DOI] [PMC free article] [PubMed] [Google Scholar]
- 32. Nuss A.M., Glaeser J., Klug G.. RpoH(II) activates oxidative-stress defense systems and is controlled by RpoE in the singlet oxygen-dependent response in Rhodobacter sphaeroides. J. Bacteriol. 2009; 191:220–230. [DOI] [PMC free article] [PubMed] [Google Scholar]
- 33. Billenkamp F., Peng T., Berghoff B.A., Klug G.. A cluster of four homologous small RNAs modulates C1 metabolism and the pyruvate dehydrogenase complex in Rhodobacter sphaeroides under various stress conditions. J. Bacteriol. 2015; 197:1839–1852. [DOI] [PMC free article] [PubMed] [Google Scholar]
- 34. Zuker M. Mfold web server for nucleic acid folding and hybridization prediction. Nucleic Acids Res. 2003; 31:3406–3415. [DOI] [PMC free article] [PubMed] [Google Scholar]
- 35. Mank N., Berghoff B.A., Hermanns Y.N., Klug G.. Regulation of bacterial photosynthesis genes by the small noncoding RNA PcrZ. Proc. Natl. Acad. Sci. U.S.A. 2012; 109:16306–16311. [DOI] [PMC free article] [PubMed] [Google Scholar]
- 36. Waters LS., Storz G.. Regulatory RNAs in bacteria. Cell. 2009; 20:625–628. [DOI] [PMC free article] [PubMed] [Google Scholar]
- 37. Desnoyers G., Morissette A., Prevost K., Massé E.. Small RNA-induced differential degradation of the polycistronic mRNA iscRSUA. EMBO J. 2009; 28:1551–1561. [DOI] [PMC free article] [PubMed] [Google Scholar]
- 38. Pfeiffer V., Papenfort K., Lucchini S., Hinton J.C.D., Vogel J. Coding sequence targeting by MicC RNA reveals bacterial mRNA silencing downstream of translational initiation. Nat. Struct. Mol. Biol. 2009; 16:840–846. [DOI] [PubMed] [Google Scholar]
- 39. Papenfort K., Bouvier M., Mika F., Sharma C.M., Vogel J.. Evidence for an autonomous 5′ target recognition domain in an Hfq-associated small RNA. Proc. Natl. Acad. Sci. U.S.A. 2010; 107:20435–20440. [DOI] [PMC free article] [PubMed] [Google Scholar]
- 40. Eisenhardt K.M.H., Reuscher C.M., Klug G. PcrX, an sRNA derived from the 3′-UTR of the Rhodobacter sphaeroides puf operon modulates expression of puf genes encoding proteins of the bacterial photosynthetic apparatus. Mol. Microbiol. 2018; 110:325–334. [DOI] [PubMed] [Google Scholar]
- 41. Papenfort K., Vogel J.. Multiple target regulation by small noncoding RNAs rewires gene expression at the post-transcriptional level. Res. Microbio. 2009; 160:278–287. [DOI] [PubMed] [Google Scholar]
- 42. Moon K., Gottesman S.. Competition among Hfq-binding small RNAs in Escherichia coli. Mol. Microbiol. 2011; 82:1545–1562. [DOI] [PMC free article] [PubMed] [Google Scholar]
- 43. Hussein R., Lim H.N.. Disruption of small RNA signaling caused by competition for Hfq. Proc. Natl. Acad. Sci. U.S.A. 2011; 108:1110–1115. [DOI] [PMC free article] [PubMed] [Google Scholar]
- 44. Altuvia S., Weinstein-Fischer D., Zhang A., Postow L., Storz G.. A small, stable RNA induced by oxidative stress: role as a pleiotropic regulator and antimutator. Cell. 1997; 90:43–53. [DOI] [PubMed] [Google Scholar]
- 45. Navarro Llorens J.M., Tormo A., Martinez-Garcia E.. Stationary phase in gram-negative bacteria. FEMS Microbiol. Rev. 2010; 34:476–495. [DOI] [PubMed] [Google Scholar]
- 46. Thompson L.J., Merrell D.S., Neilan B.A., Mitchell H., Lee A., Falkow S.. Gene expression profiling of Helicobacter pylori reveals a growth-phase-dependent switch in virulence gene expression. Infect. Immun. 2003; 71:2643–2655. [DOI] [PMC free article] [PubMed] [Google Scholar]
- 47. Lundberg U., Vinatzer U., Berdnik D., von Gabain A., Baccarini M.. Growth phase-regulated induction of Salmonella-induced macrophage apoptosis correlates with transient expression of SPI-1 genes. J. Bacteriol. 1999; 181:3433–3437. [DOI] [PMC free article] [PubMed] [Google Scholar]
- 48. Battesti A., Majdalani N., Gottesman S. The RpoS-mediated general stress response in Escherichia coli. Annu. Rev. Microbiol. 2011; 65:189–213. [DOI] [PMC free article] [PubMed] [Google Scholar]
- 49. Lease R.A., Cusick M.E., Belfort M.. Riboregulation in Escherichia coli: DsrA RNA acts by RNA:RNA interactions at multiple loci. Proc. Natl. Acad. Sci. U.S.A. 1998; 95:12456–12461. [DOI] [PMC free article] [PubMed] [Google Scholar]
- 50. Majdalani N., Cunning C., Sledjeski D., Elliott T., Gottesman S.. DsrA RNA regulates translation of RpoS message by an anti-antisense mechanism, independent of its action as an antisilencer of transcription. Proc. Natl. Acad. Sci. U.S.A. 1998; 95:12462–12467. [DOI] [PMC free article] [PubMed] [Google Scholar]
- 51. Majdalani N., Hernandez D., Gottesman S.. Regulation and mode of action of the second small RNA activator of RpoS translation, RprA. Mol. Microbiol. 2002; 46:813–826. [DOI] [PubMed] [Google Scholar]
- 52. Madhugiri R., Basineni R., Klug G.. Turn-over of the small non-coding RNA RprA in E. coli is influenced by osmolarity. Mol. Genet. Genomics. 2010; 284:307–318. [DOI] [PubMed] [Google Scholar]
- 53. McIntosh M., Eisenhardt K., Remes B., Konzer A., Klug G.. Adaptation of the Alphaproteobacterium Rhodobacter sphaeroides to stationary phase. Environ. Microbiol. 2019; 21:4425–4445. [DOI] [PubMed] [Google Scholar]
- 54. Murashkoa O.N., Lin-Chaoa S.. Escherichia coli responds to environmental changes using enolasic degradosomes and stabilized DicF sRNA to alter cellular morphology. Natl. Acad. Sci. U.S.A. 2017; 114:e8025–e8034. [DOI] [PMC free article] [PubMed] [Google Scholar]
- 55. Glaeser J., Klug G.. Photo-oxidative stress in Rhodobacter sphaeroides: protective role of carotenoids and expression of selected genes. Microbiology. 2005; 151:1927–1938. [DOI] [PubMed] [Google Scholar]
Associated Data
This section collects any data citations, data availability statements, or supplementary materials included in this article.
Supplementary Materials
Data Availability Statement
All data not shown in the manuscript are available as Supplementary data online.