Abstract
Docosahexaenoic acid (DHA) is an ω−3 fatty acid which is essential for neurological development and function, and is supplied to the brain and eyes predominantly from dietary sources1–6. This nutrient is transported across the blood-brain and blood-retinal barriers in the form of lysophosphatidylcholine by Major Facilitator Superfamily Domain containing 2A (MFSD2A) in a Na+-dependent manner7,8. Here we present the structure of MFSD2A determined using single-particle cryo-electron microscopy at 3.0 Å resolution, showing twelve transmembrane helices separated into two pseudo-symmetric domains. The transporter is in an inward-facing conformation and features a large amphipathic cavity harbouring the Na+-binding site and a bound lysolipid substrate, confirmed by native mass spectrometry. Together with functional analyses and molecular dynamics simulations, this structure reveals details of how MFSD2A interacts with substrates and how Na+-dependent conformational changes allow for their release into the membrane through a lateral gate. Our work provides insight into the molecular mechanism by which this atypical MFS transporter mediates uptake of lysolipids into the brain and has the potential to aid neurotherapeutic delivery.
Keywords: MFS transporters, lysolipids, cryo-EM, membrane proteins, structural biology, blood-brain barrier, blood-retinal barrier, omega-3 fatty acids, molecular dynamics simulations, native mass spectrometry
Docosahexaenoic acid (DHA) is an omega-3 fatty acid that accounts for ~20% of the total membrane fatty acids in the central nervous system, and is essential for brain and eye function and development2,3,5. These organs cannot synthesize DHA de novo, and thus rely on the uptake of systemic and dietary sources of this nutrient across the blood-brain barrier (BBB) and blood-retinal barrier (BRB)1,4,6. Major Facilitator Superfamily Domain containing 2A (MFSD2A) is highly expressed within endothelial cells of the BBB and the BRB, where it facilitates Na+-dependent uptake of DHA in the form of lysophosphatidylcholine (LPC-DHA; Fig. 1a and Extended Data Fig. 1a)7–10. Human loss-of-function mutations in MFSD2A have been shown to cause autosomal recessive primary microcephaly-1511–16. Knockout mice studies have recapitulated these phenotypes, and demonstrate that MFSD2A-mediated transport is critical for neuronal membrane arborization and maintenance of phospholipid composition11.
Figure 1 |. Structure of MFSD2A in an inward-facing conformation.
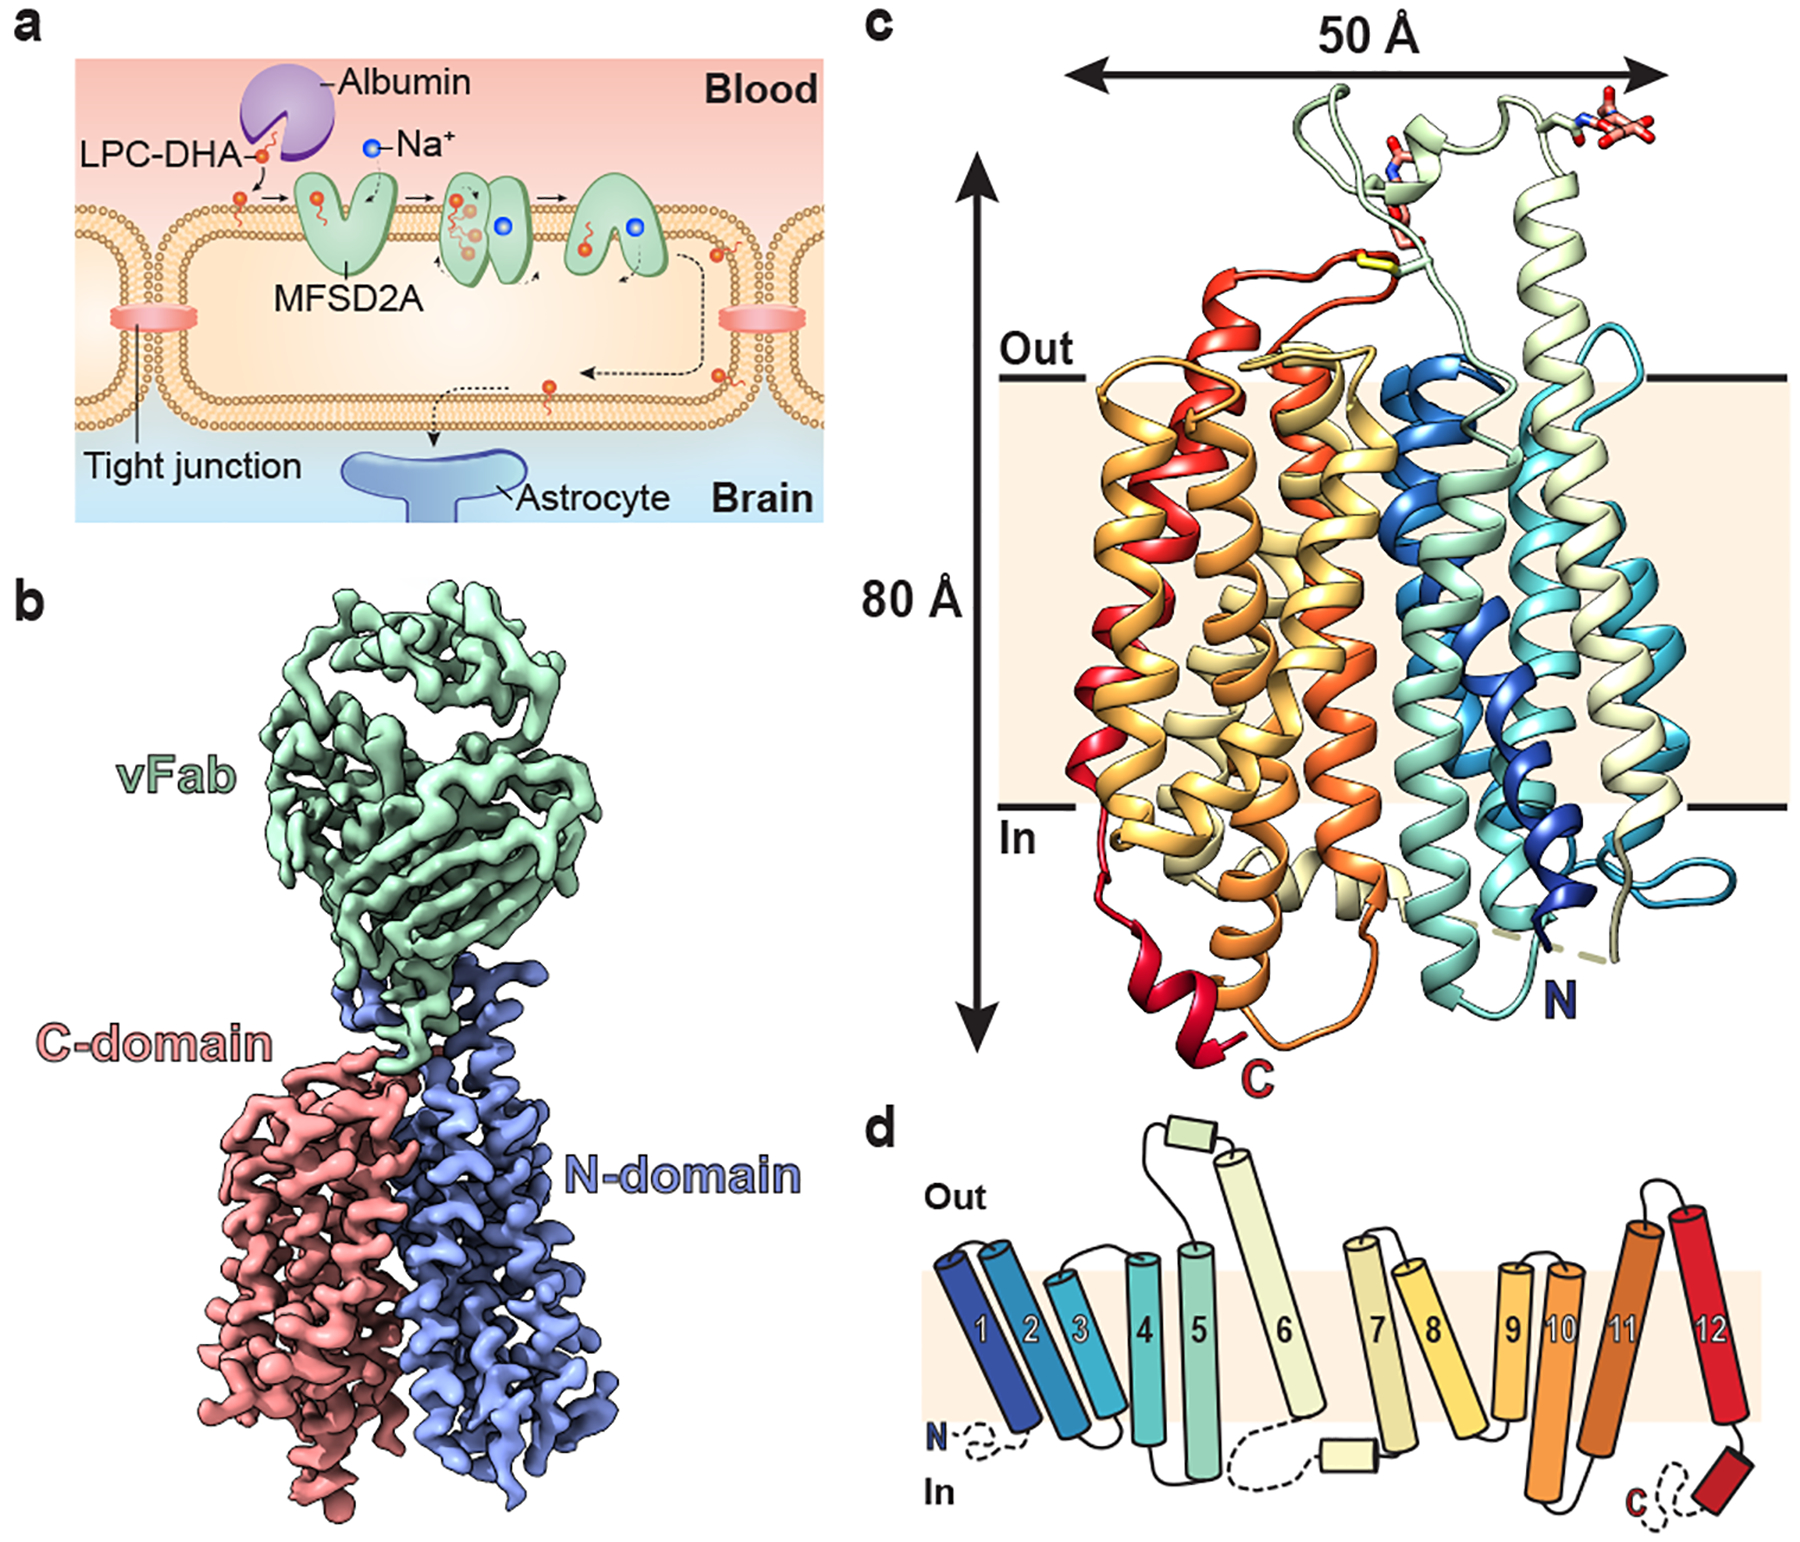
a, Schematic of Na+-dependent, MFSD2A-mediated LPC-DHA uptake across the BBB. Albumin delivers substrates such as LPC-DHA to MFSD2A expressed in brain microvascular endothelial cells. Substrate is then transported in a Na+-dependent manner across this apical membrane. How substrate is subsequently delivered across the basal membrane remains unclear (dashed lines). b, The 3.0 Å cryo-EM density map of MFSD2A_GG in complex with an Fab. Density corresponding to the N- and C-domains of MFSD2A_GG are in blue and red, respectively, and the variable region of the Fab (vFab) in green. c, The structure of MFSD2A_GG in the plane of the membrane coloured in rainbow from the N- (blue) to the C- (red) terminus. Glycosylation at two sites, and an extracellular disulphide bond are shown in stick representation, and an unresolved intracellular loop as a dashed line. d, Topology of MFSD2A showing the twelve numbered TM helices coloured as in c. Disordered regions are shown as dashed lines.
MFS proteins constitute the largest secondary-active transporter family17,18. MFSD2A is an atypical MFS protein because it transports large amphiphilic lysolipids. The only other known MFS lysolipid transporters are MFSD2B, Spns2, and LplT19–22. In addition to LPC-DHA, MFSD2A transports a variety of other lysolipids, provided that they have been esterified to a zwitterionic headgroup, or a zwitterion with an additional anionic group7,23. Given the amphiphilic nature of LPCs, it has been hypothesized that MFSD2A transports these mono-acyl lipids by flipping them from the outer to the inner leaflet of the bilayer23. Of the MFS structures available to date, only LtaA has been proposed to utilise a similar mechanism, but its substrate is a diacyl lipid24.
Little is known about the molecular basis for MFSD2A-mediated transport, or how MFS proteins have adapted to transport lysolipids. Here we present the 3.0 Å structure of MFSD2A in complex with a lysophospholipid substrate, determined using single-particle cryo-electron microscopy (cryo-EM). We combine this work with functional analyses and molecular dynamics simulations to reveal that Na+-binding is coupled to lateral movement of substrate through an intracellular gate that opens to the inner leaflet of the membrane.
Structure determination of MFSD2A
We identified MFSD2A from Gallus gallus (MFSD2A_GG; 58 kDa in size) as the most stable and well-expressing ortholog out of seven screened (Extended Data Fig. 1b). This ortholog shares 73% sequence identity to human MFSD2A (MFSD2A_HS; Extended Data Fig. 2) and exhibits similar LPC transport properties (Extended Data Fig. 1c). To overcome current size limitations for structure determination using cryo-EM25,26, we screened a synthetic phage display library27–29 to select for MFSD2A_GG-specific high affinity antigen-binding fragments (Fabs; ~50 kDa in size). Several candidate Fabs were identified, including 2AG3, our Fab of choice (Extended Data Fig. 1d, e). We formed a complex between nanodisc-reconstituted MFSD2A_GG and 2AG3 to increase the size of the imaged particles and assist with particle orientation (Extended Data Fig. 1f, g). This allowed us to obtain high-quality two-dimensional class averages with clear individual transmembrane (TM) features (Extended Data Fig. 3a), ultimately yielding a density map with a nominal resolution of 3.0 Å (Fig. 1b, Extended Data Fig. 3 and Extended Data Table 1) into which we built a model of MFSD2A_GG comprising residues 36–267 and 280–505 of the 528 in total (Fig. 1c and Extended Data Fig. 4).
The structure of lysolipid-bound MFSD2A
MFSD2A_GG has a classical MFS transporter fold consisting of twelve TM helices arranged into two pseudo-symmetric six-helix bundles – the N- and C-domains – connected by a cytoplasmic loop (Fig. 1c, d). Glycosylation is observed at two predicted sites (N218 and N227), and there is evidence of a disulphide bond between C207 and C460, in the TM 5–6 and TM 11–12 loops, respectively (Extended Data Fig. 4). The transporter is in an inward-facing conformation, and exhibits a large intracellular cavity (~4613 Å3) that extends approximately halfway across the membrane (Fig. 2a). This intracellular cavity has two lateral openings towards the inner leaflet of the bilayer: one between TM2 and TM11, and the other between TM5 and TM8. This cavity is amphipathic in nature, with residues contributed by the N- and C-domains being broadly hydrophilic and hydrophobic, respectively (Fig. 2a). It harbours three interesting structural elements: a charged central region, a proposed Na+-binding site, and a lysolipid-bound hydrophobic pocket (Fig. 2a–d).
Figure 2 |. The intracellular cavity of MFSD2A features the Na+- and lysolipid-binding sites.
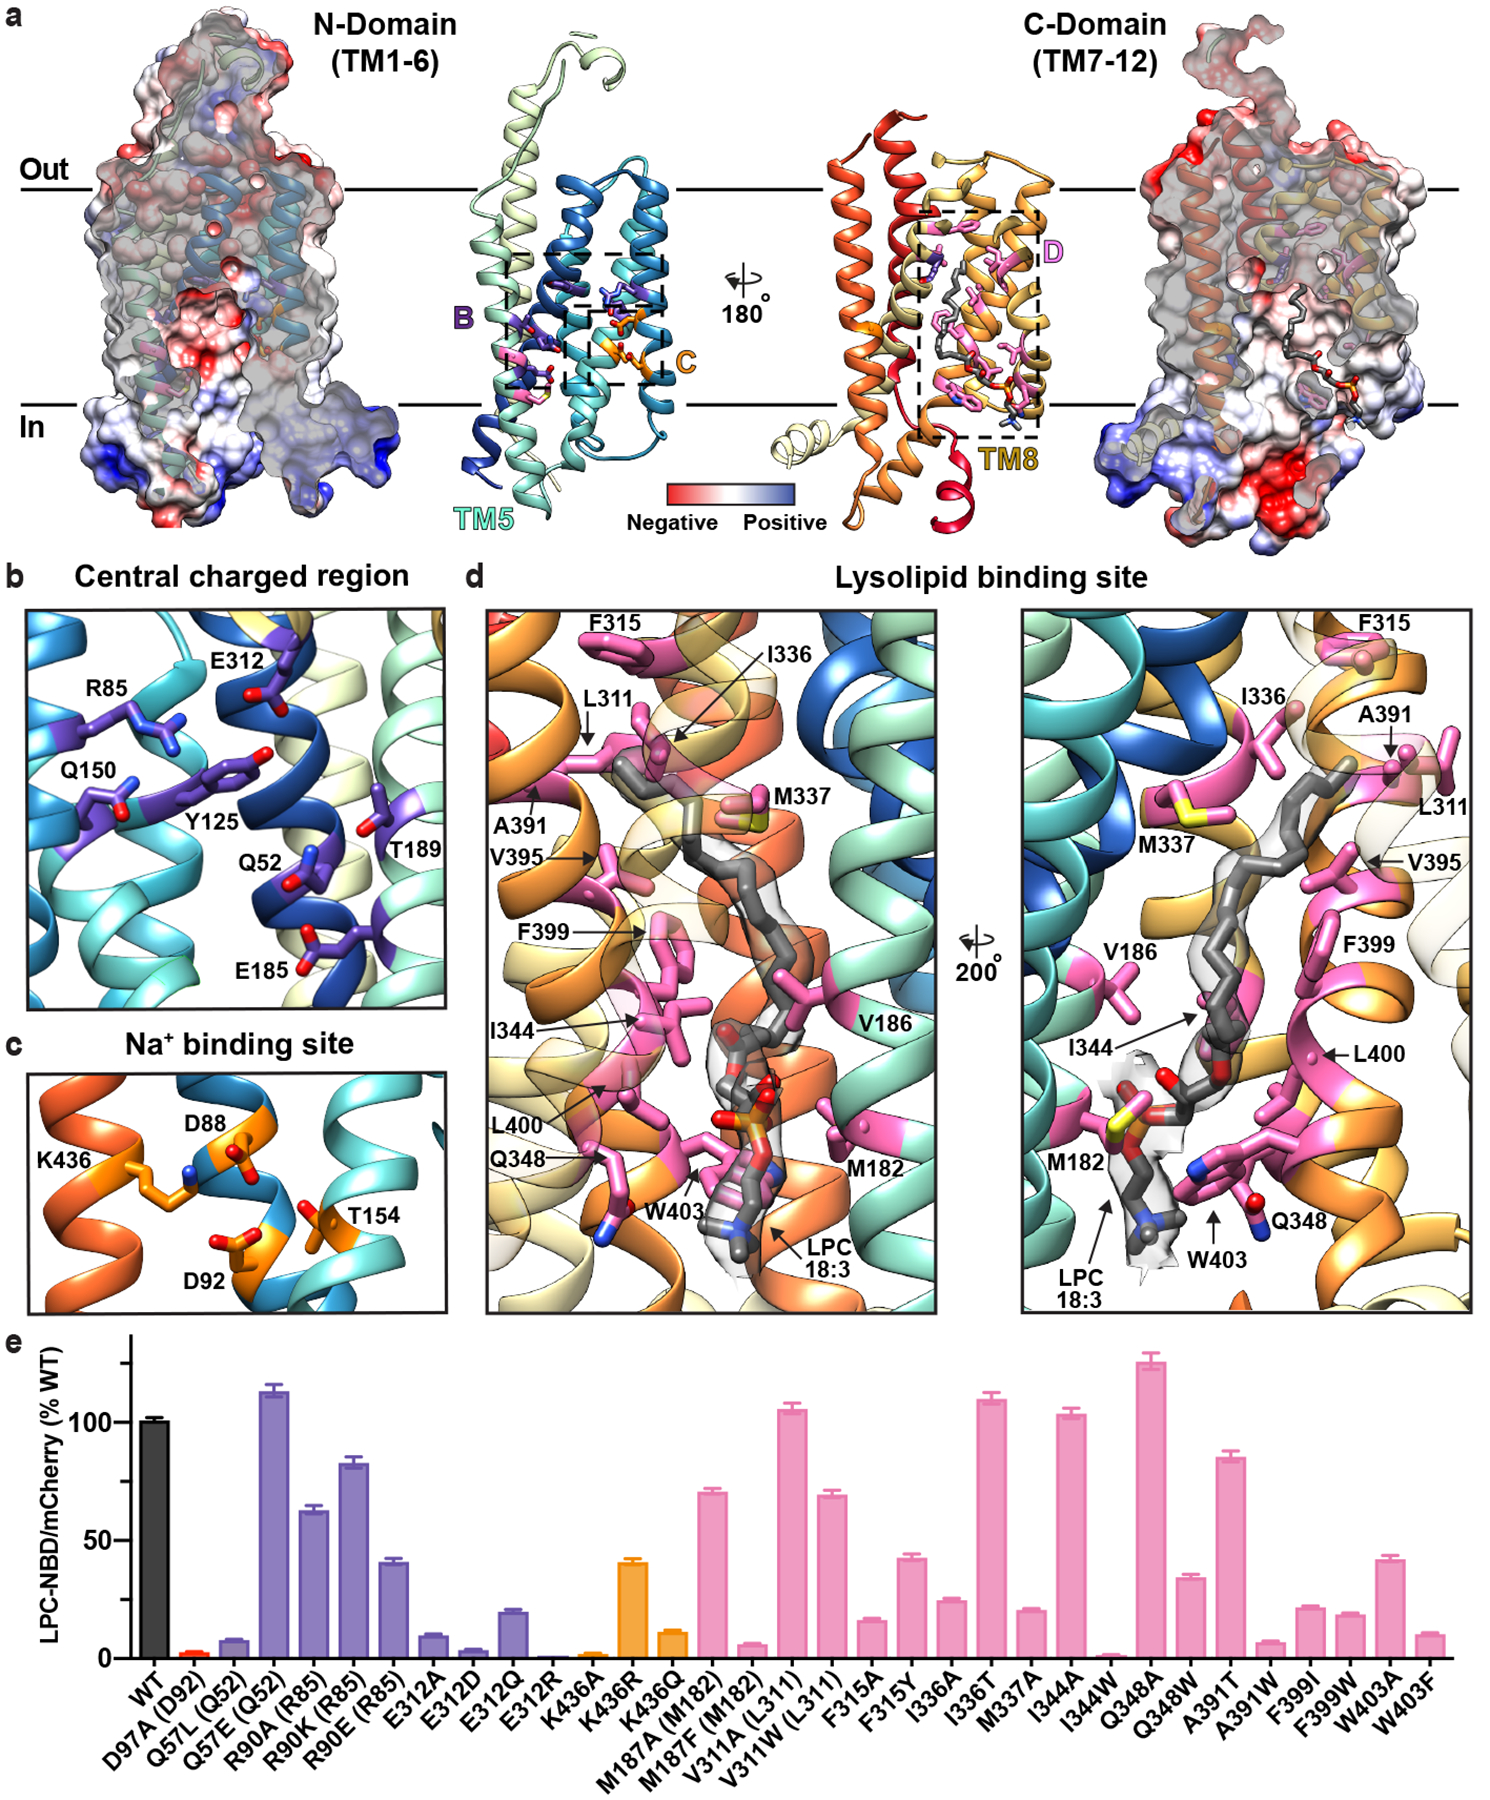
a, The N- (left) and C- (right) domains as viewed from within the intracellular cavity of MFSD2A_GG. For both domains, the electrostatic potential (from negative in red, to positive in blue) is shown as a surface, with the structure in ribbon representation (coloured as in Fig. 1) overlaid, and next to it. Insets refer to regions highlighted in panels b-d, with residues of interest and bound substrate (LPC-18:3) shown in stick representation. b, Central charged region with residues labelled and coloured in purple. c, Na+-binding site with residues labelled and coloured in orange. d, Lysolipid-binding site shown from two views with residues labelled and coloured in pink and bound LPC-18:3 in gray stick representation. The cryo-EM density assigned to bound lysolipid is displayed as a semi-transparent grey surface. For visual clarity, TM8 in the left panel is shown with partial transparency, and in the right panel TM2 and TM11 have been omitted and TM7 is partially transparent. e, Single-cell uptake of the fluorescent substrate LPC-NBD by cells expressing WT and mutant MFSD2A_HS-mCherry fusion constructs analysed by fluorescence-activated cell sorting. LPC-NBD uptake was normalized to mCherry expression and represented as a % of WT collected in the same experiment ± S.E.M. See Extended Data Fig. 6 for raw data and n values for each construct assayed. Colour coding matches that in panels a-d. Where residue number or identity differ between MFSD2A_HS and MFSD2A_GG the corresponding residue in MFSD2A_GG is also provided in parenthesis.
The innermost region of the intracellular cavity contains a cluster of charged and polar residues, including Q52, R85, Y125, Q150, E185, T189, and E312, that are well suited to bind the charged headgroups of MFSD2A substrates (Extended Data Fig. 1a and 2b). This region is directly adjacent to the proposed Na+-binding site, which is conserved amongst Na+-coupled MFS transporters30. It comprises residues D88, D92, T154, and K436 (Fig. 2c), which have previously been demonstrated to be important for substrate transport7,23, and in humans, mutation of T154 to methionine results in autosomal recessive primary microcephaly-1516. We did not observe evidence for bound Na+, which implies that the ion is either absent in this conformation or is not detectable at the obtained resolution.
Within the C-domain of the intracellular cavity there is a pocket lined by several hydrophobic residues including M182, V186, L311, F315, I336, M337, I344, A391, V395, F399, L400, and W403. Here, we observed density that could not be attributed to the protein (Fig. 2d and Extended Data Fig. 4). Native mass spectrometry analysis revealed two distinct masses, one of 70,898 ± 1 Da – consistent with the size of glycosylated apo MFSD2A_GG – and the second of 71,413 ± 2 Da, which we attributed to glycosylated MFSD2A_GG with a 515 ± 2 Da bound adduct (Extended Data Fig. 5a). We assigned this adduct as LPC-18:3 (517 Da), which was detected in SF9 cells upon LC-MS analysis (data not shown). LPC-18:3 is an MFSD2A substrate (Extended Data Fig. 5b, c)11, which was not displaced upon addition of LPC-18:1 to nanodisc-reconstituted protein (Extended Data Fig. 5d).
To analyse MFSD2A function, we developed a flow cytometry assay that measures MFSD2A_HS-mediated uptake on a single cell basis (Extended Data Fig. 6). Within the central charged region, mutagenesis of E312 abolishes activity, while mutagenesis of R90 (R85 in MFSD2A_GG) is more permissive (Fig. 2b, e). K436 bridges this region to the Na+-binding site, and non-conservative mutagenesis of this residue results in uptake deficiencies (Fig. 2c, e), consistent with previous observations23. Within the lysolipid-binding site, the effect of mutagenesis is heterogeneous, but in general, changing the size of a residue reduces substrate uptake (Fig. 2d, e). Certain residues spanning the entire length of this hydrophobic pocket, such as F315, F399 and W403, appear to be highly sensitive to mutagenesis, with even conservative mutations impacting uptake (Fig. 2d, e).
Na+-coupled substrate release mechanism
To provide mechanistic insight into how substrate interacts with MFSD2A, we performed atomistic ensemble molecular dynamics (MD) simulations of MFSD2A_GG embedded in a 1-palmitoyl-2-oleoyl-sn-glycero-3-phosphocholine (POPC) lipid bilayer, in the presence or absence of substrates (Extended Data Fig. 7, 8 and Supplementary Notes). For initial simulations performed in the absence of substrate (Fig. 3a, state i), Na+ was seen to enter the intracellular cavity and interact with either E312 or D92. In the apo and E312-Na+ bound states (Fig. 3b, state ii), M182, F399, and W403 form a gate between TMs 5 (N-domain), 8, and 10 (C-domain), which restricts access to the intracellular cavity from the inner leaflet of the membrane. When Na+ binds to D92, this intracellular gate (IC-gate) opens (Fig. 3c, state iii), allowing POPC headgroups to transiently penetrate the intracellular cavity (Extended Data Fig. 8a). When the POPC molecule adjacent to the open IC-gate was replaced with LPC-18:1, LPC-18:3, or LPC-DHA, these substrates were seen to insert deeply into and extensively sample the hydrated intracellular cavity via their polar headgroup (Extended Data Fig. 8a, b), while the hydrophobic tails remained predominantly in the membrane (Fig. 3d, state iv, Extended Data Fig. 9, and Supplementary Video). In simulations initiated with LPC-18:3 positioned as observed in the cryo-EM structure (Fig. 2d), the lysolipid headgroup behaved similarly, while the tail remained engaged in long-lasting contacts with the surrounding hydrophobic residues (Extended Data Fig. 8c, d). Multiple pathways for the interconversion between the apo (i) and the lysolipid Na+-bound (iv) state (Fig. 3) were identified, whereby conformations representing (ii), (iii), and the cryo-EM structure serve as intermediate states (Extended Data Fig. 10).
Figure 3 |. MD simulations of MFSD2A reveal coupling between Na+ binding and lysolipid movement through a dynamic intracellular gate.
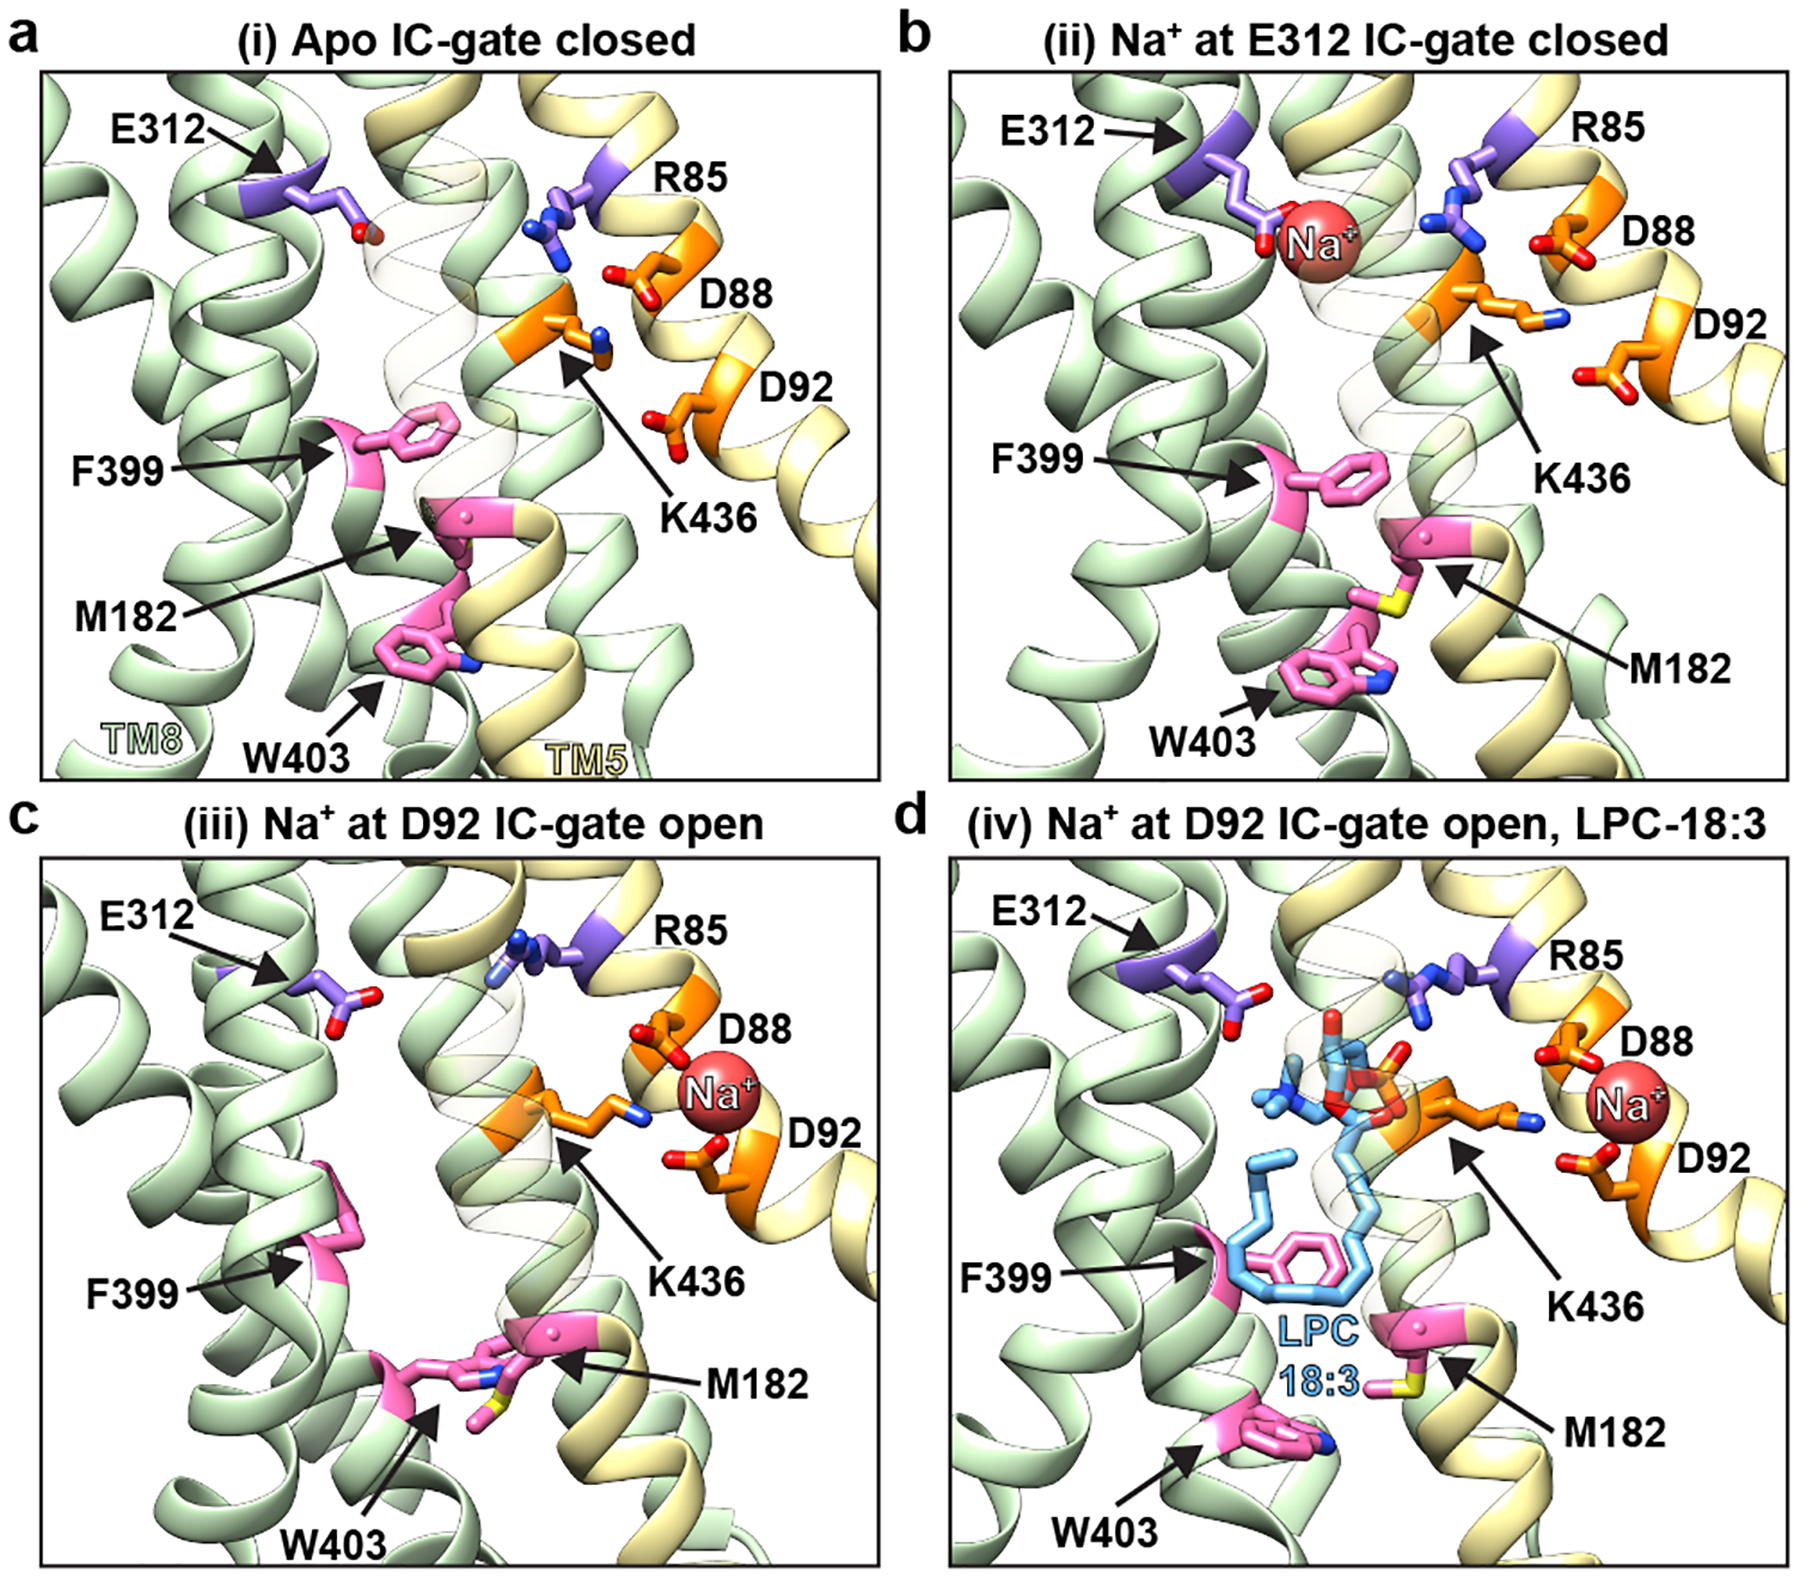
Structural representation of conformational states in a, an apo conformation with the intracellular (IC) gate closed (i); b, Na+ at E312 and IC-gate closed (ii); c, Na+ at D92 and IC-gate open (iii); d, Na+ at D92, bound LPC-18:3 and IC-gate open (iv). Helices in the N-domain are coloured in yellow whereas those in the C domain are green. Select residues are shown in stick representation and coloured as in Fig. 2. For visual clarity, TMs 1, 3, 4, 6, 9, 12 have been omitted and TM5 is partially transparent. For corresponding microstate and histograms of selected collective variables (CVs) in the ensembles see Extended Data Fig. 7d, f.
Our simulations also revealed dynamic interplay between the lysolipid headgroup, Na+, and residues in the charged central region. Specifically, we observed that in the apo and E312-Na+-bound states, R85 and K436 interact with D88 and D92, respectively, but when Na+ binds to D92 and D88, R85 is reoriented towards E312 (Fig. 3b, c). Once liberated from D88, R85 coordinates the phosphate of the incoming substrate, while Na+-free E312 forms a salt bridge with the substrate’s amine group (Fig. 3d). Given that mutagenesis of E312 abolishes transport activity, whereas substitutions at R85 are more tolerable (Fig. 2e), it is likely that the putative interaction between E312 and the amine group of the substrate headgroup is more crucial for substrate transport than the interaction between R85 and the phosphate. This is consistent with the observation that a substrate amine group is essential for transport, whereas a phosphate is not an absolute requirement, as long as there is a negative charge at an equivalent position23. Indeed, sphingosine 1-phosphate – which lacks an amine group – is not transported by MFSD2A but is by its close relative MFSD2B, which has a glutamine at the equivalent position of E312 (Extended Data Fig. 2)20,21. Furthermore, in simulations where Na+ was replaced with Li+, which cannot support transport7, Li+ appeared to be tightly associated with E312 (stabilizing state (ii), Fig. 3b) and did not establish interactions with D92, thus preventing opening of the IC-gate and substrate headgroup binding (Extended Data Fig. 9a and Supplementary Notes). Together, these data suggest that Na+ binding to D88 and D92 is a crucial mechanistic step that opens the IC-gate and repositions R85, which – in tandem with E312 – coordinates the lysolipid headgroup as it travels through the intracellular cavity.
Extracellular contacts between domains
In our MD simulations, dynamic changes on the extracellular side of MFSD2A were minimal. Here, the N- and C-domains are pinned together by a disulphide crosslink between C207 and C460, as well as an electrostatic network between D68 (N-domain), and Y321, R326, and Y455 (C-domain) (Extended Data Fig. 11a). Disruption of the disulphide bond by mutagenesis resulted in a partial reduction of uptake (Extended Data Fig. 11b). Furthermore, mutagenesis within the adjacent electrostatic network demonstrated that non-conservative mutagenesis of D73 (D68 in MFSD2A_GG) and Y455 abolished uptake altogether, while mutagenesis of R326 and Y321 was partially and well tolerated, respectively (Extended Data Fig. 11b). Directly beneath these structural elements, a cluster of hydrophobic residues (F60, F61, F329, and L333) at the domain interface pack against each other (Extended Data Fig. 11a). Analysis of hydration within the intracellular cavity during MD simulations revealed that this cluster plugs what would otherwise be a continuous water conduit spanning the extra- and intra-cellular milieux (Extended Data Fig. 11c). Indeed, when these residues were mutated to alanine in silico, a continuous water path across the membrane was observed (Extended Data Fig. 11d, e). Furthermore, reducing side-chain bulk at these positions resulted in complete loss of activity, whereas mutations of F61 and F329 to tyrosine had no apparent effect (Extended Data Fig. 11f).
Discussion
We have determined the substrate-bound structure of MFSD2A_GG in an inward-facing conformation, and used MD simulations to reveal details of interplay between substrate and Na+ binding. We propose a mechanism (Fig. 4) in which MFSD2A begins in an outward-facing apo conformation [1]. Here, extracellular Na+ transiently interacts with E312 [2], and subsequently binds to D92 following displacement by the substrate’s LPC headgroup [3]. This triggers a conformational change [4] to an inward-facing state, in which the IC-gate opens to the inner leaflet of the membrane [5]. The LPC headgroup then transitions from E312 through the IC-gate, while the tail remains bound to the hydrophobic pocket, as is observed in the cryo-EM structure (Fig. 2d) [6]. This results in release of Na+ to the intracellular milieu and partial closing of the IC-gate. Finally, the lysolipid tail is released into the inner leaflet of the membrane and the IC-gate closes [7], allowing MFSD2A to transition back to an outward-facing conformation [8]. Transitions between inward- and outward-facing states may in part be mediated by conformational rearrangements of the hydrophobic plug and extracellular inter-domain electrostatic network (Extended Data Fig. 11). Given the oxidising environment of the extracellular solution, we predict that the disulphide crosslink observed is maintained throughout the transport cycle, raising the possibility that MFSD2A may use a subtly adapted version of the canonical rocker-switch mechanism17. This could involve an outward-facing conformation that is less exposed to the extracellular solution and partially open to the membrane. Such an adaptation is not entirely surprising given the amphiphilic nature of MFSD2A substrates and may aid selective entrance of single acyl-chain lipids. Additionally, the release of substrate through a lateral opening between TM5 and TM8, although non-canonical, is appropriate given the chemical nature of MFSD2A substrates. Similar mechanisms have recently been proposed for other MFS members that transport lipophilic substrates31. Given the integral role the membrane likely plays in this mechanism, future studies should investigate the effect of lipid composition on MFSD2A-mediated transport.
Figure 4 |. Proposed mechanism of MFSD2A-mediated transport.
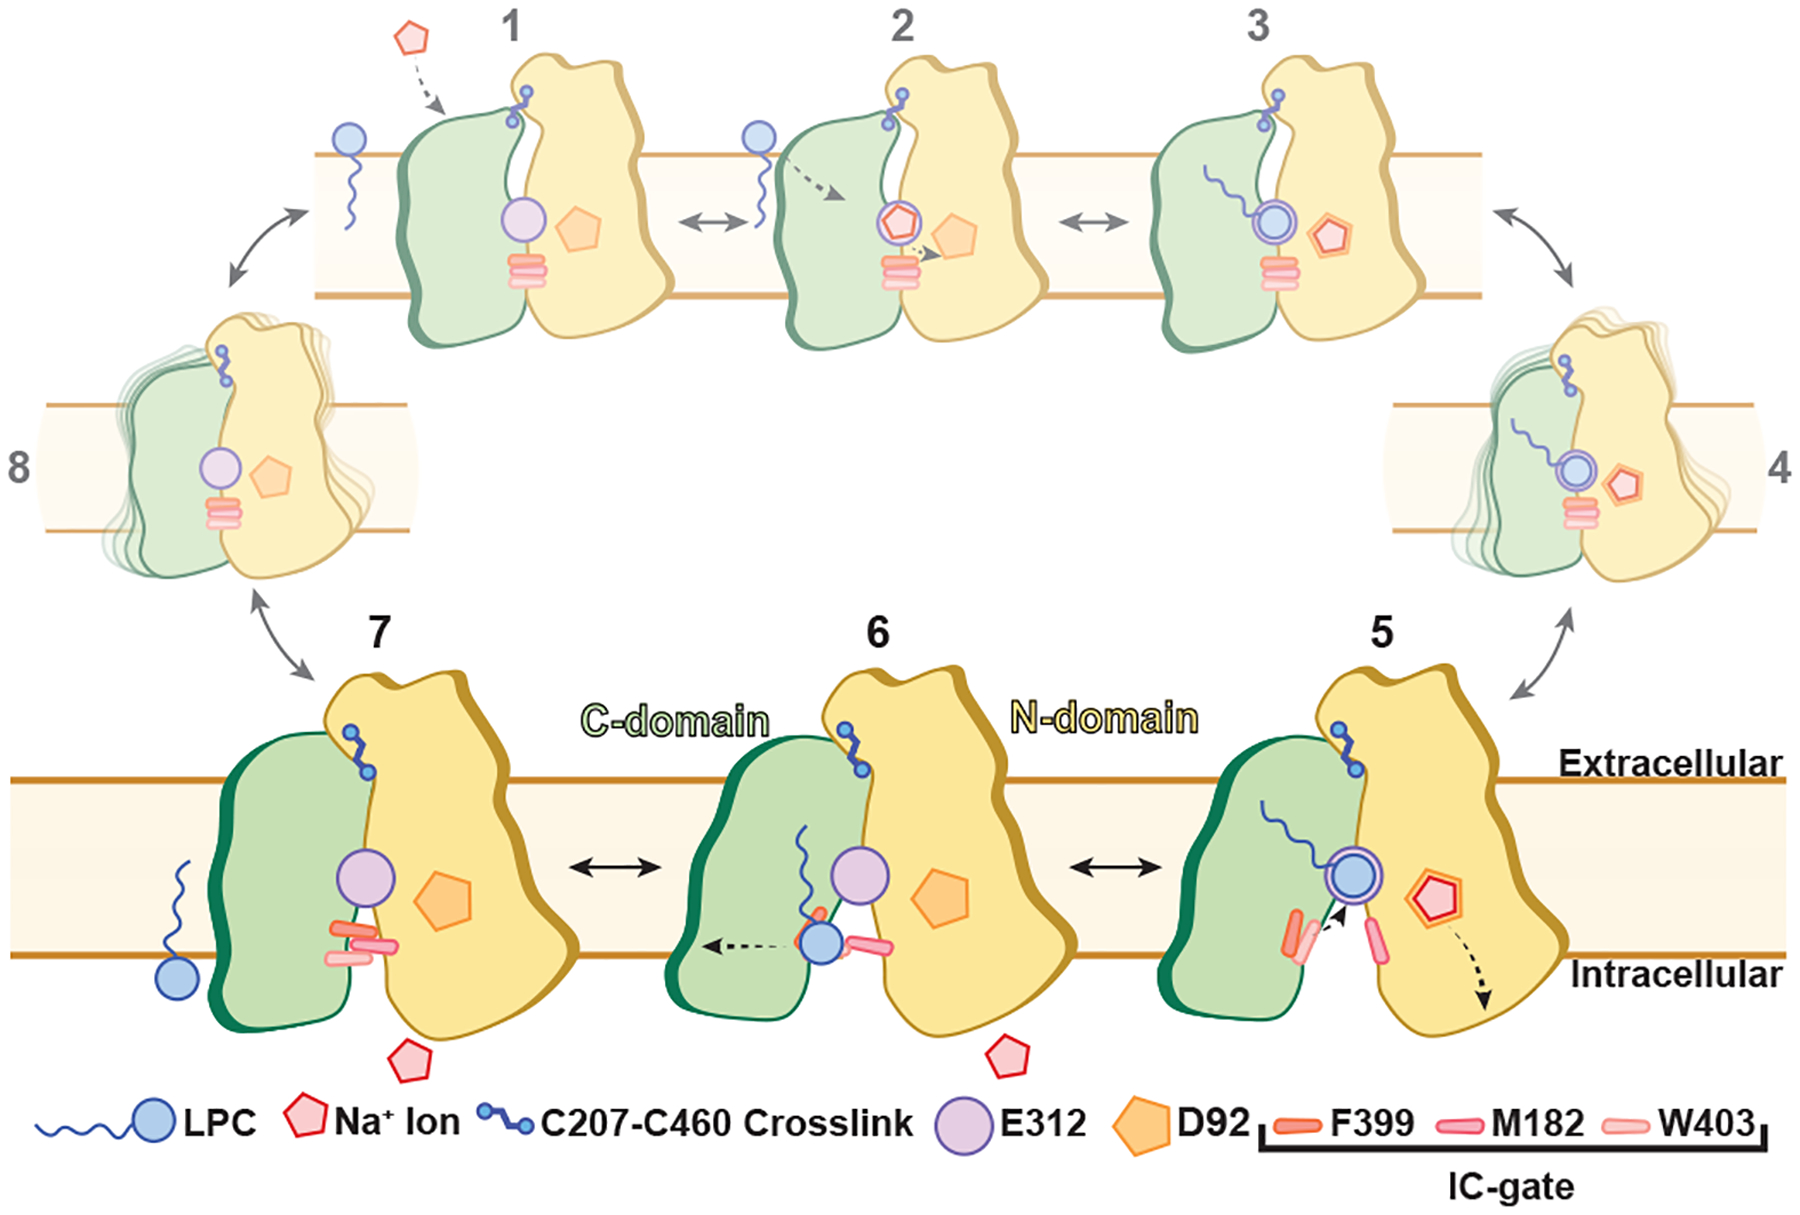
Schematic of the conformational states visited by MFSD2A throughout its transport cycle. Larger panels (states 5–7) are directly derived from our data, whilst the remainder are hypothesized based on our observations and prior knowledge of related transporters.
While several questions undoubtedly remain, our work provides insight into the molecular mechanisms by which MFSD2A transports LPC-DHA and other lysolipids across the blood-brain and blood-retinal barriers. Finally, we are hopeful that our results will provide a foundation for structure-based design of neurotherapeutics that hijack MFSD2A for delivery across the blood-brain barrier – a major bottleneck in neurotherapeutic development.
Methods
Small-scale expression screen of MFSD2A variants
Initial expression studies were performed with seven MFSD2A variants, including Danio rerio (MFSD2A_DR; NCBI - BC085388), Xenopus tropicalis (MFSD2A_XT; NCBI-BC123088), Bos taurus (MFSD2A_BT; NCBI - BC149727), Gallus gallus (MFSD2A_GG; NCBI - XM_417826), Canis lupus familiaris (MFSD2A_CLF; NCBI - XP_532546), Homo sapiens (MFSD2A_HS; NCBI- NM_032793), and Mus musculus (MFSD2A_MM; NCBI- NM_029662). To express these in mammalian cells, the sequences were cloned into pFM1.232 as Green Fluorescent Protein (GFP) fusions with a decahistidine affinity tag at either the 5′ or 3′ end of the gene. In brief, 1 μg of each construct was diluted into 100 μl opti-MEM (Thermo Fisher Scientific) and mixed with 100 μl opti-MEM containing 4 μg of polyethylenimine (PEI – maximum molecular mass of 40,000 Da; Polysciences). This mixture was added to 1.0 × 10⁶ HEK293 cells (Invitrogen) in a total volume of 2 ml in a 6-well plate (Corning). The cell transfection mixture was incubated at 37 °C for 72 h in 5% CO2. Transfected cells were then collected, centrifuged at 800 g for 10 min at 4 °C and washed once on ice in 1× PBS. Each pellet was resuspended and solubilized in 20 mM HEPES pH 7.5, 200 mM NaCl, 20 mM MgSO4, 0.5 mM phenylmethylsulfonyl fluoride (PMSF), cOmplete EDTA-free protease inhibitor cocktail (Roche), 10 μg ml−1 DNase I (Roche) and 8 μg ml−1 RNase (Sigma-Aldrich) supplemented with 1% (w/v) n-dodecyl-β-d-maltopyranoside (DDM) and 0.1% (w/v) cholesteryl hemisuccinate (CHS) at 4 °C for 2 h. Insoluble material was removed by ultracentrifugation in a single-angle rotor at 4 °C for 45 min. The supernatant of each sample was subjected to western blot analysis using a rabbit anti-GFP antibody (diluted 1:5,000; Invitrogen) and a secondary goat anti-rabbit IgG conjugated to horseradish peroxidase (HRP) (diluted 1:7,000; Invitrogen). Labelling was detected using a western blot Luminol reagent (Santa Cruz). Expression and stability were further evaluated by fluorescence-coupled size-exclusion chromatography (FSEC)33. In these assays, each GFP-tagged construct was transfected into HEK293 Freestyle cells (Invitrogen) in the presence of PEI as described above. Transfected cells were incubated at 37 °C for 72 h with 8% CO2 and 70% humidity. Cell supernatants were prepared for FSEC analysis as described above. DDM-solubilized supernatants were loaded onto a Superdex 200 Increase 5/150 GL size-exclusion column (GE Healthcare) attached to an Agilent Technologies FSEC system. These studies identified MFSD2A from Gallus Gallus (MFSD2A_GG) as having the best yield and mono-dispersity (Extended Data Fig. 1a).
MFSD2A protein expression, purification, and nanodisc reconstitution
The MFSD2A_GG full-length open-reading frame was cloned into the pFB (Thermofisher) using the Gibson Assembly method34. MFSD2A_GG was fused at its 3′ end with a tobacco etch virus protease cleave site (ENLYFQSYV) and a decahistidine affinity tag followed by a streptavidin affinity tag (WSHPQFEK). The resulting plasmid was transformed into Escherichia coli DH10Bac competent cells to generate the baculovirus DNA using a bac-to-bac protocol (Thermofisher). Recombinant P1 baculovirus DNA was transfected into and cultured in Sf9 cells (Expression System) in penicillin-streptomycin-free ESF 921 protein-free insect cell culture media (Expression Systems) in the presence of PEI. Virus passages were then amplified in penicillin-streptomycin-containing media (Roche) until cells became visibly swollen and demonstrated reduced viability statistics. For protein expression, 800 μl P3 virus was used to infect 800 ml cultures of Sf9 cells at 2 × 10⁶ cells per ml in penicillin-streptomycin-containing media. Following transduction, the cells were grown in a non-humidified incubator at 27 °C for 72 h before harvesting.
Cell pellets were homogenized in low-salt buffer (10 mM HEPES pH 7.5, 10 mM KCl, 10 mM MgCl2, 0.5 mM PMSF, cOmplete EDTA-free protease inhibitor cocktail, 10 μg ml−1 DNase I, and 8 μg ml−1 RNase) in a glass homogenizer. Membrane fractions were isolated by ultracentrifugation at 40,000 g in a type 45 Ti rotor (Beckman Coulter). Membrane fractions were further homogenized and washed twice with high-salt buffer (10 mM HEPES pH 7.5, 10 mM KCl, 10 mM MgCl2, 1 M NaCl, 0.5 mM PMSF, cOmplete protease inhibitor cocktail, 10 μg ml−1 DNase I and 8 μg ml−1 RNase) in a glass homogenizer followed by ultracentrifugation. The washed membrane fractions were resuspended again by homogenizing in buffer comprising 20 mM HEPES pH 7.5, 200 mM NaCl and 0.5 mM PMSF and cOmplete protease inhibitor cocktail and stored at −80 °C until use. To solubilize the membrane fraction, the pellet was resuspended in 4x the cell pellet weight of solubilization buffer (20 mM HEPES pH 7.5, 200 mM NaCl, 0.5 mM PMSF, cOmplete protease inhibitor cocktail, 10 μg ml−1 DNase I and 8 μg ml−1 RNase) containing DDM with CHS in a 10:1 (w/w) ratio to a final concentration of 1% (w/v) detergent and incubated at 4 °C for 2 h with gentle agitation. Insoluble material was removed by ultracentrifugation at 40,000 g in a type 45 Ti rotor (Beckman Coulter) at 4 °C for 30 min. The supernatant was then placed in a Falcon tube containing pre-equilibrated Ni2+-NTA resin (Qiagen) in the presence of 30 mM imidazole and incubated at 4 °C overnight with gentle rotation. The resin was washed with 10 column volumes of buffer comprising 20 mM HEPES pH 7.5, 200 mM NaCl, 60 mM imidazole, 0.1% DDM and 0.01% CHS. Bound protein was eluted with buffer consisting of 20 mM HEPES pH 7.5, 200 mM NaCl, 200 mM imidazole, 0.05% DDM and 0.005% CHS. Imidazole was removed from the eluted protein using PD10 desalting columns (GE Healthcare) after which the protein was incorporated into nanodiscs using a 1:200:5 molar ratio of protein: 1-palmitoyl-2-oleoyl-sn-glycero-3-phospho-(1′-rac-glycerol) (POPG): membrane-scaffold protein 1E3D1 (MSP1E3D1). This mixture was incubated at 4 °C for 2 h with gentle agitation. Reconstitution was initiated by removing detergent by incubating with Bio-beads (Bio-Rad) at 4 °C overnight with constant rotation. Bio-beads were removed and the nanodisc reconstitution mixture was bound again to Ni2+-NTA resin at 4 °C for 2 h in the absence of imidazole to remove empty nanodiscs. The resin was washed with 6 column volumes of wash buffer (20 mM HEPES pH 7.5, 200 mM NaCl and 50 mM imidazole) followed by 4 column volumes of elution buffer (20 mM HEPES pH 7.5, 200 mM NaCl and 300 mM imidazole). The eluted protein was further purified by loading on a Superdex 200 Increase 10/300 GL size-exclusion column (GE Healthcare) in gel-filtration buffer (20 mM HEPES pH 7.0 and 150 mM NaCl). Size exclusion fractions containing nanodisc-reconstituted MFSD2A_GG were then pooled and concentrated to ~10 μM.
Delivery of LPC-18:1 to nanodisc reconstituted MFSD2A
LPC-18:1 in chloroform (Avanti) was dried under the argon gas and solubilized in 20 mM HEPES pH 7, 150 mM NaCl, and 12% fatty acid-free BSA (Sigma) to create a stock concentration of 10 mM BSA-LPC-18:1. This stock was then used supply the nanodisc-reconstituted MFSD2A_GG with 100 μM LPC-18:1 using BSA as the delivery platform. Nanodisc reconstituted MFSD2A_GG was incubated with this BSA-LPC-18:1 for 2 hours on ice in the dark as LPC-18:1 is light sensitive.
Identification of MFSD2A-specific Fabs using phage display
MFSD2A_GG was reconstituted into nanodiscs using MSP1E3D1 that was chemically biotinylated as described above. The efficiency of biotinylation was subsequently evaluated by capture using streptavidin-coated paramagnetic particles (Promega). Selection for Fabs was performed starting with Fab Library E35,36 (kindly prepared by S. Mukherjee). Targets and the library were first diluted in Selection Buffer (20 mM HEPES, pH 7.4, 150 mM NaCl, 1% BSA). Five rounds of sorting were performed using a protocol adapted from published protocols27,37. In the first round, biopanning was performed manually using 300 nM of MFSD2A_GG, which was first immobilized onto magnetic beads and washed three times with Selection Buffer. The library was incubated for one hour with the immobilized target, beads were subsequently washed three times with Selection Buffer, and then beads were used to directly infect log-phase E. coli XL-1 Blue cells. Phage were amplified overnight in 2XYT media supplemented with ampicillin (100 μg/mL) and M13-K07 helper phage (109 pfu/mL). To increase the stringency of selection pressure, four additional rounds of sorting were performed by stepwise reduction of the target concentration: 150 nM in the 2nd round, 50 nM in the 3rd round, and 25 nM in the 4th and 5th rounds. These rounds were performed semi-automatically using a KingFisher magnetic beads handler (Thermo). For each round, the amplified phage population from each preceding round was used as the input pool. Additionally, amplified phage were pre-cleared prior to each round using 100 μL of streptavidin paramagnetic particles, and 1.5 μM of empty MSP1E3D1 nanodiscs were used throughout the selection as competitors in solution. For rounds 2–5, prior to infection of log-phage cells, bound phage particles were eluted from streptavidin beads by 15-minute incubation with 1% Fos-choline-12 (Anatrace).
Single-point phage ELISA to validate Fab binding to MFSD2A
96-well plates (Nunc) were coated with 2 μg/mL Neutravidin and blocked with Selection Buffer. Colonies of E. coli XL-1 Blue cells harboring phagemids from the 4th and 5th rounds were used to inoculate 400 μL 2XYT media supplemented with 100 μg/mL ampicillin and 109 pfu/mL M13-KO7 helper phage, and phage were subsequently amplified overnight in 96-well deep-well blocks with shaking at 280 rpm. Amplifications were cleared of cells with a centrifuge step and then diluted 10-fold into ELISA Buffer (Selection Buffer with 2% BSA). All phage were tested against wells with immobilized MFSD2A_GG (25 nM) or biotinylated empty MSP1E3D1 nanodiscs (50 nM). Phage ELISA was subsequently performed as previously described27,38 where the amount of bound phage was detected by colorimetric assay using an anti-M13 HRP-conjugated monoclonal antibody (GE Healthcare). Wells containing empty nanodiscs or buffer alone were used to determine non-specific binding.
Fab cloning, expression and purification
Specific binders based on phage ELISA results were sequenced at the University of Chicago Comprehensive Cancer Center DNA Sequencing facility and unique clones were then sub-cloned into the Fab expression vector RH2.2 (kind gift of S. Sidhu) using the In-Fusion Cloning kit (Takara). Successful cloning was verified by DNA sequencing. Fabs were then expressed and purified as previously described38. Following purification, Fab samples were verified for purity by SDS-PAGE and subsequently dialyzed overnight in 20 mM HEPES, pH 7.4, 150 mM NaCl.
Assessment of Fab binding affinity to MFSD2A
In order to measure the apparent binding affinity, multi-point ELISAs using each purified Fab were performed in triplicate. Briefly, MFSD2A_GG (25 nM) or empty biotinylated-MSP1E3D1 nanodiscs (50 nM) were immobilized onto 96-well plates coated with Neutravidin (2 μg/mL). Fabs were diluted serially 3-fold into ELISA buffer using a starting concentration of 3 μM, and each dilution series was tested for binding to wells containing either MFSD2A_GG, empty nanodiscs, or no target at all. The Fab ELISA was subsequently performed as previously described27,38, where the amount of bound Fab was measured by a colorimetric assay using an HRP-conjugated anti-Fab monoclonal antibody (Jackson ImmunoResearch). Measured A450 values were plotted against the log Fab concentration, and EC50 values were determined in GraphPad Prism version 8.4.3 using a variable slope model assuming a sigmoidal dose response.
MFSD2A complex formation with the Fab 2AG3
Following BSA-LPC-18:1 incubation, the nanodisc-reconstituted MFSD2A_GG was incubated with Fab 2AG3 on ice for 2 h using a 1:3 molar ratio of protein to Fab. The MFSD2A_GG–2AG3 complex was concentrated to 500 μL, filtered, and loaded on a Superdex 200 Increase 10/300 GL size-exclusion column in gel-filtration buffer (20 mM HEPES pH 7.0 and 150 mM NaCl).
Single-particle cryo-EM vitrification and data acquisition
Size exclusion purified MFSD2A_GG-2AG3 complex was concentrated to 1 mg ml−1 using a 50 kDa concentrator (Amicon). In brief, 3 μl of sample was added to a plasma-cleaned (Gatan Solarus) 1.2/1.3-μm holey gold grid (Quantifoil UltrAuFoil) which was incubated for 30 s at 6 °C and >90% humidity after which it was blotted on two sides for 5.5–12.5 s and vitrified in liquid ethane using an FEI Vitrobot. Micrographs were recorded on a Titan Krios electron microscope (FEI) equipped with an energy filter and a K3 direct electron detector (Gatan) using a 0.83 Å pixel size. An energy filter slit width of 20 eV was used during the collection and was aligned automatically every hour using Leginon39. Data collection was performed using a dose of 58 e− Å−2 across 50 frames (50 ms per frame) at a dose rate of approximately 16.0 e− per pixel per second, using a set defocus range of −1.75 μm to −2.5 μm. A 100-μm objective aperture was used. In total, 15,516 micrographs were recorded using a beam-image shift data-collection strategy40. Ice thickness was monitored after every fourth exposure using the Leginon zero-loss peak algorithm41 and was determined to have a mean ± S.D. of 23.9 ± 13.4 nm.
Data processing
Unless otherwise stated, all cryo-EM data processing was performed using CryoSPARC v.2.1542 (Extended Data Fig. 3). Video frames were aligned using Patch Motion Correction using a B-factor of 500 after which Contrast Transfer Function (CTF) estimations were made using the Patch CTF estimation tool. Micrographs were then sorted based on CFT estimations, defocus, total frame motion, and ice thickness. Particle picking from the resultant 13,300 micrographs was performed using TOPAZ43 as implemented in CryoSPARC. A total of 5,049,988 particles were extracted with a box size of 360 pixels and 5x binning. These particles were sorted using iterative rounds of 2D-classification into groups which contained either monomeric MFSD2A_GG particles with Fab bound (814,909 particles), dimeric MFSD2A_GG particles with Fab bound (98,270 particles), monomeric and dimeric MFSD2A_GG particles without Fab bound (656,065 particles), or low-resolution particles. Whether the dimeric particles imaged represent a physiological dimer or not remains unknown, but regardless, no high-resolution information could be obtained from these dimeric particles. The 814,909 monomeric MFSD2A_GG-Fab particles were then further sorted using the same 2D-classification procedure to a subset of 212,305 particles. These particles were then re-extracted without binning and further refined using heterogeneous refinement with input volumes created by multiclass ab initio. The highest resolution class from this heterogeneous refinement contained 175,738 particles which allowed for a 3.22 Å model to be reconstructed using non-uniform refinement, however, this map was severely anisotropic. To obtain a more isotropic reconstruction, we went back to the 212,305 MFSD2A_GG-Fab particles selected via 2D classification and performed multiclass ab initio, followed by heterogeneous refinement to obtain a sub-set of 73,380 particles which when further refined using non-uniform refinement resulted in an isotropic 3.55 Å reconstruction. Further refinement was then performed using local refinement in concert with non-uniform refinement. The best reconstruction was generated by local refinement incorporating the non-uniform refinement algorithm, using the isotropic map from the 73,380-particle subset as an initial model, but refined using the 175,738-particle subset. Refinement was performed with a mask around MFSD2A_GG and the variable region of the Fab, using an initial lowpass resolution of 10 Å, searching over a range of 10 degrees in orientations and 3 Å in shifts.
Structural model building, refinement, and analysis
To build the MFSD2A_GG model we first made a homology model based on the structure of the related transporter Lactose Permease LacY (PDB ID 2V8N)44 using CHAINSAW45 implemented in CCP4i246. The model was fit to the map in UCSF Chimera47 and transferred to Coot48–50 for manual model building using secondary structure predictions from the XtalPred server51 as an additional guide. For Fab model building, the Fab portion of the deposited ABC transporter Fab complex (PDB 4NNP)52 was used as a starting template. We observed extra density that could not be accounted for by the protein extending out from two residues N218 and N227, into which we were able to fit NAG moieties, consistent with predicted glycosylation sites51. An additional non-protein density was observed within the intracellular cavity that extended out between TM helices 5, 8 and 10. We assigned this density as LPC-18:3, consistent with our native mass spectrometry analysis. Model refinement and adjustment was performed in Coot48–50, Phenix53, and Namdinator54 iteratively until no further improvements were observed. A cavity search using the Solvent Extractor from Voss Volume Voxelator server55 was performed using an outer-probe radius of 10 Å and inner-probe radius of 1.75 Å.
Amino acid sequence alignments
To analyse the sequence conservation across MFSD2A and MFSD2B variants, we aligned seven MFSD2A and seven MFSD2B amino acid sequences using MUSCLE56. The MFSD2A sequences included Danio rerio (MFSD2A_DR; NCBI-BC085388), Xenopus tropicalis (MFSD2A_XT; NCBI-BC123088), Bos taurus (MFSD2A_BT; NCBI-BC149727), Gallus gallus (MFSD2A_GG; NCBI-XM_417826) Canis lupus familiaris (MFSD2A_CLF; NCBI-XP_532546), Homo sapiens (MFSD2A_HS; NCBI-NM_032793), and Mus musculus (MFSD2A_MM; NCBI-NM_029662). The MFSD2B sequences included: Xenopus tropicalis (MFSD2B_XT; UniProtKB - A4IH46), Bos taurus (MFSD2B_BT; NCBI- XM_010810291), Gallus gallus (MFSD2B_GG; NCBI- XM_004935790) Canis lupus familiaris (MFSD2B_CLF; NCBI-XM_005630178), Homo sapiens (MFSD2B_HS; NCBI-NM_001346880), and Mus musculus (MFSD2B_MM; NCBI-NM_001033488).
C14-LPC-Oleate into HEK293 cells
In-vitro uptake of the MFSD2A ligand, 14C-Lysophosphatidylcholine-oleate (14C -LPC-18:1) (ARC Radiochemicals) was tested as previously described7,23. In brief, HEK293 cells were transiently transfected with either MFSD2A_GG, MFSD2A_HS, or the Na+ binding deficient mutants, D92A and D97A respectively. Cells were transfected for 24 hours using 12-well plates Cells were then incubated with 50 μM LPC-18:1 diluted in serum-free DMEM (Gibco) for 30 minutes and washed twice in serum-free DMEM (Gibco) containing 0.5% fatty-acid free bovine serum albumin and harvested with RIPA buffer into 4 ml of scintillation fluid (Ecolite, MP-biopharmaceuticals). Disintegrations Per Minute (DPM) of the incorporated LPC-18:1 in each well of transfected HEK293 cells were counted using a scintillation counter (Tricarb, Perkin Elmer). Experiments were performed in triplicate using a 12-well plate.
Native mass spectrometry
Native mass spectra were recorded on a Q-Exactive HF Orbitrap with Ultra High Mass Range modifications (Thermo Fisher Scientific) using previously described methods57. The mass spectrometer was operated with spray voltages of 1.1−1.5 kV, and collisional activation was applied using Higher-energy Collisional Dissociation voltages of 60−100 V. Data were deconvolved and analysed using UniDec Version 4.3.058. Uncertainties were calculated from the standard deviation of masses measured at different charge states.
Cloning and mutagenesis for single-cell uptake assays
cDNA encoding mCherry was subcloned into pcDNA3.1 containing WT MFSD2A_HS – linked via a C-terminal Gly-Ser flexible linker motif (LEGGGGSGGGGSGGGGS). Mutations within the MFSD2A_HS gene were generated and re-inserted into the original pcDNA3.1-mCherry plasmid using restriction sites Nhe1 and EcoRV (New England Biolabs).
Single-cell LPC-NBD uptake assays and gating strategy
Single-cell uptake assays utilized WT MFSD2A_HS and mutant constructs with C-terminally-fused mCherry to detect protein expression, and LPC with a 4-chloro-7-nitrobenzofurazan fluorophore conjugated at the omega-carbon of a palmitoleoyl (16:1) acyl chain (LPC-NBD; a kind gift from Travecta Therapeutics) to measure uptake (Extended Data Fig. 6).
To perform these assays, 80–90% confluent HEK293 cells were transfected with WT or mutant MFSD2A_HS-mCherry constructs for 18 hours. Cells were washed once with serum free DMEM, after which they were incubated with LPC-NBD (delivered with BSA as previously described7) in serum- and phenol red-free DMEM for 30 mins at 37 °C with 5% CO2. Cells were then washed once with 0.5% fatty acid-free BSA in serum- and phenol red-free DMEM, and dislodged with trypsin using phenol red-free TrypLE for no more than 5 minutes. Cells were then resuspended in 0.5% BSA and 2% FBS in PBS to a concentration of 1.0 × 10⁶ cells/ml. mCherry and LPC-NBD fluorescence was then measured on a single cell basis using a BD LSR Fortessa Flow Cytometer.
Live single cell events were gated out from doublets and multiplets via sequential selection of populations through the area (A), width (W) and height (H) of the fluorescence intensities for forward (FSC) and sideward (SSC) scatters (Extended Data Fig. 6a)59. Single-cell uptake of LPC-NBD for WT and mutant MFSD2A_HS-mCherry transfected HEK293 cells was measured as a function of MFSD2A_HS-mCherry expression (Extended Data Fig. 6a). An increase in LPC-NBD uptake was observed with increasing WT MFSD2A_HS-mCherry expression until 104 mCherry fluorescence arbitrary units (A.U.), after which a decrease in LPC-NBD uptake was observed. Staining with the viability dye DAPI (Life Technologies) revealed that this high MFSD2A_HS-mCherry expressing population had increased DAPI signal upon staining indicating cell death (population d in Extended Data Fig. 6a) and thus this population was excluded from further analysis. For each experiment on a given day, a gate – based on WT and D97A (corresponding to MFSD2A_GG D92A and used throughout as a negative control) expressing cells – was set to include the highest expressing viable cells exhibiting a linear correlation between mCherry and NBD fluorescence. Cells within these gates (indicated by a black rectangle in Extended Data Fig. 6) were analysed to evaluate uptake of LPC-NBD by WT and mutant MFSD2A_HS-mCherry constructs using FlowJo. LPC-NBD uptake was normalized to mCherry expression and represented as a % of WT collected in the same experiment ± S.E.M.
LPC-NBD concentration responses for cells expressing WT and D97A MFSD2A_HS-mCherry were performed using 0.1, 0.5, 1, 2, 5, and 10 μM LPC-NBD to determine the optimal concentration of LPC-NBD to assess mutant uptake activity (Extended Data Fig. 6b). The concentration for half maximal LPC-NBD uptake (EC50) and Hill coefficient (n) were calculated as 4.3 μM and 1.7, respectively using a derivation of the Hill equation with a variable slope where y is the LPC-NBD fluorescence, and ‘top’ and ‘bottom’ are the minimum and maximum values observed for y:
Nonlinear regression analysis was performed using GraphPad Prism version 8.4.3.
To assess uptake activity of mutant MFSD2A_HS proteins, we measured uptake of 2 μM LPC-NBD by individual cells expressing equivalent amounts of transporter-mCherry fusions (Fig. 2e and Extended Data Fig. 6c, d) as described above.
For LPC-18:3 (produced as previously described11) competition experiments, uptake of 2 μM LPC-NBD was measured in the presence of increasing concentrations of LPC-18:3 as described above, and data were normalized to the mean uptake for WT in absence of LPC-18:3 from the same day.
Thin Layer Chromatography analysis
To confirm that LPC-18:3 is transported by MFSD2A as opposed to binding without transport, we used Thin Layer Chromatography (TLC) to detect intracellular conversion of LPC-18:3 to PC-18:3 by phospholipases in cells expressing either WT or the transport deficient mutant D97A MFSD2A_HS7. HEK293 cells adhered on 12-well plates were transfected with either pcDNA 3.1 WT MFSD2A_HS or D97A in triplicate. 24 hours after transfection, cells were washed once with serum-free DMEM (Gibco), incubated in 100 μM LPC-18:3 (as a BSA/LPC complex as previously described7) for 1 hour, and then washed with PBS containing 0.5 % serum-free BSA twice to remove unbound lipids. Two sequential rounds of lipid extraction from the treated cells were then performed, each for 30 minutes using 3:2 Hexane:Isopropanol (HIP) solution. Extracted lipids for each construct were then pooled, dried down, reconstituted in 50 μl of chloroform and spotted onto and run on TLC plates (Millipore) using 65:25:4 Chlorofrom:Methanol:Water as the mobile phase. Plates were then saturated with 5% cupric acetate/15% phosphoric acid and heated in a 180°C oven for 10 minutes to visualize the phospholipid bands. Bands on the TLC plate were quantified using Image studio.
Molecular Constructs for atomistic molecular dynamics (MD) simulations
For the computational simulations described in this work, a full-length model of MFSD2A_GG was built by computationally predicting 3D fold of the segments missing from the cryo-EM structure. Using Rosetta60, we first constructed 3D models of the N-terminal (residues 1–35) and the C-terminal (residues 506–528) segments. Using Modeller v961, we then docked the termini onto the cryo-EM model and completed the structure by modeling in the missing segment of the intracellular loop 3 (residues 268–279). For the Rosetta calculations, 1000 structures were generated and clustered using the Rosetta clustering algorithm (with ‘input_score_filter’ flag set to −50.0, and ‘radius’ set to 4). The lowest energy conformation from the top cluster was then selected for the subsequent docking step. In Modeller, 100 structures were generated using loop refinement module. The predicted structures were assessed with the Modeller scoring function (molpdf), and the model with the lowest score was selected.
Using CHARMM-GUI web server62, the full-length MFSD2A_GG structure (MFSD2AFULL) was embedded into a membrane containing 483 POPC (1-palmitoyl-2-oleoyl-glycero-3-phosphocholine) lipids. The complex was then solvated and ionized with either 150 mM Na+Cl− or 150 mM Li+Cl−. The final size of the systems was ~227000 atoms. For comparison, we also built the MFSD2A_GG model which was missing the termini segments (as in the cryo-EM structure) but had the residues 268–279 modeled in (MFSD2AΔTER). This construct was also embedded into a POPC lipid membrane (487-lipid size) and surrounded by water box containing either 150 mM Na+Cl− or Li+Cl− salt (total system size of ~214000 atoms).
Atomistic MD simulations in POPC membranes
The four systems (MFSD2AFULL and MFSD2AΔTER either in Na+Cl− or Li+Cl− solution) were subjected to short equilibration runs with NAMD 2.1363 using a standard set of equilibration scripts provided by CHARMM-GUI. After this initial equilibration, the velocities of all the atoms were randomly regenerated and the systems were subjected to ensemble MD simulations whereby each construct was simulated in 6 independent replicates. For the systems with Na+Cl−, each replicate was run for ~950 ns (~11.4 μs overall simulation time), and for the constructs containing Li+Cl−, each replicate was run for ~450 ns (~5.4 μs overall simulation time). Since we did not observe any notable difference in the conformational dynamics of the MFSD2AFULL and MFSD2AΔTER constructs, we present combined analysis of the simulations stemming from these two constructs (referred to simply as MFSD2A_GG throughout the results). The ensemble MD simulations were carried out with OpenMM 7.464 and implemented PME for electrostatic interactions. The runs were performed at 310 K temperature, under NPT ensemble using semi-isotropic pressure coupling, and with 4fs integration time-step (with mass repartitioning). Monte Carlo barostat and Langevin thermostat were used to maintain constant pressure and temperature, respectively. Additional parameters for these runs included: “friction” set to 1.0/picosecond, “EwaldErrorTolerance” 0.0005, “rigidwater” True, and “ConstraintTolerance” 0.000001. The van der Waals interactions were calculated applying a cutoff distance of 12 Å and switching the potential from 10 Å.
Atomistic MD simulations of the cryo MFSD2A-LPC-18:3 complex
MFSD2AFULL with LPC-18:3 bound as in the cryo-EM structure was embedded into the same simulation box as described above, containing POPC membrane and 150 mM Na+Cl− ionic solution. The system was equilibrated using the same approach as detailed above and simulated in 24 independent replicates. Each replicate was run for ~650 ns (~15.6 μs overall sampling time). These ensemble runs were performed with OpenMM 7.464 and with the same run parameters described above.
Atomistic MD simulations with externally placed lysolipid substrates
To construct a system with externally placed LPC-18:1, LPC-18:3, or LPC-DHA, we selected a frame from the simulations of MFSD2AFULL in Na+Cl−, in which the IC-gate was open, but no POPC head group or Na+ ion penetrated the IC vestibule (Supplementary Note and Extended Data Fig. 9). In this frame, we replaced a POPC lipid at the IC-gate (i.e., near residues M182 and W403, see Results) with either LPC-18:1, LPC-18:3, or LPC-DHA. This replacement was achieved by aligning the lysolipids with the selected POPC lipid (using the phosphorus atoms of the two lipids as the reference group) and then removing the POPC lipid from the system. The resulting molecular constructs were energy minimized (for 3000 steps) and briefly equilibrated (for 0.12 ns). The systems were then subjected to ensemble MD simulations in which 24 independent replicates were run (~620 ns each, totaling ~15 μs simulation time). These simulations were also carried out with OpenMM 7.464 and used the same set of parameters described above. For all simulations we used the latest CHARMM36m force-field for proteins and lipids65, as well as recently revised CHARMM36 force-field for ions which includes non-bonded fix (NBFIX) parameters for Na+[66].
Dimensionality reduction with the tICA approach
To facilitate analysis of conformational dynamics in the simulations, we performed dimensionality reduction using tICA (time-lagged independent component analysis)67 as previously described68–71. Briefly, the tICA approach uses MD simulation trajectories to construct two covariance matrices, one being a time-lagged covariance matrix (TLCM): CTL(τ)=<X(t)XT(t+τ)> and the other the usual covariance matrix C=<X(t)XT(t)>, where X(t) is the data vector at time t, τ is the lag-time of the TLCM, and the symbol <…> denotes the time average. To identify the slowest reaction coordinates of the system, the following generalized eigenvalue problem is solved: CTLV = CVΛ, where Λ and V are the eigenvalue and eigenvector matrices, respectively. The eigenvectors corresponding to the largest eigenvalues define the slowest reaction coordinates. These reaction coordinates depend on the choice of data vector X, i.e., the choice of collective variables (CV). To define the tICA space used, the following dynamic measures as CVs were extracted from the analysis of the MD trajectories: 1) distance between any atom of E312 and the nearest cation (Na+ or Li+ in the respective simulations); 2) distance between any atom of Q52 and the nearest cation (Na+ or Li+ in the respective simulations); 3) distance between any atom of D92 and the nearest cation (Na+ or Li+ in the respective simulations); 4) minimum distance between the following pairs of residues: D92-D88, D88-K436, D92-K436, R85-D88, R85-E312, M182-W403, and M182-F399; 5) Cα-Cα distance between the following pairs of residues: T183-P345, Q171-D411, and S234-V466; 6) number of water oxygens inside the protein cavity; 7) number of lipid atoms (POPC, LPC-18:1, or LPC-18:3) inside the protein cavity. A water oxygen was considered in the cavity if it was found within 5 Å of the sidechains of the following residues: 51, 55, 59, 63, 64, 68, 77, 81, 85, 89, 92, 181, 185, 189, 193, 197, 201, 316, 312, 309, 305, 398, 402, 428, 432, 436, 440, 444. A lipid atom was considered in the cavity if it was within 5 Å of the sidechains of the following residues: 181, 185, 189, 193, 312, 309, 305, 398, 402, 428, 432.
Markov State Model Construction
To perform Markov state model (MSM) analysis, we used Python 2.7.14 scripts included in MSMBuilder software72,73. Briefly, a transition count matrix (TCM) was built by counting the number of transitions among all microstates on the 2D tICA space, as previously described70. To satisfy detailed balance and local equilibrium, the TCM was then symmetrized using its transpose matrix72. Furthermore, to obtain the transition probability matrix (TPM), the probabilities of transitions among all microstates were calculated by normalizing the TCM. For this procedure, a lag-time of 160 ns was used to ensure Markovian behavior of the model.
Transition Path Theory analysis
In order to identify the most probable pathways, we applied TPT analysis as previously described70. Briefly, using a Robust Perron Cluster Analysis (PCCA+) algorithm74, the 50 microstates within the tICA space were consolidated into 16 macrostates based on their kinetic similarity. Using the Dijkstra graph theory algorithm75 implemented in the MSMbuilder software, a flux matrix76 was then constructed for macrostates, and the most probable pathways were identified as those with the highest flux between the starting macrostate and a final microstate.
Extended Data
Extended Data Figure 1 |. Biochemical characterization, functional validation, nanodisc reconstitution and Fab complex formation of MFSD2A_GG.
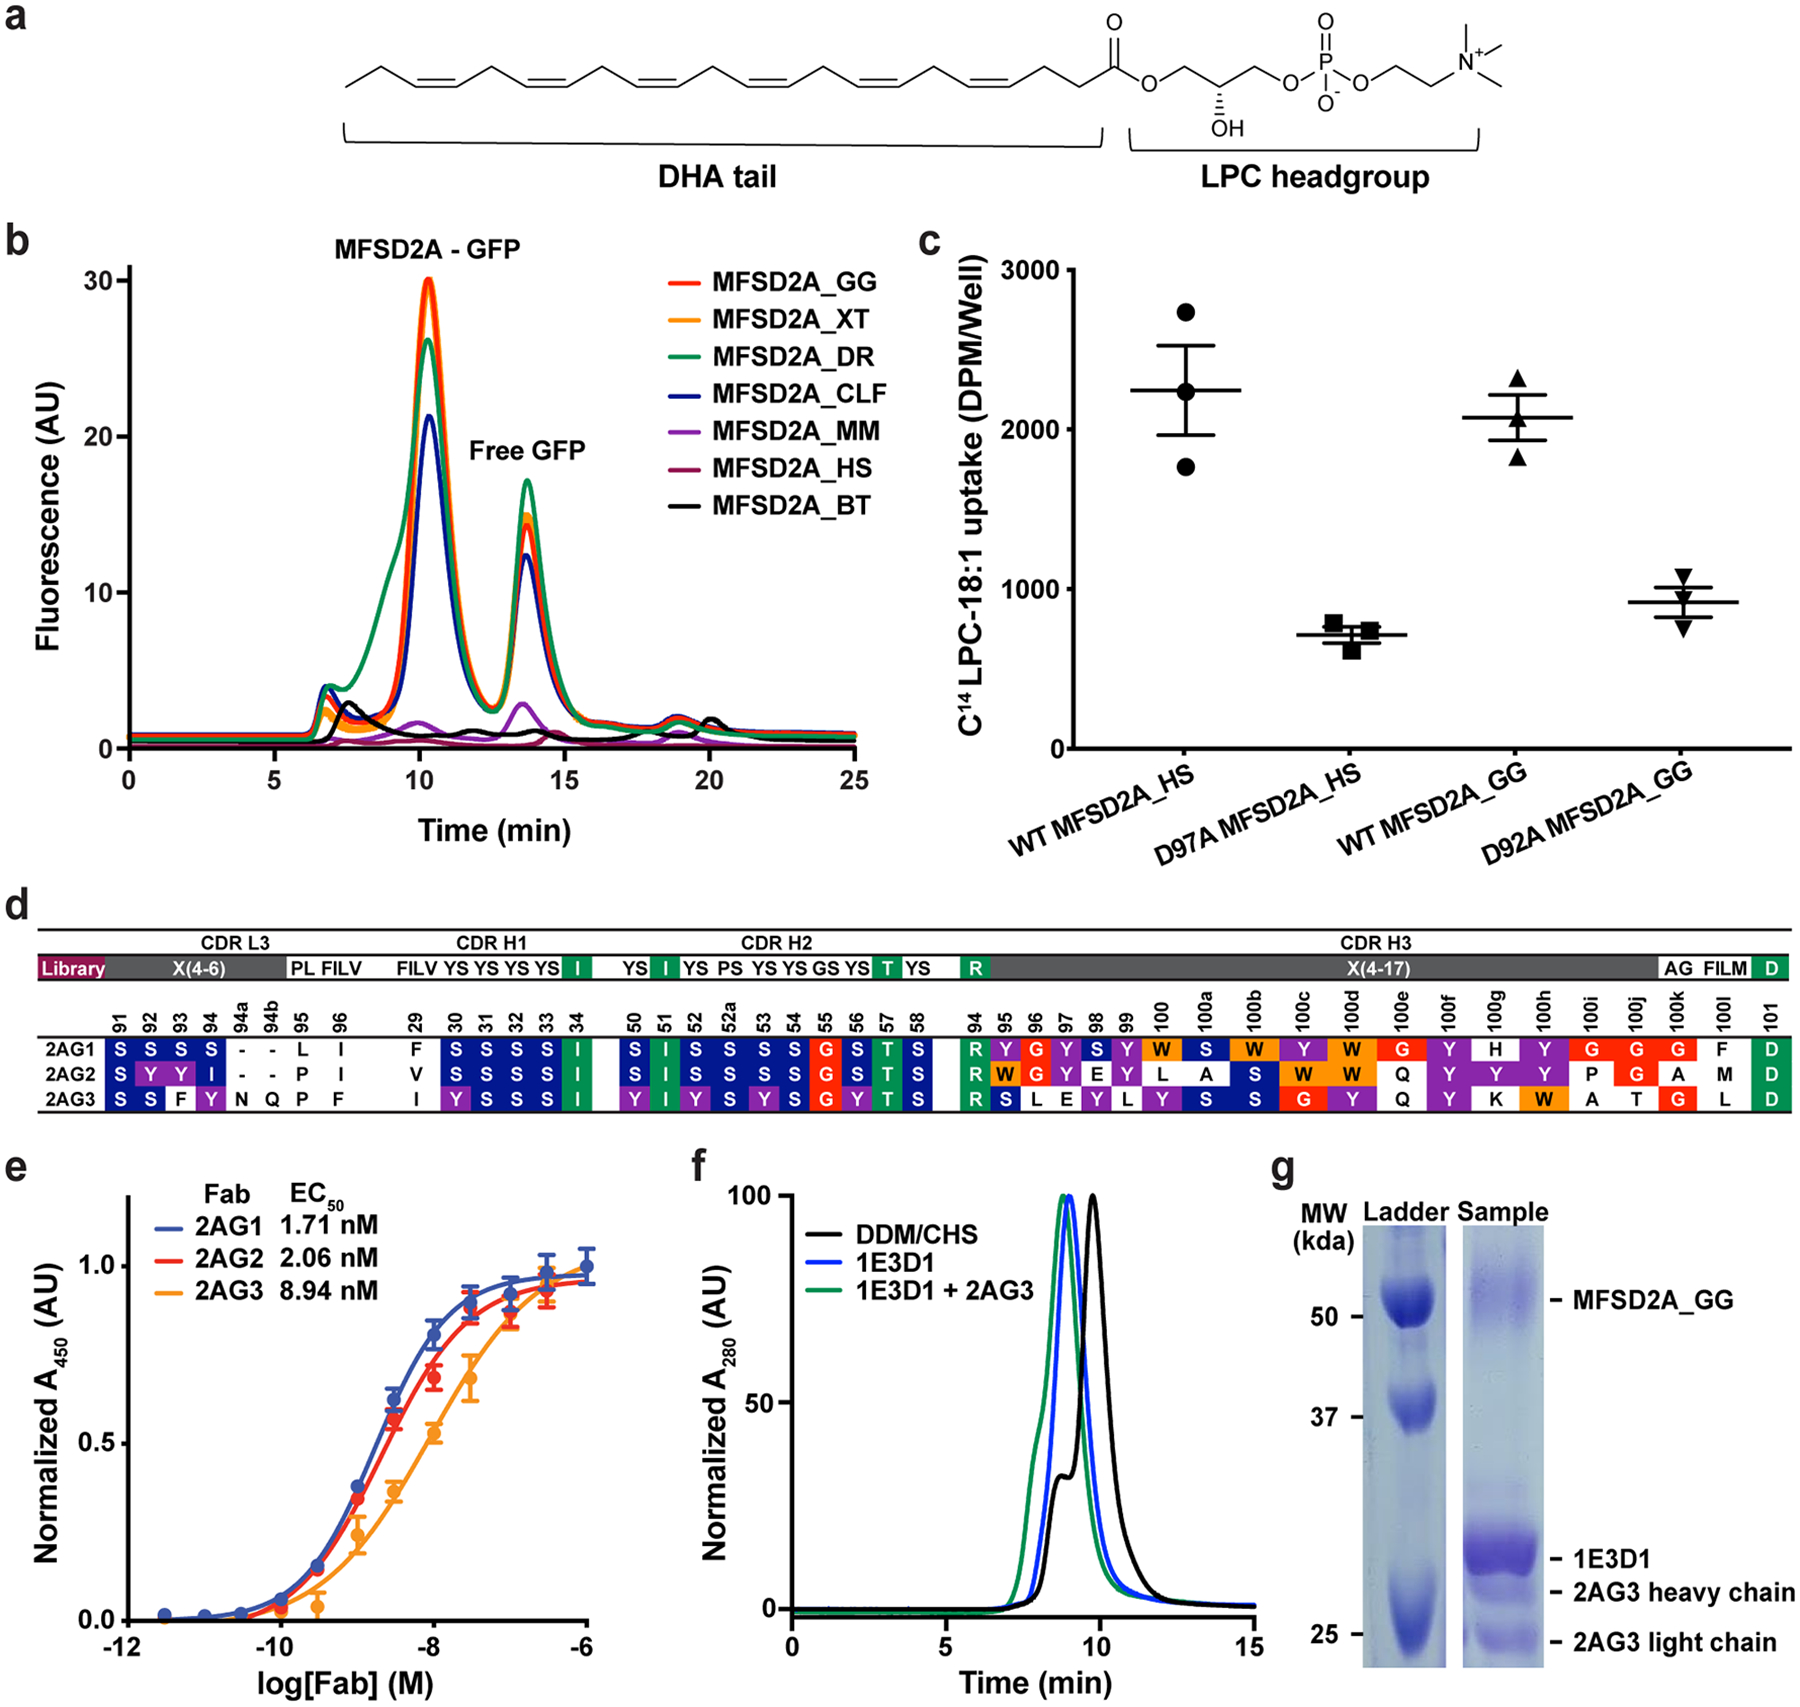
a, Chemical structure of LPC-DHA. b, Fluorescent size exclusion chromatography elution profiles of seven MFSD2A orthologs fused to green fluorescent protein. Orthologs screened are from Danio rerio (MFSD2A_DR; NCBI - BC085388), Xenopus tropicalis (MFSD2A_XT; NCBI-BC123088), Bos taurus (MFSD2A_BT; NCBI - BC149727), Gallus gallus (MFSD2A_GG; NCBI - XM_417826), Canis lupus familiaris (MFSD2A_CLF; NCBI - XP_532546), Homo sapiens (MFSD2A_HS; NCBI- NM_032793) and Mus musculus (MFSD2A_MM; NCBI- NM_029662). c, MFSD2A-mediated uptake of C14-LPC-18:1 into HEK293 cells transfected with either MFSD2A_HS or MFSD2A_GG WT and Na+-binding deficient mutant constructs (D97A and D92A, respectively). Uptake is expressed as mean ± S.E.M., and n=3 independent experiments. d, Complementarity-determining region (CDR) sequences of unique synthetic antigen binders (Fabs) panned for binding to MFSD2A_GG reconstituted in MSP1E3D1 nanodiscs. Enriched Tyr-Ser-Gly-Trp residues, which play an important role in antigen recognition, are highlighted in purple, blue, red, and orange, respectively, while other conserved residues are highlighted in green. Residues are numbered according to the Kabat system77. e, EC50 evaluation of purified Fabs 2AG1 (blue, 1.71 ± 0.03 nM), 2AG2 (red, 2.06 ± 0.08 nM), and 2AG3 (orange, 8.94 ± 0.08 nM) binding to MFSD2A_GG incorporated into MSP1E3D1 nanodiscs. Data points represent the mean ± S.D., and n=3 independent experiments. f, Normalised high-performance liquid chromatography elution profiles of MFSD2A_GG purified in DDM/CHS (black) and reconstituted in MSP1E3D1 nanodisc without (blue) and with (green) 2AG3 Fab bound. g, Representative SDS-PAGE gel of purified MFSD2A_GG reconstituted in MSP1E3D1 nanodisc with 2AG3 Fab bound. For gel source data, see Supplementary Figure 1.
Extended Data Figure 2 |. MFSD2A and MFSD2B multiple sequence alignment.
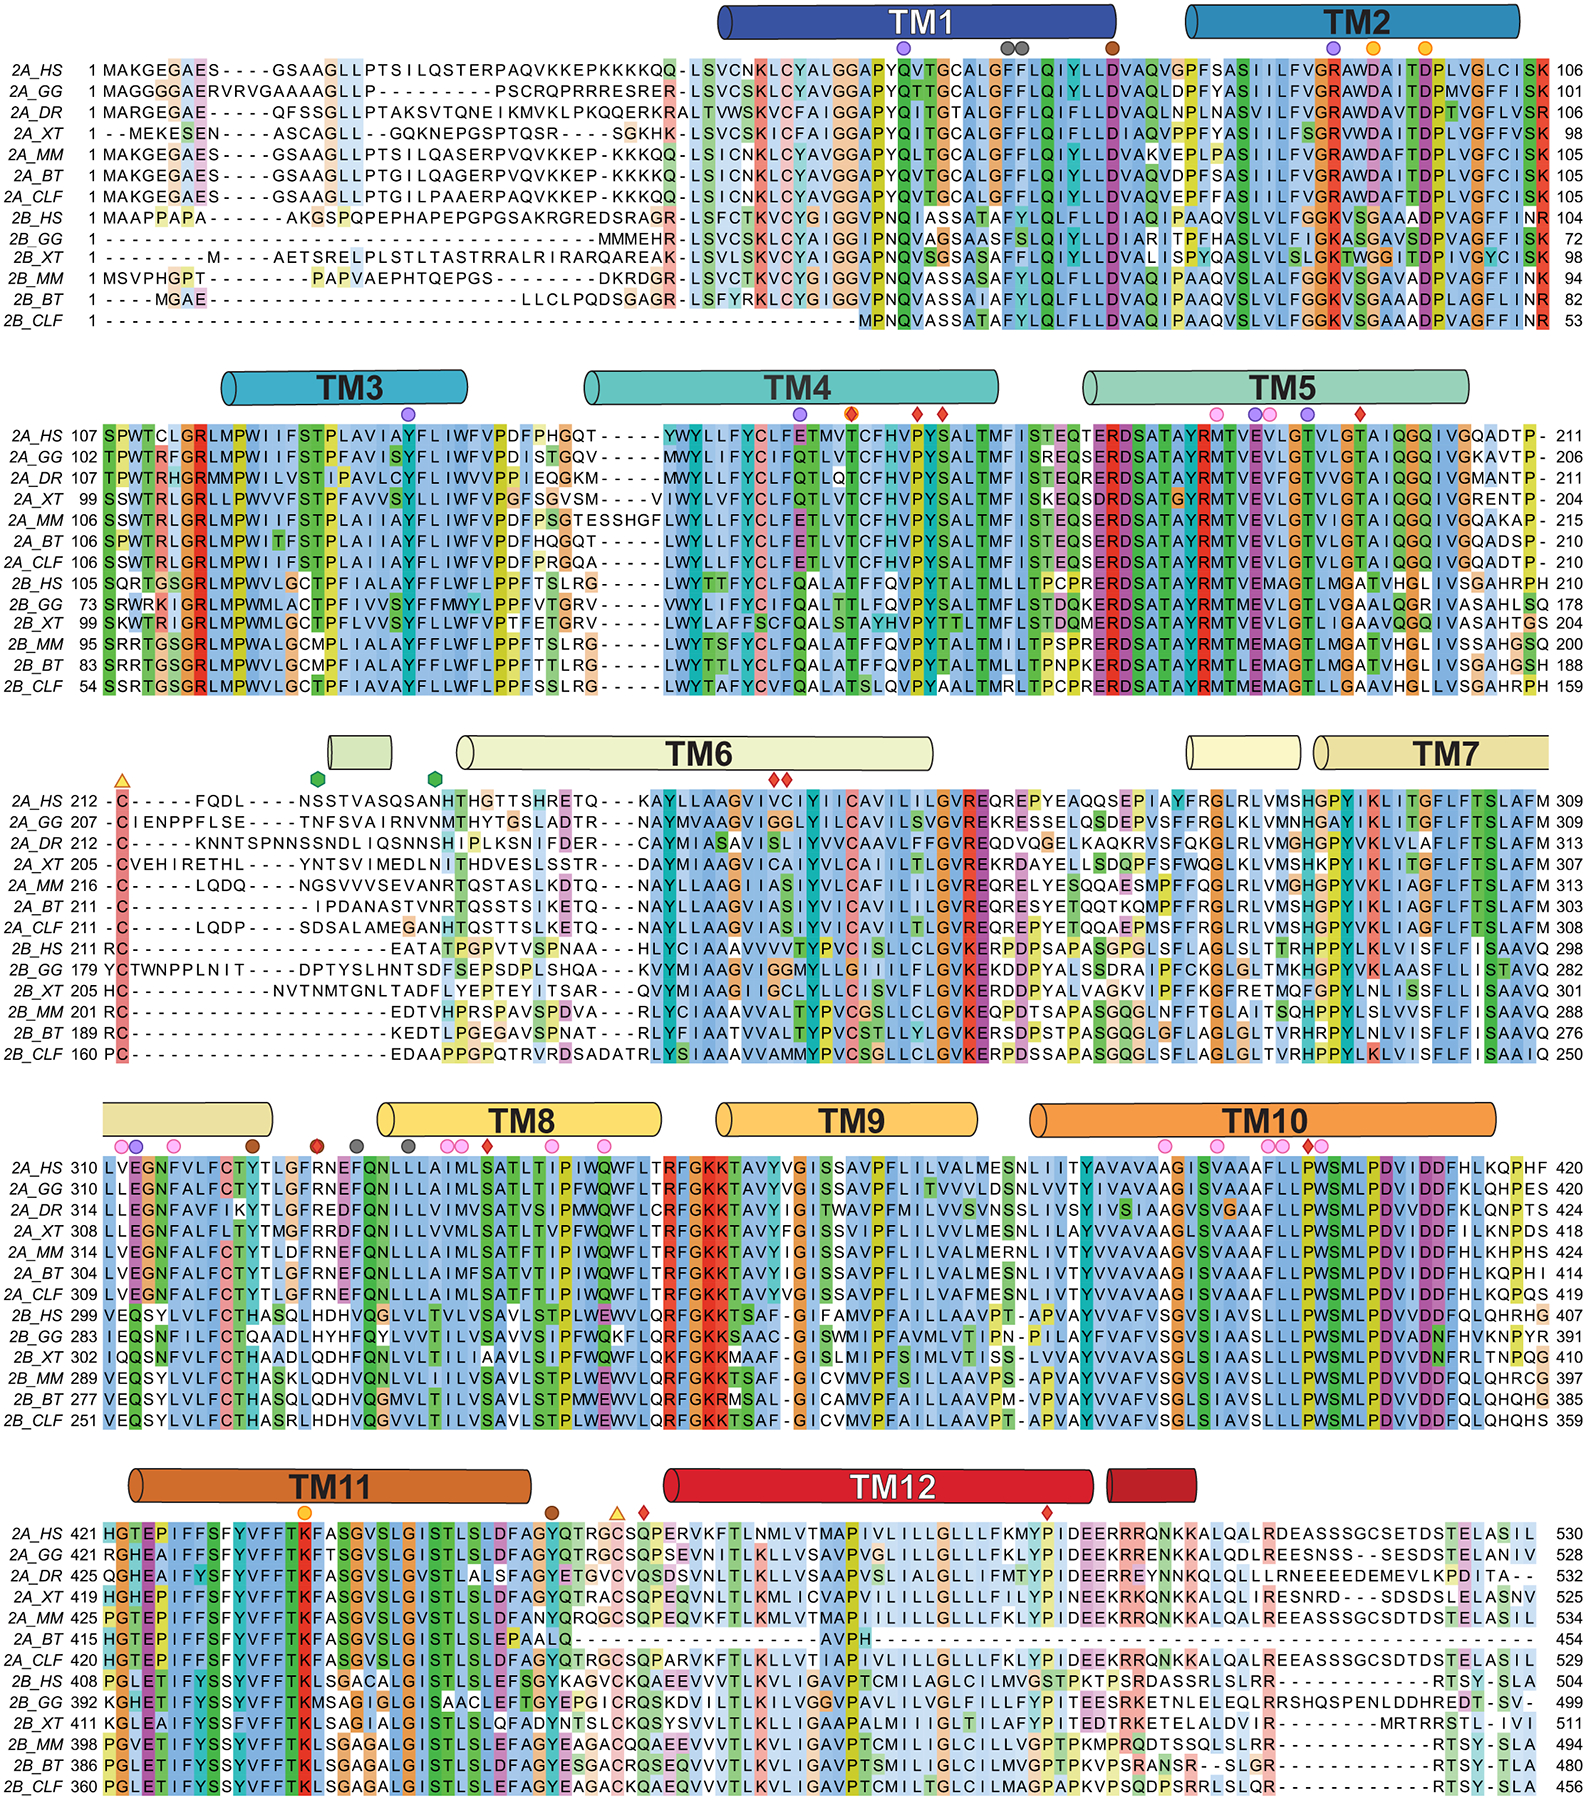
Seven MFSD2A and six MFSD2B variants were aligned using MUSCLE56 and visualized and coloured using Jalview with the ClustalX colour scheme78. The sequences aligned for MFSD2A are: Danio rerio (MFSD2A_DR; NCBI-BC085388), Xenopus tropicalis (MFSD2A_XT; NCBI-BC123088), Bos taurus (MFSD2A_BT; NCBI-BC149727), Gallus gallus (MFSD2A_GG; NCBI-XM_417826) Canis lupus familiaris (MFSD2A_CLF; NCBI-XP_532546), Homo sapiens (MFSD2A_HS; NCBI-NM_032793) and Mus musculus (MFSD2A_MM; NCBI-NM_029662). The sequences aligned for MFSD2B are: Xenopus tropicalis (MFSD2B_XT; UniProtKB - A4IH46), Bos taurus (MFSD2B_BT; NCBI- XM_010810291), Gallus gallus (MFSD2B_GG; NCBI- XM_004935790) Canis lupus familiaris (MFSD2B_CLF; NCBI-XM_005630178), Homo sapiens (MFSD2B_HS; NCBI-NM_001346880), and Mus musculus (MFSD2B_MM; NCBI-NM_001033488). Secondary structural elements are shown as cylinders, labelled, and coloured as in Fig. 1. Residues discussed throughout the manuscript are indicated with circles of the same colour used to highlight them in figure panels showing the structure. Additionally, red diamonds denote known disease-causing human mutations12,14–16, green hexagons denote glycosylation sites (in MFSD2A_GG), and yellow triangles denote two cysteines which form a disulphide crosslink.
Extended Data Figure 3 |. Cryo-EM workflow and analysis of the MFSD2A-Fab 2AG3 complex.
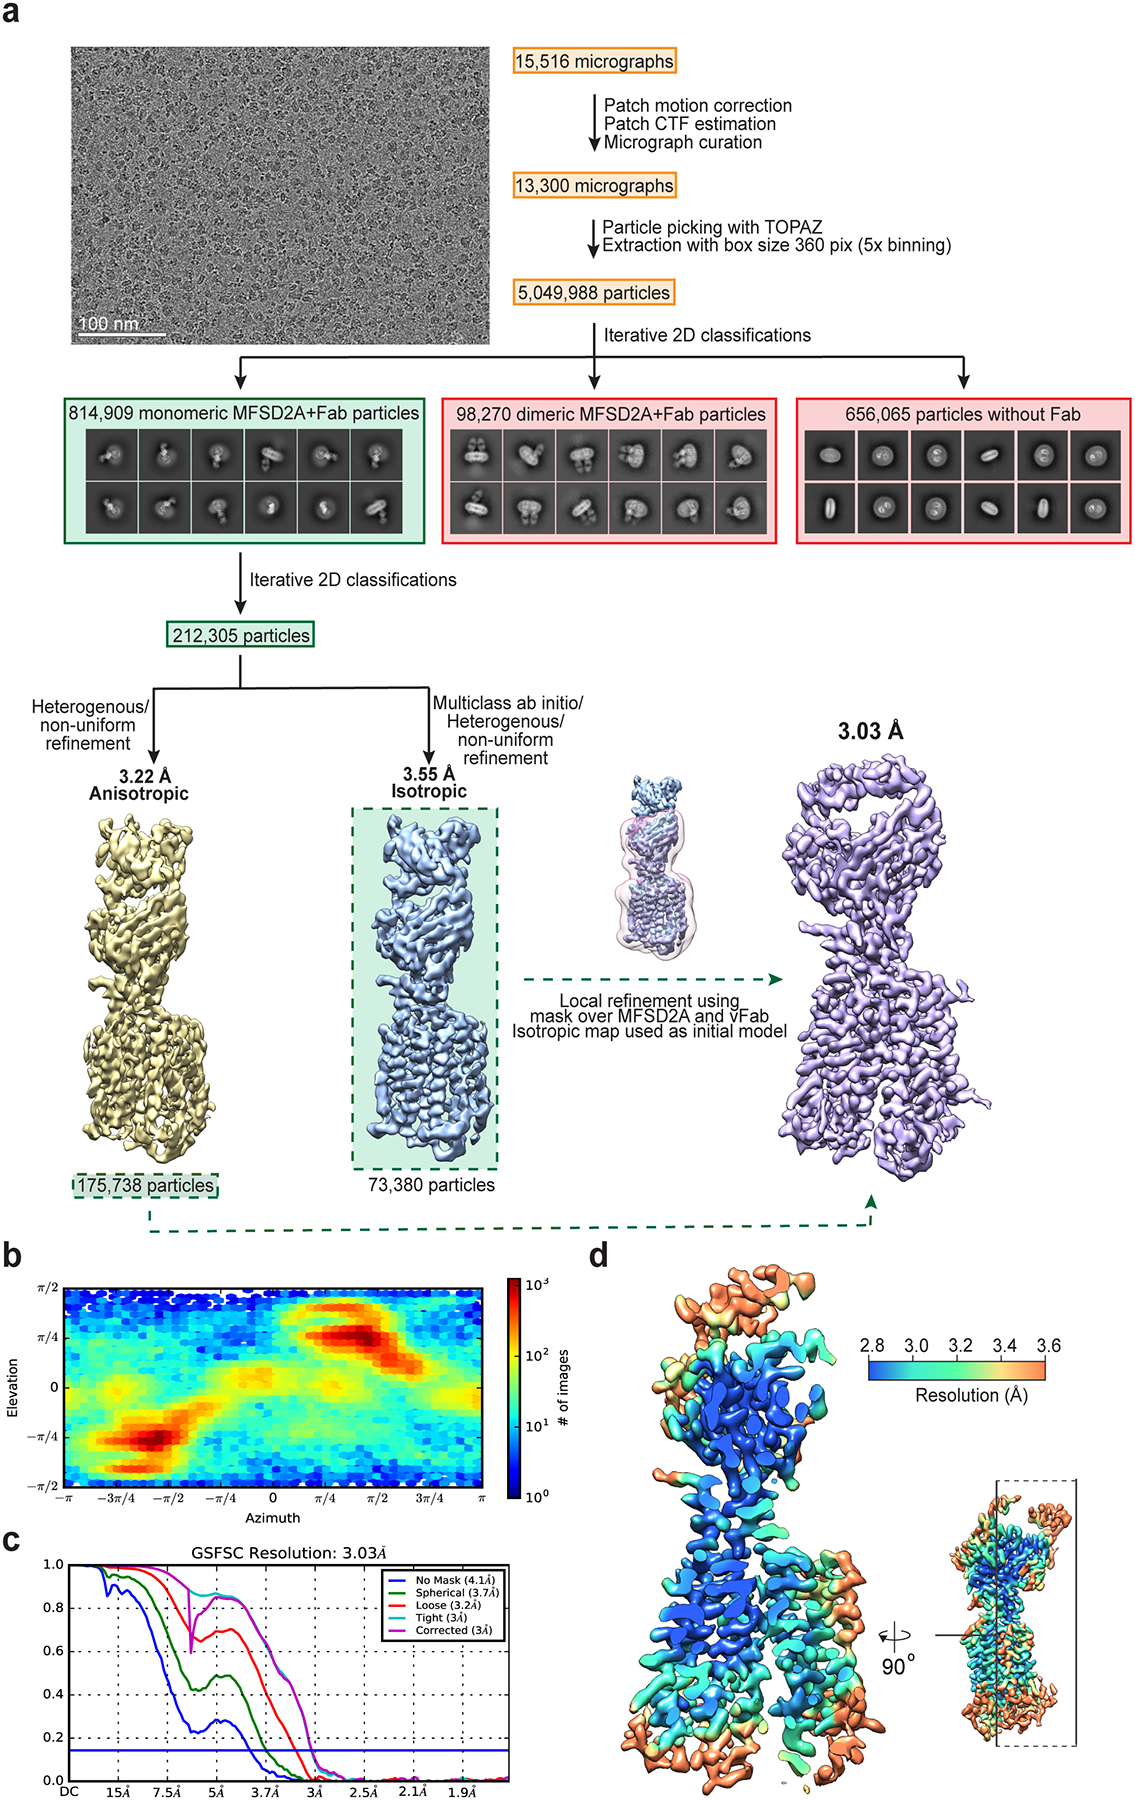
a, Flow chart outlining cryo-EM image acquisition and processing performed to obtain a structure of nanodisc-reconstituted MFSD2A_GG in complex with the Fab 2AG3. A representative micrograph and 2D class averages are shown. While 2D class averages of monomeric and dimeric MFSD2A_GG with and without bound Fab were observed, only monomeric particles with bound Fab (green) were used for the final reconstruction, while the others (red) were discarded. All processing was performed using CryoSPARC v.2.1542 (see Methods for details). b, Euler angle distribution plot of the final three-dimensional reconstruction of the MFSD2A_GG-Fab 2AG3 complex. c, Fourier shell correlation (FSC) curves for the MFSD2A_GG-Fab 2AG3 complex. d, Local resolution map of the MFSD2A_GG-Fab 2AG3 complex, with an orthogonal view indicating the location of the clipping plane.
Extended Data Figure 4 |. Fit of cryo-EM density with MFSD2A model.
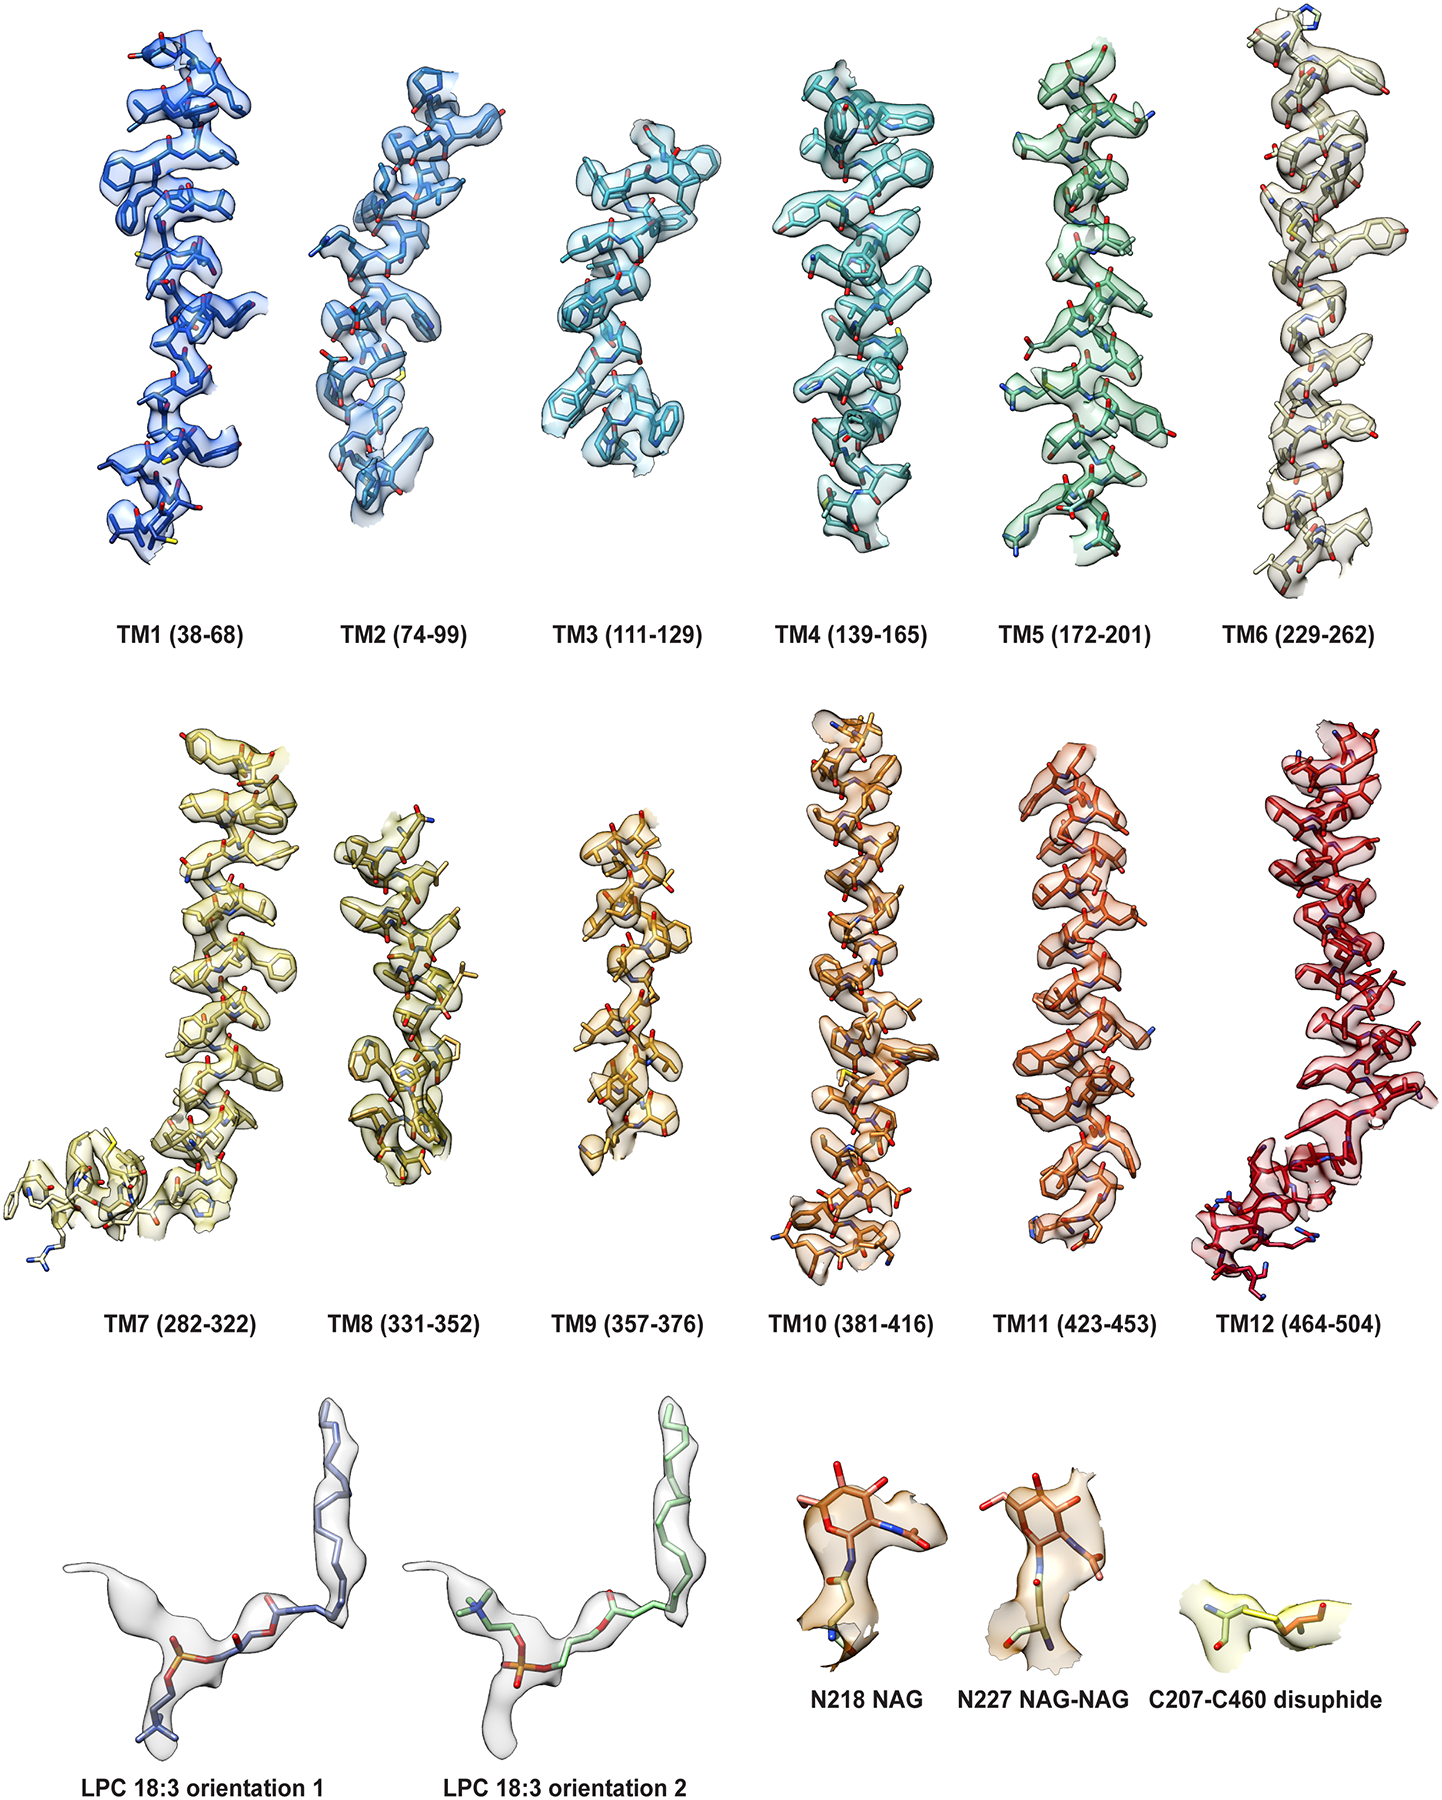
Cryo-EM densities (semi-transparent surface) are superimposed on structural elements of MFSD2A_GG including TM helices 1–12, C207-C460 disulphide crosslink, N-linked glycans, and bound LPC-18:3 in two possible conformations. TM helices are rendered as a cartoon with residue sidechains in stick representation and coloured as in Fig. 1, and the other features are also shown in stick representation.
Extended Data Figure 5 |. Characterization of an endogenous lysolipid bound to MFSD2A.
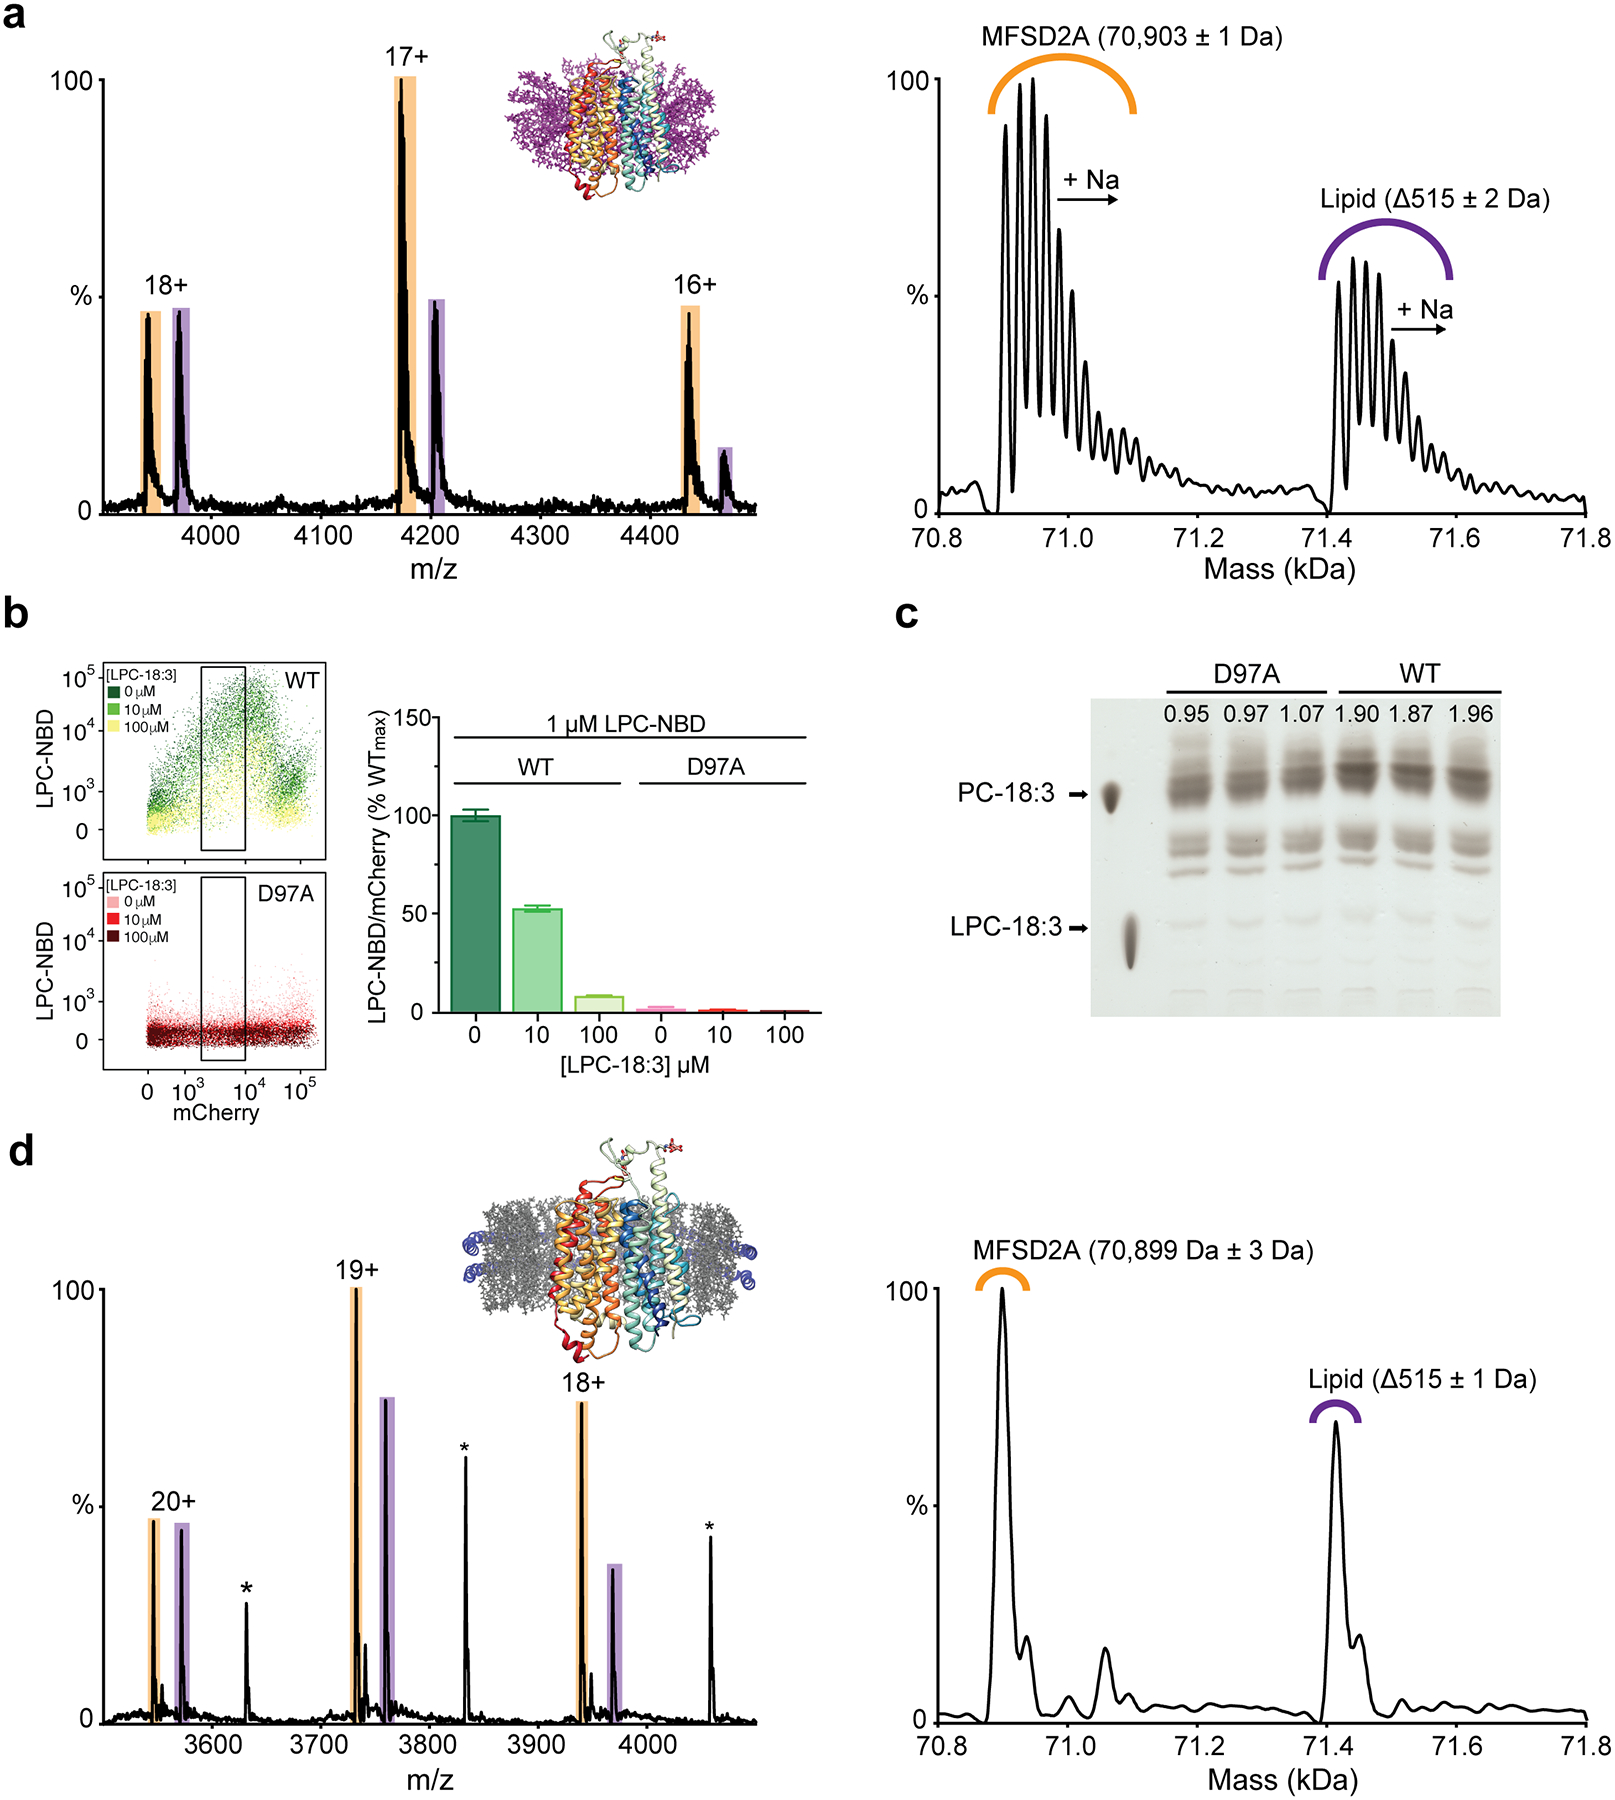
a, Native (left) and zero-charge deconvolved (right) mass spectra of MFSD2A_GG in DDM. Peaks corresponding to glycosylated MFSD2A_GG with no bound ligand are highlighted in orange, whereas peaks corresponding to glycosylated MFSD2A_GG with a bound lysolipid (515 Da) are highlighted in purple. b, Single-cell uptake of the fluorescent substrate LPC-NBD by cells expressing WT and D97A (corresponding to D92 in MFSD2A_GG) MFSD2A_HS-mCherry fusion constructs analysed by fluorescence-activated cell sorting. LPC-NBD uptake was measured in the presence of increasing concentrations of LPC-18:3 (number of cells analysed per condition ~900). Left panels show output from flow cytometric analysis (see methods and Extended Data Fig. 6 for details), and right panels show gated data normalized to mCherry expression and represented as a % of uptake by WT in the absence of LPC-18:3 (denoted as WTmax on axis), collected in the same experiment ± S.E.M. c, TLC analysis of cells expressing WT and D97A MFSD2A_HS showing intracellular conversion of LPC-18:3 to PC-18:3 as evidence for LPC-18:3 uptake7. Experiments were performed in triplicate and the quantified intensities of the PC bands are indicated for each lane. d, Native (left) and zero-charge deconvolved (right) mass spectra of MFSD2A_GG in POPG-filled MSP1E3D1 nanodiscs. Apo and lysolipid-bound peaks are coloured as in a, and those annotated with an asterisk correspond to an unassigned mass of 68,980 Da, which may be attributed to a glycan cleavage or truncation of the protein.
Extended Data Figure 6 |. Flow cytometry analysis and concentration response of MFSD2A_HS-mediated LPC-NBD uptake assays.
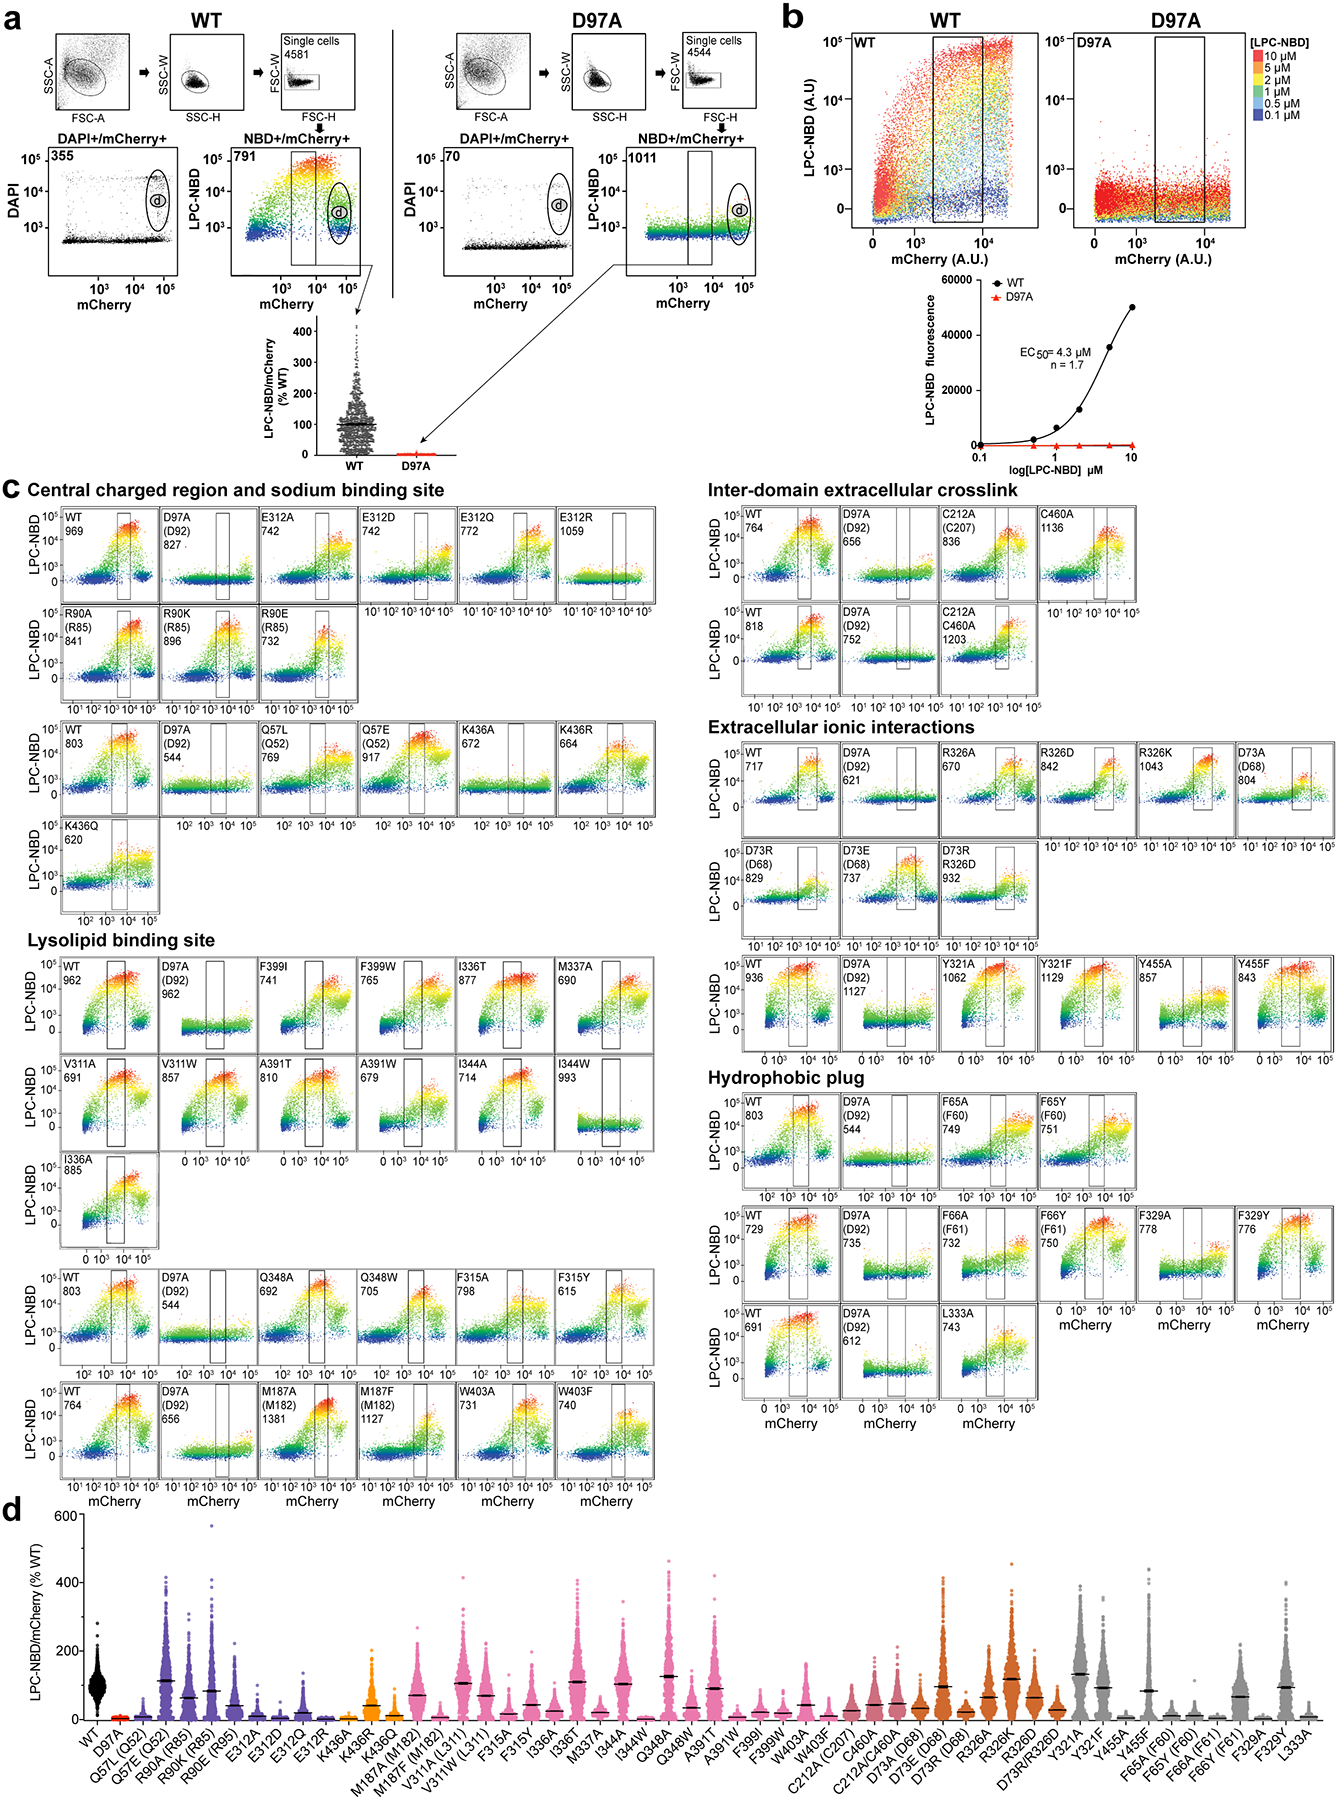
a, Upper panels: single cell events were separated from doublets for WT and D97A MFSD2A_HS-mCherry constructs via selection of populations through the area (A), width (W) and height (H) of the mCherry fluorescence intensities for forward (FSC) and sideward (SSC) scatter, performed in sequence as indicated by black arrows. Middle panels: Selected single cells (indicated by ovals and rectangles at each stage in the upper panels) were analysed for LPC-NBD and mCherry fluorescence, as well as viability. LPC-NBD fluorescence intensity is represented as a rainbow colour gradient from blue (low) to red (high). Viability was assessed by DAPI staining, and non-viable cells are annotated as ‘population d’ and number of non-viable cells is indicated in the top left corner of each respective plot. Gates for subsequent analyses were set as described in the methods and indicated by a black rectangle. The number of cells within each gate is indicated in the top left corner of each respective plot. Lower panel: scatter plot of single-cell uptake of LPC-NBD by gated cells expressing WT (black) and D97A (red) MFSD2A_HS-mCherry fusion constructs. LPC-NBD uptake was normalized to mCherry expression and represented as a % of WT ± S.E.M. Horizontal bar indicates the mean, and each point represents a single cell event. The number of cells plotted is indicated in the top left corner of the respective plot in the middle panel. b, Upper panel: uptake of increasing concentrations of LPC-NBD by single cells transfected with either WT or D97A MFSD2A_HS-mCherry constructs. Data were analysed as in a, and the number of cells analysed per condition was ~1000. Lower panel: LPC-NBD concentration response curves for WT (black) and D97A (red) MFSD2A_HS-mCherry fusion constructs. Hill coefficient (n) and concentration for half maximal LPC-NBD uptake (EC50) for WT are indicated on the graph. c, Flow cytometric analysis of LPC-NBD and mCherry fluorescence for WT and all analysed mutant MFSD2A_HS constructs. LPC-NBD fluorescence intensity is represented as a rainbow colour gradient from blue (low) to red (high). Gates and indicated by a black rectangle and the number of cells within each gate is shown in the top left corner of each plot. d, Scatter plot of single-cell uptake of LPC-NBD by gated cells expressing WT and mutant MFSD2A_HS-mCherry fusion constructs. LPC-NBD uptake was normalized to mCherry expression and represented as a % of WT ± S.E.M. Horizontal bar indicates the mean, and each point represents a single cell event. See panel c, for n-values for each construct assayed. The colour coding matches that used in Fig. 2 and Extended Data Fig. 11. Where residue number or identity differ between MFSD2A_HS and MFSD2A_GG the corresponding residue in MFSD2A_GG is also provided in parenthesis.
Extended Data Figure 7 |. tICA analysis identifies major conformational states sampled in MD simulations and reveals their structural characteristics.
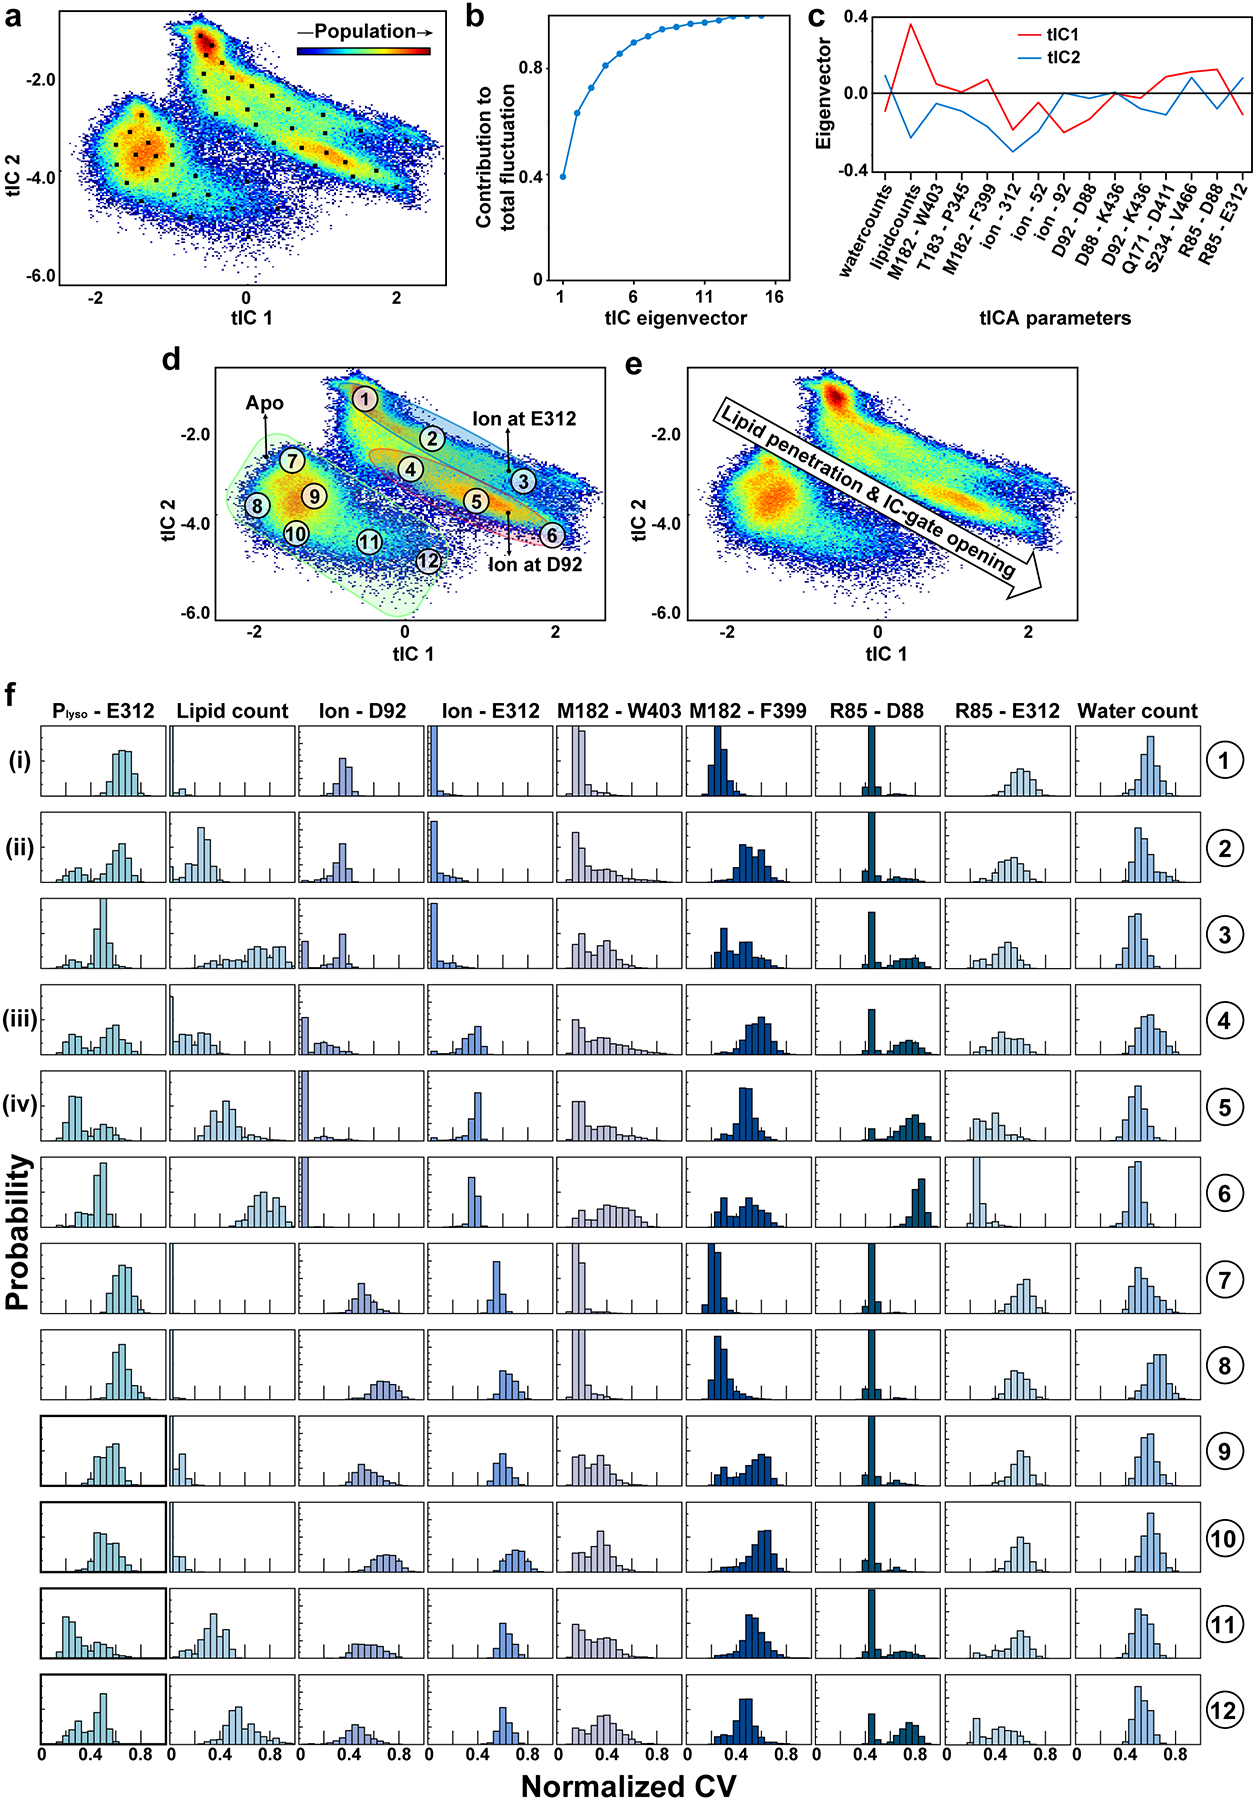
a, 2D landscape representing all MD trajectories mapped with the tICA transformation in the space of the first two tICA eigenvectors (tIC1 and tIC2). Population distribution within the 2D space is indicated by a colour gradient with the red and blue shades representing the most and least populated regions of 2D space, respectively. Locations of 50 microstates obtained from k-means clustering analysis of the tICA space are shown as small black squares. b, Contribution of each tICA vector to the total fluctuation of the system. c, Contributions of the collective variables (CVs) used as tICA parameters to tIC1 and tIC2. d, The 2D tICA space from panel a, highlighting 12 selected microstates (labelled 1–12) that describe structural properties of various conformational states of the system. The three shaded regions represent conformations of the protein with no ion bound (green shade), ion bound at D92 (red shade), and ion bound at E312 (blue shade). e, The 2D tICA space from panel a, re-drawn to show the direction of change in the extent of lysolipid penetration and IC-gate opening along the landscape. f, columns from left to right show probability distributions of the following CVs in the 12 microstates selected from panel d: vertical distance (Z) between lysolipid phosphorous atom (Plyso) and E312 Cα, number of lysolipid atoms in the intracellular cavity, minimum distances between any ion in the system and D92, between any ion in the system and E312, between M182 and W403, between M182 and F399, between R85 and D88, between R85 and E312, and number of water oxygen atoms in the intracellular cavity. The ranges of CVs were normalized so that the lowest and highest values for each variable correspond to 0 and 1, respectively. Corresponding state numbers for Fig. 3 are provided on the left-hand side as roman numerals.
Extended Data Figure 8 |. Lipid penetration into the intracellular cavity of MFSD2A.
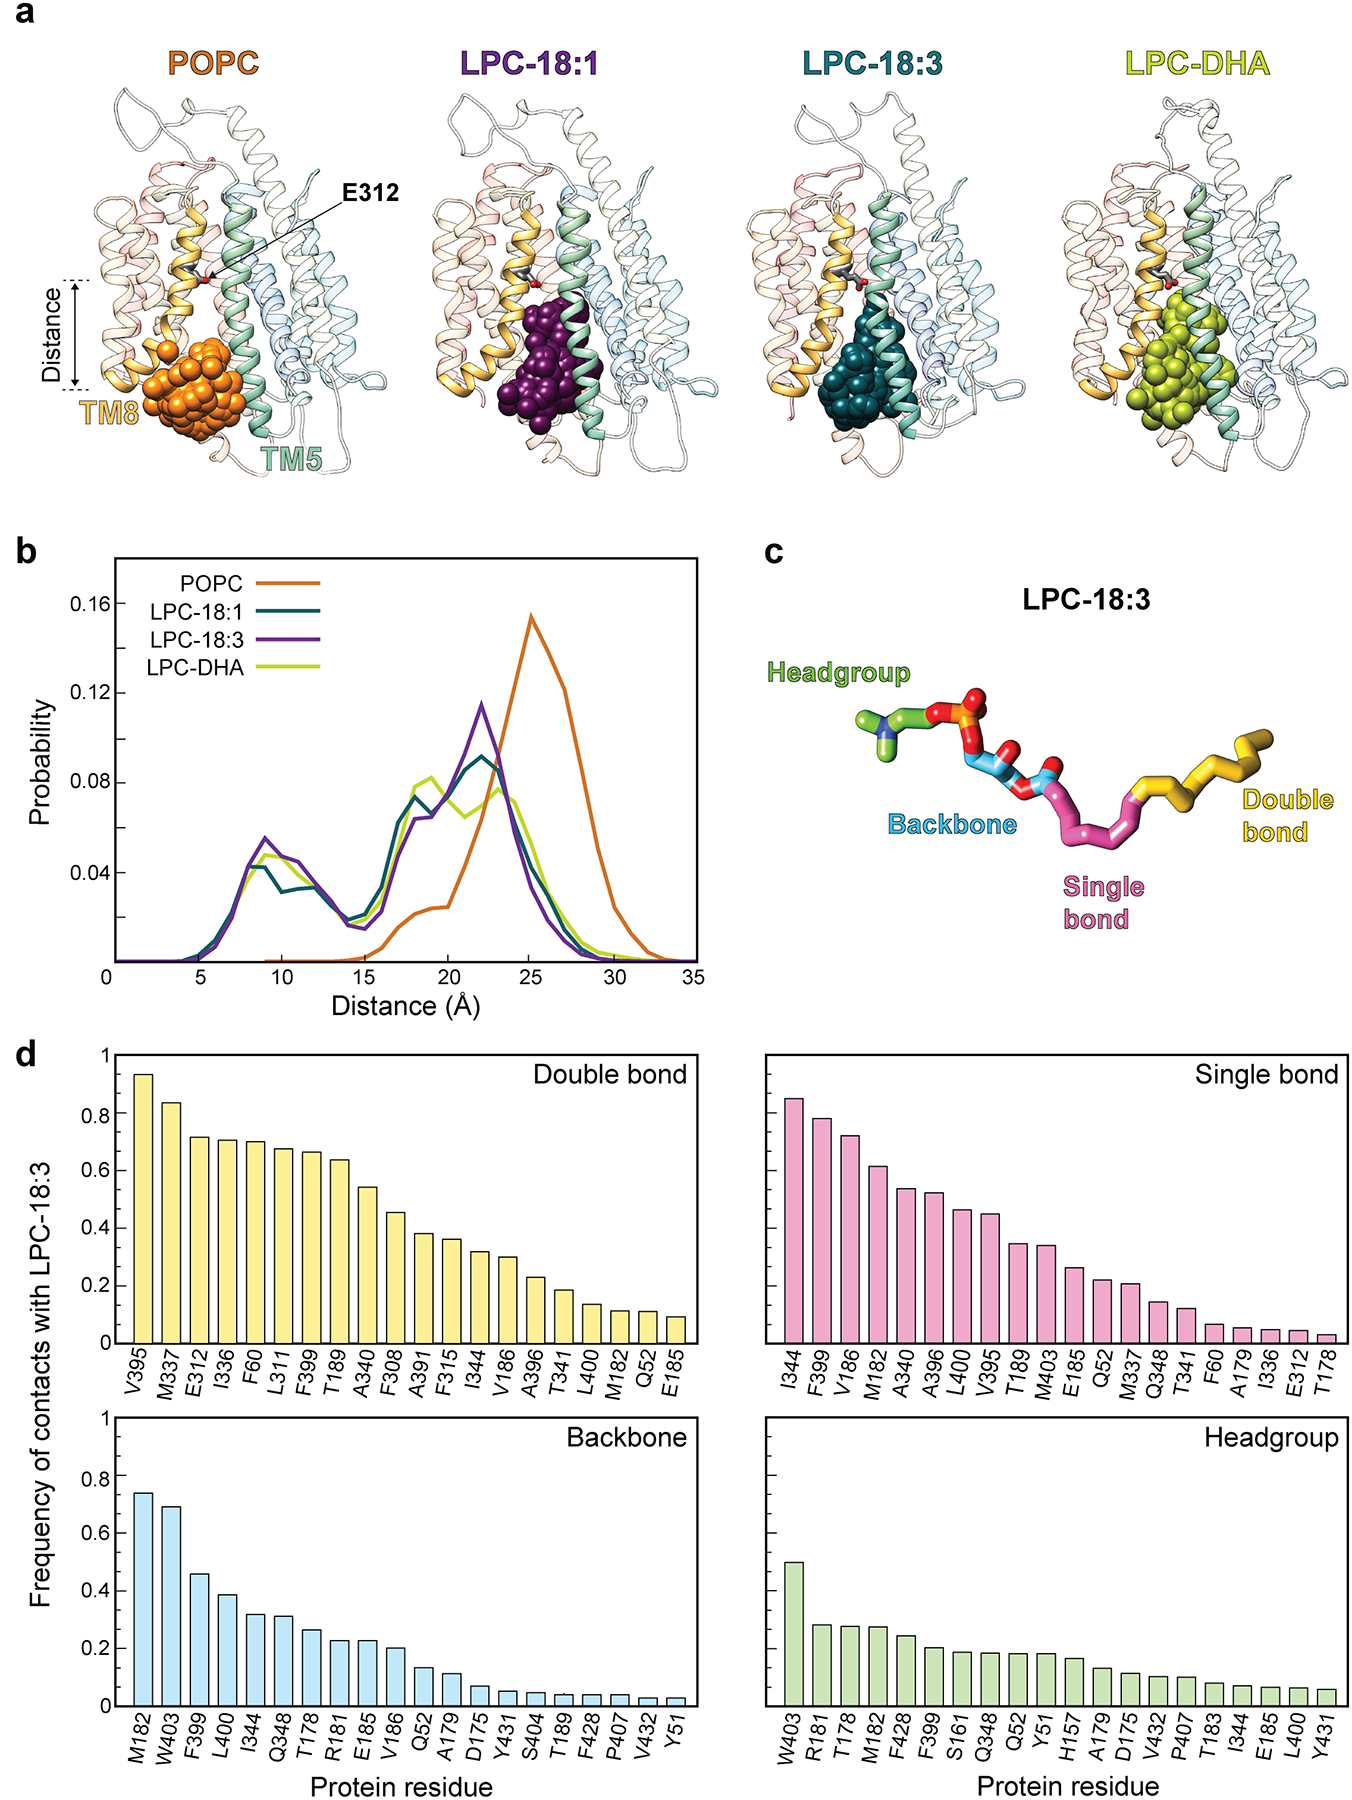
a, Snapshots depicting the position of phosphorus atoms (spheres) of POPC (orange), LPC-18:1 (purple), LPC-18:3 (teal), and LPC-DHA (lime) at the entrance to and inside the intracellular cavity during MD simulations. b, Histograms representing the distance along the membrane-perpendicular z axis between the phosphorus atoms of the lipids in panel a, and the Cα atom of a reference residue (E312, highlighted in panel a,). c, Structure of LPC-18:3 highlighting the head group (green; O11, O12, O13, O14, P, C11, C12, N, C13, C14, C15 in CHARMM nomenclature), backbone (blue; C31, O31, O32, C3, C2, O21, C1), single bonded hydrocarbon tail (pink; C32-C38), and double bonded hydrocarbon tail (yellow; C39-C48) regions. d, Frequency of contacts between the LPC-18:3 head group, backbone, single bonded and double bonded tail regions, and MFSD2A_GG residues. Results for top 20 contact residues are shown. Contacts were defined as distances less than 4Å between non-hydrogen atoms of the protein and the substrate.
Extended Data Figure 9 |. Sampling of the major conformational states is affected by the presence and absence of Na+ and lysolipid substrate in the MD simulations.
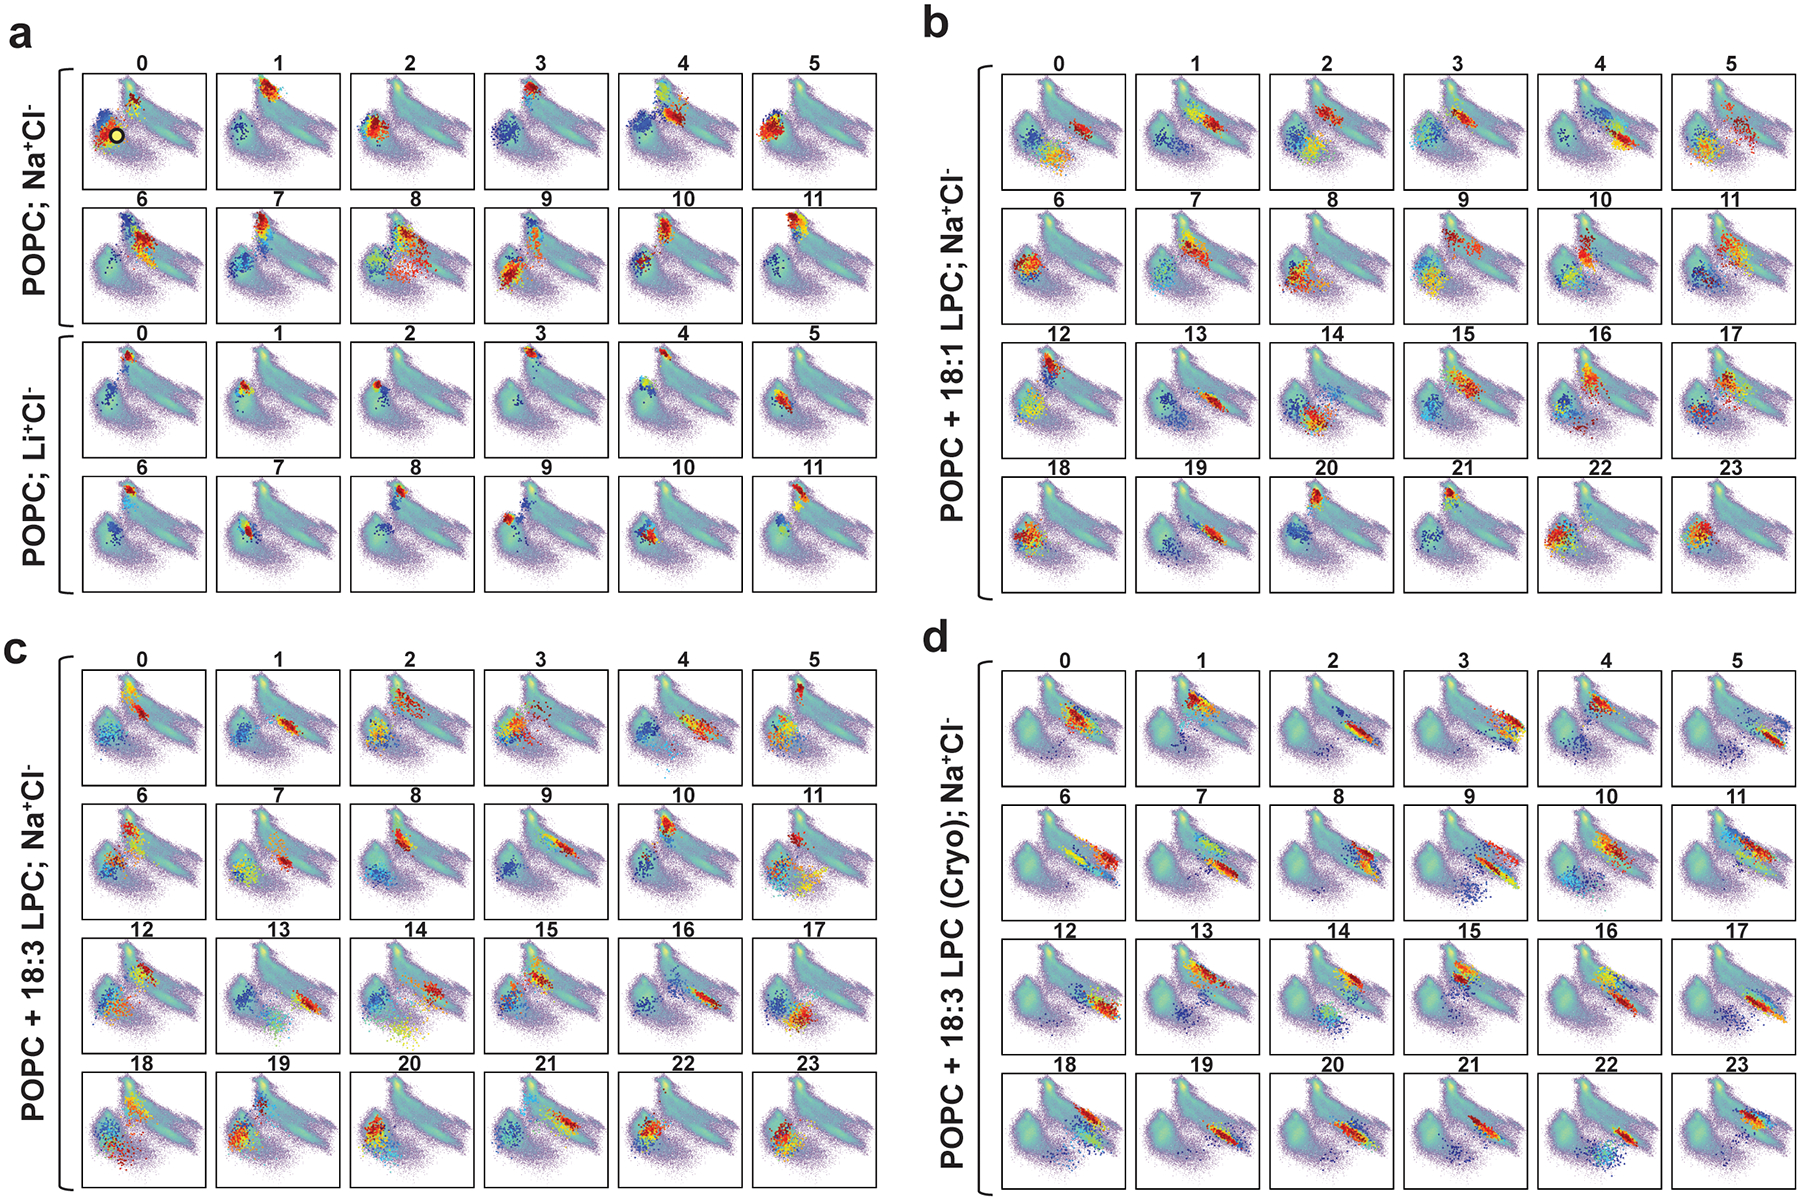
Projection (coloured dots) of each MD trajectory from the 3 sets of simulations on the 2D tICA landscape (in pale colours) from Extended Data Fig. 7. Simulations of MFSD2A_GG in a POPC bilayer were performed in: a, either Na+Cl− or Li+Cl− solution; b, Na+Cl− solution with a single LPC-18:1 at the interface of the IC-gate and the inner leaflet of the membrane; c, Na+Cl− solution with a single LPC-18:3 at the interface of the IC-gate and the inner leaflet of the membrane; and d, Na+Cl− solution with a single LPC-18:3 bound as in the cryo-EM structure. The colours of the dots indicate the timeframes in the evolution of the trajectory: darker colours (blue, cyan) represent the initial stages of the simulation, lighter colours (yellow, green) correspond to the middle part of the trajectory, and reds show the last third of the trajectory. The yellow circle in panel a (trajectory 0) denotes the conformation of the system in which LPC-18:1, LPC-18:3 and LPC-DHA were introduced.
Extended Data Figure 10 |. Pathways for opening of the IC-gate and substrate entry.
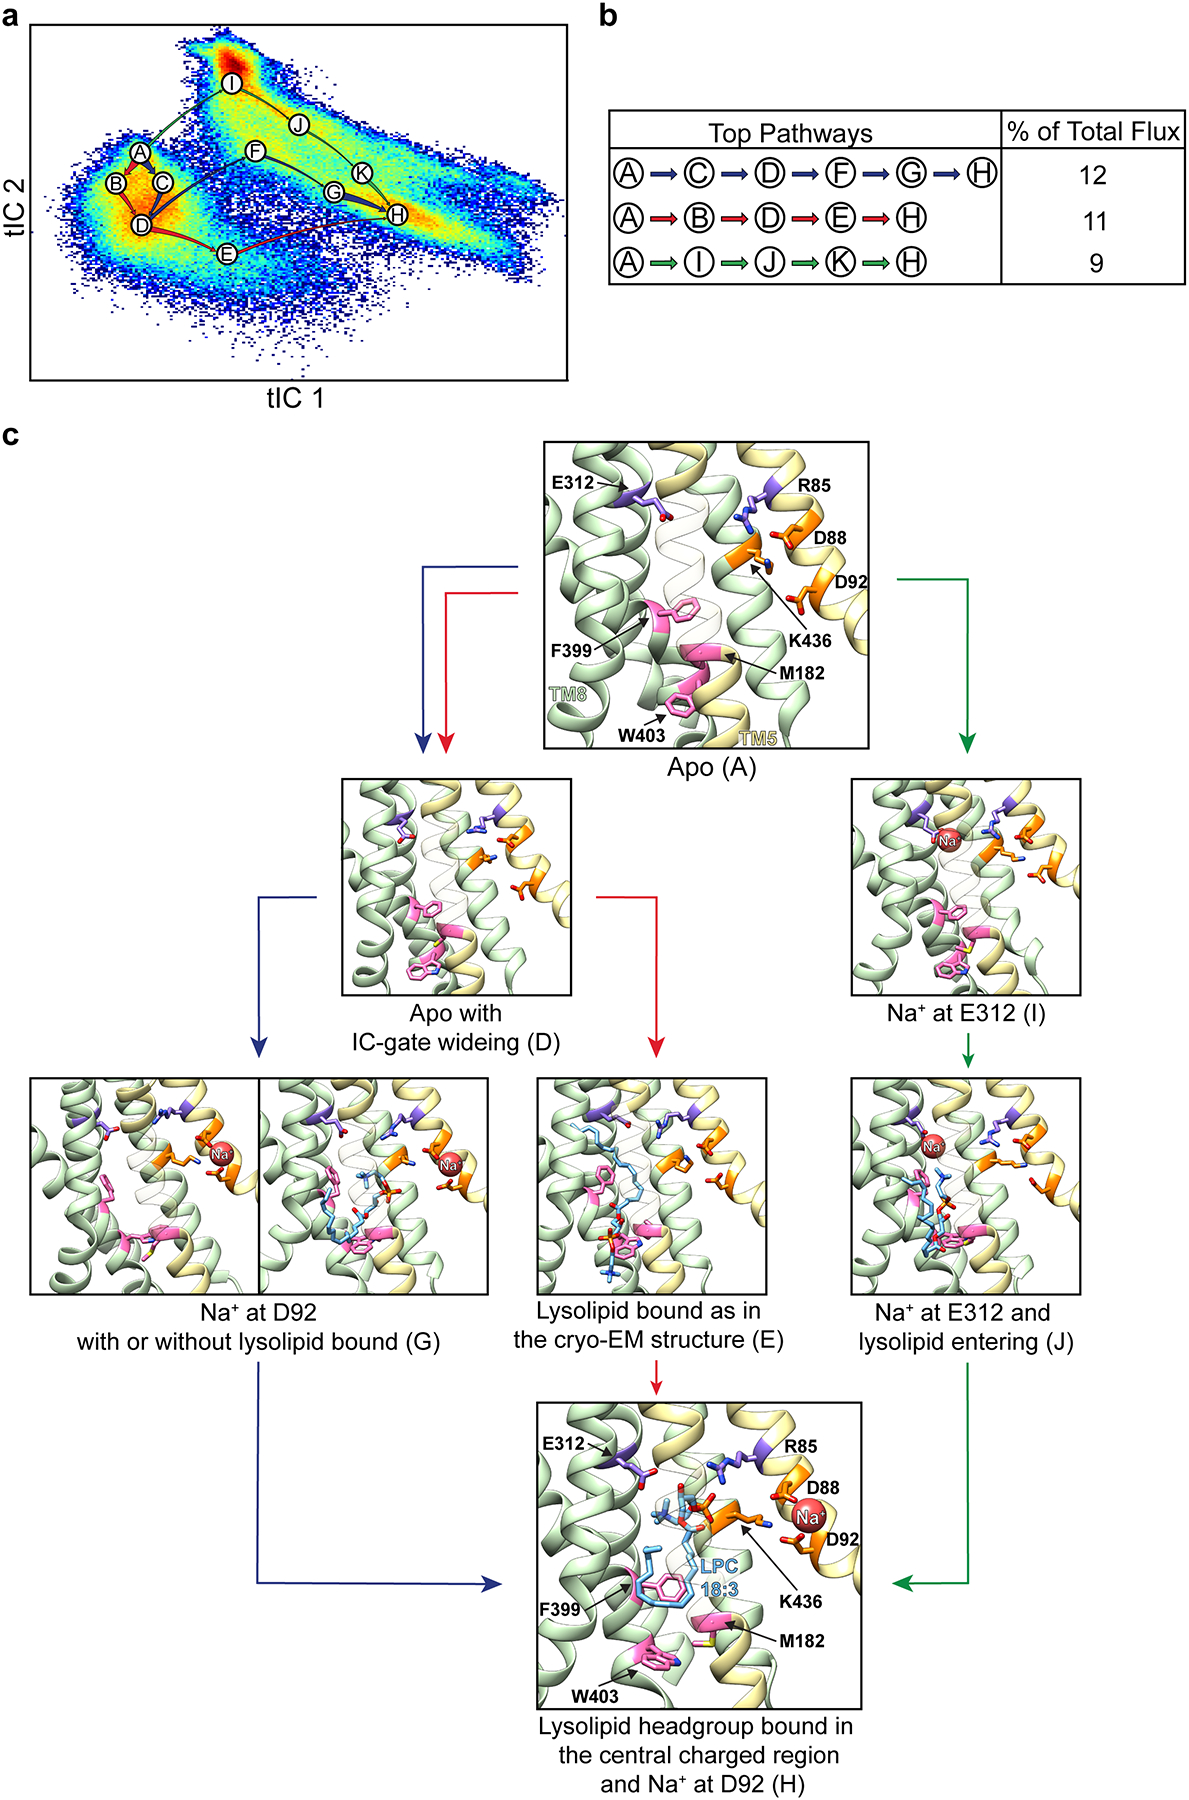
a, The three main pathways for IC-gate opening and substrate penetration, identified from Markov State Modeling (MSM) and Transition Path Theory (TPT) analyses are shown on the tIC1 vs tIC2 landscape, represented as in Extended Data Fig. 7. Macrostates on these pathways are named A through H with each label placed at the center of the corresponding state. Arrows coloured in blue, red, and green represent the three main pathways between macrostates, and their thickness indicates the relative magnitude of flux for each given pathway. Macrostates A, I, G, and H correspond to states i, ii, iii, and iv in Fig. 3, and macrostate E corresponds to the cryo-EM structure. The remaining macrostates represent structural intermediates between these major states. b, The percentage of total flux for the top three pathways shown in panel a. c, Structural representation of the key macrostates from panel a. Macrostates B, C, F, and K have been omitted for simplicity, as they are structural intermediates between the major states presented (see Extended Data Fig. 7). Helices in the N-domain are coloured in yellow whereas those in the C domain are green. Select residues are shown in stick representation and coloured as in Fig. 2. For visual clarity, TMs 1, 3, 4, 6, 9, 12 have been omitted and TM5 is partially transparent.
Extended Data Figure 11 |. Inter-domain contacts on the extracellular side of MFSD2A.
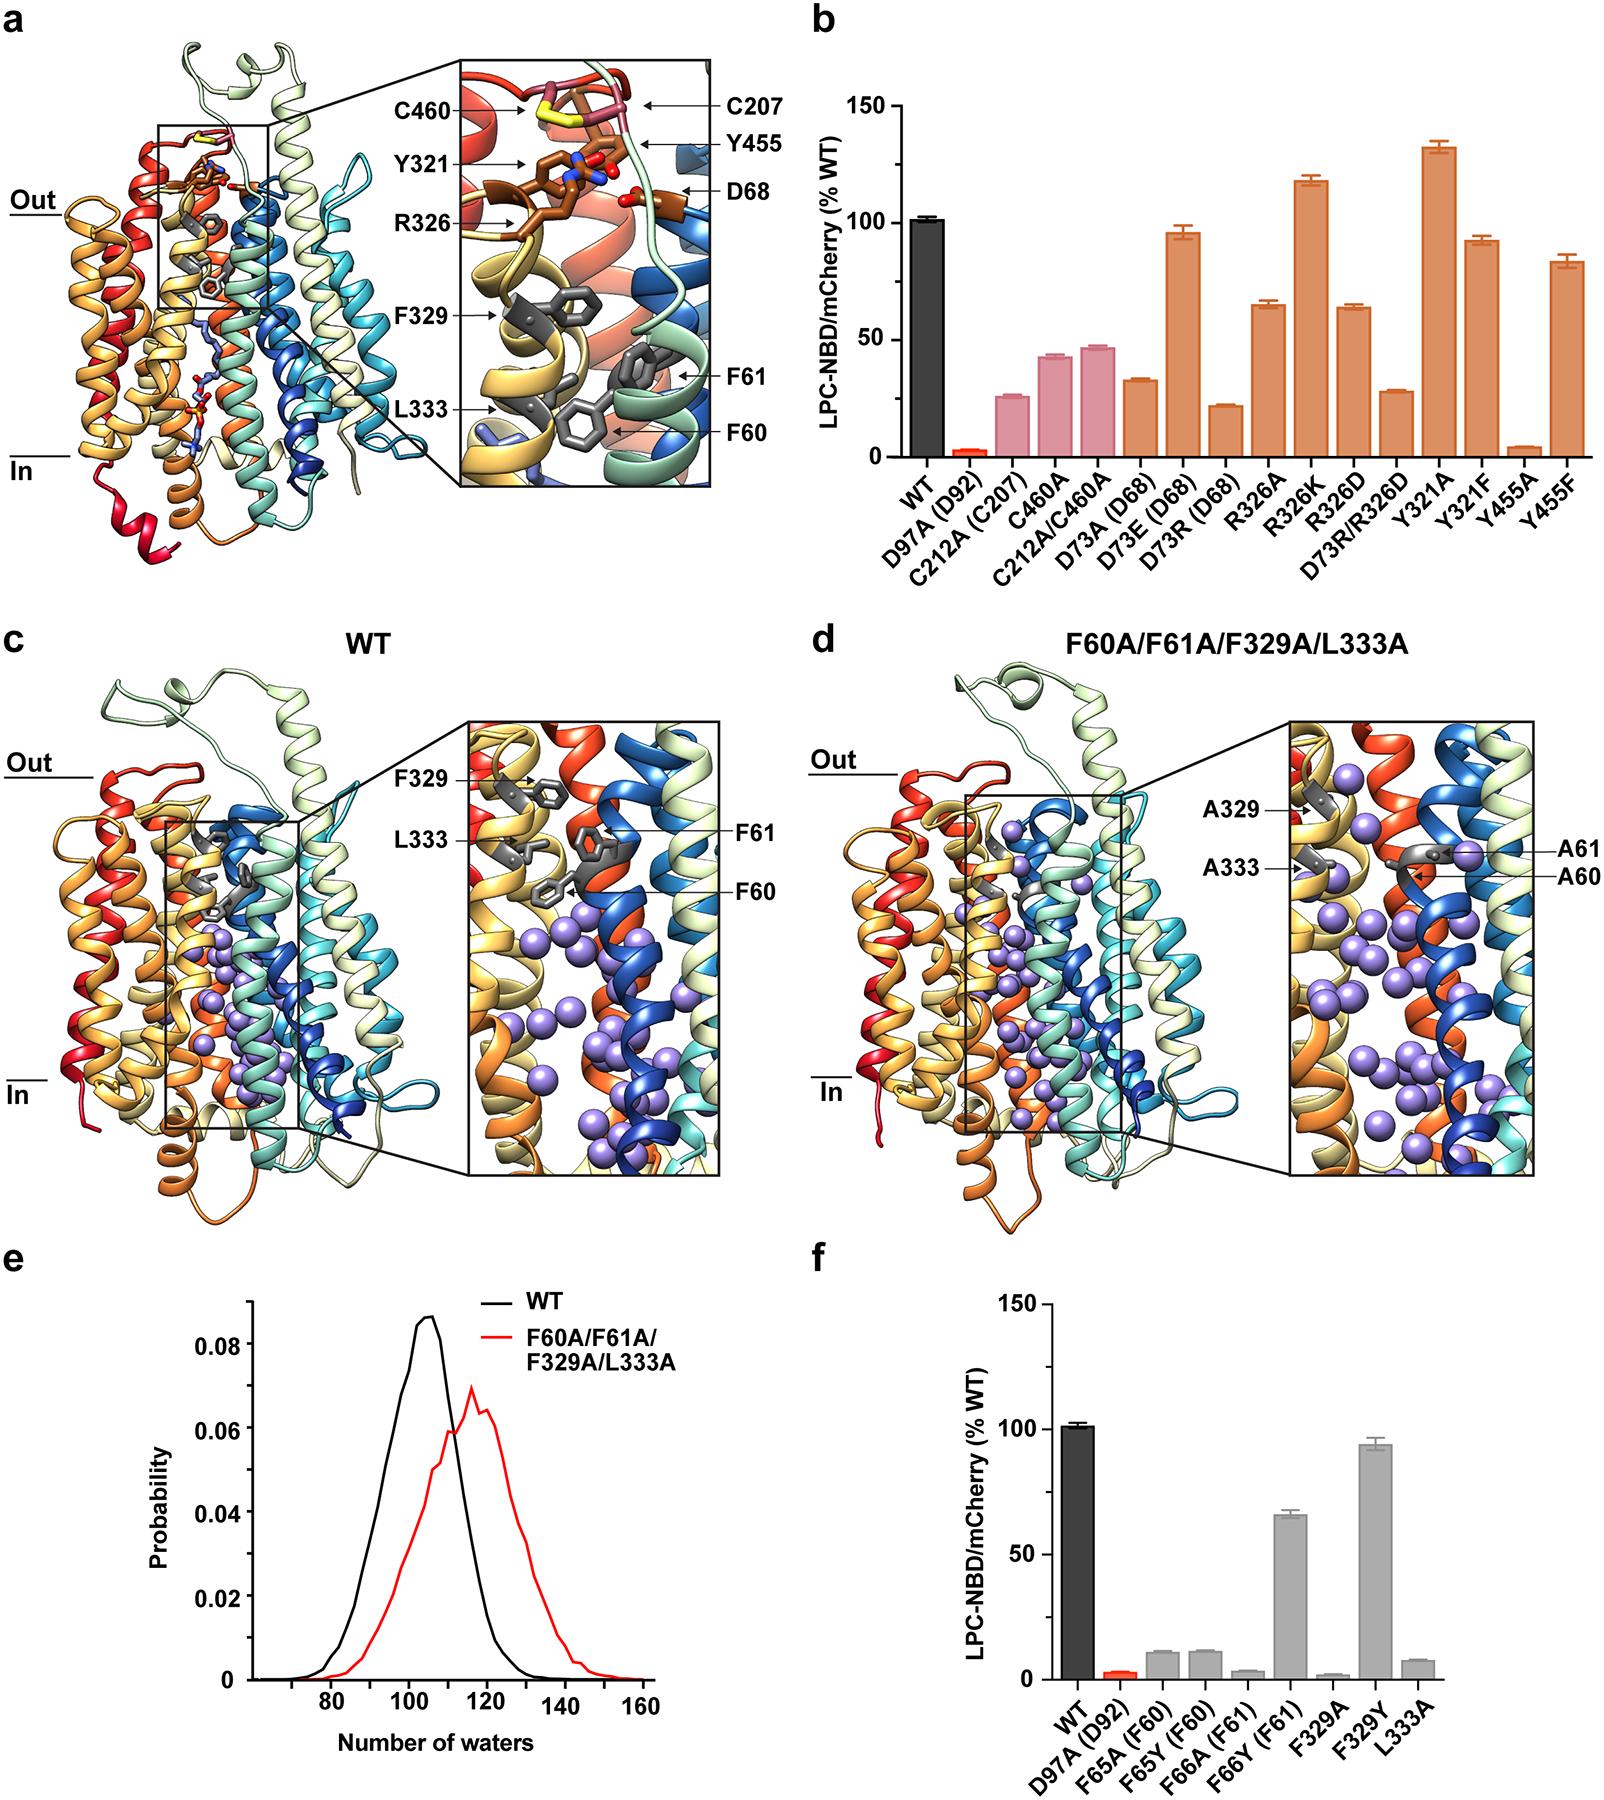
a, Structure of MFSD2A_GG in the plane of the membrane with inset highlighting a disulphide crosslink between C207 and C460 (salmon), a charged/polar network involving D68, Y321, R326, and Y455 (brown), and a hydrophobic plug comprising F60, F61, F329, L333 (grey). TMs are coloured as in Fig. 1. b, Single-cell uptake of the fluorescent substrate LPC-NBD by cells expressing WT and mutant MFSD2A_HS-mCherry fusion constructs. LPC-NBD uptake was normalized to mCherry expression and represented as a % of WT collected in the same experiment ± S.E.M. The colour coding matches that used in a. Where residue number or identity differs between MFSD2A_HS and MFSD2A_GG the corresponding residue in MFSD2A_GG is also provided in parenthesis. Snapshots from MD simulations of c, WT and d, F60A/F61A/F329A/L333A mutant MFSD2A_GG showing water oxygens as purple spheres. Insets illustrate magnified views of the intracellular cavity. MFSD2A_GG is represented as in Fig. 1, with plug residues labelled and coloured in grey. e, Number of water oxygens in the intracellular cavity derived from simulations of WT and F60A/F61A/F329A/L333A mutant MFSD2A_GG, in black and red, respectively. Water oxygens were considered in the intracellular cavity if within 5Å of the following residues: 51, 55, 59, 63, 64, 68, 77, 81, 85, 89, 92, 181, 185, 189, 193, 197, 201, 316, 312, 309, 305, 398, 402, 428, 432, 436, 440, 444. f, Single-cell uptake of the fluorescent substrate LPC-NBD by cells expressing WT and mutant MFSD2A_HS-mCherry fusion constructs. Data were normalized and represented as in b. See Extended Data Fig. 6 for raw data and n values for each construct assayed in b and f.
Extended Data Table 1 |.
Cryo-EM Data.
| MFSD2A_GG-2AG3 complex (EMD-23883) (PDB ID 7MJS) |
|
|---|---|
| Data collection and processing | |
| Magnification | 105,000 |
| Voltage (kV) | 300 |
| Electron exposure (e-/Å2) | 58.0 |
| Dose rate (e-/pixel/s) | 16 |
| Defocus range (μm) | 1.75 – 2.5 |
| Pixel size (Å) | 0.83 |
| Symmetry imposed | C1 |
| Initial micrographs collected (no.) | 15,516 |
| Final micrographs processed (no.) | 13,300 |
| Initial particle images (no.) | 5,049,988 |
| Final particle images (no.) | 175,738 |
| Map resolution (Å) | 3.03 |
| FSC threshold | 0.143 |
| Map sharpening B factor (Å2) | −65.6 |
| Residue range | 36–267 and 280–505 (MFSD2A) |
| 2–114 (2AG3 vFab light chain) | |
| 4–135 (2AG3 vFab heavy chain) | |
| Model composition | |
| Non-hydrogen atoms | 5554 |
| Protein residues | 703 |
| Ligands | 4 |
| B factors (Å2) | |
| Protein | 57.65 |
| Ligand | 60.21 |
| R.m.s. deviations | |
| Bond lengths (Å) | 0.005 |
| Bond angles (°) | 1.010 |
| Validation | |
| MolProbity score | 1.79 |
| Clashscore | 8.62 |
| Rotamer outliers (%) | 0 |
| EM-Ringer Score | 3.52 |
| Ramachandran plot | |
| Favored (%) | 95.25 |
| Allowed (%) | 4.75 |
| Disallowed (%) | 0.00 |
Supplementary Material
Acknowledgements
We gratefully acknowledge the assistance of members of the Mancia lab, Columbia Cryo-EM facility and Iowa State University Protein Facility. Gratitude is extended to Dr. Ekaterina Kots for her assistance with generating the molecular dynamics trajectory video. This work was supported by NIH grants (R35 GM132120 and R21 MH125649 to F.M., R35 GM128624 to M.T.M., R01 GM117372 to A.A.K.) and grants from the National Research Foundation and Ministry of Health, Singapore (NRF-NRFI2017-05 and MOH-000217 to D.L.S.). R.J.C. was supported by the Simons Society of Fellows (Award Number: 578646). G.K. is supported by the HRH Prince Alwaleed Bin Talal Bin Abdulaziz Alsaud Institute of Computational Biomedicine at Weill Cornell Medical College through the 1923 Fund. C.F.C. and B.H.W. are supported by the Khoo Postdoctoral Research Fellowship. Some of the work was performed at the Center for Membrane Protein Production and Analysis (COMPPÅ; NIH P41 GM116799 to Wayne A. Hendrickson), and at the National Resource for Automated Molecular Microscopy at the Simons Electron Microscopy Center (P41 GM103310), both located at the New York Structural Biology Center. MD simulations were performed using the Oak Ridge Leadership Computing Facility (Summit allocation BIP109) at the Oak Ridge National Laboratory (supported by the Office of Science of the U.S. Department of Energy under Contract No. DE-AC05-00OR22725), and computational resources of the David A. Cofrin Center for Biomedical Information at Weill Cornell Medical College.
Footnotes
Competing interests
D.L.S. is a scientific founder and advisor of Travecta Therapeutics that has developed a drug delivery platform that utilizes MFSD2A transport. All other authors declare no competing interests.
Data availability
All raw movie frames have been deposited into EMPIAR, with accession code EMPIAR-10698. The density map has been deposited into EMDB, with accession code EMD-23883. The model has been deposited in the PDB, with accession code 7MJS. All raw flow cytometry data and gels are available in the paper or supplementary information.
Main Text References
- 1.Breckenridge W, Gombos G & Morgan I The lipid composition of adult rat brain synaptosomal plasma membranes. Biochimica et Biophysica Acta (BBA)-Biomembranes 266, 695–707 (1972). [DOI] [PubMed] [Google Scholar]
- 2.Connor WE Importance of n− 3 fatty acids in health and disease. The American journal of clinical nutrition 71, 171S–175S (2000). [DOI] [PubMed] [Google Scholar]
- 3.Horrocks LA & Yeo YK Health benefits of docosahexaenoic acid (DHA). Pharmacological Research 40, 211–225 (1999). [DOI] [PubMed] [Google Scholar]
- 4.Innis SM Dietary (n-3) fatty acids and brain development. The Journal of nutrition 137, 855–859 (2007). [DOI] [PubMed] [Google Scholar]
- 5.Kidd PM Omega-3 DHA and EPA for cognition, behavior, and mood: clinical findings and structural-functional synergies with cell membrane phospholipids. Alternative medicine review 12, 207 (2007). [PubMed] [Google Scholar]
- 6.Salem N, Litman B, Kim H-Y & Gawrisch K Mechanisms of action of docosahexaenoic acid in the nervous system. Lipids 36, 945–959 (2001). [DOI] [PubMed] [Google Scholar]
- 7.Nguyen LN et al. Mfsd2a is a transporter for the essential omega-3 fatty acid docosahexaenoic acid. Nature 509, 503–506 (2014). [DOI] [PubMed] [Google Scholar]
- 8.Wong BH et al. Mfsd2a Is a Transporter for the Essential omega-3 Fatty Acid Docosahexaenoic Acid (DHA) in Eye and Is Important for Photoreceptor Cell Development. J Biol Chem 291, 10501–10514, doi: 10.1074/jbc.M116.721340 (2016). [DOI] [PMC free article] [PubMed] [Google Scholar]
- 9.Lobanova ES et al. Disrupted Blood-Retina Lysophosphatidylcholine Transport Impairs Photoreceptor Health But Not Visual Signal Transduction. J Neurosci 39, 9689–9701, doi: 10.1523/JNEUROSCI.1142-19.2019 (2019). [DOI] [PMC free article] [PubMed] [Google Scholar]
- 10.Andreone BJ et al. Blood-Brain Barrier Permeability Is Regulated by Lipid Transport-Dependent Suppression of Caveolae-Mediated Transcytosis. Neuron 94, 581–594. e585 (2017). [DOI] [PMC free article] [PubMed] [Google Scholar]
- 11.Chan JP et al. The lysolipid transporter Mfsd2a regulates lipogenesis in the developing brain. PLoS Biol 16, e2006443, doi: 10.1371/journal.pbio.2006443 (2018). [DOI] [PMC free article] [PubMed] [Google Scholar]
- 12.Alakbarzade V et al. A partially inactivating mutation in the sodium-dependent lysophosphatidylcholine transporter MFSD2A causes a non-lethal microcephaly syndrome. Nat Genet 47, 814–817, doi: 10.1038/ng.3313 (2015). [DOI] [PubMed] [Google Scholar]
- 13.Razmara E et al. Novel neuroclinical findings of autosomal recessive primary microcephaly 15 in a consanguineous Iranian family. Eur J Med Genet 63, 104096, doi: 10.1016/j.ejmg.2020.104096 (2020). [DOI] [PubMed] [Google Scholar]
- 14.Scala M et al. Biallelic MFSD2A variants associated with congenital microcephaly, developmental delay, and recognizable neuroimaging features. Eur J Hum Genet 28, 1509–1519, doi: 10.1038/s41431-020-0669-x (2020). [DOI] [PMC free article] [PubMed] [Google Scholar]
- 15.Harel T et al. Homozygous mutation in MFSD2A, encoding a lysolipid transporter for docosahexanoic acid, is associated with microcephaly and hypomyelination. Neurogenetics 19, 227–235, doi: 10.1007/s10048-018-0556-6 (2018). [DOI] [PubMed] [Google Scholar]
- 16.Guemez-Gamboa A et al. Inactivating mutations in MFSD2A, required for omega-3 fatty acid transport in brain, cause a lethal microcephaly syndrome. Nature genetics 47, 809–813 (2015). [DOI] [PMC free article] [PubMed] [Google Scholar]
- 17.Quistgaard EM, Löw C, Guettou F & Nordlund P Understanding transport by the major facilitator superfamily (MFS): structures pave the way. Nature Reviews Molecular Cell Biology 17, 123–132 (2016). [DOI] [PubMed] [Google Scholar]
- 18.Yan N Structural biology of the major facilitator superfamily transporters. Annual review of biophysics 44, 257–283 (2015). [DOI] [PubMed] [Google Scholar]
- 19.Kawahara A et al. The sphingolipid transporter spns2 functions in migration of zebrafish myocardial precursors. Science 323, 524–527, doi: 10.1126/science.1167449 (2009). [DOI] [PubMed] [Google Scholar]
- 20.Vu TM et al. Mfsd2b is essential for the sphingosine-1-phosphate export in erythrocytes and platelets. Nature (2017). [DOI] [PubMed] [Google Scholar]
- 21.Kobayashi N et al. MFSD2B is a sphingosine 1-phosphate transporter in erythroid cells. Sci Rep 8, 4969, doi: 10.1038/s41598-018-23300-x (2018). [DOI] [PMC free article] [PubMed] [Google Scholar]
- 22.Lin Y, Deepak R, Zheng JZ, Fan H & Zheng L A dual substrate-accessing mechanism of a major facilitator superfamily protein facilitates lysophospholipid flipping across the cell membrane. J Biol Chem 293, 19919–19931, doi: 10.1074/jbc.RA118.005548 (2018). [DOI] [PMC free article] [PubMed] [Google Scholar]
- 23.Quek DQ, Nguyen LN, Fan H & Silver DL Structural insights into the transport mechanism of the human sodium-dependent lysophosphatidylcholine transporter Mfsd2a. Journal of Biological Chemistry 291, 9383–9394 (2016). [DOI] [PMC free article] [PubMed] [Google Scholar]
- 24.Perez C et al. Structure and mechanism of an active lipid-linked oligosaccharide flippase. Nature 524, 433–438 (2015). [DOI] [PubMed] [Google Scholar]
- 25.Renaud JP et al. Cryo-EM in drug discovery: achievements, limitations and prospects. Nat Rev Drug Discov 17, 471–492, doi: 10.1038/nrd.2018.77 (2018). [DOI] [PubMed] [Google Scholar]
- 26.Nygaard R, Kim J & Mancia F Cryo-electron microscopy analysis of small membrane proteins. Curr Opin Struct Biol 64, 26–33, doi: 10.1016/j.sbi.2020.05.009 (2020). [DOI] [PMC free article] [PubMed] [Google Scholar]
- 27.Dominik PK et al. Conformational Chaperones for Structural Studies of Membrane Proteins Using Antibody Phage Display with Nanodiscs. Structure 24, 300–309, doi: 10.1016/j.str.2015.11.014 (2016). [DOI] [PMC free article] [PubMed] [Google Scholar]
- 28.Dominik PK & Kossiakoff AA Phage display selections for affinity reagents to membrane proteins in nanodiscs. Methods Enzymol 557, 219–245, doi: 10.1016/bs.mie.2014.12.032 (2015). [DOI] [PubMed] [Google Scholar]
- 29.Fellouse FA, Wiesmann C & Sidhu SS Synthetic antibodies from a four-amino-acid code: a dominant role for tyrosine in antigen recognition. Proc Natl Acad Sci U S A 101, 12467–12472, doi: 10.1073/pnas.0401786101 (2004). [DOI] [PMC free article] [PubMed] [Google Scholar]
- 30.Ethayathulla AS et al. Structure-based mechanism for Na+/melibiose symport by MelB. Nature communications 5, 3009 (2014). [DOI] [PMC free article] [PubMed] [Google Scholar]
- 31.Yardeni EH, Mishra S, Stein RA, Bibi E & McHaourab HS The Multidrug Transporter MdfA Deviates from the Canonical Model of Alternating Access of MFS Transporters. J Mol Biol 432, 5665–5680, doi: 10.1016/j.jmb.2020.08.017 (2020). [DOI] [PMC free article] [PubMed] [Google Scholar]
- 32.Assur Z, Hendrickson WA & Mancia F Tools for coproducing multiple proteins in mammalian cells. Methods Mol Biol 801, 173–187, doi: 10.1007/978-1-61779-352-3_12 (2012). [DOI] [PMC free article] [PubMed] [Google Scholar]
- 33.Kawate T & Gouaux E Fluorescence-detection size-exclusion chromatography for precrystallization screening of integral membrane proteins. Structure 14, 673–681, doi: 10.1016/j.str.2006.01.013 (2006). [DOI] [PubMed] [Google Scholar]
- 34.Gibson DG et al. Enzymatic assembly of DNA molecules up to several hundred kilobases. Nat Methods 6, 343–345, doi: 10.1038/nmeth.1318 (2009). [DOI] [PubMed] [Google Scholar]
- 35.Miller KR et al. T cell receptor-like recognition of tumor in vivo by synthetic antibody fragment. PLoS One 7, e43746, doi: 10.1371/journal.pone.0043746 (2012). [DOI] [PMC free article] [PubMed] [Google Scholar]
- 36.Rizk SS et al. Allosteric control of ligand-binding affinity using engineered conformation-specific effector proteins. Nat Struct Mol Biol 18, 437–442, doi: 10.1038/nsmb.2002 (2011). [DOI] [PMC free article] [PubMed] [Google Scholar]
- 37.Paduch M & Kossiakoff AA Generating Conformation and Complex-Specific Synthetic Antibodies. Methods Mol Biol 1575, 93–119, doi: 10.1007/978-1-4939-6857-2_6 (2017). [DOI] [PubMed] [Google Scholar]
- 38.Kim J et al. Structure and drug resistance of the Plasmodium falciparum transporter PfCRT. Nature 576, 315–320, doi: 10.1038/s41586-019-1795-x (2019). [DOI] [PMC free article] [PubMed] [Google Scholar]
- 39.Suloway C et al. Automated molecular microscopy: the new Leginon system. J Struct Biol 151, 41–60, doi: 10.1016/j.jsb.2005.03.010 (2005). [DOI] [PubMed] [Google Scholar]
- 40.Cheng A et al. High resolution single particle cryo-electron microscopy using beam-image shift. J Struct Biol 204, 270–275, doi: 10.1016/j.jsb.2018.07.015 (2018). [DOI] [PMC free article] [PubMed] [Google Scholar]
- 41.Rice WJ et al. Routine determination of ice thickness for cryo-EM grids. J Struct Biol 204, 38–44, doi: 10.1016/j.jsb.2018.06.007 (2018). [DOI] [PMC free article] [PubMed] [Google Scholar]
- 42.Punjani A, Rubinstein JL, Fleet DJ & Brubaker MA cryoSPARC: algorithms for rapid unsupervised cryo-EM structure determination. Nat Methods 14, 290–296, doi: 10.1038/nmeth.4169 (2017). [DOI] [PubMed] [Google Scholar]
- 43.Bepler T et al. Positive-unlabeled convolutional neural networks for particle picking in cryo-electron micrographs. Nat Methods 16, 1153–1160, doi: 10.1038/s41592-019-0575-8 (2019). [DOI] [PMC free article] [PubMed] [Google Scholar]
- 44.Guan L, Mirza O, Verner G, Iwata S & Kaback HR Structural determination of wild-type lactose permease. Proc Natl Acad Sci U S A 104, 15294–15298, doi: 10.1073/pnas.0707688104 (2007). [DOI] [PMC free article] [PubMed] [Google Scholar]
- 45.Stein N CHAINSAW: a program for mutating pdb files used as templates in molecular replacement. Journal of applied crystallography 41, 641–643 (2008). [Google Scholar]
- 46.Potterton L et al. CCP4i2: the new graphical user interface to the CCP4 program suite. Acta Crystallogr D Struct Biol 74, 68–84, doi: 10.1107/S2059798317016035 (2018). [DOI] [PMC free article] [PubMed] [Google Scholar]
- 47.Pettersen EF et al. UCSF Chimera--a visualization system for exploratory research and analysis. J Comput Chem 25, 1605–1612, doi: 10.1002/jcc.20084 (2004). [DOI] [PubMed] [Google Scholar]
- 48.Emsley P & Cowtan K Coot: model-building tools for molecular graphics. Acta Crystallogr D Biol Crystallogr 60, 2126–2132, doi: 10.1107/S0907444904019158 (2004). [DOI] [PubMed] [Google Scholar]
- 49.Emsley P, Lohkamp B, Scott WG & Cowtan K Features and development of Coot. Acta Crystallogr D Biol Crystallogr 66, 486–501, doi: 10.1107/S0907444910007493 (2010). [DOI] [PMC free article] [PubMed] [Google Scholar]
- 50.Casanal A, Lohkamp B & Emsley P Current developments in Coot for macromolecular model building of Electron Cryo-microscopy and Crystallographic Data. Protein Sci 29, 1069–1078, doi: 10.1002/pro.3791 (2020). [DOI] [PMC free article] [PubMed] [Google Scholar]
- 51.Slabinski L et al. XtalPred: a web server for prediction of protein crystallizability. Bioinformatics 23, 3403–3405, doi: 10.1093/bioinformatics/btm477 (2007). [DOI] [PubMed] [Google Scholar]
- 52.Ahuja S et al. Structural analysis of bacterial ABC transporter inhibition by an antibody fragment. Structure 23, 713–723, doi: 10.1016/j.str.2015.01.020 (2015). [DOI] [PubMed] [Google Scholar]
- 53.Adams PD et al. PHENIX: a comprehensive Python-based system for macromolecular structure solution. Acta Crystallogr D Biol Crystallogr 66, 213–221, doi: 10.1107/S0907444909052925 (2010). [DOI] [PMC free article] [PubMed] [Google Scholar]
- 54.Kidmose RT et al. Namdinator - automatic molecular dynamics flexible fitting of structural models into cryo-EM and crystallography experimental maps. IUCrJ 6, 526–531, doi: 10.1107/S2052252519007619 (2019). [DOI] [PMC free article] [PubMed] [Google Scholar]
- 55.Voss NR & Gerstein M 3V: cavity, channel and cleft volume calculator and extractor. Nucleic Acids Res 38, W555–562, doi: 10.1093/nar/gkq395 (2010). [DOI] [PMC free article] [PubMed] [Google Scholar]
- 56.Edgar RC MUSCLE: multiple sequence alignment with high accuracy and high throughput. Nucleic Acids Res 32, 1792–1797, doi: 10.1093/nar/gkh340 (2004). [DOI] [PMC free article] [PubMed] [Google Scholar]
- 57.Townsend JA, Keener JE, Miller ZM, Prell JS & Marty MT Imidazole Derivatives Improve Charge Reduction and Stabilization for Native Mass Spectrometry. Anal Chem 91, 14765–14772, doi: 10.1021/acs.analchem.9b04263 (2019). [DOI] [PMC free article] [PubMed] [Google Scholar]
- 58.Marty MT et al. Bayesian deconvolution of mass and ion mobility spectra: from binary interactions to polydisperse ensembles. Anal Chem 87, 4370–4376, doi: 10.1021/acs.analchem.5b00140 (2015). [DOI] [PMC free article] [PubMed] [Google Scholar]
- 59.Wersto RP et al. Doublet discrimination in DNA cell-cycle analysis. Cytometry 46, 296–306, doi: 10.1002/cyto.1171 (2001). [DOI] [PubMed] [Google Scholar]
- 60.Das R & Baker D Macromolecular modeling with rosetta. Annu Rev Biochem 77, 363–382, doi: 10.1146/annurev.biochem.77.062906.171838 (2008). [DOI] [PubMed] [Google Scholar]
- 61.Webb B & Sali A Comparative Protein Structure Modeling Using MODELLER. Curr Protoc Protein Sci 86, 2 9 1–2 9 37, doi: 10.1002/cpps.20 (2016). [DOI] [PubMed] [Google Scholar]
- 62.Jo S, Lim JB, Klauda JB & Im W CHARMM-GUI Membrane Builder for mixed bilayers and its application to yeast membranes. Biophys J 97, 50–58, doi: 10.1016/j.bpj.2009.04.013 (2009). [DOI] [PMC free article] [PubMed] [Google Scholar]
- 63.Phillips JC et al. Scalable molecular dynamics on CPU and GPU architectures with NAMD. J Chem Phys 153, 044130, doi: 10.1063/5.0014475 (2020). [DOI] [PMC free article] [PubMed] [Google Scholar]
- 64.Eastman P et al. OpenMM 7: Rapid development of high performance algorithms for molecular dynamics. PLoS Comput Biol 13, e1005659, doi: 10.1371/journal.pcbi.1005659 (2017). [DOI] [PMC free article] [PubMed] [Google Scholar]
- 65.Huang J et al. CHARMM36m: an improved force field for folded and intrinsically disordered proteins. Nat Methods 14, 71–73, doi: 10.1038/nmeth.4067 (2017). [DOI] [PMC free article] [PubMed] [Google Scholar]
- 66.Venable RM, Luo Y, Gawrisch K, Roux B & Pastor RW Simulations of anionic lipid membranes: development of interaction-specific ion parameters and validation using NMR data. J Phys Chem B 117, 10183–10192, doi: 10.1021/jp401512z (2013). [DOI] [PMC free article] [PubMed] [Google Scholar]
- 67.Perez-Hernandez G, Paul F, Giorgino T, De Fabritiis G & Noe F Identification of slow molecular order parameters for Markov model construction. J Chem Phys 139, 015102, doi: 10.1063/1.4811489 (2013). [DOI] [PubMed] [Google Scholar]
- 68.Morra G et al. Mechanisms of Lipid Scrambling by the G Protein-Coupled Receptor Opsin. Structure 26, 356–367 e353, doi: 10.1016/j.str.2017.11.020 (2018). [DOI] [PMC free article] [PubMed] [Google Scholar]
- 69.Razavi AM, Khelashvili G & Weinstein H How structural elements evolving from bacterial to human SLC6 transporters enabled new functional properties. BMC Biol 16, 31, doi: 10.1186/s12915-018-0495-6 (2018). [DOI] [PMC free article] [PubMed] [Google Scholar]
- 70.Razavi AM, Khelashvili G & Weinstein H A Markov State-based Quantitative Kinetic Model of Sodium Release from the Dopamine Transporter. Sci Rep 7, 40076, doi: 10.1038/srep40076 (2017). [DOI] [PMC free article] [PubMed] [Google Scholar]
- 71.Lee BC et al. Gating mechanism of the extracellular entry to the lipid pathway in a TMEM16 scramblase. Nat Commun 9, 3251, doi: 10.1038/s41467-018-05724-1 (2018). [DOI] [PMC free article] [PubMed] [Google Scholar]
- 72.Beauchamp KA et al. MSMBuilder2: Modeling Conformational Dynamics at the Picosecond to Millisecond Scale. J Chem Theory Comput 7, 3412–3419, doi: 10.1021/ct200463m (2011). [DOI] [PMC free article] [PubMed] [Google Scholar]
- 73.Harrigan MP et al. MSMBuilder: Statistical Models for Biomolecular Dynamics. Biophys J 112, 10–15, doi: 10.1016/j.bpj.2016.10.042 (2017). [DOI] [PMC free article] [PubMed] [Google Scholar]
- 74.Deuflhard P & Weber M Robust Perron cluster analysis in conformation dynamics. Linear algebra and its applications 398, 161–184 (2005). [Google Scholar]
- 75.Dijkstra EW A note on two problems in connexion with graphs. Numerische mathematik 1, 269–271 (1959). [Google Scholar]
- 76.Berezhkovskii A, Hummer G & Szabo A Reactive flux and folding pathways in network models of coarse-grained protein dynamics. The Journal of chemical physics 130, 05B614 (2009). [DOI] [PMC free article] [PubMed] [Google Scholar]
- 77.Wu TT & Kabat EA An analysis of the sequences of the variable regions of Bence Jones proteins and myeloma light chains and their implications for antibody complementarity. J Exp Med 132, 211–250, doi: 10.1084/jem.132.2.211 (1970). [DOI] [PMC free article] [PubMed] [Google Scholar]
- 78.Waterhouse AM, Procter JB, Martin DM, Clamp M & Barton GJ Jalview Version 2--a multiple sequence alignment editor and analysis workbench. Bioinformatics 25, 1189–1191, doi: 10.1093/bioinformatics/btp033 (2009). [DOI] [PMC free article] [PubMed] [Google Scholar]
Associated Data
This section collects any data citations, data availability statements, or supplementary materials included in this article.


