Abstract
Purpose
To characterize in vivo dendritic changes in retinal ganglion cells (RGCs) after acute (optic nerve transection, ONT) and chronic (experimental glaucoma, EG) optic nerve injury.
Methods
ONT and EG (microbead model) were carried out in Thy1-YFP mice in which the entire RGC dendritic arbor was imaged with confocal fluorescence scanning laser ophthalmoscopy over two weeks in the ONT group and over two and six months, respectively, in two (groups 1 and 2) EG groups. Sholl analysis was used to quantify dendritic structure with the parameters: area under the curve (AUC), radius of the dendritic field, peak number of intersections (PI), and distance to the PI (PD).
Results
Dendritic changes were observed after three days post-ONT with significant decreases in all parameters at two weeks. In group 1 EG mice, mean (SD) intraocular pressure (IOP) was 15.2 (1.1) and 9.8 (0.3) mmHg in the EG and untreated contralateral eyes, respectively, with a significant corresponding decrease in AUC, PI, and PD, but not radius. In group 2 mice, the respective IOP was 13.1 (1.0) and 8.8 (0.1) mmHg, peaking at two months before trending towards baseline. Over the first two months, AUC, PI, and PD decreased significantly, with no further subsequent changes. The rates of change of the parameters after ONT was 5 to 10 times faster than in EG.
Conclusions
Rapid dendritic changes occurred after ONT, while changes in EG were slower and associated with level of IOP increase. The earliest alterations were loss of inner neurites without change in dendritic field.
Keywords: transgenic mouse, dendritic structure, sholl analysis, in vivo imaging
Glaucoma is a neurogenerative optic neuropathy characterized by progressive loss of retinal ganglion cells (RGCs). The precise mechanisms of RGC loss in glaucoma are not fully understood, however, intraocular pressure (IOP) has consistently been shown to be an important risk factor for the development and progression of the disease.1 RGC degeneration is characterized by the retraction of dendrites towards the soma, dendritic pruning, and a loss in branching complexity,2,3 resulting in a decrease in the number of synaptic connections between cells and loss of function.4 Therefore, characterizing early changes in dendritic structure may help elucidate the mechanisms of damage and provide a useful assay for both the rate of RGC deterioration and potential rescue in neuroprotective strategies.
Feng and colleagues introduced transgenic mouse strains that express fluorescent proteins through specific promoters that allow visualization of individual RGCs.5 For example, yellow fluorescent protein (YFP) is expressed under the control of the Thy1 gene promoter in the Thy1-YFP line H transgenic mouse strain.6 In this strain, only 0.2% of RGCs express YFP,6,7 consequently, the low background fluorescence in the retina permits imaging of the entire extent of the RGCs to study alterations in dendritic structure following injury. Most studies have used cross-sectional analyses to quantify these changes following various experimental models of damage, including optic nerve crush3 and glaucoma.3,8,9 They demonstrated significant effects on dendritic structure, however, because the quantification was performed in retinal whole-mounts, it was not possible to document changes in individual RGCs over time.
The retina is the only part of the CNS that permits noninvasive optical imaging of single neurons in vivo. With fluorescence confocal scanning laser ophthalmoscopy10,11 (CSLO) it is possible to longitudinally image individual RGCs over time following experimental injury. Dendritic retraction and axonal loss were shown to precede somal loss in vivo after optic nerve crush.10 Similar structural changes to dendritic arbors were also observed in vivo following an ischemia-reperfusion injury.12 Thus far, however, the effects of a nonacute optic nerve injury, more representative of glaucoma, on longitudinally measured dendritic changes have not been reported. The purpose of this study was to compare the impact of acute (optic nerve transection, ONT) and chronic (experimental glaucoma, EG) optic nerve injury on RGC dendritic morphology with longitudinal in vivo imaging.
Materials and Methods
Animal Preparation
B6.Cg-Tg(Thy1-YFP)HJrs/J mice (Jackson Laboratory, Bar Harbor, ME; Stock number: 003782) were used in each of four groups: control, ONT, and two EG groups. The mice were bred at the Carleton Animal Care Facility, Dalhousie University, Halifax, Canada. Protocols were approved by the Dalhousie University Committee on Laboratory Animals, and all procedures were performed in accordance with regulations established by the Canadian Council on Animal Care and the Association for Research in Vision and Ophthalmology Statement for the use of animals in Ophthalmic and Vision Research.
Mice were anesthetized with 2% isoflurane (Baxter Corporation, Mississauga, ON, Canada) and 1% O2 administered via a nose cone. Anesthesia was achieved with this method for all procedures.
A CSLO device modified for rodents11 (Spectralis Multiline, Heidelberg Engineering GmbH, Heidelberg, Germany) was used to screen mice from the breeding colony with YFP-positive RGCs for use in the experiments. The imaging procedure is described below.
Control
Mice in the control group had no procedures (except anesthesia necessary for imaging) performed and were imaged longitudinally to determine test-retest variability.
Optic Nerve Transection (ONT)
Mice were anesthetized and secured in a stereotaxic frame. An incision was made in the skin above the left eyelid to expose the orbital ridge. The superior rectus muscle was dissected, and the underlying tissue carefully displaced to expose the optic nerve. An incision was made in the dura, and the optic nerve was cut within the dural sheath with Vannas scissors 0.5 to 1 mm posterior to the globe. The incisions in the superior rectus and skin were sutured.
Experimental Glaucoma (EG)
The EG model was based on a previously described study.13 Following anesthesia, the left eye was dilated with 1% tropicamide and 2.5% phenylephrine hydrochloride (Alcon Canada Inc., Mississauga, ON, Canada). A 5 µL solution containing 5 µm magnetic polystyrene microbeads (8 × 10⁶ beads/mL, Invitrogen, Carlsbad, CA, USA) was injected slowly into the anterior chamber with a small cannula. The injection site was proximal to the limbus to avoid beads lodging in the iris or lens. Following removal of the cannula, a magnet was used to displace the microbeads laterally towards the anterior chamber angle and to ensure there were no beads within the pupillary plane that could compromise image quality. Animals with ≥ 3 mm Hg increase in IOP from baseline within the first two weeks following injection were included in the study. Experiments were conducted sequentially in two groups, one in which the time course was shorter (group 1, followed for two months) and one in which it was longer (group 2, followed for six months).
Intraocular Pressure (IOP)
For mice in the EG group, IOP was measured in both eyes with a rebound tonometer (TonoLab, Tiolat, Inc., Helsinki, Finland) after five minutes of light anesthesia. IOP measurements were made at baseline, prior to injection of the microbeads, and then approximately weekly in both group 1 and group 2 mice. The mean of 10 readings in succession was taken as the IOP measurement. The IOP increase at each time point was computed as the IOP in the EG eye minus the IOP in the untreated contralateral eye. The overall mean IOP increase was computed.
In Vivo Imaging
Prior to imaging, the left pupil was dilated with 1% tropicamide and 2.5% phenylephrine hydrochloride (Alcon Canada Inc.). Anesthesia was maintained with 2% isoflurane and 1% O2 administered via a nose cone and the mouse was placed on a heating pad in a stereotaxic device as described previously.11 The setup allows precise alignment of the CSLO imaging pathway with the mouse entrance pupil. A custom-made polymethyl methacrylate contact lens (Cantor and Nissel Limited, Brackley, UK) was placed on the cornea to maintain hydration and good image quality.
All RGCs within a 30° field of view, centered on the optic nerve head, were imaged. The CSLO contains numerous features to enhance image quality. Real-time eye tracking during image acquisition ensures that the imaged area is locked, largely eliminating motion artifacts due to respiration.11 The software also registers all follow-up images to baseline prior to acquisition such that precisely the same area is imaged over time. In this case, the same RGC is imaged over time, ensuring that the dendritic arbor for each RGC is tracked accurately. Fluorescence images were acquired with 488 nm excitation and emission bandpass filter of 500 to 550 nm.11
Mice in the control group were imaged weekly over four weeks. In the other groups, imaging sessions were performed at baseline, that is, prior to induction of injury and twice a week in the ONT group, weekly in group 1 EG group, and weekly over the first two months and thereafter monthly in the group 2 EG mice.
Sholl Analysis
The in vivo images were imported to public domain software (ImageJ, National Institutes of Health, Bethesda, MD, USA) with the Simple Neurite Tracer14 and Sholl Analysis15 plug-ins. For each time point, each imaged RGC was traced in a semiautomated manner to generate skeleton images. Concentric rings spaced 10 µm apart from the center of the soma were placed around the skeleton images to quantify the number of intersections at each ring. With this information, Sholl profiles or curves that plot the number of intersections as a function of distance from the soma for each RGC at each time point were generated. The parameter, area under the curve (AUC), summarizes the overall degree of dendritic arbor complexity. Three other parameters that contribute to the AUC were computed: (1) radius: a measure of the size of the dendritic field size; (2) peak number of intersections (PI): the peak number of intersections at a given concentric ring; and (3) distance to the peak number of intersections (PD): the distance from the soma to the concentric ring with PI.
Quantification of RGC Loss
Retinas from both eyes of the two groups of EG mice were whole-mounted as previously described.16 Briefly, retinas were isolated, flattened, and incubated with anti-RBPMS (a RGC-specific marker).17 Retinas were then mounted on microscope slides with antifade media and viewed with fluorescence microscopy (Axio Imager M2, Carl Zeiss, Oberkochen, Germany) with a fluorescent light source (X-Cite 120Q, Excelitas Technologies, Waltham, MA, USA). Micrographs of 12 areas, each 318 × 318 µm, approximately 0.5, 1.0, and 1.5 mm from the optic nerve head in each quadrant, were obtained (Axiocam 506, Carl Zeiss). The RBPMS positive cells were manually quantified and RGC density calculated as an average of the 12 micrographs per eye. RGC loss was expressed as a percentage relative to the untreated contralateral eye.
Statistical Analysis
In the control group, we estimated the variability of the Sholl analysis parameters, computing the mean within-cell standard deviation18 and coefficient of variation (COV). A one-way analysis of variance was used to analyze the location of the RGCs imaged, RBPMS counts were compared with a paired t-test and correlation analysis was conducted with the Pearson correlation coefficient.
In the ONT and EG groups, we estimated the mean daily AUC reduction with linear mixed effect models to account for the correlation between observations of the same RGCs and mice. The models had AUC as the response variable, day as the predictor variable, with random intercepts and slopes at the RGC and animal levels (RGCs nested within animals). To estimate the mean effect of IOP increase on AUC daily reduction, we added an interaction term between the predictor variable, day, and a new predictor variable, cumulative mean IOP increase, to the linear mixed effect model.
Statistical analyses were carried out with IBM SPSS Statistics (v. 26, IBM, Armonk, NY, USA) and the open-source software R (version 3.4.3, R Core Team, 2017. R: A language and environment for statistical computing. R Foundation for Statistical Computing, Vienna, Austria. URL https://www.R-project.org/) and package “nlme” version 3.1-131.
Results
Control Group
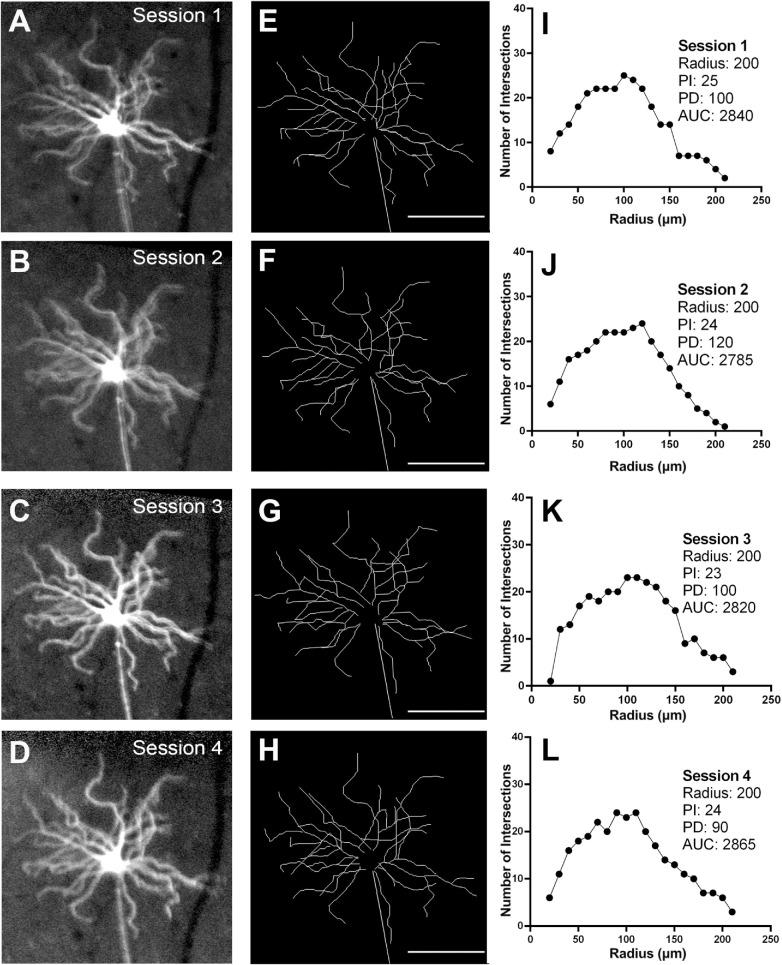
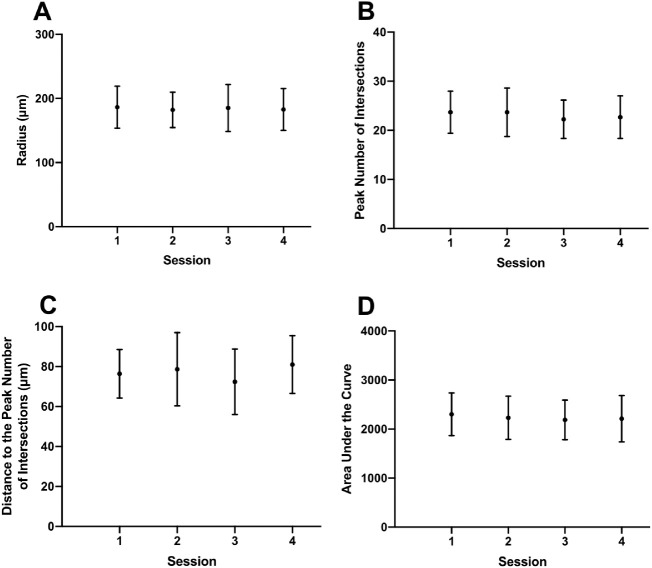
There were seven mice in the control group in which 22 RGCs were longitudinally imaged and analyzed. Since no procedures were performed in these animals, the variations in the Sholl profile data provided an estimate of normal test-retest variability. Figure 1 shows a representative example of a YFP-positive RGC from the same mouse imaged weekly over a four-week period (Figs. 1A–D). Skeletonized images (Figs. 1E–H) and Sholl profiles (Figs. 1I–L) show the variation between imaging sessions for one RGC, and for the whole population of RGCs imaged (Fig. 2). The variability statistics, including mean, SD, and COV for the Sholl analysis parameters are shown in Table 1. Variability was highest with PD and lowest with radius.
Figure 1.
Longitudinal in vivo imaging of a Thy1-YFP transgenic mouse in the control group imaged weekly over four weeks to quantify the variability of parameters derived with Sholl analysis. Following in vivo imaging, YFP-positive cells were traced and Sholl profiles derived. Magnified view of one RGC the over the four imaging sessions (A–D), corresponding traces (E–H), and Sholl profiles (I–L). PI, peak number of intersections; PD, distance to the peak number of intersections; radius; AUC, area under the curve. Scale bar: 100 µm.
Figure 2.
Longitudinal changes in radius (A), peak number of intersections (B), distance to the peak number of intersections (C), and area under the curve (D) for the RGCs analyzed in the control group over four imaging sessions. Dots represent means and the error bars represent one standard deviation on either side of the mean.
Table 1.
Variability of Sholl Analysis Parameters in the Control Group
| Mean (SD) | Within-Cell SD | Within-Cell CoV | |
|---|---|---|---|
| Radius (µm) | 188 (5) | 12.87 | 6.38 |
| PI | 25 (2) | 1.85 | 7.66 |
| PD (µm) | 77 (8) | 9.59 | 12.57 |
| AUC | 2426 (113) | 147.81 | 6.71 |
SD, standard deviation; CoV, coefficient of variation; PI, peak number of intersections; PD, distance to the peak number of intersections; AUC, area under the curve.
Optic Nerve Transection (ONT)
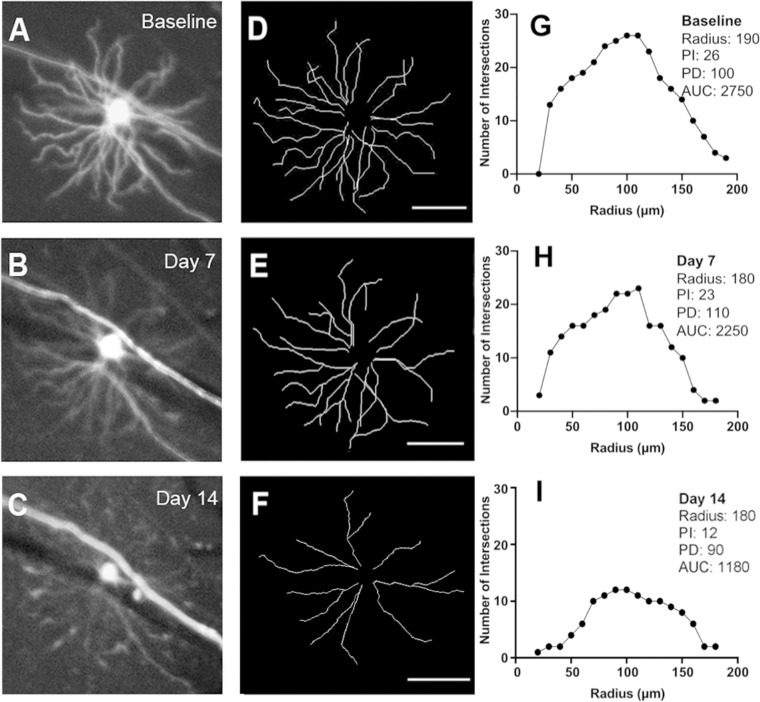
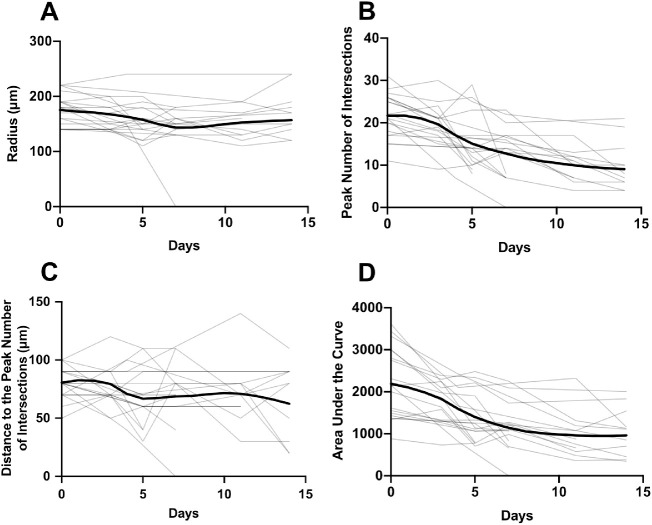
There were nine mice in the ONT group in which 20 RGCs were longitudinally imaged and analyzed. Changes in RGC dendritic structure were detected as early as three days following ONT, with a notable decrease in mean PI and AUC over two weeks (Table 2). Images from a single mouse are shown in Figure 3, while group data are shown in Figure 4.
Table 2.
Sholl Analysis Parameters in the Optic Nerve Transection Group*
| Baseline | Day 3 | Day 7 | Day 14 | |
|---|---|---|---|---|
| Radius (µm) | 176 (29) | 161 (24) | 141 (42) | 156 (63) |
| PI | 22 (5) | 20 (5) | 13 (6) | 9 (6) |
| PD (µm) | 81 (13) | 79 (17) | 72 (27) | 63 (36) |
| AUC | 2189 (812) | 1802 (505) | 1162 (559) | 960 (621) |
Values shown are mean (standard deviation).
PI, peak number of intersections; PD, distance to the peak number of intersections; AUC, area under the curve.
Figure 3.
Longitudinal in vivo imaging of a Thy1-YFP transgenic mouse in the optic nerve transection (ONT) group. Magnified view of one RGC at baseline (A) and at seven (B) and 14 (C) days after ONT. Corresponding traces (D–F) and Sholl profiles (G–I). PI, peak number of intersections; PD, distance to the peak number of intersections; AUC, area under the curve. Scale bar: 100 µm.
Figure 4.
Longitudinal changes in radius (A), peak number of intersections (B), distance to the peak number of intersections (C), and area under the curve (D) for all RGCs analyzed in optic nerve transection group (ONT, light lines). Each gray trace represents data from one retinal ganglion cell while the bold trace represents the mean time course computed by local regression (LOESS fit).
Experimental Glaucoma (EG)
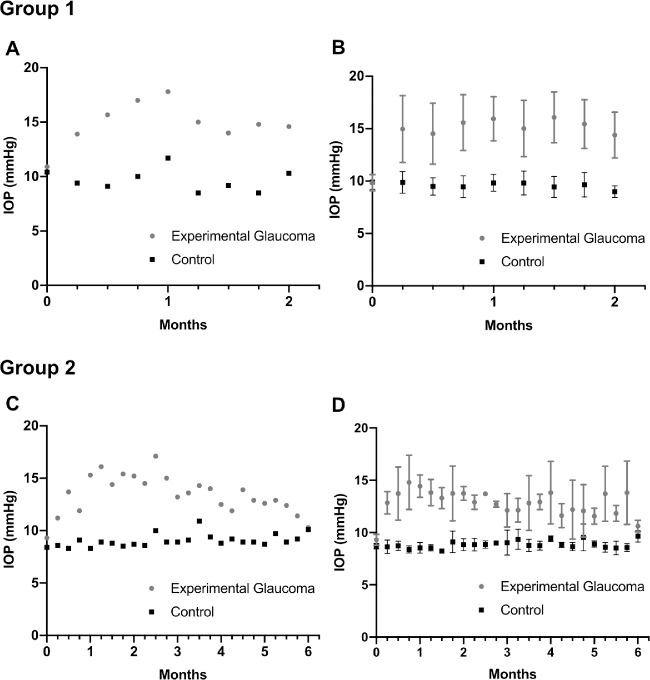
Groups 1 and 2 contained 11 and 8 mice, respectively, in which 26 and 20 RGCs, respectively, were longitudinally imaged and analyzed. The mean IOP (SD) over two months in the group 1 EG and untreated contralateral eyes was 15.2 (1.1) mm Hg and 9.8 (0.3) mm Hg, respectively (Figs. 5A and 5B). The mean IOP over six months in the group 2 EG and untreated contralateral eyes was 13.1 (1) and 8.8 (0.3) mm Hg, respectively. The mean peak IOP of 15.0 (2.5) mm Hg occurred at around 21 days and was maintained for approximately two months before IOP gradually converged towards baseline values (Figs. 5C and 5D). Summary statistics for the Sholl analysis parameters for group 1 and group 2 mice at different time points are shown in Tables 3 and 4, respectively.
Figure 5.
The time course of intraocular pressure (IOP) in the experimental glaucoma (EG) and untreated contralateral eye in one representative mouse from group 1 (A) and group 2 (C) and in all animals in group 1 (B) and group 2 (D). Error bars represent one standard deviation on either side of the mean.
Table 3.
Sholl Analysis Parameters in Experimental Glaucoma (Group 1)*
| Baseline | Month 1 | Month 2 | |
|---|---|---|---|
| Radius (µm) | 168 (26) | 164 (30) | 175 (18) |
| PI | 23 (5) | 19 (4) | 20 (3) |
| PD (µm) | 78 (16) | 64 (24) | 80 (14) |
| AUC | 2120 (532) | 1762 (452) | 1814 (431) |
Values shown are mean (standard deviation).
PI, peak number of intersections; PD, distance to the peak number of intersections; AUC, area under the curve.
Table 4.
Sholl Analysis Parameters in Experimental Glaucoma (Group 2)*
| Baseline | Month 2 | Month 4 | Month 6 | |
|---|---|---|---|---|
| Radius (µm) | 191 (3) | 189 (32) | 180 (31) | 191 (43) |
| PI | 28 (3) | 26 (3) | 27 (3) | 24 (3) |
| PD (µm) | 90 (22) | 94 (29) | 70 (13) | 90 (28) |
| AUC | 3044 (531) | 2750 (810) | 2677 (401) | 2688 (723) |
Values shown are mean (standard deviation).
PI, peak number of intersections; PD, distance to the peak number of intersections; AUC, area under the curve.
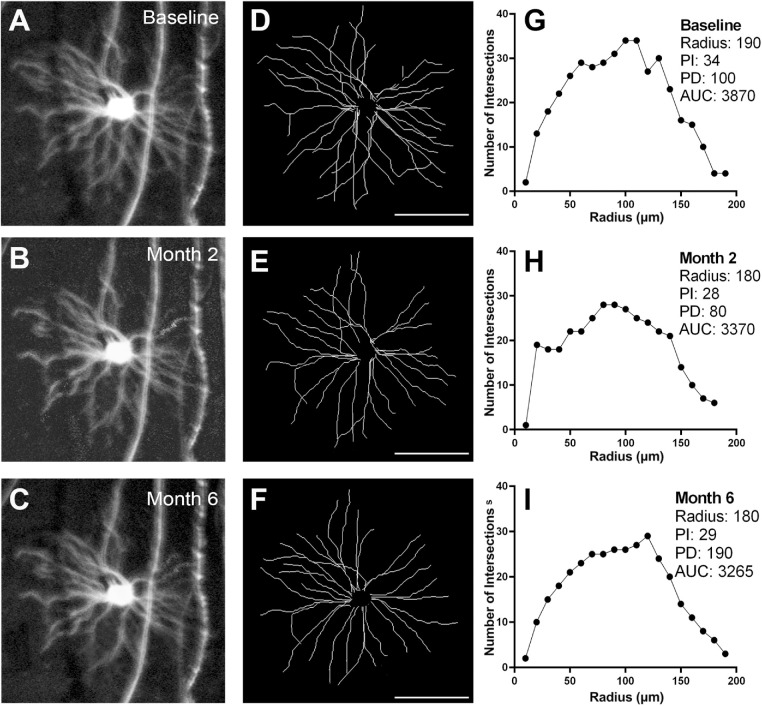
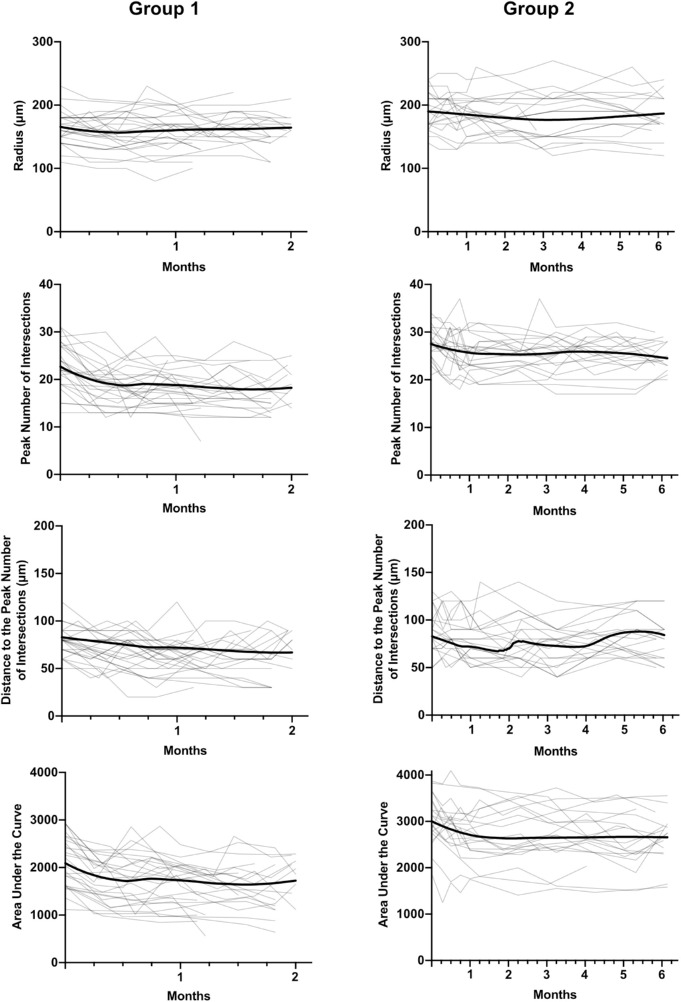
Representative longitudinal images from a group 2 mouse are shown in Figure 6. The changes in Sholl analysis parameters to two months were similar to those of group 1 mice (Fig. 7).
Figure 6.
Longitudinal in vivo imaging of a Thy1-YFP transgenic mouse in the group 2 experimental glaucoma (EG) group. Magnified view of one RGC at baseline (A) and at two (B) and six (C) months after induction of EG. Corresponding traces (D–F) and Sholl profiles (G–I). PI, peak number of intersections; PD, distance to the peak number of intersections; AUC, area under the curve. Scale bar: 100 µm.
Figure 7.
Longitudinal changes in radius, peak number of intersections, distance to the peak number of intersections, and area under the curve for all RGCs analyzed in the group 1 and group 2 experimental glaucoma groups (EG, light lines). Each gray trace represents data from one retinal ganglion cell while the bold trace represents the mean time course computed by local regression (LOESS fit).
Location of Imaged RGCs
The location of all 88 RGCs in the four groups that were longitudinally imaged is shown in Figure 8. The number of RGCs in superior-temporal, superior-nasal, inferior-nasal and inferior-temporal quadrants was 18, 25, 25, and 20, respectively. There was no difference in retinal eccentricity of the RGCs imaged among the four groups (P = 0.432). Furthermore, there was no correlation between baseline AUC and retinal eccentricity (P = 0.724), or in the relative change in AUC and retinal eccentricity in either the ONT (P = 0.118) or EG (P = 0.822) groups.
Figure 8.
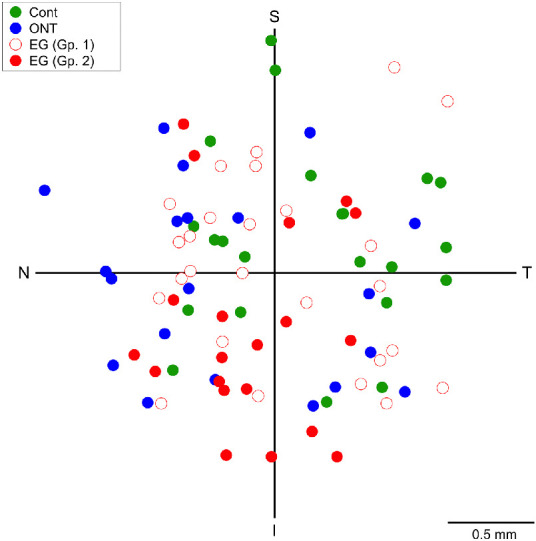
Spatial distribution of the retinal ganglion cells imaged longitudinally in the four groups. Cont, control (test-retest variability); ONT, optic nerve transection; EG (Gp. 1), experimental glaucoma group 1; EG (Gp. 2), experimental glaucoma group 2; T, temporal; S, superior; N, nasal; I, inferior.
Rate of Change in Sholl Analysis Parameters
There was a highly significant reduction over time in PI and AUC (Table 5) and less statistically significant reductions in PD and radius (Table 5).
Table 5.
Change in Sholl Analysis Parameters in the Experimental Glaucoma Groups*
| Optic Nerve Transection | Group 1 | Group 2 (0–2 Months) | Group 2 (2–6 Months) | |
|---|---|---|---|---|
| Radius (µm) | 2.01‡ | 0.150 | 0.230 | 0.01 |
| PI | 1.07‡‡‡ | 0.09‡‡‡ | 0.06‡‡ | 0.00 |
| PD (µm) | 1.50‡ | 0.28‡‡ | 0.24‡‡ | 0.02 |
| AUC | 107.84‡‡‡ | 9.78‡‡‡ | 10.64‡‡‡ | 1.04 |
Values shown are rates per day.
P < 0.05;
P < 0.01,
P < 0.001.
PI, peak number of intersections; PD, distance to the peak number of intersections; AUC, area under the curve.
In group 1 EG mice, there were significant reductions in PI, PD, and AUC over time, however, the change in radius was not statistically significant (Table 5). Over the first two months in the group 2 mice, the rates of change in all four parameters were similar to those of group 1 mice, however, changes over the following four months were negligible and not statistically significant in any of the parameters (Table 5).
Compared to rates in group 1 EG mice and up to two months on the group 2 mice, those in the ONT group had rates of change in the parameters that were 5 to 10 times higher. Unlike the ONT mice the rate of change in radius was not statistically significant in any of the EG mice.
In both group 1 and group 2 EG mice, the rate of change in AUC was significantly related to the level of IOP, with each 1 mm of mean IOP increase compared to the untreated contralateral eye to a given day leading to a 1.85 units per day faster decrease in AUC.
RGC Loss With RBPMS Immunohistochemistry
The mean (SD) density of RBPMS-positive cells in the EG eyes and untreated contralateral eyes was 3620 (259) cells/mm2 and 3836 (258) cells/mm2. The RGC density in EG eyes was significantly lower compared to the untreated eyes (P < 0.01) and amounted to a mean percentage loss of 5.4%. There was a modest correlation between the degree of RGC loss and IOP elevation (r = 0.315).
Discussion
In this study we demonstrated in vivo longitudinal changes to RGC dendritic structure in models of acute and chronic optic nerve injury. These morphological changes were detectable as early as three days following ONT, an injury that cuts every RGC axon within the optic nerve and triggers RGC apoptosis.19,20
To date, reports on single RGC changes in both nonhuman primate and rodent EG have been limited mostly to histological studies where retinas have been examined after processing. With this methodology, it is impossible to determine which changes have occurred at the single RGC level as all comparisons can only be made at one time point with untreated eyes. This approach has significant limitations as the selection of which RGGs in untreated eyes are selected for comparison given their vast heterogeneity6,7,10,21 could critically affect the findings. To the best of our knowledge, we report for the first time changes evaluated in vivo in chronic EG. This approach has allowed us to study changes in the same RGC over periods extending to six months. Although there have been published studies on RGC dendritic changes in the Thy1-YFP strain with longitudinal in vivo imaging, these studies have been limited to the acute models of optic nerve crush10 and retinal ischemia.12
Loss of branching complexity and dendritic retraction have been shown previously in rodent models of RGC damage.3,8,10,12,22 Similar findings in nonhuman primate models of EG have also been reported,2,23 consistent across the midget and parasol subclasses of RGCs.23 We demonstrated that following ONT there was a significant mean decrease in the AUC, presumably due to dendritic pruning (as quantified by PI) and decrease in the dendritic field (as quantified by radius). The changes in EG were relatively modest, with rates of change in Sholl parameters that were around 5- to 10-fold lower compared to ONT. Assuming that eventual death of RGCs occurs in a comparable manner in these models, our findings in the last four months of group 2 EG mice, the first two months of groups 1 and 2 EG mice, and ONT mice can be considered as the continuum of RGC changes. Therefore, the initial changes in RGCs occur with loss of inner neurites and branching, from the periphery of the RGC towards the soma, as the PD also decreased, followed by eventual decrease in the overall dendritic arbor. Hence, the changes we observed in the EG mice were possibly the earliest structural alterations in RGC morphology following optic nerve damage. However, it should be acknowledged that CSLO has lower transverse resolution compared to microscopy in retinal whole-mounts and the most peripheral dendrites may be relatively out of focus compared to the more proximal branches. For these reasons, in vivo imaging could potentially fail to detect subtle changes in the most peripheral dendrites, which could also be the earliest alterations in EG.
In the EG mice, modest IOP elevation caused significant decreases in AUC, PI, and PD over the first two months (observed in both group 1 and 2 mice). These changes to dendritic morphology did not continue in the subsequent four months (group 2 EG mice), mirroring the time course of IOP which reached a peak at around two months, whereafter IOP trended towards baseline values. Morphological change occurred when the IOP was higher, however, further change may presumably have required a sustained elevation of IOP, which was not achieved. However, there are at least two other explanations for these findings. First, there could be a compensatory mechanism for RGCs to attempt to maintain their synaptic connections within the neural network. This type of remodeling or maintenance of synaptic connection following injury has been shown previously in avian and rodent models of optic nerve damage.24,25 Second, regeneration of RGCs could occur following removal of the noxious factor,26 in this case, elevated IOP, resulting in the appearance of stabilization of the dendritic arbor.
Repeated injections of magnetic microbeads can be used to re-elevate IOP.27 While this method effectively increases IOP for longer periods of time, we elected not to perform a second injection to minimize the risk of reducing optical clarity with additional microbeads, either in the anterior chamber or adhering to the corneal endothelium, compromising image quality and the ability to image over an extended period of time. With RBPMS immunohistochemistry, we showed a highly significant, though limited, loss of RGCs in the EG eyes compared to the untreated contralateral eyes, constrained by the modest IOP elevation we could achieve. On the other hand, this modest IOP elevation has allowed us to characterize the earliest changes in RGC dendritic morphology in EG, which we believe are real for at least three reasons. First, in both EG groups, the mean change in PI and AUC was around twice that of the coefficient of variation estimated in the control (test-retest variability) group. Second, the reductions in PI, PD, and AUC in both group 1 and group 2 (up to two months) EG mice were statistically significant compared to baseline. Third, the rate of change in AUC was related to the degree of IOP elevation.
There was no selection bias due to retinal eccentricity in RGCs that were imaged as neither baseline AUC or change in AUC in the ONT and EG groups was correlated with retinal eccentricity. However, our findings could have been influenced by variations in the susceptibility and morphological changes to OFF-8,28 and ON-type RGCs.28 OFF- and ON-type RGCs differ in their responses to light and in their stratification within the retina. OFF-RGCs increase their firing rates in the absence of light, and their processes stratify into sublamina a of the inner plexiform layer, whereas ON-RGCs increase their firing rates in the presence of light, stratifying in sublamina b.29 Della Santina and colleagues examined the functional changes to transient and sustained ON and OFF RGCs in an in situ study of EG in Thy1-YFP mice.30 They found that OFF-transient RGCs had rapid decreases in their structural and functional integrity, while ON-transient RGCs had a decrease in firing rates after IOP elevation in spite of little change in their structural appearance. Because this type of functional categorization of RGCs is not yet possible in in vivo studies, such as ours, it may be possible that we inadvertently imaged a disproportionate number of subclasses of RGCs that are more structurally resistant. Finally, Williams and colleagues showed that Thy1 expression of RGCs in the Thy1-YFP mouse may occur more prominently in healthier cells or in those that are more resistant to IOP increase.31 On the other hand, Thy1 expression could be downregulated in stressed RGCs,32 giving the impression of structural loss when it may not have actually occurred. These findings could indicate sources of potential bias in the manner in which RGC dendritic morphological changes were interpreted.
In conclusion, we demonstrated in vivo changes over time to RGC dendritic morphology in the same cell in both acute (ONT) and chronic (EG) optic nerve injury models. Through only a modest elevation of IOP, we showed the earliest structural changes to RGCs, presumably prior to the changes that have been reported in other studies with higher IOP. The combined use of the Thy1-YFP mouse strain and in vivo fluorescence imaging creates possibilities for studying the earliest indicators of neuroprotection or neurorescue in models of RGC loss.
Acknowledgments
Supported by grant PJT-148673 from the Canadian Institutes of Health and Research, Grant 05243 from the Natural Sciences and Engineering Research Council of Canada, and Grant 197809 from the Atlantic Innovation Fund.
Disclosure: D.C.M. Henderson, None; J.R. Vianna, None; J. Gobran, None; J.D. Pierdomenico, None; M.L. Hooper, None; S.R.M. Farrell, None; B.C. Chauhan, None
References
- 1. Weinreb RN, Tee Khaw P. Primary open-angle glaucoma. Lancet. 2004; 363(9422): 1711–1720. [DOI] [PubMed] [Google Scholar]
- 2. Weber AJ, Kaufman PL, Hubbard WC.. Morphology of single ganglion cells in the glaucomatous primate retina. Invest Ophthalmol Vis Sci. 1998; 39(12): 2304–2320. [PubMed] [Google Scholar]
- 3. Kalesnykas G, Oglesby EN, Zack DJ, et al.. Retinal ganglion cell morphology after optic nerve crush and experimental glaucoma. Invest Ophthalmol Vis Sci. 2012; 53(7): 3847–3857. [DOI] [PMC free article] [PubMed] [Google Scholar]
- 4. Risner ML, Pasini S, Cooper ML, Lambert WS, Calkins DJ.. Axogenic mechanism enhances retinal ganglion cell excitability during early progression in glaucoma. Proc Natl Acad Sci USA. 2018; 115(10): E2393–E2402. [DOI] [PMC free article] [PubMed] [Google Scholar]
- 5. Feng G, Mellor RH, Bernstein M, et al.. Imaging neuronal subsets in transgenic mice expressing multiple spectral variants of GFP variants with altered spectral properties and improved translational efficiency, thermostability, and quantum yield. Neuron. 2000; 28(1): 41–51. [DOI] [PubMed] [Google Scholar]
- 6. Oglesby E, Quigley HA, Zack DJ, et al.. Semi-automated, quantitative analysis of retinal ganglion cell morphology in mice selectively expressing yellow fluorescent protein. Exp Eye Res. 2012; 96(1): 107–115. [DOI] [PMC free article] [PubMed] [Google Scholar]
- 7. Iaboni DSM, Farrell SR, Chauhan BC.. Morphological multivariate cluster analysis of murine retinal ganglion cells selectively expressing yellow fluorescent protein. Exp Eye Res. 2020; 196: 108044. [DOI] [PubMed] [Google Scholar]
- 8. Feng L, Zhao Y, Yoshida M, et al.. Sustained ocular hypertension induces dendritic degeneration of mouse retinal ganglion cells that depends on cell type and location. Invest Ophthalmol Vis Sci. 2013; 54(2): 1106–1117. [DOI] [PMC free article] [PubMed] [Google Scholar]
- 9. Chen H, Wei X, Cho KS, et al.. Optic neuropathy due to microbead-induced elevated intraocular pressure in the mouse. Invest Ophthalmol Vis Sci. 2011; 52(1): 36–44. [DOI] [PMC free article] [PubMed] [Google Scholar]
- 10. Leung CKS, Weinreb RN, Li ZW, et al.. Long-term in vivo imaging and measurement of dendritic shrinkage of retinal ganglion cells. Invest Ophthalmol Vis Sci. 2011; 52(3): 1539–1547. [DOI] [PubMed] [Google Scholar]
- 11. Chauhan BC, Stevens KT, Levesque JM, et al.. Longitudinal in vivo imaging of retinal ganglion cells and retinal thickness changes following optic nerve injury in mice. PLoS One. 2012; 7(6): 1–9. [DOI] [PMC free article] [PubMed] [Google Scholar]
- 12. Li ZW, Liu S, Weinreb RN, et al.. Tracking dendritic shrinkage of retinal ganglion cells after acute elevation of intraocular pressure. Invest Ophthalmol Vis Sci. 2011; 52(10): 7205–7212. [DOI] [PubMed] [Google Scholar]
- 13. Samsel PA, Kisiswa L, Erichsen JT, Cross SD, Morgan JE.. A novel method for the induction of experimental glaucoma using magnetic microspheres. Invest Ophthalmol Vis Sci. 2011; 52(3): 1671–1675. [DOI] [PubMed] [Google Scholar]
- 14. Longair MH, Baker DA, Armstrong JD.. Simple neurite tracer: open source software for reconstruction, visualization and analysis of neuronal processes. Bioinformatics. 2011; 27(17): 2453–2454. [DOI] [PubMed] [Google Scholar]
- 15. Ferreira TA, Blackman A V., Oyrer J, et al.. Neuronal morphometry directly from bitmap images. Nat Methods. 2014; 11(10): 982–984. [DOI] [PMC free article] [PubMed] [Google Scholar]
- 16. Smith CA, Chauhan BC.. Imaging retinal ganglion cells: enabling experimental technology for clinical application. Prog Retin Eye Res. 2015; 44: 1–14. [DOI] [PubMed] [Google Scholar]
- 17. Rodriguez AR, de Sevilla Müller LP, Brecha NC.. The RNA binding protein RBPMS is a selective marker of ganglion cells in the mammalian retina. J Comp Neurol. 2014; 522(6): 1411–1443. [DOI] [PMC free article] [PubMed] [Google Scholar]
- 18. Caulcutt R. Measurement Error. Res Methods Postgraduates. 3rd ed. Published online; 2012: 275–286. [Google Scholar]
- 19. Berkelaar M, Clarke DB, Wang YC, Bray GM, Aguayo AJ.. Axotomy results in delayed death and apoptosis of retinal ganglion cells in adult rats. J Neurosci. 1994; 14(7): 4368–4374. [DOI] [PMC free article] [PubMed] [Google Scholar]
- 20. Weishaupt JH, Diem R, Kermer P, Krajewski S, Reed JC, Bähr M.. Contribution of caspase-8 to apoptosis of axotomized rat retinal ganglion cells in vivo. Neurobiol Dis. 2003; 13(2): 124–135. [DOI] [PubMed] [Google Scholar]
- 21. Baden T, Berens P, Franke K, Román Rosón M, Bethge M, Euler T. The functional diversity of retinal ganglion cells in the mouse. Nature. 2016; 529(7586): 345–350. [DOI] [PMC free article] [PubMed] [Google Scholar]
- 22. Morgan JE, Datta AV, Erichsen JT, Albon J, Boulton ME.. Retinal ganglion cell remodelling in experimental glaucoma. Adv Exp Med Biol. 2005; 572: 397–402. [DOI] [PubMed] [Google Scholar]
- 23. Morgan JE, Uchida H, Caprioli J.. Retinal ganglion cell death in experimental glaucoma. Br J Ophthalmol. 2000; 84(3): 303–310. [DOI] [PMC free article] [PubMed] [Google Scholar]
- 24. Muchnick N, Hibbard E.. Avian retinal ganglion cells resistant to degeneration after optic nerve lesion. Exp Neurol. 1980; 68(2): 205–216. [DOI] [PubMed] [Google Scholar]
- 25. Lin B, Peng EB.. Retinal ganglion cells are resistant to photoreceptor loss in retinal degeneration. PLoS One. 2013; 8(6): e68084. [DOI] [PMC free article] [PubMed] [Google Scholar]
- 26. Vidal-Sanz M, Bray GM, Villegas-Pérez MP, Thanos S, Aguayo AJ.. Axonal regeneration and synapse formation in the superior colliculus by retinal ganglion cells in the adult rat. J Neurosci. 1987; 7(9): 2894–2909. [DOI] [PMC free article] [PubMed] [Google Scholar]
- 27. Sappington RM, Carlson BJ, Crish SD, Calkins DJ.. The microbead occlusion model: a paradigm for induced ocular hypertension in rats and mice. Invest Ophthalmol Vis Sci. 2010; 51(1): 207–216. [DOI] [PMC free article] [PubMed] [Google Scholar]
- 28. Chen H, Zhao Y, Liu M, et al.. Progressive degeneration of retinal and superior collicular functions in mice with sustained ocular hypertension. Invest Ophthalmol Vis Sci. 2015; 56(3): 1971–1984. [DOI] [PMC free article] [PubMed] [Google Scholar]
- 29. Kolb H, Nelson R, Ahnelt P, Cuenca N.. Cellular organization of the vertebrate retina. Prog Brain Res. 2001; 131: 3–26. [DOI] [PubMed] [Google Scholar]
- 30. Della SL, Inman DM, Lupien CB, Horner PJ, Wong ROL. Differential progression of structural and functional alterations in distinct retinal ganglion cell types in a mouse model of glaucoma. J Neurosci. 2013; 33(44): 17444–17457. [DOI] [PMC free article] [PubMed] [Google Scholar]
- 31. Williams PA, Howell GR, Barbay JM, et al.. Retinal ganglion cell dendritic atrophy in DBA/2J glaucoma. PLoS One. 2013; 8(8): e72282. [DOI] [PMC free article] [PubMed] [Google Scholar]
- 32. Huang W, Fileta J, Guo Y, Grosskreutz CL.. Downregulation of Thy1 in retinal ganglion cells in experimental glaucoma. Curr Eye Res. 2006; 31(3): 265–271 [DOI] [PubMed] [Google Scholar]


