

Abstract
Neuropeptides mediate cell–cell signaling in the nervous and endocrine systems. The neuropeptidome is the spectrum of peptides generated from precursors by proteolysis within dense core secretory vesicles (DCSV). DCSV neuropeptides and contents are released to the extracellular environment where further processing for neuropeptide formation may occur. To assess the DCSV proteolytic capacity for production of neuropeptidomes at intravesicular pH 5.5 and extracellular pH 7.2, neuropeptidomics, proteomics, and protease assays were conducted using chromaffin granules (CG) purified from adrenal medulla. CG are an established model of DCSV. The CG neuropeptidome consisted of 1239 unique peptides derived from 15 proneuropeptides that were colocalized with 64 proteases. Distinct CG neuropeptidomes were generated at the internal DCSV pH of 5.5 compared to the extracellular pH of 7.2. Class-specific protease inhibitors differentially regulated neuropeptidome production involving aspartic, cysteine, serine, and metallo proteases. The substrate cleavage properties of CG proteases were assessed by multiplex substrate profiling by mass spectrometry (MSP-MS) that uses a synthetic peptide library containing diverse cleavage sites for endopeptidases and exopeptidases. Parallel inhibitor-sensitive cleavages for neuropeptidome production and peptide library proteolysis led to elucidation of six CG proteases involved in neuropeptidome production, represented by cathepsins A, B, C, D, and L and carboxypeptidase E (CPE). The MSP-MS profiles of these six enzymes represented the majority of CG proteolytic cleavages utilized for neuropeptidome production. These findings provide new insight into the DCSV proteolytic system for production of distinct neuropeptidomes at the internal CG pH of 5.5 and at the extracellular pH of 7.2.
Keywords: Neuropeptidome, protease, cathepsin, chromaffin granule, extracellular, peptidomics
Introduction
The neuropeptidome within dense core secretory vesicles (DCSV) of adrenal medulla, known as chromaffin granules (CG), provides a diverse and rich source of neuropeptides that mediate cell–cell communication in response to stress.1−5 The CG provide a model of the DCSV organelle system for the production and release of neuropeptides in the nervous and endocrine systems.6−9 Neuropeptides comprise hundreds to thousands of unique peptides whose primary amino acid sequences designate their biological activities as peptide neurotransmitters and peptide hormones.10−16 Within CG, diverse neuropeptides are generated from their proneuropeptide precursors by proteolytic processing.12,15,17 The coordinate biosynthesis of CG neuropeptides by proteases is necessary for adrenal medullary chromaffin cells to respond to stress through release of cell signaling neuropeptides.
Neuropeptidomes are generated by the endogenous DCSV protease system to convert proneuropeptides into peptide products.12,15,16 Several types of proteases are utilized in DCSV for neuropeptide formation consisting of endopeptidases cleaving within protein sequences of precursors at dibasic as well as at nonbasic residues, followed by exopeptidases that further process peptide intermediates into mature neuropeptides. Elucidation of the complex repertoire of endopeptidase and exopeptidase activities involved in proneuropeptide processing can facilitate the challenge of understanding systems of proteases for neuropeptidome production, as prior studies have largely studied individual proteases in processing proneuropeptides.12,15,17 The complexity of neuropeptide production by the simultaneous actions of multiple DCSV proteases has not been revealed. Therefore, this study investigated proteolytic mechanisms of neuropeptidome production in DCSV modeled by CG using proteomics, peptidomics, and peptide cleavage profiling by mass spectrometry.
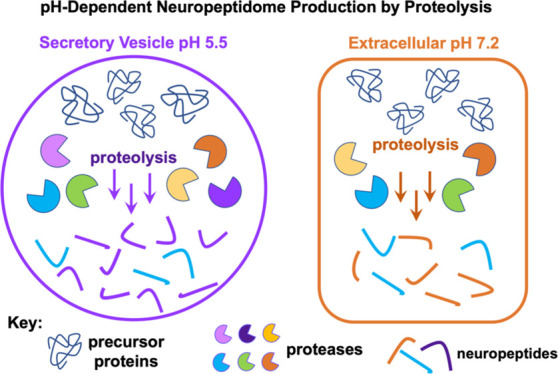
The CG neuropeptidome is produced within the intravesicular acidic pH of 5.5 for DCSV18−20 for subsequent release to the extracellular environment of pH 7.2.21−23 It is likely that neuropeptidome production may also occur at the extracellular neutral pH condition, since soluble CG proteases would be cosecreted with precursors of the neuropeptidome. Therefore, the goal of this study was to gain understanding of neuropeptidome production at intravesicular pH 5.5 compared to extracellular pH 7.2 by aspartic, cysteine, serine, and metallo protease classes of highly purified CG. Results of these peptidomics and proteomics studies demonstrated that distinct CG neuropeptidomes are generated at pH 5.5 compared to pH 7.2 for numerous peptides including the chromogranins, secretogranins, enkephalins, neuropeptide Y, VIP, and galanin. Furthermore, CG proteolytic cleavages for neuropeptidome production used differential profiles of protease classes at each of the pH 5.5 and 7.2 conditions.
To define the CG proteolytic properties utilized for neuropeptidome production, CG cleavage profiles were characterized by multiplex substrate profiling by mass spectrometry (MSP-MS) which uses a peptide substrate library consisting of 228 synthetic tetradecapeptides designed to contain diverse protease cleavage sites.24−26 The MSP-MS assays distinguish endopeptidases and exopeptidases in complex biological samples such as plasma, pancreatic cyst fluid, and gastric juice.25−28 Inhibitor-sensitive cleavage profiles of CG proteolysis in MSP-MS assays matched endogenous cleavages utilized for neuropeptidome production and led to identification of CG proteases that matched the cleavage properties of cathepsins A, B, C, D, and L, combined with carboxypeptidase E (CPE). Recombinant purified forms of these six proteases in MSP-MS assays confirmed their CG-like cleavage properties. Support for the roles of these six proteases in the production of selected neuropeptides has also been provided in the literature. These results demonstrate the differential CG proteolytic activities utilized for neuropeptidome production at the intravesicular pH of 5.5 compared to the extracellular pH of 7.2. These findings indicate that neuropeptidome diversity is generated by proteolysis within DCSV as well as by extracellular postrelease processing mechanisms.
Results
Strategy for Analyzing Neuropeptidome Production by the DCSV Chromaffin Granule Proteolytic System
To gain understanding of the protease systems involved in production of the CG neuropeptidome, highly purified CG from bovine adrenal medulla were analyzed by proteomics, peptidomics, and proteolytic cleavage profiling assays by MSP-MS (Figure 1). The endogenous CG proneuropeptide precursors and proteases were identified by proteomics (Figure 1A). Neuropeptidomics defined the spectrum of peptides derived from processing of proneuropeptides utilizing the proteolytic capacity of the CG at the intravesicular pH of 5.5 and at the extracellular pH of 7.2 (Figure 1B). Furthermore, class-specific protease inhibitors indicated roles for aspartic, cysteine, serine, and metallo protease classes in neuropeptidome production. Deconvolution of the complexity of the CG protease activities was achieved by MSP-MS analysis of the peptide substrate cleavage profiles in the presence of class-specific protease inhibitors (Figure 1C), combined with evaluation of recombinant proteases that represented the major CG cleavage profiles involved in neuropeptidome production at pH 5.5 and pH 7.2.
Figure 1.
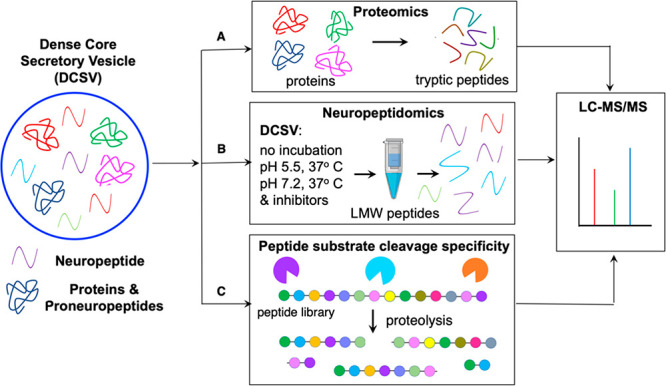
Neuropeptidome production by proteolysis by chromaffin granules (CG) at pH 5.5 within DCSV and at pH 7.2 of the extracellular environment. The production of the spectrum of diverse neuropeptides, the neuropeptidome, was analyzed in DCSV modeled by purified CG from adrenal medulla (bovine) by (A) proteomics identification of proneuropeptides and proteases, (B) neuropeptidomics analyses of neuropeptides generated during incubation of CG at the intravesicular pH 5.5 within DCSV and at the extracellular pH of 7.2, conducted in the absence and presence of class-specific protease inhibitors, and (C) proteolytic cleavage specificity analyses of CG proteases using a synthetic peptide substrate library by multiplex substrate profiling by mass spectrometry (MSP-MS) assays.
Proteomics Reveals Proteases, Proneuropeptides, and Neuropeptides in Chromaffin Granules of Adrenal Medulla
We isolated chromaffin granules from bovine adrenal medulla and identified 2110 unique proteins by proteomics (supplementary data 1). Proteins were grouped into 24 categories by gene ontology analysis. As expected, numerous proteins were categorized as proteases, enzyme modulators, and neuropeptide signaling molecules since the nervous system utilizes DCSV for regulated secretion of neuropeptides whose maturation requires proteolytic processing (Figure S1A). Structural proteins as well as proteins that regulate calcium binding, vesicular trafficking, and exocytosis are also abundant components of CG and provide components of the internal vesicle environment for biosynthesis, storage, and stimulated secretion of neurotransmitters and hormones.
With respect to proteolytic enzymes, the CG contain 64 distinct proteases, corresponding to 2.53% of the total protein abundance in the CG proteome as calculated by normalized spectral abundance factor (NSAF)29 (Figure S1B). These enzymes were further categorized by catalytic protease classes, revealing the presence of 2 aspartic proteases, 17 cysteine proteases, 21 serine proteases, and 24 metallo proteases (Figure 2A). Metallo proteases were the most abundant class of proteases by NSAF, followed by serine, cysteine, and aspartic proteases (Figure 2B). With respect to neuropeptide precursors, 15 well-characterized proneuropeptides were identified including chromogranins A and B (CHGA and CHGB), proenkephalin (PENK), neuropeptide Y (NPY), and secretogranins (Figure 2C). The proneuropeptides accounted for 8.79% of the total protein abundance in the chromaffin granules (Figure S1B), with chromogranin A being the most abundant proneuropeptide (Figure 2C).
Figure 2.

Diverse proteases and neuropeptides identified in CG by proteomics and peptidomics. (A) CG proteases numbering 64 were identified by proteomics and were categorized into four different classes. (B) Proteases were quantified by NSAF (normalized spectral abundance factor), and abundances are illustrated by the pie chart. (C) Proneuropeptides were identified by proteomics and quantified by NSAF. (D) Peptidomics identified 1981 unique peptides of which 1239 were derived from 12 different proneuropeptides. (E) Sequence logo shows the frequency of amino acids at the amino and carboxyl termini of proneuropeptide-derived peptides (shown by the gray area) identified by peptidomics.
Peptidomics Reveals Processing of Proneuropeptides in Chromaffin Granules
To gain an understanding of the diverse proneuropeptide-derived peptides generated by CG proteases, we performed peptidomics analysis to define the neuropeptidome in CG. The endogenous peptides in CG were separated from high molecular weight (MW) proteins using a 10 kDa molecular weight cutoff filter and analyzed by LC–MS/MS tandem mass spectrometry. A total of 1981 unique peptides that ranged from 5 to 50 amino acids in length were identified and quantified (supplementary data 1). Of these, 1239 peptides were identified to be the proteolytic fragments of 15 proneuropeptides and most of them were derived from the chromogranins, PENK, adrenomedullin (ADM), and secretogranin precursors (Figure 2D).
The proteolytic cleavage specificity profile of peptides derived from proneuropeptides was generated by aligning the proteolytic fragments to the precursor and calculating the frequency of amino acids occurring at both N- and C-termini of the peptides (Figure 2E). On the basis of protease nomenclature by Schechter-Berger,30 cleavage occurs between the P1 and P1′ amino acids and the adjacent residues are defined as P2, P3, P4, etc. on the amino terminal side of the cleaved bond and as P2′, P3′, P4′, etc. on the carboxy terminal side of cleavages. We evaluated the frequency of amino acids at the P4 to P4′ positions at the N-terminal and C-terminal ends of the peptide products and discovered that the cleavage specificities were remarkably different.
At the N-terminus, Pro and Glu were frequently found at the P2′ to P4′ positions. Arg was abundant at the P1 to P4 positions, and Lys was most frequently found at the P2 position. Ser, Tyr, Ala, and Leu were common at P1′. At the C-terminal sides of the peptides, Arg was often the most abundant residue at P4 to P4′ with the notable exception being P1 where Gln, Glu, and Asp were frequently found. Lys was also abundant at P1′ to P4′. The frequent occurrence of basic amino acids near the peptide termini is consistent with previous studies showing that removal of dibasic amino acids is involved in proneuropeptide processing.12,15 As there is little similarity in amino acid preferences at each terminus (e.g., P1 on the N-terminus compared to P1 on the C-terminus), it is clear that a distinct set of proteases may cleave at each of the N- and C-terminal ends of the peptides.
Neuropeptidome Production at Intravesicular and Extracellular pH Conditions
To evaluate the dynamic protease-mediated biosynthesis of the CG neuropeptidome components, the purified CG were incubated for 30 and 90 min at 37 °C at pH 5.5 to mimic the acidic environment within the DCSV. In parallel, the same CG samples were incubated at pH 7.2 to mimic the neutral extracellular pH environment.
At pH 5.5, 646 neuropeptides increased in abundance, of which 486 were not previously found in the nonincubated peptidomics data set. In addition, 225 neuropeptides found in the initial peptidome were significantly reduced following incubation at pH 5.5 (Figure 3A). During incubation at pH 7.2, 281 neuropeptides increased in abundance while 139 were decreased. These data indicated that proteolytic activities at pH 5.5 were more prevalent than at pH 7.2.
Figure 3.

Neuropeptidome production after incubation of CG at pH 5.5 and pH 7.2 analyzed by peptidomics. (A) The Venn diagram shows the number of neuropeptides that were significantly increased or decreased after 90 min of incubation (37 °C) at pH 5.5 and pH 7.2, compared to nonincubated control CG samples. (B) Comparison of neuropeptide abundances that were significantly increased (p < 0.05) after 90 min of incubation at pH 5.5 and pH 7.2 conditions. (C, D) Sequence logos show the relative frequencies of amino acid residues flanking the amino and carboxy termini of the peptide cleavage products derived from proneuropeptides after 90 min incubation at pH 5.5 (C) and at pH 7.2 (D).
Many of the peptides identified before incubation remained unchanged following incubation at either pH condition. One possible reason for this observation is that these peptide sequences were resistant to further proteolytic processing or reached an equilibrium whereby the proteolytic formation of the peptide was equal to the rate of degradation. Another possible reason is that the change of reaction environment from intact CG to in vitro buffer conditions altered the concentrations and localization of enzymes, substrates, inhibitors, and cofactors, thereby preventing proteolysis of certain neuropeptide precursors. Either scenario maintains a stable concentration for these peptides.
Next, we compared the cleavage products formed at the two different pH conditions. Of the 852 peptides that increased in abundance at the pH 5.5 and pH 7.2 conditions, only 75 were common to both data sets (Figure 3B). The high number of distinct peptides generated at each pH condition suggested differences in proteolytic activities at the acidic pH 5.5 intravesicular condition compared to the neutral pH 7.2 extracellular environment. The relative frequencies of amino acid residues flanking the termini of the peptide cleavage products at the two pH conditions were also distinct (Figure 3C,D). At pH 5.5, Leu, Glu, Arg, or Lys was frequently found at numerous positions (P4 to P4′), with Leu being the most frequent amino acid at P1. At pH 7.2, Arg and Lys were the most frequently identified amino acids at P1 and were also found to be the most common residues at other sites (P4 to P4′). Interestingly, Leu is frequently present at P2 in the pH 7.2 assays while frequently present at P1 in the pH 5.5 assays. Taken together, these data suggest that the proteases that are active at the acidic intravesicular conditions display different substrate specificity preferences compared to the proteases that function at the neutral extracellular environment.
Differential Neuropeptidome Production Regulated by Class-Specific Protease Inhibitors at Intravesicular and Extracellular pH Conditions
Proneuropeptide processing can utilize multiple proteases within DCSV. To deconvolute the complexity of proteolytic activities, neuropeptidome production was analyzed in the presence of four class-specific protease inhibitors consisting of pepstatin, E64c, AEBSF, and EDTA that inhibit aspartic, cysteine, serine, and metallo proteases, respectively. By comparing inhibitor treated samples to control (DMSO vehicle), we were able to determine the classes of proteases that were responsible for the formation of neuropeptides. The quantification of CG peptidomics results was analyzed to show the abundance of each newly formed peptide before and after incubation at 37 °C, at pH 5.5 and pH 7.2 conditions, and in the presence or absence of the protease inhibitors (Figure 4). The neuropeptides shown in Figure 4 can be classified into six groups based on hierarchical clustering, with each group demonstrating differential neuropeptidomes regulated by the four inhibitors.
Figure 4.
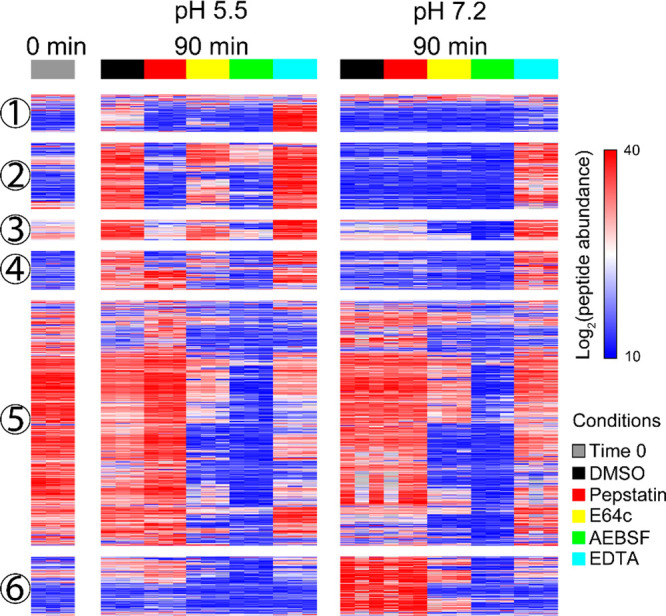
Effect of protease inhibitors on CG neuropeptidome production. The heatmap shows the abundance of newly formed CG neuropeptides after 90 min of incubation with and without class-specific inhibitors (DMSO vehicle, pepstatin, E64c, AEBSF, and EDTA) and time 0 min control. Each row represents a neuropeptide. Peptide abundance was log2 transformed and normalized within each peptide across all conditions. Neuropeptides colored in red are at higher abundance, and the ones colored in blue are at lower abundance. Hierarchical clustering was performed to group neuropeptides based on similar protease inhibition profiles. Data were shown as the average of three biological replicates.
Comparison of neuropeptidomics profiles generated by CG (no inhibitors) showed (1) neuropeptides that were increased at pH 5.5 but not at pH 7.2 (groups 1–4), (2) neuropeptides that were increased at pH 7.2 but not at pH 5.5 (group 6), and (3) peptides that displayed similar relative abundances after incubation at both pH conditions (group 5). These findings showed that selected groups of neuropeptides were formed at pH 5.5 but not pH 7.2, while other neuropeptides were formed at pH 7.2 but not at pH 5.5.
The formation of neuropeptides was sensitive to multiple class-specific inhibitors suggesting that aspartic, cysteine, serine, and metallo proteases were all involved in their production. Different inhibitor sensitivities were observed for pH 5.5 compared to pH 7.2 for neuropeptides of groups 1–4 and 6. At pH 5.5, peptide production was sensitive to inhibition by all four class selective inhibitors (pepstatin, E64, AEBSF, and EDTA), but at pH 7.2, little effect of pepstatin was observed compared to inhibition by E64, AEBSF, and EDTA. However, similar inhibitor sensitivities for production of neuropeptides of group 5 were observed for pH 5.5 and pH 7.2, suggesting that some proteases may be active at both pH conditions.
To evaluate proneuropeptide-derived peptides generated from each precursor, we generated heatmaps of protease inhibition profiles of peptides generated at pH 5.5 and pH 7.2. The heatmaps (Figure 5 and Figures S2–S13) highlight the processed regions of proneuropeptides and illustrate the classes of proteases involved in the cleavages at these regions. It is notable that in vitro incubation of CG resulted in production of neuropeptidome components that were found in the static, nonincubated CG neuropeptidome. These data indicate that the in vitro CG processing assays reflect production of endogenous peptides (Figure 5 and Figures S2–S13).
Figure 5.

Neuropeptidomes generated from chromogranin A (CHGA) and proenkephalin (PENK) proneuropeptides in the presence of class-specific protease inhibitors. For each amino acid of proneuropeptides, the height of the green bars is proportional to the number of peptide amino acids overlapping the indicated region. The darkness of the color is proportional to the sum of the quantified peptide intensities. These heat maps illustrate peptides generated from CHGA and PENK that were sensitive to each of the indicated protease inhibitors of pepstatin, E64c, AEBSF, or EDTA.
Analysis of peptides derived from two of the most abundant proneuropeptides, chromogranin A (CHGA) and proenkephalin (PENK), indicated that multiple types of proteases were utilized for production of peptides derived from each of these precursors (Figure 5). During incubation of CG at pH of 5.5, formation of peptide fragments derived from CHGA and PENK precursors was reduced by pepstatin, E64c, and AEBSF which indicated roles for aspartic, cysteine, and serine proteases (Figure 5). EDTA increased production of peptides derived from several domains of CHGA and PENK. At pH 7.2, peptides derived from PENK were generated, but CHGA derived peptides were not produced at pH 7.2. Production of PENK-derived peptides at pH 7.2 was inhibited by E64c and AEBSF, indicating involvement of cysteine and serine proteases. EDTA increased production of several PENK-derived peptides but also decreased production of other PENK-derived peptides.
In addition to peptides derived from CHGA and PENK, heatmaps were also assessed for peptides generated from CHGB (chromogranin B), SCG3, SCG2, ADM, PCSK1N, VGF, SCG5, NPY (neuropeptide Y), GAL (galanin), and NPPA (shown in Figures S2–S13). Analyses of peptides generated from these 12 proneuropeptides show that (1) multiple protease classes of aspartic, cysteine, serine, and metallo types are all involved in peptide formation, (2) differential profiles of protease classes participate in peptide production from each distinct proneuropeptide, (3) the rate and diversity of proneuropeptide processing were higher at pH 5.5 compared to pH 7.2, (4) some peptides were generated at both pH 5.5 and 7.2, and (5) peptides from NPY and GAL proneuropeptides were generated at pH 7.2 with little production at pH 5.5. Importantly, these findings demonstrate differential utilization of the four protease classes at pH 5.5 compared to pH 7.2 for peptide production.
pH-Dependent CG Proteolytic Cleavage Profiles Defined by MSP-MS
MSP-MS characterizes proteolytic cleavage profiles using a defined peptide library consisting of 228 tetradecapeptides designed to contain all amino acid combinations surrounding protease cleavage sites. The peptide library was incubated with the CG, and cleavage products were identified and quantified by nano-LC–MS/MS. Although a substrate library of this size has fewer cleavable peptide bonds compared to the endogenous proteins and peptide substrates in CG, it offers several advantages for characterizing protease activities consisting of the following: (1) the substrates are sufficiently long to be able to quantify both the substrate and the cleaved products in parallel, which contrasts to the endogenous substrates that are often proteins or polypeptides that are too large for peptidomics analysis; (2) every cleavage product greater than five amino acids can be directly linked to a single precursor; (3) the synthetic peptide substrates have a defined length and sequence and have unmodified amino and carboxy termini that allow us to clearly distinguish aminopeptidase, endopeptidase, and carboxypeptidase activities; (4) the peptide library substrates are present at equal molar concentrations to rule out cleavage site bias due to substrate concentration, as is the case for endogenous substrates that differ greatly in concentration.
At pH 5.5, incubation of the peptide library with the purified CG resulted in cleavage of 600 out of the 2964 peptide bonds of the library substrates, while incubation at pH 7.2 resulted in 204 cleavage sites identified. When comparing these assays, 148 sites were cleaved by proteases at both pH conditions (Figure 6A). The pH 5.5 cleavage profiles showed preference for Arg at the P1 position as well as hydrophobic residues such as norleucine (n), Phe, Leu, and Tyr. At the P2, P1′, and P2′ positions many of the same hydrophobic residues were preferred with the addition of Ala at P2 and Ile at P1′ (Figure 6B). Under these conditions, the most frequently cleaved sites within the 14-mer peptides occurred between residues 13–14 and 12–13 that are common sites for mono- and dicarboxypeptidases, respectively, and also between residues 2–3 and 3–4 that are preferred sites for diaminopeptidases and triaminopeptidases, respectively (Figure 6D). Cleavage at sites distal from the amino and carboxy termini are likely to be cleaved by endopeptidases.
Figure 6.

MSP-MS reveals distinct substrate cleavage properties of CG proteases at pH 5.5 compared to pH 7.2. (A) MSP-MS (multiplex substrate profiling mass spectrometry) was performed at pH 5.5 and pH 7.2 to characterize CG protease activities at the internal DCSV pH of 5.5 and at the extracellular pH of 7.2 into which CG contents are released. (B, C) Substrate cleavage specificity profiles of CG proteases at pH 5.5 (B) and pH 7.2 (C). (D, E) The bar graphs summarize the cleavage frequency at each peptide bond within the 14-mer peptide substrates of the library at pH 5.5 (D) and pH 7.2 (E).
At pH 7.2, the cleavage profile was distinct from that at pH 5.5. Notable differences were an increase in the frequency of Lys and His at P3, His at P2, Lys at P1, Arg and Ala at P1′, Arg and Trp at P2′, and Phe at P4′ (Figure 6C). The most frequently cleaved sites occurred between residues 2–3 indicating the presence of diaminopeptidases; in addition, the peptides were also frequently cleaved by mono- and dicarboxypeptidases as cleavage occurred between residues 12–13 and 13–14 (Figure 6E).
Inhibitor-Sensitive CG Cleavage Profiles at pH 5.5 and pH 7.2 by MSP-MS
The protease classes that represent CG proteolysis were evaluated by MSP-MS cleavage profiling assays in the presence of protease class-specific protease inhibitors. These inhibitors consisted of pepstatin, E64c, AEBSF, and EDTA which inhibit aspartic, cysteine, serine, and metallo protease classes, respectively.
Pepstatin reduced the number of CG cleavage products in the MSP-MS analyses at pH 5.5 (Figure S14). A total of 124 cleavage sites were sensitive to pepstatin compared to the vehicle control (DMSO). The pepstatin-sensitive cleavage sites were generally located in the central regions of the 14-mer peptide substrates between residues 4 and 12, indicating that the aspartic proteases have endopeptidase activity. Analysis of the substrate profile of the pepstatin-sensitive cleavage sites revealed a preference for cleaving hydrophobic residues such as Phe, Leu, Nle, and Tyr at P1 and Nle, Phe, Tyr, and Ile at P1′ (Figure 7A). Only two aspartic proteases are identified in the CG proteomics analysis, with cathepsin D present at 33.9-fold higher levels than presenilin-1 based on NSAF. These data indicate that under acidic pH 5.5 conditions, cathepsin D may likely be responsible for endopeptidase cleavage between hydrophobic amino acids. It is of interest that at pH 7.2, there were almost no pepstatin-sensitive cleavages (Figure S14) revealing that aspartic proteases are unlikely to play a role in peptide hydrolysis at neutral pH 7.2.
Figure 7.

Inhibitor-sensitive protease cleavage profiles of CG neuropeptidome production at pH 5.5 and pH 7.2. (A) Substrate cleavage profile of pepstatin-sensitive aspartic proteolytic activity at pH 5.5. (B, C) Substrate cleavage profile of E64c-sensitive cysteine proteolytic activity at pH 5.5 (B) and pH 7.2 (C). (D, E) Substrate cleavage profile of AEBSF-sensitive serine proteolytic activity at pH 5.5 (D) and pH 7.2 (E). (F) Substrate cleavage profile of EDTA-sensitive proteolytic activity at pH 7.2.
In the E64c-treated MSP-MS assays, three types of cysteine protease activities were revealed. Cysteine proteases with dicarboxypeptidase activity were active at both pH 5.5 and 7.2 represented by peptides being hydrolyzed between residues 12–13 (Figure 7B,C). In addition, diaminopeptidase activity was evident at pH 5.5 but not at pH 7.2, with several peptides cleaved between residues 2–3. Finally, cysteine endopeptidases that cleaved at sites distal from the termini were active at both pH conditions, but the number of cleaved peptides were higher at pH 5.5. The cysteine proteases that are active at pH 5.5 frequently displayed Arg and Lys at the P1 position, with Phe, Val, and Tyr at P2 and with Nle, Leu, and Phe at P1′. The substrate specificity at pH 7.2, which is likely to be dominated by the dicarboxypeptidase, has preferences for Phe, Lys, Val, and Arg at P1 and for Lys at P1′. The CG proteomics data identified 17 cysteine proteases with cathepsin B as the most abundant in this group. Among them, cathepsin B has dicarboxypeptidase activity and is active at pH 5.5 and 7.2 and therefore may represent a candidate protease cleaving between residues 12–13. Also, cathepsin C and cathepsin L represent candidate proteases for the diaminopeptidase and endopeptidase activities, respectively, based on their known substrate specificities in the MEROPS protease database (as described in Methods) and relatively high abundance in the CG proteomics data.
When AEBSF was incubated with the chromaffin granules, the majority of AEBSF-sensitive serine protease activity occurred between residues 13 and 14 which indicates a monocarboxypeptidase at pH 5.5 and pH 7.2 (Figure 7D,E). Lower levels of aminopeptidase and endopeptidase activities were observed at pH 5.5 and pH 7.2 (Figure 7D,E). This monocarboxypeptidase may be represented by cathepsin A, the most abundant serine monocarboxypeptidase in the CG proteome.
EDTA treatment of CG in MSP-MS assays resulted in reduced cleavages of a few peptides at both pH 5.5 and pH 7.2 (Figure S14). However, many peptide products increased after EDTA incubation (Figure S14), which displayed endopeptidase and aminopeptidase activities (Figure 7F).
Cleavage Profiles of Recombinant Proteases Assessed by MSP-MS Represent the Majority of CG Cleavages at pH 5.5 and pH 7.2
We followed three criteria, (1) protease abundance in CG, (2) protease class, and (3) cleavage locations, to identify key CG proteases that were responsible for the different substrate specificity profiles. On the basis of our proteomics (supplementary data 2, tab “Fig. 2A-C and Fig. S1B”), protease classes (Figures 4 and 7), and MSP-MS data (Figure 7), we identified cathepsins A, B, C, D, and L as key candidate proteases for further study. These recombinant enzymes were evaluated by MSP-MS, and the results (Figure 8A–H) confirmed that the specificity profiles of these five enzymes were found to closely match the CG inhibitor-sensitive cleavage profiles observed by MSP-MS (Figure 7). These findings suggest that the identified cathepsins A, B, C, D, and L represent the majority of CG peptide cleavages at pH 5.5 and 7.2. In addition, carboxypeptidase E (CPE) was also investigated as it was the single most abundant protease in CG (Figure 8I,J).
Figure 8.

MSP-MS cleavage profiles of recombinant cathepsins A, B, C, D, as well as CPE. Recombinant, purified enzymes were subjected to substrate cleavage profiling analysis by MSP-MS. Sequence logos show the preferred amino acid adjacent to the cleavage site (P1–P1′), and the frequency of cleavages at each of the peptide bonds within the 14-mer peptides of the 228 peptide library is shown for (A) cathepsin A at pH 5.5, (B) cathepsin A at pH 7.2, (C) cathepsin B at pH 5.5, (D) cathepsin B at pH 7.2, (E) cathepsin C at pH 5.5, (F) cathepsin C at pH 7.2, (G) cathepsin D at pH 5.5, (H) cathepsin L at pH 5.5, (I) carboxypeptidase E (CPE) at pH 5.5, and (J) CPE at pH 7.2.
Cathepsin A displayed monocarboxypeptidase activity that removes single amino acids from the C-terminus at pH 5.5 and pH 7.2. Peptide hydrolysis was more efficient at the acidic pH condition. In general, Phe, Val, and Tyr were preferred at P2, Nle, with Tyr, Leu at P1 and Nle and Tyr at P1′ for both pH conditions (Figure 8A,B). These data show that cathepsin A is a serine protease that corresponds to AEBSF-sensitive proteolytic activity in CG.
Cathepsin B displays dicarboxypeptidase activity at pH 5.5 and 7.2 with a preference for Nle at P1′, for Arg and Lys at P1, and for Leu, Nle, and Pro at P3 in both specificity profiles (Figure 8C,D). The specificity profile of cathepsin B strongly correlates with the E64c-sensitive activity observed in the CG for neuropeptidome production.
For cathepsin C, peptide cleavage occurred between residues 2–3 at both pH conditions (Figure 8E,F). This diaminopeptidase preferentially cleaves substrates with His, Ala, Nle, or Thr at the amino terminus (P2 position) and also with Tyr and Phe at P1′, with Phe and His at P2′, with Arg, Trp, and Asn at P3′, and with Leu, Pro, and Gly at P4′. Cathepsin C is a cysteine protease inhibited by E64c.
Cathepsins D and L are clearly endopeptidases since the cleavage sites were located mainly in the mid-region for the 14-mer peptides of the library (Figure 8G,H) and have stronger activity at pH 5.5. Cathepsin D cleaves between hydrophobic residues such as Phe, Leu, and Tyr which has been reported previously.31,32 Cathepsin L cleavage specificity is dominated by a P2 preference for hydrophobic residues such as Leu, Trp, Val, Phe, Ile, and Tyr, which correlates with specificity data generated by Choe and colleagues.33 A strong correlation in peptide cleavage specificity occurs for the cathepsin D cleavage profile and the pepstatin-sensitive activities of CG. Finally, CPE generally cleaved peptides containing a C-terminal Arg residue at both pH conditions (Figure 8I,J), and this specificity has been reported previously.34
The combined cleavage sites of the MSP-MS assays achieved by the recombinant enzymes matched those of the CG MSP-MS cleavage profiles utilized for neuropeptidome production (Figure 9). CG cleavage of peptide bonds 1–13 of the 14-mer peptide library was mapped at pH 5.5 and pH 7.2 (colored in red, Figure 9). For each recombinant enzyme, cleavage at peptide bonds that match those of the CG cleavage site was also colored red. These data show that at pH 5.5, 67.3% of the CG proteolytic cleavage sites can be hydrolyzed by the recombinant enzymes (Figure 9A). Likewise, at pH 7.2, 88.5% of the CG-derived cleavage sites can be hydrolyzed by the recombinant proteases (Figure 9B). These findings indicate that the CG proteases of cathepsins A, B, C, D, and L possess cleavage specificities that match those utilized for endogenous CG neuropeptidome production at intravesicular and extracellular pH conditions.
Figure 9.

Parallel cleavage profiles of CG proteolytic activity utilized for neuropeptidome production with that of selected recombinant proteases analyzed by MSP-MS. Comparison of CG protease cleavage profiles with that of selected recombinant proteases identified in CG (by proteomics), conducted by MSP-MS analysis, was assessed at pH 5.5 (A) and pH 7.2 (B). Data show the matching cleavage profiles of endogenous CG proteolytic activity with that of purified recombinant enzymes consisting of cathepsins A, B, C, D, L, and CPE, assessed for each of the 13 cleavage sites of 14-mer peptides (228 total) of the substrate peptide library.
Discussion
Findings from this study show that distinct neuropeptidomes were generated by multiple classes of CG proteolytic activities at the intravesicular pH of 5.5 compared to the extracellular pH of 7.2. These pH differences were observed for peptides generated from each of the proneuropeptides consisting of CHGA, CHGB, PENK, SCG3, SCG2, ADM, PCSK1N, VGF, SCG5, NPY, GAL, and NPPA. The 64 distinct proteases present in the CG proteome were evaluated with class-specific protease inhibitors to assess their roles in neuropeptidome biosynthesis. Results indicated differential utilization of aspartic, cysteine, serine, and metallo protease classes for neuropeptidome production at pH 5.5 compared to pH 7.2. Characterization of the CG proteases with a synthetic peptide library by MSP-MS analyses with class-specific inhibitors demonstrated aspartic, cysteine, serine, and metallo proteolytic activities of endopeptidase, carboxypeptidase, and aminopeptidase activities. The CG MSP-MS proteolytic cleavage profiles represented those of cathepsins A, B, C, D, L, and CPE that are present in CG. Purified recombinant forms of these six proteases cleaved the peptide library in a manner that represented the majority of cleavages displayed by the CG proteome. Our MSP-MS cleavage data for cathepsins B, D, and L, and CPE correlate well with other studies using different substrate specificity profiling methods.32−37 However, little cleavage data are available for cathepsin C38 and cathepsin A,39,40 and therefore, the MSP-MS cleavage data for these enzymes are new in the field. The six proteases (cathepsins A, B, C, D, L, and CPE) identified for biosynthesis of the CG neuropeptidome in this study have been reported to process proneuropeptides or peptide intermediates for production of neuropeptides.12,15,41−53 Notably, results demonstrate that distinct neuropeptidomes are generated by CG proteases at the internal DCSV pH of 5.5 compared to the extracellular pH of 7.2.
The approach of assessing neuropeptidome biosynthesis from both proneuropeptides and proneuropeptide-derived intermediates by the entire proteolytic capacity of CG, a model DCSV organelle, is unique in the field. Proteases involved in neuropeptide production have largely been investigated in focused studies of specific proteases in genetic enzyme knockout mice and cells, gene expression, and inhibition studies.12,15,17 The advantage of DCSV organelle-based neuropeptidome studies is the simultaneous assessment of the full spectrum of DCSV proteases for production of proneuropeptide-derived peptides.
Distinct CG neuropeptidomes were generated at the intravesicular pH of 5.5 and at the extracellular pH of 7.2. The differential neuropeptidomes produced at the two pH conditions were generated from the proneuropeptides CHGA, CHGB, PENK, SCG3, SCG2, ADM, PCSK1N, VGF, SCG5, NPY, GAL, and NPPA. Notably, production of CG neuropeptidomes in the presence of four class-specific protease inhibitors (pepstatin, E64c, AEBSF, and EDTA) indicated that aspartic, cysteine, serine, and metallo proteases participated in peptide production. For processing of individual proneuropeptides, different peptide products were sensitive to inhibition of the four protease classes. Production of peptide products from the proneuropeptide PENK (proenkephalin), as an example, at pH 5.5 was reduced by pepstatin, E64c, and AEBSF, whereas production of PENK-derived peptides at pH 7.2 were inhibited by E64c, AEBSF, and EDTA. These data show that different and similar protease classes participated in generating PENK-derived peptides at pH 5.5 compared to pH 7.2 conditions.
The matching CG cleavage profile results observed with the peptide library in MSP-MS assays and by neuropeptidomics elucidated the CG proteases involved in neuropeptide production. The endopeptidase activity was inhibited by pepstatin A which is consistent with the activity of the aspartic protease cathepsin D present in CG. E64c inhibition of the endopeptidase activity represented that of the cysteine protease cathepsin L. The E64c-sensitive dicarboxypeptidase activity matches that of the cysteine protease cathepsin B. The AEBSF-sensitive monocarboxypeptidase activity matches that of cathepsin A. The diaminopeptidase activity, inhibited by E64c, represents the cysteine protease cathepsin C. Carboxypeptidase E (CPE) is an abundant CG metallo protease that was investigated since CPE removal of C-terminal Arg and Lys residues is known to be necessary for neuropeptide maturation.12,15,53
The identification and characterization of these 6 active proteases in CG also explained why we observed higher proteolytic activity at pH 5.5 compared to pH 7.2 (Figures 3B, 6A, 8, and 9). In this study, we observed that 4 out of 6 of the most active CG proteases in CG, cathepsins A, B, D and L, are more active at acidic pH than neutral pH. On the one hand, this observation aligns with the biological fundamental knowledge that the majority of the proteolytic processing of proneuropeptides occurs during the axonal transportation within the DCSVs, which has a pH of 5.5, so that mature neuropeptides at the nerve terminal can be released to the periphery, allowing such neuropeptides to function instantly for cell–cell communication. On the other hand, many cathepsins with optimal activities in an acidic environment have also been reported to be able to retain their activities at neutral pH.54−56 Here, we observed distinct proteolytic activities at neutral pH in our CG peptidomics and MSP-MS assays, suggesting that proneuropeptides can also be processed by certain proteases at the postsecretion stage. The change of pH from acidic to neutral upon exocytosis may serve to regulate protease activities, particularly cathepsins A, B, C, D, and L, and subsequently regulate the biosynthesis of neuropeptides.
Involvement of these six CG proteases in neuropeptide production is supported by reported data showing that each of these proteases cleaves proneuropeptides or neuropeptide intermediate substrates. Cathepsin L, a cysteine endopeptidase, has been shown to process the proneuropeptides PENK, POMC, NPY, pro-CCK, and PDYN at dibasic residue cleavage sites.41−45 Cathepsin D, an aspartic endopeptidase, cleaves protachykinin at basic residues as well as hydrophobic residues to generate substance P.46,47 Cathepsin B, a cysteine protease, cleaves the PENK-derived intermediate BAM-12P to generate the (Met)-enkephalin-Arg (ME-Arg), demonstrating its endopeptidase activity.48 Cathepsin B also displays dicarboxypeptidase activity shown by removal of C-terminal dipeptides from ME-Arg-Phe, ME-Arg-Gly-Leu, and dynorphin (1–8).49,50 The monocarboxypeptidase activity of cathepsin A cleaves ME-Arg-Phe by sequential removal C-terminal Phe and Arg to generate the ME neuropeptide.51 The diaminopeptidase cathepsin C removes the N-terminal dipeptide from the neuropeptide ME.52 The CPE exopeptidase has been shown to remove C-terminal Arg and Lys residues to generate numerous neuropeptides including ME.12,15,53
The findings of this study and those in the field demonstrate that different experimental approaches of gene homology, biochemical, and global neuropeptidomics result in identification of distinct proteases for neuropeptide production. A genetic approach of searching for mammalian gene homologues of the yeast Kex2 gene for pro-α-mating factor processing led to identification of mammalian proprotein convertases 1 and 2 (PC1 and PC2)57−60 involved in processing prohormones, including POMC (proopmelanocortin),61,62 proinsulin,63,64 proenkephalin,65−67 and others.12,17,68,69 The PC1 and PC2 proteases are members of the subtilisin-like serine protease family of mammalian processing proteases. The biochemical approach of identifying proenkephalin cleaving activity led to identification of cathepsin L for processing proenkephalin, POMC, prodynorphin, and several other proneuropeptides.41−45 The approach of this study using peptidomics, proteomics, and MSP-MS led to identification of multiple proteases identified consisting of cathepsins A, B, C, D, L, and CPE that are present in CG. Clearly, the global neuropeptidomics combined with MSP-MS protease profiling provides a novel unbiased approach for elucidation of proteases involved in generating diverse neuropeptidomes.
Here, we presented our initial effort to develop a mass spectrometry platform to study proteases and substrates in a complex biological system. We utilized CG as our model system which are among the most homogeneous of cellular DCSVs.12 However, a missing aspect in this study and the field is to investigate the nature of DCSV heterogeneity in proneuropeptide processing. Whether prohormones and proteases coexist within the same cell and CG will affect the proteolytic outcomes. One way to address this question is to perform studies at the single cell level. Even though current mass spectrometry technology is facing the challenge of low sensitivity in quantifying proteins from single cells, the advances in this field will ultimately contribute to deeper understanding of biological systems at single-cell resolution. Alternatively, cell sorting flow cytometry can also be performed to obtain more homogeneous samples.
Moving forward, it will be beneficial to gain understanding of neuropeptide biosynthesis by integration of peptidomics, proteomics, and protease cleavage profiling of the DCSV organelle from neuropeptide-rich cell types of multiple organisms. Investigations of neuropeptidomes under different conditions will advance understanding of the complexity of neuropeptidomes for cell–cell communication in disease and health.
Methods
Purification of Chromaffin Granules (CG) from Bovine Adrenal Medulla
Dense core secretory vesicles (DCSV), represented by CG present in adrenal medullary chromaffin cells, were isolated from fresh bovine adrenal medulla by differential sucrose density centrifugation as we have described previously.70,71 In total, we obtained three biological replicate CG samples. Each replicate CG sample was obtained from 20 adrenal glands of fresh adrenal medulla (bovine) tissue (Sierra for Medical Science, Whittier, CA). Adrenal glands were gently homogenized in 0.32 M sucrose using a Polytron and centrifuged at 365g (20 min at 4 °C) to remove nuclei (pellet). The CG-containing supernatant was centrifuged at 12 000g (20 min at 4 °C) to result in the CG pellet. The CG pellet was washed three times in 0.32 M sucrose (12 000g, 20 min, 4 °C). The washed CG pellet was resuspended in 0.32 M sucrose, layered on a 1.6 M sucrose step gradient with a cushion of 2.2 M sucrose, and centrifuged at 120 000g (120 min, 4 °C) in a Beckman SW28 rotor to result in purified CG at the interface of the 1.6/2.2 M sucrose. The CG were removed, resuspended in 0.32 M sucrose, layered on 1.6 M sucrose, and subjected to a second ultracentrifugation step (SW28 rotor, 120 000g, 120 min). The resultant purified CG was resuspended in 15 mM KCl and stored at −70 °C for analysis.
We have documented the high purity of this preparation of isolated CG by electron microscopy and biochemical markers.70,71 The purified CG lack markers for the subcellular organelles of lysosomes (acid phosphatase marker),70 cytoplasm (lactate dehydrogenase marker),72 mitochondria (fumarase and glutamate dehydrogenase markers),70 and endoplasmic reticulum (glucose-6-phosphatase marker).72 Thus, the high purity of the isolated CG has been established.70−73
Proteomics Analysis for Identification of Proteins and Proteases in Chromaffin Granules
Proteins and proteases in CG were identified by proteomics analysis. Proteins of the purified CG (200 μg, in triplicate) were precipitated by incubation in ice-cold 90% MeOH (Thermo) for 15 min, centrifuged for 30 min (14 000g, 4 °C) to collect the protein pellet. The protein precipitate was resuspended in reduction buffer consisting of 8 M urea (MP Biomedicals), 50 mM Tris-HCl (MP Biomedicals), pH 8.0, 5 mM DTT (Sigma), and incubated at 55 °C for 45 min for protein denaturation and reduction. For alkylation of cysteine residues, samples were incubated in 15 mM iodoacetamide (Sigma) in the dark at RT for 30 min, followed by quenching by addition of DTT to a final concentration of 5 mM. Samples were diluted with 50 mM Tris-HCl, pH 8.0, to reduce urea to 1.0 M or less. Samples were then digested by incubation with trypsin/LysC (Promega V5113) at a ratio of 50:1 protein/trypsin, at RT for 20 h at 37 °C. Reactions were quenched by addition of 10% TFA (Thermo) to 0.5% TFA to adjust the pH below 2.
Samples were subjected to peptide purification and desalting by C18 stage tip SPE using Empore C18 wafers (from 3M), using a protocol described by Rappsilber et al., 2007.74 The C18 stage tip was washed with ACN (acetonitrile) and equilibrated with 0.1% TFA. Samples were loaded, washed with 0.1% TFA, eluted with 50% ACN/0.1% TFA, dried in a SpeedVac, resuspended in water, and peptide concentrations were measured by a total peptide assay kit (Pierce quantitative colorimetric peptide assay, Thermo Fisher). Samples were dried in a SpeedVac centrifuge, stored at −70 °C, and resuspended in H2O for nano-LC–MS/MS.
Nano-LC–MS/MS utilized 2 μg of peptides from each sample for analysis on a Q-Exactive mass spectrometer (Thermo) equipped with an Ultimate 3000 HPLC (Thermo). Each triplicate sample was injected 3 times into the LC–MS/MS as technical replicates. Peptides were separated by reverse phase chromatography on a C18 column (1.7 μm bead size, 75 μm × 25 cm, heated to 65 °C) at a flow rate of 300 nL/min using a 145 min linear gradient from 5% B to 25% B, with solvent A consisting of 0.1% formic acid (H2O) (Thermo) and solvent B consisting of 0.1% formic acid/acetonitrile (Thermo). Survey scans were recorded over a 310–1250 m/z range (35 000 resolutions at 200 m/z, AGC target 3 × 10⁶, 100 ms maximum IT). MS/MS was performed in data-dependent acquisition mode with HCD fragmentation (28 normalized collision energy) on the 20 most intense precursor ions (175 000 resolutions at 200 m/z, AGC target 1 × 10⁵, 50 ms maximum IT, dynamic exclusion 20 s).
MS/MS data were processed by PEAKS 8.5 (Bioinformatics Solutions Inc.). MS2 data were searched against Bos taurus proteome (Aug 28, 2018) with decoy sequences in reverse order. Fixed modifications of carbamidomethylation of cysteine (+57.021 46 Da), variable modification of acetylation of protein N-termini (+42.0106), and oxidation of methionine (+15.994 92 Da) were specified. A maximum of two missed cleavages of trypsin was allowed. A precursor tolerance of 20 ppm and 0.01 Da for MS2 fragments was defined. Data were filtered to 1% peptide sequence and protein false discovery rates with the target decoy strategy. Proteins that were identified in at least 2 out of 3 technical injections were considered as identified in each replicate sample, and proteins identified in at least 2 out of 3 replicate samples were considered as identified in CG. Proteases in the CG proteome were compiled according to the MEROPS database of protease enzymes.75
Peptidomics Analysis of Chromaffin Granules
Purified CG samples (1.25 mg per replicate sample, triplicate samples prepared) were incubated at 37 °C for 0, 30, and 90 min at pH 5.5 (20 mM citrate–phosphate, pH 5.5, 100 mM NaCl, 1 mM CaCl2, 1 mM MgCl2, 2 mM DTT) and at pH 7.2 (phosphate buffered saline, pH 7.2, 1 mM CaCl2, 1 mM MgCl2, 2 mM DTT). Incubations were conducted in the absence of protease inhibitor and in the presence of each of the protease inhibitors pepstatin A (4 μM, MP Biomedicals), E64c (40 μM, Sigma), AEBSF (4 mM, Tocris), and EDTA (10 mM, MP Biomedicals). Endogenous peptides were then extracted by addition of ice cold HCl to 20 mM HCl (pH < 3), incubation on ice for 15 min, centrifugation for 30 min (14 000g, 4 °C), and the supernatant peptide fraction was collected. The acid extract was then brought up to 20% ACN and 10 mM HCl, filtered through a 10 kDa MW cutoff filter (Millipore MRCPRT010) (centrifugation for 45–60 min at 14,000g, 4 °C), followed by addition of 100 μL of 0.5 M NaCl and 10 mM HCl to the filter and centrifugation. The low molecular weight filtrate was neutralized by addition of 1 M ammonium bicarbonate to 30 mM, dried in a vacuum centrifuge, and stored at −70 °C for the next step. Samples were then resuspended in 100 μL of urea buffer (6 M urea, 60 mM Tris-HCl, pH 8), and DTT (100 mM DTT stock) was added to a final concentration of 5 mM DTT and incubated at room temperature for 1 h. Iodoacetamide (IAA) stock solution (200 mM IAA in urea buffer) was added to each sample to obtain 15 mM IAA, and samples were incubated for 3 min at RT in the dark. The alkylation was quenched by addition of DTT to a final concentration of 10 mM, and samples were acidified by addition of TFA. Peptides were then collected by C18 stage-tip SPE as explained for CG proteomics (this Methods section); eluted samples were dried in a vacuum centrifuge and stored at −70 °C. Samples were resuspended in water and were briefly vortexed and sonicated, and total peptide content was measured as described for CG proteomics. Samples were dried in a SpeedVac and resuspended in 2% ACN/0.1% TFA to a peptide concentration of 0.11 μg/μL.
For nano-LC–MS/MS, 4.6 μL (∼500 ng) of each was injected into the LC–MS system. Peptides were separated by reverse phase chromatography on a C18 column (1.7 μm bead size, 75 μm × 25 cm, heated to 65 °C) at a flow rate of 300 nL/min using a gradient of solvent B (0.1% formic acid ACN) at 5–25% gradient over 75 min with solvent A (0.1% formic acid/H2O). Survey scans were recorded over a 310–1250 m/z range (70 000 resolutions at 200 m/z, AGC target 3 × 10⁶, 100 ms maximum IT). MS/MS was performed in data-dependent acquisition mode with HCD fragmentation (27 normalized collision energy) on the 15 most intense precursor ions (17 500 resolutions at 200 m/z, AGC target 1 × 10⁵, 70 ms maximum IT, dynamic exclusion 30 s).
Bioinformatics of MS/MS data was analyzed using PEAKS 8.5 (Bioinformatics Solutions Inc.). MS2 data were searched against the Bos taurus proteome (Apr 22, 2018) with decoy sequences in reverse order. Fixed modifications of carbamidomethylation of cysteines (+57.02146 Da), variable modification of acetylation of protein N-termini (+42.0106), oxidation of methionine (+15.99492 Da), pyro-Glu from A (−17.03), and phosphorylation (STY) (+79.97) were specified. A precursor tolerance of 20 ppm and 0.01 Da for MS2 fragments was defined. No protease digestion was specified. Data were filtered to 1% peptide and protein level false discovery rates with the target-decoy strategy. Peptides were quantified with label free quantification, and data were normalized by calculating the median of intensities for each sample and then scaling the data to their medians, and filtered by 0.3 peptide quality. Missing and zero values were imputed with random normally distributed numbers in the range of the average of the smallest 5% of the data ± SD.
Multiplex Substrate Profiling by Mass Spectrometry (MSP-MS) of Proteolytic Activities in Chromaffin Granules
CG proteolysis was subjected to peptide cleavage profiling analysis by MSP-MS. Proteolytic activity of CG was analyzed with a library of exogenous synthetic peptides, consisting of 228 tetradecapeptides that were designed to contain all known protease cleavage sites.24,25,76 Cleavage products were identified and quantitated by nano-LC–MS/MS mass spectrometry for bioinformatics analysis of cleavage site properties.
All MSP-MS assays (conducted in quadruplicate) were conducted by incubating purified CG with the 228-peptide library at a final concentration of 0.5 μM for each peptide at pH 5.5 or pH 7.2 (using the same buffers as those used in the peptidomics methods). The MSP-MS assays utilized 200 μg/mL CG (purified). For MSP-MS assays using recombinant human proteases, all enzymes were purchased from R & D Systems. MSP-MS assays used 18.4 nM cathepsin A, 2.64 nM cathepsin B, 19.6 nM cathepsin C, 100 nM cathepsin D, 3.84 nM cathepsin L, and 18.8 nM carboxypeptidase E that were preincubated (30 min at 37 °C) without and with protease inhibitors consisting of 4 μM pepstatin (MP Biomedicals), 40 μM E64c (Sigma), 4 mM AEBSF (Tocris), or 10 mM EDTA (MP Biomedicals). MSP-MS assays were conducted at 37 °C for 30 and 90 min. At each time point, 20 μL of the reaction mixture was removed and quenched by addition of GuHCl (MP Biomedicals) to 6.4 M and samples were immediately stored at −80 °C. Control reactions consisted of CG or recombinant protease samples preincubated with 6.4 M GuHCl to inactivate the enzyme prior to addition of the peptide library. All samples were desalted with C18 and dried in a vacuum centrifuge.
For each MSP-MS assay sample, ∼0.4 μg of peptides was injected into a Q-Exactive mass spectrometer (Thermo) equipped with an Ultimate 3000 HPLC. Peptides were separated by reverse phase chromatography on a C18 column (1.7 μm bead size, 75 μm × 25 cm, 65 °C) at a flow rate of 300 nL/min using a 60 min linear gradient from 5% to 30% B, with solvent A of 0.1% formic acid in water and solvent B of 0.1% formic acid in acetonitrile. Survey scans were recorded over a 150–2000 m/z range (70 000 resolution at 200 m/z, AGC target 3 × 10⁶, 100 ms maximum). MS/MS was performed in data-dependent acquisition mode with HCD fragmentation (28 normalized collision energy) on the 12 most intense precursor ions (17 500 resolutions at 200 m/z, AGC target 1 × 10⁵, 50 ms maximum, dynamic exclusion 20 s).
Data were processed using PEAKS 8.5 (Bioinformatics Solutions Inc.). MS2 data were searched against the tetradecapeptide library sequences with decoy sequences in reverse order. A precursor tolerance of 20 ppm and 0.01 Da for MS2 fragments was defined. No protease digestion was specified. Data were filtered to 1% peptide level false discovery rates with the target-decoy strategy. Peptides were quantified with label free quantification, and data were normalized by median and filtered by 0.3 peptide quality. Missing and zero values are imputed with random normally distributed numbers in the range of the average of smallest 5% of the data ± SD.
Data Analysis and Bioinformatics
Gene ontology analysis and protein classification (Figure S1) were performed using the analysis tools from the PANTHER classification system.77 Proneuropeptides were annotated based on NeuroPedia,78 and proteases were annotated based on MEROPS.75 For peptidomics, peptides whose abundance increased by 2-fold with q value of <0.05 comparing the assays of 30 or 90 min incubation to controls were considered to be significantly increased, and those whose abundance decreased by 2-fold with q value of <0.05 were considered to be significantly decreased. For MSP-MS assays, peptides whose abundance π value of >2.613879 (significance level of <0.005) comparing 90 min incubation to controls were considered to be increased (cleavage products). Those cleavage products whose π values were <−2.6138 comparing the assays of 90 min incubation with the inhibitor treated CG to DMSO controls were considered to be inhibited.
Proteolytic specificity profiles were generated using iceLogo software to visualize amino acid frequency surrounding the cleavage sites.80 Amino acids that were most frequently observed (above axis) and least frequently observed (below axis) from P4 to P4′ positions were illustrated (p < 0.3). Norleucine (Nle) was represented as “n” in the reported profiles. Amino acids in opaque text were statistically significant (p < 0.05). Heatmaps were generated using peptides that were cleaved after 90 min of incubation without inhibitor at either pHs. Hierarchical clustering was performed using Euclidean distance and complete linkage. Peptidomics profiles of each proneuropeptide and peptide alignment maps were generated using Peptigram.81
Data Availability
All mass spectrometry data have been deposited in MassIVE and proteomeXchange with accession numbers. MassIVE: MSV000085957 (proteomics), MSV000085956 (peptidomics), MSV00008595 (MSP-MS). ProteomeXchange: PXD020926 (proteomics), PXD020925 (peptidomics).
Acknowledgments
This research was supported by NIH Grants R01NS094597 and R21DA044515 (awarded to V.H.). M.C.Y. was supported by Grant NIH T32GM067550 (awarded to W. Gerwick). C.B.L. was supported by Grant NIH T32MH019934 (awarded to D. Jeste). Z.J. and A.J.O. were supported by lab start-up funds provided by the Skaggs School of Pharmacy and Pharmaceutical Sciences.
Supporting Information Available
The Supporting Information is available free of charge at https://pubs.acs.org/doi/10.1021/acschemneuro.1c00133.
Figures S1–S14 of gene ontology analysis, heatmap of processed regions of proneuropeptides, and volcano plots of peptidomics experiments. (PDF)
Supplementary data 1 of raw mass spectrometry data of CG proteomics, peptidomics and MSP-MS studies (XLSX)
Supplementary data 2 used for each figure in the paper (XLSX)
Author Contributions
A.J.O. and V.H. conceived the project idea. The project design was achieved by V.H., A.J.O., Z.J., and C.B.L. Z.J., C.B.L., S.P., and M.C.Y. conducted the experiments. Data analysis was conducted by Z.J., A.J.O., and V.H. Z.J., A.J.O., and V.H. wrote the manuscript. All authors reviewed the data and the written manuscript.
The authors declare no competing financial interest.
Supplementary Material
References
- Gupta N.; Bark S. J.; Lu W. D.; Taupenot L.; O’Connor D. T.; Pevzner P.; Hook V. (2010) Mass spectrometry-based neuropeptidomics of secretory vesicles from human adrenal medullary pheochromocytoma reveals novel peptide products of prohormone processing. J. Proteome Res. 9 (10), 5065–75. 10.1021/pr100358b. [DOI] [PMC free article] [PubMed] [Google Scholar]
- Podvin S.; Bundey R.; Toneff T.; Ziegler M.; Hook V. (2015) Profiles of secreted neuropeptides and catecholamines illustrate similarities and differences in response to stimulation by distinct secretagogues. Mol. Cell. Neurosci. 68, 177–185. 10.1016/j.mcn.2015.06.008. [DOI] [PMC free article] [PubMed] [Google Scholar]
- Goldstein D. S. (2010) Adrenal responses to stress. Cell. Mol. Neurobiol. 30 (8), 1433–40. 10.1007/s10571-010-9606-9. [DOI] [PMC free article] [PubMed] [Google Scholar]
- Nankova B. B.; Sabban E. L. (1999) Multiple signalling pathways exist in the stress-triggered regulation of gene expression for catecholamine biosynthetic enzymes and several neuropeptides in the rat adrenal medulla. Acta Physiol. Scand. 167 (1), 1–9. 10.1046/j.1365-201x.1999.00566.x. [DOI] [PubMed] [Google Scholar]
- Livett B. G.; Marley P. D.; Wan D. C.; Zhou X. F. (1990) Peptide regulation of adrenal medullary function. J. Neural. Transm. Suppl. 29, 77–89. 10.1007/978-3-7091-9050-0_9. [DOI] [PubMed] [Google Scholar]
- Kim T.; Gondré-Lewis M. C.; Arnaoutova I.; Loh Y. P. (2006) Dense-core secretory granule biogenesis. Physiology 21 (2), 124–33. 10.1152/physiol.00043.2005. [DOI] [PubMed] [Google Scholar]
- Winkler H.; Fischer-Colbrie R. (1998) Regulation of the biosynthesis of large dense-core vesicles in chromaffin cells and neurons. Cell. Mol. Neurobiol. 18 (2), 193–209. 10.1023/A:1022516919932. [DOI] [PMC free article] [PubMed] [Google Scholar]
- Zhang X.; Bao L.; Ma G. Q. (2010) Sorting of neuropeptides and neuropeptide receptors into secretory pathways. Prog. Neurobiol. 90 (2), 276–83. 10.1016/j.pneurobio.2009.10.011. [DOI] [PubMed] [Google Scholar]
- Merighi A. (2018) Costorage of High Molecular Weight Neurotransmitters in Large Dense Core Vesicles of Mammalian Neurons. Front. Cell. Neurosci. 12, 272. 10.3389/fncel.2018.00272. [DOI] [PMC free article] [PubMed] [Google Scholar]
- Kastin A. J.; Pan W. (2010) Concepts for biologically active peptides. Curr. Pharm. Des. 16 (30), 3390–3400. 10.2174/138161210793563491. [DOI] [PMC free article] [PubMed] [Google Scholar]
- van den Pol A. N. (2012) Neuropeptide transmission in brain circuits. Neuron 76 (1), 98–115. 10.1016/j.neuron.2012.09.014. [DOI] [PMC free article] [PubMed] [Google Scholar]
- Hook V.; Funkelstein L.; Lu D.; Bark S.; Wegrzyn J.; Hwang S. R. (2008) Proteases for processing proneuropeptides into peptide neurotransmitters and hormones. Annu. Rev. Pharmacol. Toxicol. 48, 393–423. 10.1146/annurev.pharmtox.48.113006.094812. [DOI] [PMC free article] [PubMed] [Google Scholar]
- Romanova E. V.; Sweedler J. V. (2015) Peptidomics for the discovery and characterization of neuropeptides and hormones. Trends Pharmacol. Sci. 36 (9), 579–86. 10.1016/j.tips.2015.05.009. [DOI] [PMC free article] [PubMed] [Google Scholar]
- Buchberger A.; Yu Q.; Li L. (2015) Advances in Mass Spectrometric Tools for Probing Neuropeptides. Annu. Rev. Anal. Chem. 8, 485–509. 10.1146/annurev-anchem-071114-040210. [DOI] [PMC free article] [PubMed] [Google Scholar]
- Hook V.; Lietz C. B.; Podvin S.; Cajka T.; Fiehn O. (2018) Diversity of Neuropeptide Cell-Cell Signaling Molecules Generated by Proteolytic Processing Revealed by Neuropeptidomics Mass Spectrometry. J. Am. Soc. Mass Spectrom. 29 (5), 807–816. 10.1007/s13361-018-1914-1. [DOI] [PMC free article] [PubMed] [Google Scholar]
- Gupta N.; Bark S. J.; Lu W. D.; Taupenot L.; O’Connor D. T.; Pevzner P.; Hook V. (2010) Mass spectrometry-based neuropeptidomics of secretory vesicles from human adrenal medullary pheochromocytoma reveals novel peptide products of prohormone processing. J. Proteome Res. 9 (10), 5065–75. 10.1021/pr100358b. [DOI] [PMC free article] [PubMed] [Google Scholar]
- Seidah N. G.; Prat A. (2002) Precursor convertases in the secretory pathway, cytosol and extracellular milieu. Essays Biochem. 38, 79–94. 10.1042/bse0380079. [DOI] [PubMed] [Google Scholar]
- Borges R.; Pereda D.; Beltrán B.; Prunell M.; Rodríguez M.; Machado J. D. (2010) Intravesicular factors controlling exocytosis in chromaffin cells. Cell. Mol. Neurobiol. 30 (8), 1359–1364. 10.1007/s10571-010-9589-6. [DOI] [PMC free article] [PubMed] [Google Scholar]
- Loh Y. P.; Tam W. W.; Russell J. T. (1984) Measurement of delta pH and membrane potential in secretory vesicles isolated from bovine pituitary intermediate lobe. J. Biol. Chem. 259 (13), 8238–45. 10.1016/S0021-9258(17)39719-3. [DOI] [PubMed] [Google Scholar]
- Winkler H.; Westhead E. (1980) The molecular organization of adrenal chromaffin granules. Neuroscience 5 (11), 1803–1823. 10.1016/0306-4522(80)90031-7. [DOI] [PubMed] [Google Scholar]
- Zabłocki K.; Szczepanowska J.; Duszyński J. (2005) Extracellular pH modifies mitochondrial control of capacitative calcium entry in Jurkat cells. J. Biol. Chem. 280 (5), 3516–21. 10.1074/jbc.M411507200. [DOI] [PubMed] [Google Scholar]
- Wu M. H.; Urban J. P.; Cui Z. F.; Cui Z.; Xu X. (2007) Effect of extracellular pH on matrix synthesis by chondrocytes in 3D agarose gel. Biotechnol. Prog. 23 (2), 430–4. 10.1021/bp060024v. [DOI] [PubMed] [Google Scholar]
- Munteanu R. E.; Stǎnicǎ L.; Gheorghiu M.; Gáspár S. (2018) Measurement of the Extracellular pH of Adherently Growing Mammalian Cells with High Spatial Resolution Using a Voltammetric pH Microsensor. Anal. Chem. 90 (11), 6899–6905. 10.1021/acs.analchem.8b01124. [DOI] [PubMed] [Google Scholar]
- O’Donoghue A. J.; Eroy-Reveles A. A.; Knudsen G. M.; Ingram J.; Zhou M.; Statnekov J. B.; Greninger A. L.; Hostetter D. R.; Qu G.; Maltby D. A.; Anderson M. O.; Derisi J. L.; McKerrow J. H.; Burlingame A. L.; Craik C. S. (2012) Global identification of peptidase specificity by multiplex substrate profiling. Nat. Methods 9 (11), 1095–100. 10.1038/nmeth.2182. [DOI] [PMC free article] [PubMed] [Google Scholar]
- Lapek J. D. Jr; Jiang Z.; Wozniak J. M.; Arutyunova E.; Wang S. C.; Lemieux M. J.; Gonzalez D. J.; O’Donoghue A. J. (2019) Quantitative Multiplex Substrate Profiling of Peptidases by Mass Spectrometry. Mol. Cell Proteomics 18 (5), 968–981. 10.1074/mcp.TIR118.001099. [DOI] [PMC free article] [PubMed] [Google Scholar]
- Maffioli E.; Jiang Z.; Nonnis S.; Negri A.; Romeo V.; Lietz C. B.; Hook V.; Ristagno G.; Baselli G.; Kistler E. B.; Aletti F.; O’Donoghue A. J.; Tedeschi G. (2020) High-Resolution mass Sspectrometry-based approaches for the detection and quantification of peptidase activity in plasma. Molecules 25, 4071. 10.3390/molecules25184071. [DOI] [PMC free article] [PubMed] [Google Scholar]
- Bibo-Verdugo B.; O'Donoghue A. J.; Rojo-Arreola L.; Craik C. S.; Garcia-Carreno F. (2016) Complementary proteomic and biochemical analysis of peptidases in lobster gastric juice uncovers the functional role of individual enzymes in food digestion. Mar. Biotechnol. 18, 201–214. 10.1007/s10126-015-9681-5. [DOI] [PubMed] [Google Scholar]
- Ivry S. L.; Sharib J. M.; Dominguez D. A.; Roy N.; Hatcher S. E.; Yip-Schneider M. T.; Schmidt C. M.; Brand R. E.; Park W. G.; Hebrok M.; Kim G. E.; O’Donoghue A. J.; Kirkwood K. S.; Craik C. S. (2017) Global Protease Activity Profiling Provides Differential Diagnosis of Pancreatic Cysts. Clin. Cancer Res. 23 (16), 4865–4874. 10.1158/1078-0432.CCR-16-2987. [DOI] [PMC free article] [PubMed] [Google Scholar]
- Paoletti A. C.; Parmely T. J.; Tomomori-Sato C.; Sato S.; Zhu D.; Conaway R. C.; Conaway J. W.; Florens L.; Washburn M. P. (2006) Quantitative proteomic analysis of distinct mammalian Mediator complexes using normalized spectral abundance factors. Proc. Natl. Acad. Sci. U. S. A. 103 (50), 18928–33. 10.1073/pnas.0606379103. [DOI] [PMC free article] [PubMed] [Google Scholar]
- Schechter I. (2005) Mapping of the active site of proteases in the 1960s and rational design of inhibitors/drugs in the 1990s. Curr. Protein Pept. Sci. 6 (6), 501–12. 10.2174/138920305774933286. [DOI] [PubMed] [Google Scholar]
- Melzer I. M.; Fernandez S. B. M.; Bösser S.; Lohrig K.; Lewandrowski U.; Wolters D.; Zörnig M.; et al. (2012) The Apaf-1-binding protein Aven is cleaved by Cathepsin D to unleash its anti-apoptotic potential. Cell Death Differ. 19 (9), 1435–1445. 10.1038/cdd.2012.17. [DOI] [PMC free article] [PubMed] [Google Scholar]
- Impens F.; Colaert N.; Helsens K.; Ghesquière B.; Timmerman E.; De Bock P. J.; Chain B. M.; Vandekerckhove J.; Gevaert K. (2010) A quantitative proteomics design for systematic identification of protease cleavage events. Mol. Cell Proteomics 9 (10), 2327–2333. 10.1074/mcp.M110.001271. [DOI] [PMC free article] [PubMed] [Google Scholar]
- Choe Y.; Leonetti F.; Greenbaum D. C.; Lecaille F.; Bogyo M.; Brömme D.; Ellman J. A.; Craik C. S. (2006) Substrate profiling of cysteine proteases using a combinatorial peptide library identifies functionally unique specificities. J. Biol. Chem. 281 (18), 12824–12832. 10.1074/jbc.M513331200. [DOI] [PubMed] [Google Scholar]
- Grimwood B. G.; Plummer T. H. Jr; Tarentino A. L. (1989) Carboxypeptidase H: a regulatory peptide-processing enzyme produced by human hepatoma Hep G2 cells. J. Biol. Chem. 264 (26), 15662–15667. 10.1016/S0021-9258(19)84883-4. [DOI] [PubMed] [Google Scholar]
- Vidmar R.; Vizovišek M.; Turk D.; Turk B.; Fonović M. (2017) Protease cleavage site fingerprinting by label-free in-gel degradomics reveals pH-dependent specificity switch of legumain. EMBO J. 36 (16), 2455–2465. 10.15252/embj.201796750. [DOI] [PMC free article] [PubMed] [Google Scholar]
- Biniossek M. L.; Nägler D. K.; Becker-Pauly C.; Schilling O. (2011) Proteomic identification of protease cleavage sites characterizes prime and non-prime specificity of cysteine cathepsins B, L, and S. J. Proteome Res. 10 (12), 5363–5373. 10.1021/pr200621z. [DOI] [PubMed] [Google Scholar]
- Ji L.; Wu H. T.; Qin X. Y.; Lan R. (2017) Dissecting carboxypeptidase E: properties, functions and pathophysiological roles in disease. Endocr. Connect. 6 (4), R18–R38. 10.1530/EC-17-0020. [DOI] [PMC free article] [PubMed] [Google Scholar]
- Vidak E.; Javoršek U.; Vizovišek M.; Turk B. (2019) Cysteine cathepsins and their extracellular roles: shaping the microenvironment. Cells 8 (3), 264. 10.3390/cells8030264. [DOI] [PMC free article] [PubMed] [Google Scholar]
- Khavrutskii I. V.; Compton J. R.; Jurkouich K. M.; Legler P. M. (2019) Paired Carboxylic Acids in Enzymes and Their Role in Selective Substrate Binding, Catalysis, and Unusually Shifted pKa Values. Biochemistry 58 (52), 5351–5365. 10.1021/acs.biochem.9b00429. [DOI] [PubMed] [Google Scholar]
- Hiraiwa M. (1999) Cathepsin A/protective protein: an unusual lysosomal multifunctional protein. Cell. Mol. Life Sci. 56 (11), 894–907. 10.1007/s000180050482. [DOI] [PMC free article] [PubMed] [Google Scholar]
- Yasothornsrikul S.; Greenbaum D.; Medzihradszky K. F.; Toneff T.; Bundey R.; Miller R.; Schilling B.; Petermann I.; Dehnert J.; Logvinova A.; Goldsmith P.; Neveu J. M.; Lane W. S.; Gibson B.; Reinheckel T.; Peters C.; Bogyo M.; Hook V. (2003) Cathepsin L in secretory vesicles functions as a prohormone-processing enzyme for production of the enkephalin peptide neurotransmitter. Proc. Natl. Acad. Sci. U. S. A. 100 (16), 9590–5. 10.1073/pnas.1531542100. [DOI] [PMC free article] [PubMed] [Google Scholar]
- Funkelstein L.; Toneff T.; Mosier C.; Hwang S. R.; Beuschlein F.; Lichtenauer U. D.; Reinheckel T.; Peters C.; Hook V. (2008) Major role of cathepsin L for producing the peptide hormones ACTH, beta-endorphin, and alpha-MSH, illustrated by protease gene knockout and expression. J. Biol. Chem. 283 (51), 35652–9. 10.1074/jbc.M709010200. [DOI] [PMC free article] [PubMed] [Google Scholar]
- Funkelstein L.; Toneff T.; Hwang S. R.; Reinheckel T.; Peters C.; Hook V. (2008) Cathepsin L participates in the production of neuropeptide Y in secretory vesicles, demonstrated by protease gene knockout and expression. J. Neurochem. 106 (1), 384–91. 10.1111/j.1471-4159.2008.05408.x. [DOI] [PMC free article] [PubMed] [Google Scholar]
- Beinfeld M. C.; Funkelstein L.; Foulon T.; Cadel S.; Kitagawa K.; Toneff T.; Reinheckel T.; Peters C.; Hook V. (2009) Cathepsin L plays a major role in cholecystokinin production in mouse brain cortex and in pituitary AtT-20 cells: protease gene knockout and inhibitor studies. Peptides 30 (10), 1882–91. 10.1016/j.peptides.2009.06.030. [DOI] [PMC free article] [PubMed] [Google Scholar]
- Minokadeh A.; Funkelstein L.; Toneff T.; Hwang S. R.; Beinfeld M.; Reinheckel T.; Peters C.; Zadina J.; Hook V. (2010) Cathepsin L participates in dynorphin production in brain cortex, illustrated by protease gene knockout and expression. Mol. Cell. Neurosci. 43 (1), 98–107. 10.1016/j.mcn.2009.10.001. [DOI] [PubMed] [Google Scholar]
- Krieger T. J.; Hook V. Y. (1992) Purification and characterization of a cathepsin D protease from bovine chromaffin granules. Biochemistry 31 (17), 4223–31. 10.1021/bi00132a011. [DOI] [PubMed] [Google Scholar]
- Graf L.; Kenessey A.; Patthy A.; Grynbaum A.; Marks N.; Lajtha A. (1979) Cathepsin D generates gamma-endorphin from beta-endorphin. Arch. Biochem. Biophys. 193 (1), 101–109. 10.1016/0003-9861(79)90012-2. [DOI] [PubMed] [Google Scholar]
- Wei E. Q.; Kudo T.; Inoki R. (1990) Pharmacological and biochemical study on the mechanism of enkephalin production in rat dental pulp. J. Osaka Univ. Dent. Sch. 30, 8–30. [PubMed] [Google Scholar]
- Marks N.; Berg M. J.; Benuck M. (1986) Preferential action of rat brain cathepsin B as a peptidyl dipeptidase converting pro-opioid oligopeptides. Arch. Biochem. Biophys. 249 (2), 489–499. 10.1016/0003-9861(86)90026-3. [DOI] [PubMed] [Google Scholar]
- Marks N.; Berg M. J. (1987) Rat brain cathepsin L: characterization and differentiation from cathepsin B utilizing opioid peptides. Arch. Biochem. Biophys. 259 (1), 131–143. 10.1016/0003-9861(87)90478-4. [DOI] [PubMed] [Google Scholar]
- Marks N.; Sachs L.; Stern F. (1981) Conversion of Met-enkephalin-Arg6-Phe7 by a purified brain carboxypeptidase (cathepsin A). Peptides 2 (2), 159–164. 10.1016/S0196-9781(81)80029-0. [DOI] [PubMed] [Google Scholar]
- Kecorius E.; Small D. H.; Livett B. G. (1988) Characterization of a dipeptidyl aminopeptidase from bovine adrenal medulla. J. Neurochem. 50 (1), 38–44. 10.1111/j.1471-4159.1988.tb13226.x. [DOI] [PubMed] [Google Scholar]
- Fricker L. D. (2018) Carboxypeptidase E and the Identification of Novel Neuropeptides as Potential Therapeutic Targets. Adv. Pharmacol. 82, 85–102. 10.1016/bs.apha.2017.09.001. [DOI] [PMC free article] [PubMed] [Google Scholar]
- Sanman L. E.; van der Linden W. A.; Verdoes M.; Bogyo M. (2016) Bifunctional probes of cathepsin protease activity and pH reveal alterations in endolysosomal pH during bacterial infection. Cell Chem. Biol. 23 (7), 793–804. 10.1016/j.chembiol.2016.05.019. [DOI] [PMC free article] [PubMed] [Google Scholar]
- Yadati T.; Houben T.; Bitorina A.; Shiri-Sverdlov R. (2020) The ins and outs of cathepsins: Physiological function and role in disease management. Cells 9 (7), 1679. 10.3390/cells9071679. [DOI] [PMC free article] [PubMed] [Google Scholar]
- Blum J. S.; Fiani M. L.; Stahl P. D. (1991) Proteolytic cleavage of ricin A chain in endosomal vesicles. Evidence for the action of endosomal proteases at both neutral and acidic pH. J. Biol. Chem. 266 (33), 22091–22095. 10.1016/S0021-9258(18)54537-3. [DOI] [PubMed] [Google Scholar]
- Smeekens S. P.; Chan S. J.; Steiner D. F. (1992) The biosynthesis and processing of neuroendocrine peptides: identification of proprotein convertases involved in intravesicular processing. Prog. Brain Res. 92, 235–246. 10.1016/S0079-6123(08)61179-6. [DOI] [PubMed] [Google Scholar]
- Smeekens S. P.; Steiner D. F. (1990) Identification of a human insulinoma cDNA encoding a novel mammalian protein structurally related to the yeast dibasic processing protease Kex2. J. Biol. Chem. 265 (6), 2997–3000. 10.1016/S0021-9258(19)39721-2. [DOI] [PubMed] [Google Scholar]
- Seidah N. G.; Gaspar L.; Mion P.; Marcinkiewicz M.; Mbikay M.; Chrétien M. (1990) cDNA sequence of two distinct pituitary proteins homologous to Kex2 and furin gene products: tissue-specific mRNAs encoding candidates for pro-hormone processing proteinases. DNA Cell Biol. 9 (6), 415–24. 10.1089/dna.1990.9.415. [DOI] [PubMed] [Google Scholar]
- Shennan K. I.; Smeekens S. P.; Steiner D. F.; Docherty K. (1991) Characterization of PC2, a mammalian Kex2 homologue, following expression of the cDNA in microinjected Xenopus oocytes. FEBS Lett. 284 (2), 277–80. 10.1016/0014-5793(91)80703-6. [DOI] [PubMed] [Google Scholar]
- Thomas L.; Leduc R.; Thorne B. A.; Smeekens S. P.; Steiner D. F.; Thomas G. (1991) Kex2-like endoproteases PC2 and PC3 accurately cleave a model prohormone in mammalian cells: evidence for a common core of neuroendocrine processing enzymes. Proc. Natl. Acad. Sci. U. S. A. 88 (12), 5297–301. 10.1073/pnas.88.12.5297. [DOI] [PMC free article] [PubMed] [Google Scholar]
- Miller R.; Aaron W.; Toneff T.; Vishnuvardhan D.; Beinfeld M. C.; Hook V. Y. (2003) Obliteration of alpha-melanocyte-stimulating hormone derived from POMC in pituitary and brains of PC2-deficient mice. J. Neurochem. 86 (3), 556–63. 10.1046/j.1471-4159.2003.01856.x. [DOI] [PubMed] [Google Scholar]
- Smeekens S. P.; Montag A. G.; Thomas G.; Albiges-Rizo C.; Carroll R.; Benig M.; Phillips L. A.; Martin S.; Ohagi S.; Gardner P. (1992) Proinsulin processing by the subtilisin-related proprotein convertases furin, PC2, and PC3. Proc. Natl. Acad. Sci. U. S. A. 89 (18), 8822–6. 10.1073/pnas.89.18.8822. [DOI] [PMC free article] [PubMed] [Google Scholar]
- Bailyes E. M.; Bennett D. L.; Hutton J. C. (2017) Proprotein-processing endopeptidases of the insulin secretory granule. Enzyme 45, 301–13. 10.1159/000468903. [DOI] [PubMed] [Google Scholar]
- Peinado J. R.; Li H.; Johanning K.; Lindberg I. (2003) Cleavage of recombinant proenkephalin and blockade mutants by prohormone convertases 1 and 2: an in vitro specificity study. J. Neurochem. 87 (4), 868–78. 10.1046/j.1471-4159.2003.02043.x. [DOI] [PubMed] [Google Scholar]
- Pan H.; Nanno D.; Che F. Y.; Zhu X.; Salton S. R.; Steiner D. F.; Fricker L. D.; Devi L. A. (2005) Neuropeptide processing profile in mice lacking prohormone convertase-1. Biochemistry 44 (12), 4939–48. 10.1021/bi047852m. [DOI] [PubMed] [Google Scholar]
- Miller R.; Toneff T.; Vishnuvardhan D.; Beinfeld M.; Hook V. Y. (2003) Selective roles for the PC2 processing enzyme in the regulation of peptide neurotransmitter levels in brain and peripheral neuroendocrine tissues of PC2 deficient mice. Neuropeptides 37 (3), 140–8. 10.1016/S0143-4179(03)00027-1. [DOI] [PubMed] [Google Scholar]
- Rouillé Y.; Duguay S. J.; Lund K.; Furuta M.; Gong Q.; Lipkind G.; Oliva A. A. Jr; Chan S. J.; Steiner D. F. (1995) Proteolytic processing mechanisms in the biosynthesis of neuroendocrine peptides: the subtilisin-like proprotein convertases. Front. Neuroendocrinol. 16, 322–61. 10.1006/frne.1995.1012. [DOI] [PubMed] [Google Scholar]
- Seidah N. G.; Sadr M. S.; Chrétien M.; Mbikay M. (2013) The multifaceted proprotein convertases: their unique, redundant, complementary, and opposite functions. J. Biol. Chem. 288 (30), 21473–81. 10.1074/jbc.R113.481549. [DOI] [PMC free article] [PubMed] [Google Scholar]
- Wegrzyn J. L.; Bark S. J.; Funkelstein L.; Mosier C.; Yap A.; Kazemi-Esfarjani P.; La Spada A. R.; Sigurdson C.; O’Connor D. T.; Hook V. (2010) Proteomics of dense core secretory vesicles reveal distinct protein categories for secretion of neuroeffectors for cell-cell communication. J. Proteome Res. 9 (10), 5002–24. 10.1021/pr1003104. [DOI] [PMC free article] [PubMed] [Google Scholar]
- Wegrzyn J.; Lee J.; Neveu J. M.; Lane W. S.; Hook V. (2007) Proteomics of neuroendocrine secretory vesicles reveal distinct functional systems for biosynthesis and exocytosis of peptide hormones and neurotransmitters. J. Proteome Res. 6 (5), 1652–65. 10.1021/pr060503p. [DOI] [PubMed] [Google Scholar]
- Gratzl M.; Krieger-Brauer H.; Ekerdt R. (1981) Latent acetylcholinesterase in secretory vesicles isolated from adrenal medulla. Biochim. Biophys. Acta, Biomembr. 649, 355–66. 10.1016/0005-2736(81)90425-9. [DOI] [PubMed] [Google Scholar]
- Birinci Y.; Preobraschenski J.; Ganzella M.; Jahn R.; Park Y. (2020) Isolation of large dense-core vesicles from bovine adrenal medulla for functional studies. Sci. Rep. 10 (1), 7540. 10.1038/s41598-020-64486-3. [DOI] [PMC free article] [PubMed] [Google Scholar]
- Rappsilber J.; Mann M.; Ishihama Y. (2007) Protocol for micro-purification, enrichment, pre-fractionation and storage of peptides for proteomics using StageTips. Nat. Protoc. 2 (8), 1896–906. 10.1038/nprot.2007.261. [DOI] [PubMed] [Google Scholar]
- Rawlings N. D.; Barrett A. J.; Bateman A. (2010) MEROPS: the peptidase database. Nucleic Acids Res. 38 (suppl_1), D227–D233. 10.1093/nar/gkp971. [DOI] [PMC free article] [PubMed] [Google Scholar]
- Lysyk L.; Brassard R.; Arutyunova E.; Siebert V.; Jiang Z.; Takyi E.; Morrison M.; Young H. S.; Lemberg M. K.; O'Donoghue A. J.; Lemieux M. J. (2021) Insights into the catalytic properties of the mitochondrial rhomboid protease PARL. J. Biol. Chem. 296, 100383. 10.1016/j.jbc.2021.100383. [DOI] [PMC free article] [PubMed] [Google Scholar]
- Mi H.; Muruganujan A.; Huang X.; Ebert D.; Mills C.; Guo X.; Thomas P. D. (2019) Protocol Update for large-scale genome and gene function analysis with the PANTHER classification system (v. 14.0). Nat. Protoc. 14 (3), 703–721. 10.1038/s41596-019-0128-8. [DOI] [PMC free article] [PubMed] [Google Scholar]
- Kim Y.; Bark S.; Hook V.; Bandeira N. (2011) NeuroPedia: neuropeptide database and spectral library. Bioinformatics 27 (19), 2772–3. 10.1093/bioinformatics/btr445. [DOI] [PMC free article] [PubMed] [Google Scholar]
- Xiao Y.; Hsiao T. H.; Suresh U.; Chen H. I.; Wu X.; Wolf S. E.; Chen Y. (2014) A novel significance score for gene selection and ranking. Bioinformatics 30 (6), 801–7. 10.1093/bioinformatics/btr671. [DOI] [PMC free article] [PubMed] [Google Scholar]
- Colaert N.; Helsens K.; Martens L.; Vandekerckhove J.; Gevaert K. (2009) Improved visualization of protein consensus sequences by iceLogo. Nat. Methods 6 (11), 786–7. 10.1038/nmeth1109-786. [DOI] [PubMed] [Google Scholar]
- Manguy J.; Jehl P.; Dillon E. T.; Davey N. E.; Shields D. C.; Holton T. A. (2017) Peptigram: A Web-Based Application for Peptidomics Data Visualization. J. Proteome Res. 16 (2), 712–719. 10.1021/acs.jproteome.6b00751. [DOI] [PubMed] [Google Scholar]
Associated Data
This section collects any data citations, data availability statements, or supplementary materials included in this article.
Supplementary Materials
Data Availability Statement
All mass spectrometry data have been deposited in MassIVE and proteomeXchange with accession numbers. MassIVE: MSV000085957 (proteomics), MSV000085956 (peptidomics), MSV00008595 (MSP-MS). ProteomeXchange: PXD020926 (proteomics), PXD020925 (peptidomics).