Abstract
Introduction:
To better understand how radiotherapy delivery parameters affect the depletion of circulating lymphocytes in patients treated for intra-cranial tumors, we developed a computational human body blood flow model (BFM), that enables to estimate the dose to the circulating blood during the course of fractionated radiation therapy.
Materials & Methods:
A hemodynamic cardiovascular system based on human body reference values was developed to distribute the cardiac output to 24 different organs, described by a discrete Markov Chain. For explicit intracranial blood flow modeling, we extracted major cerebral vasculature from MRI data of a patient and complemented them with an extension network of generic vessels in the frontal and occipital lobes to guarantee even overall blood supply to the entire brain volume. An explicit Monte Carlo simulation was implemented to track the propagation of each individual blood particle (BP) through the brain and time-dependent radiation fields, accumulating dose along their trajectories.
Results:
The cerebral model includes 1050 path lines and explicitly simulates more than 266’000 BP at any given time that are tracked with a time resolution of 10 ms. The entire BFM for the whole body contains 22’178’000 BP, corresponding to 4200 BP per ml of blood. We have used the model to investigate the difference between proton and photon therapy, and the effect of different dose rates and patient characteristics on the dose to the circulating blood pool.
The mean dose to the blood pool is estimated to be 0.06 and 0.13 Gy after 30 fractions of proton and photon therapy, respectively, and the highest dose to 1% of blood was found to be 0.19 Gy and 0.34 Gy. The fraction of blood volume receiving any dose after the first fraction is significantly lower for proton therapy, 10.1% compared to 18.4% for the photon treatment plan. 90% of the blood pool will have received dose after the 11th fraction using photon therapy compared to the 21st fraction with proton therapy. Higher dose rates can effectively reduce the fraction of blood irradiated to low doses but increase the amount of blood receiving high doses. Patient characteristics such as blood pressure, gender and age lead to smaller effects than variations in the dose rate.
Conclusion:
We developed a 4D human BFM including recirculating to estimate the radiation dose to the circulating blood during intracranial treatment and demonstrate its application to proton- versus photon-based delivery, various dose rates and patient characteristics. The radiation dose estimation to the circulating blood provides us better insight into the origins of radiation-induced lymphopenia.
1. INTRODUCTION
The detrimental effects of radiation on the immune system have lately become a focus in radiotherapy research. Recent clinical studies have demonstrated an association between radiation-induced lymphopenia (i.e. the depletion of the circulating lymphocytes) and poor survival in different indications (Hughes et al., 2005, Grossman et al., 2011, Campian et al., 2013, Wild et al., 2015, Davuluri et al., 2017, Grassberger et al., 2019) and that radiation is directly involved in immunosuppression (Ladbury et al., 2019). MacLennan (1978) have shown that radiation-induced lymphopenia occurs even if the treated organ contains only little lymphatic tissue or bone marrow. This indicates the significance of the impact of radiation on the circulating lymphocytes in the peripheral blood.
Due to the fact that the immune cells circulate in the peripheral blood stream, only a fraction of them will be irradiated when passing through the radiation field. To date, only very few studies took a special interest to quantify the accumulated dose to the circulating lymphocytes during the course of radiation therapy. Yovino et al., (2013) were the first to propose a mathematical model to estimate the dose to circulating lymphocytes during radiotherapy treatments. The model assumes circulation between the brain, our Region of Interest, and the aggregate rest of the body with a pre-defined heart-to-heart circulation of time of 30s, and blood traveling inferiorly to superiorly through the field without re-entering within one radiotherapy fraction.
Basler et al., (2018) proposed a convolution-based model for liver irradiation. Their model convolves the individual Dose Volume Histogram (DVH) of each of the eight liver lobes with the pre-defined occupation time of the blood within the radiation field and the estimated blood volume in each lobe. This approach, however, is considered static and doesn’t consider the dynamics of the circulating blood and the possible re-entering of blood into the irradiated area within one field (or arc), which can lead to discrepancies for long beam on times.
Recent fluid dynamic studies have developed multi-scale models of the blood flow in the brain (Perdikaris et al., 2016). Grinberg (2011), proposed the first simulation of the cerebral blood flow to study the multi-scale interaction between blood cells and the walls of the major arteries in the brain extracted from MRI data. While these innovative approaches allow the study of physics phenomena in the cerebral vasculature, such as the thrombus formation process in intracranial aneurysms, they focus on solving fluid-dynamics within the vasculature, they are only interested in the blood flow within the brain and they require high-performance computational resources.
In this work we introduce an explicit four-dimensional (4D) blood flow model (BFM) to calculate the dose to the circulating blood during radiation therapy for intracranial targets. We developed an image-based methodology to generate an anatomy-based cerebral vasculature to describe the intracranial flow of the blood through the irradiation field, and the resulting accumulation of dose to fractional volumes of blood. The purpose of the model is not to provide a microscopically accurate flow map, but an anatomically informed, approximate representation of speed and direction of blood flow on a scale that matters for radiotherapy. To realistically estimate the probability of recirculation during RT, and the mixing of irradiated blood in the body’s cardiovascular system, we have further implemented a compartmental BFM for the rest of the body following published reports (ICRP89, 2002).
As proof-of-principle we have applied the model to study the blood dose-volume histogram (DVH) after proton- versus photon therapy for an intracranial target. Furthermore, we investigated the effect of altering the dose rate as well as different physiological parameters such as heart rate, blood speed and gender difference.
2. METHODS AND MATERIALS
2.1. General model of intracranial blood flow
2.1.1. Anatomy based cerebral vasculature model
We first used a high-resolution 3D magnetic resonance image to extract the major human brain vasculature consisting of anterior-, posterior- cerebral artery and superior sagittal sinus. The image data were acquired for a previous study to detect the dural lymphatic vessels in the human brain (Absinta et al., 2017). The image data sets have a resolution of [0.858, 0.851, 0.891] mm and consist of a contrast enhanced T1-weighted black-blood image based on a spin-echo sequence and a T2-weighted sequence based on fluid-attenuated inversion recovery (FLAIR) Figure 1 (a) and (b)).
Figure 1:

(a) T2-weighted MRI data acquired using contrast agent and FLAIR sequence, (b) T1-weighted MRI data acquired based on spin-echo sequence, (c) Contrast enhanced vessel model based on fusing data sets from (a) and (b).
The image data set was pre-processed to improve the performance of the intensity-based segmentation. After rigid registration, the intensity of the T2-weighted image was scaled and adjusted to the T1-weighted image. The two images were then fused to result in contrast enhancement between the walls of vessels and the background, due the fact that the blood signal within vessels is supressed in both raw images. By flipping the intensity values, we derived a contrast enhanced bright blood MRI (see Figure 1 (c)). The large vessels have then been manually segmented using a threshold derived from the regional intensity distribution in 3D Slicer Figure 2 (a) (Kikinis et al., 2014). To extract the medial centerline of the segmented vasculature, a 3D thinning method was implemented in MATLAB 2013b (see Figure 2 (b/c)). And the following steps were performed: 1) Arteries and veins were labeled to avoid any unintentional connectivity. 2) A first order derivative operator was applied to identify any of the six surficial edges of the vessels. 3) The 26-connected neighbors of each voxel of the edges were located. 4) those who do not change the Euler characteristic were eroded layer by layer (Lee et al., 1994). The final data was post-processed to smooth regional paths irregularities and to resolve artefacts.
Figure 2:
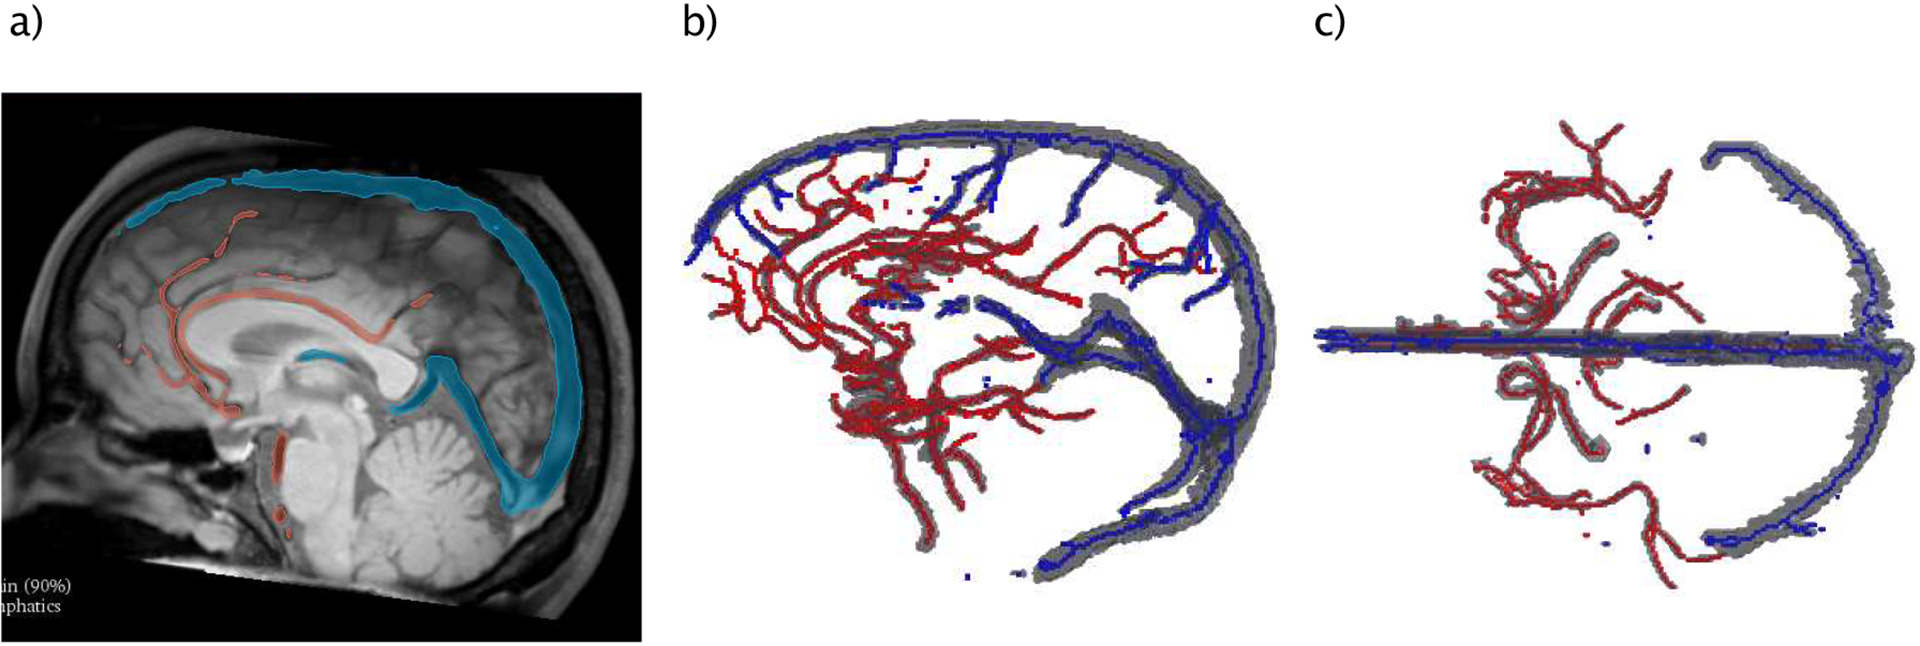
Workflow of generating BF path lines: (a) Intensity based segmentation of brain vessels, (b) lateral and (c) top-down view of segmented arteries (red) and veins (blue) together with median centerlines.
Since the macroscopic segmented brain vasculature doesn’t cover the entire brain volume to a sufficient degree for our purpose, we complemented this model with an extended network of generic vessels in the frontal and occipital lobes to guarantee blood supply to the entire volume. This generic model is also based on the same brain’s anatomy and it’s connected to the anatomical model above by their starting points (carotid and vertebral arteries) and the common drainage via the superior sagittal sinus.
Generic artery pathway model:
The starting coordinates are the entrance location of the carotid- and the vertebral arteries. The latter supply blood to the occipital lobe and the carotid artery to the rest of the cerebrum. A network of isotropic radial path lines was generated, starting from these major arteries towards the lateral and inferior brain surfaces. After reaching these surfaces, they continue on a straight path upwards until they reach the superior surface of the brain (see Figure 3 (a)). This ensures a homogenous blood flow, inferior to superior, through the transverse planes in the supratentorial brain. The angular distance between two adjacent path lines was recursively calculated such that the resulting grid in the transverse plane has a spacing of about 4 mm. This corresponds to twice the grid spacing of the dose calculation grid (i.e. 2 mm), which is the distance over which the delivered dose can vary significantly.
Figure 3:
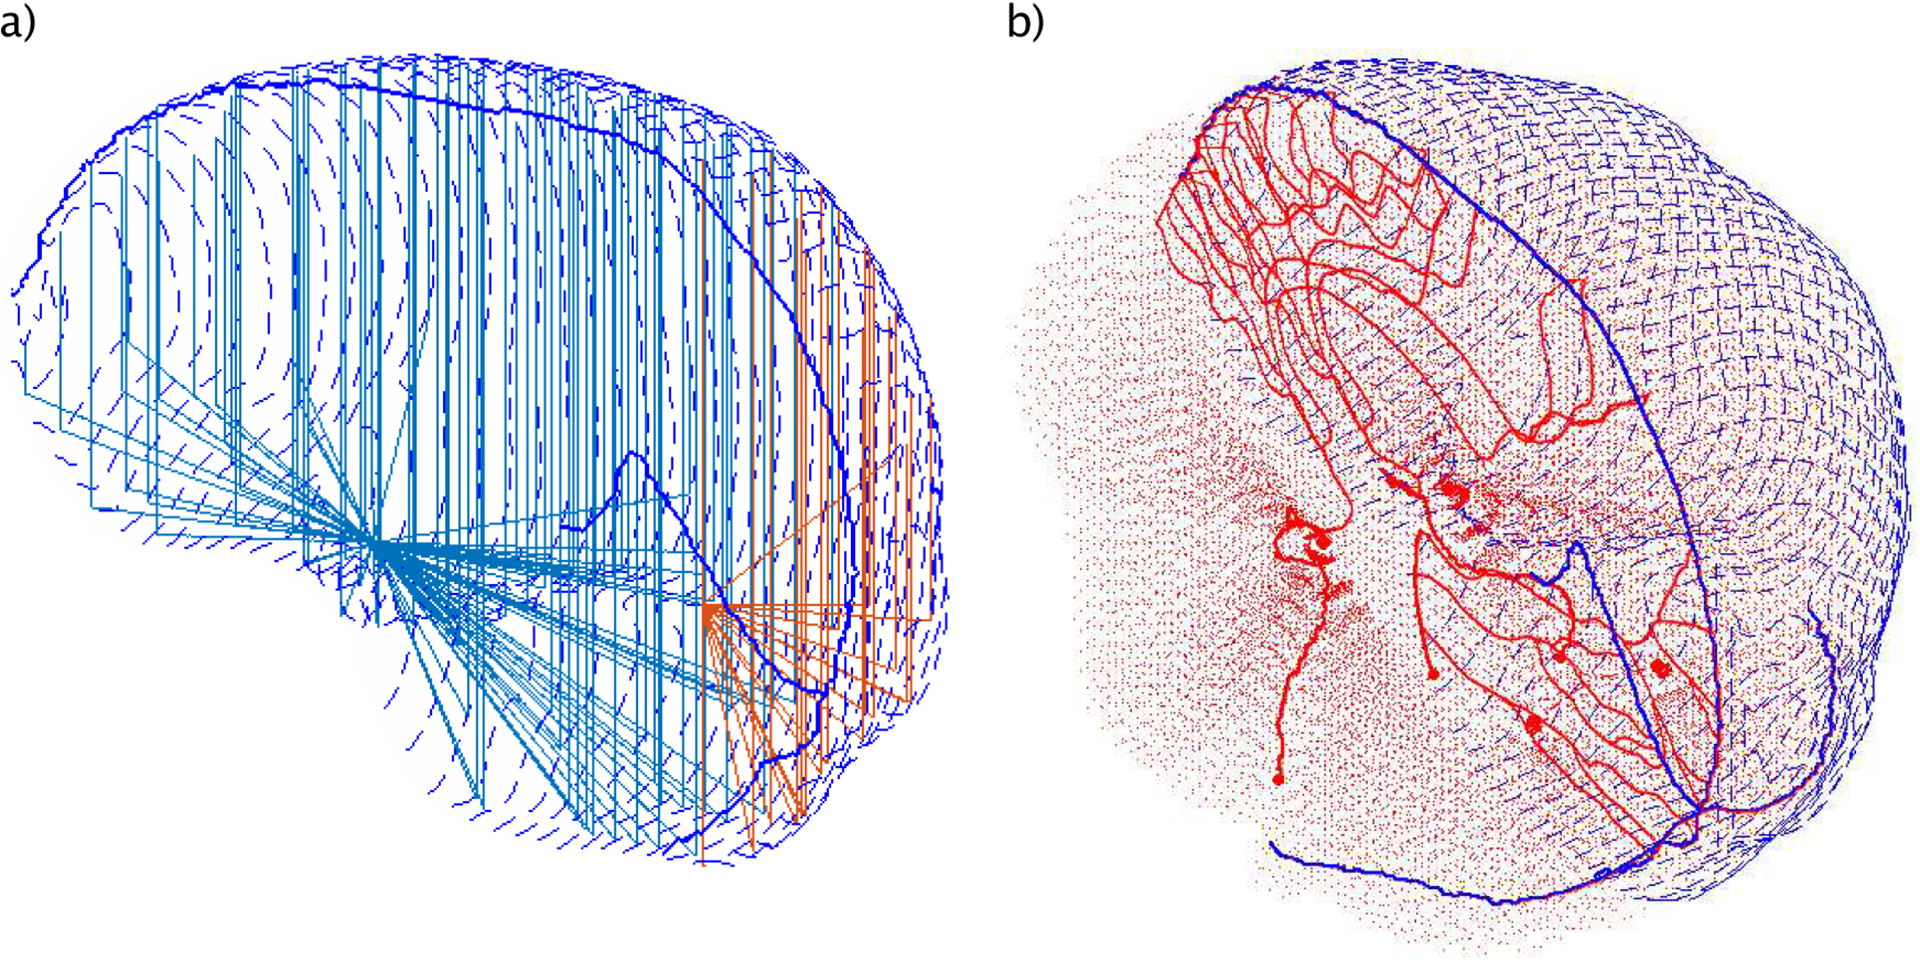
a) example of the generic arteries of the frontal lobe (light blue) and occipital lobe (orange). b) Entire vasculature pathways of the brain including the anatomy-based (solid) and generic vessel system (dotes & dashed lines). The arteries (red) and veins (blue) are connected to guaranty a continuous blood flow.
Generic drainage model:
The cerebral venous drainage in the generic model is assumed to cover the superior surface of the brain to guarantee the back flow of the blood to the superior sagittal sinus. For this purpose, a manual skull stripping was performed based on the MRI data to separate brain tissue from surrounding regions. Along this surface the path lines connected back to the superior sagittal sinus Figure 3 (a/b). A Savitzky-Golay interpolation was applied to smooth the edge-like regions resulting due to noise from the stripping. The spacing between veins was selected to be similar to the arteries (i.e. 4 mm) in order to avoid oblique pathways.
2.1.2. Blood flow simulation and scoring dose
The dose scoring of the blood flow simulation presented in this work was developed in MATLAB 2013b. The cerebral vasculature model counts 1050 vasculature path lines in total, 996 of them are generic and 54 are anatomy-based vessels (see Figure 3 (b)). For each BP moving along these path lines, the initial position is the entrance of the major arteries and the final location is at the transverse sinuses. To determine the appropriate numbers of BP to simulate explicitly within the brain and in the whole BFM, we calibrated our model to published literature. Except where explicitly noted otherwise, all the hemodynamical and physiological data used in this work are based on the ICRP report 89 (ICRP89, 2002). According to this report, 1.2% of the total blood volume is located in the brain vasculature at any time. We simulated the equilibrium state in the intracranial BFM by pumping BP with a pulsing-rate fBP. This latter and the average speed of blood were tuned such that the count of the BP satisfies both conditions, the blood count and blood flow rate in the brain from (ICRP89, 2002). The number of BPs in the explicit brain simulation can be written as:
| (1) |
where pi is the i-th vasculature trajectory and np is the number of pathways.
For the dose calculation during protracted fraction delivery, a treatment fraction is composed of nF fields and beam-off time between delivered segments. Given the dose distribution of the patient from the treatment plan (see Figure 4 (a–b)) and the delivery time parameters, the dose rate is calculated as a function of time for each voxel. For each fraction, after reaching the equilibrium state, the particular dose rate of each field delivery is overlaid on the trajectory-based position (see Figure 4 (c)). The accumulated dose can be analytically described as the integral over the geometrical trajectory and is computed as follows:
| (2) |
where is the dose rate at the location at the time t, Δx is the resulting step length. N is the number of re-entrances of a single blood particle (ID) into the beam delivery.
Figure 4:
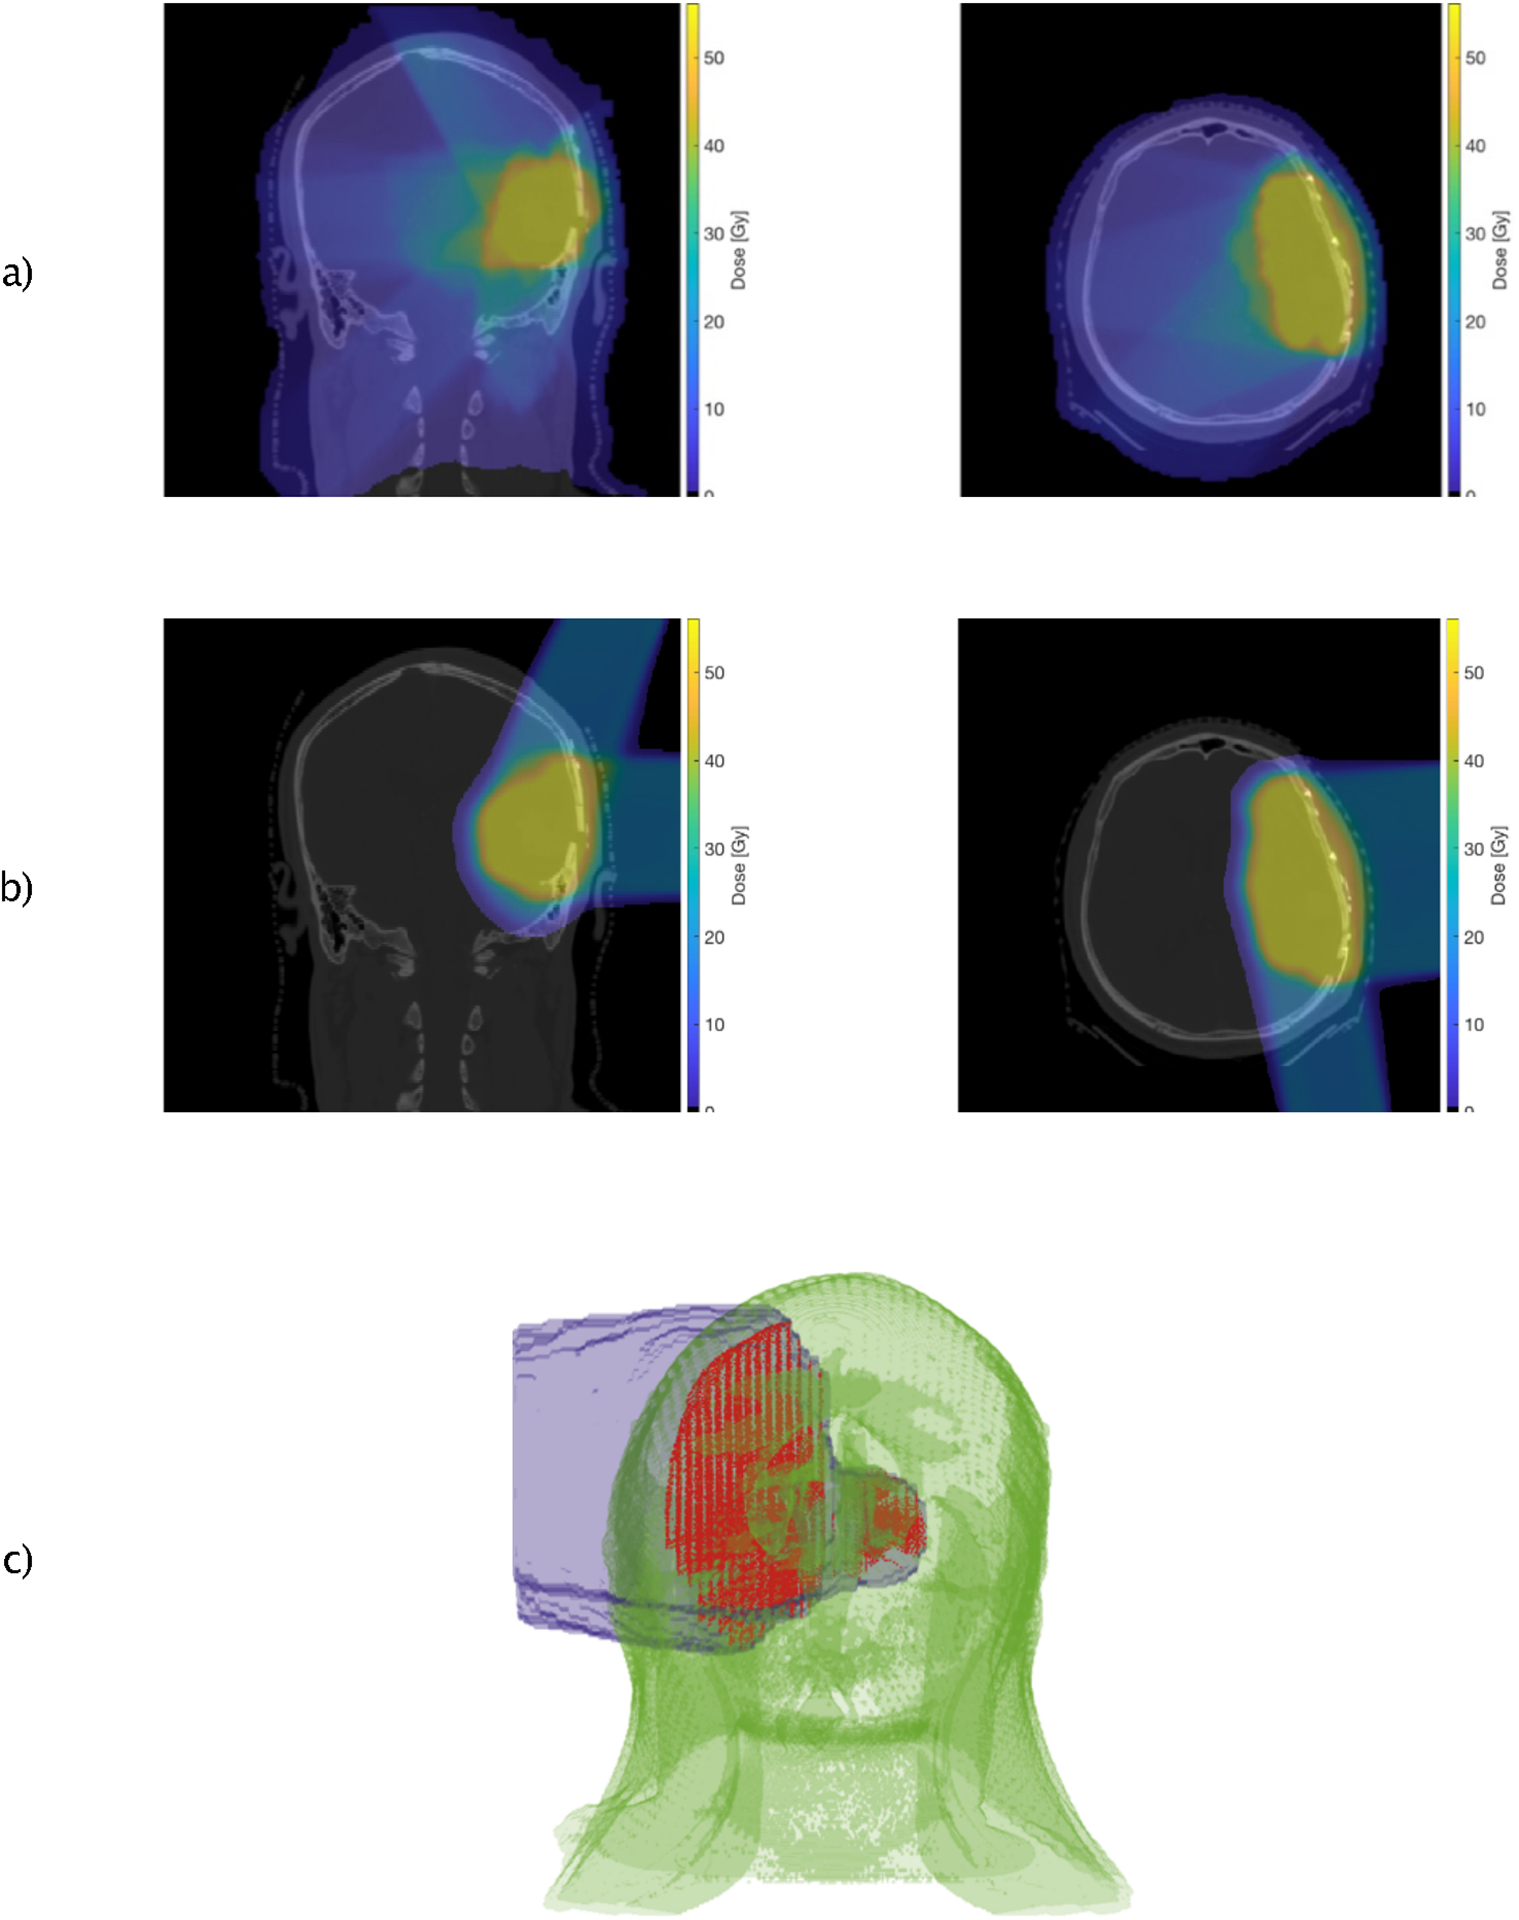
a/b), Different axial views of the dose distribution of a photon- (a) and proton (b) treatment plan for a brain tumor patient, c), Dose to the circulating BPs (red) during beam-on time. The dose rate of a lateral proton beam is overlaid on the patient anatomy and the corresponding BP trajectories model.
2.1.3. Compartment model to simulate blood flow outside the brain
To model the regional distribution of BP outside the brain, we have developed a human BFM according to a reference human body model (ICRP89, 2002). This model compromises 24 different organs (see Figure 5). We have refined the model by splitting the human body into two major divisions, upper lower body. Those organs that expand along the entire body (e.g. lymph nodes, skeletal muscle) were further subdivided into compartments belonging only to one major body division. The corresponding hemodynamic values have been adapted by taking into account the relative mass distribution of the compartments to the body mass (Janssen et al., 2000, ICRP, 1975). The final model includes 32 compartments (see Figure 5). The cardiovascular system consists of the heart, arteries and the veins. The heart consists of two compartments: the right heart, which pumps blood to the lung, the left heart responsible for distributing the cardiac output throughout the body and to the coronary tissue that supplies the heart. The BFM compartment model was designed in such a way that it can be extended to include explicit tracking in other compartments, such as liver or lungs, and can simulate large radiation fields irradiating multiple compartments at once.
Figure 5:
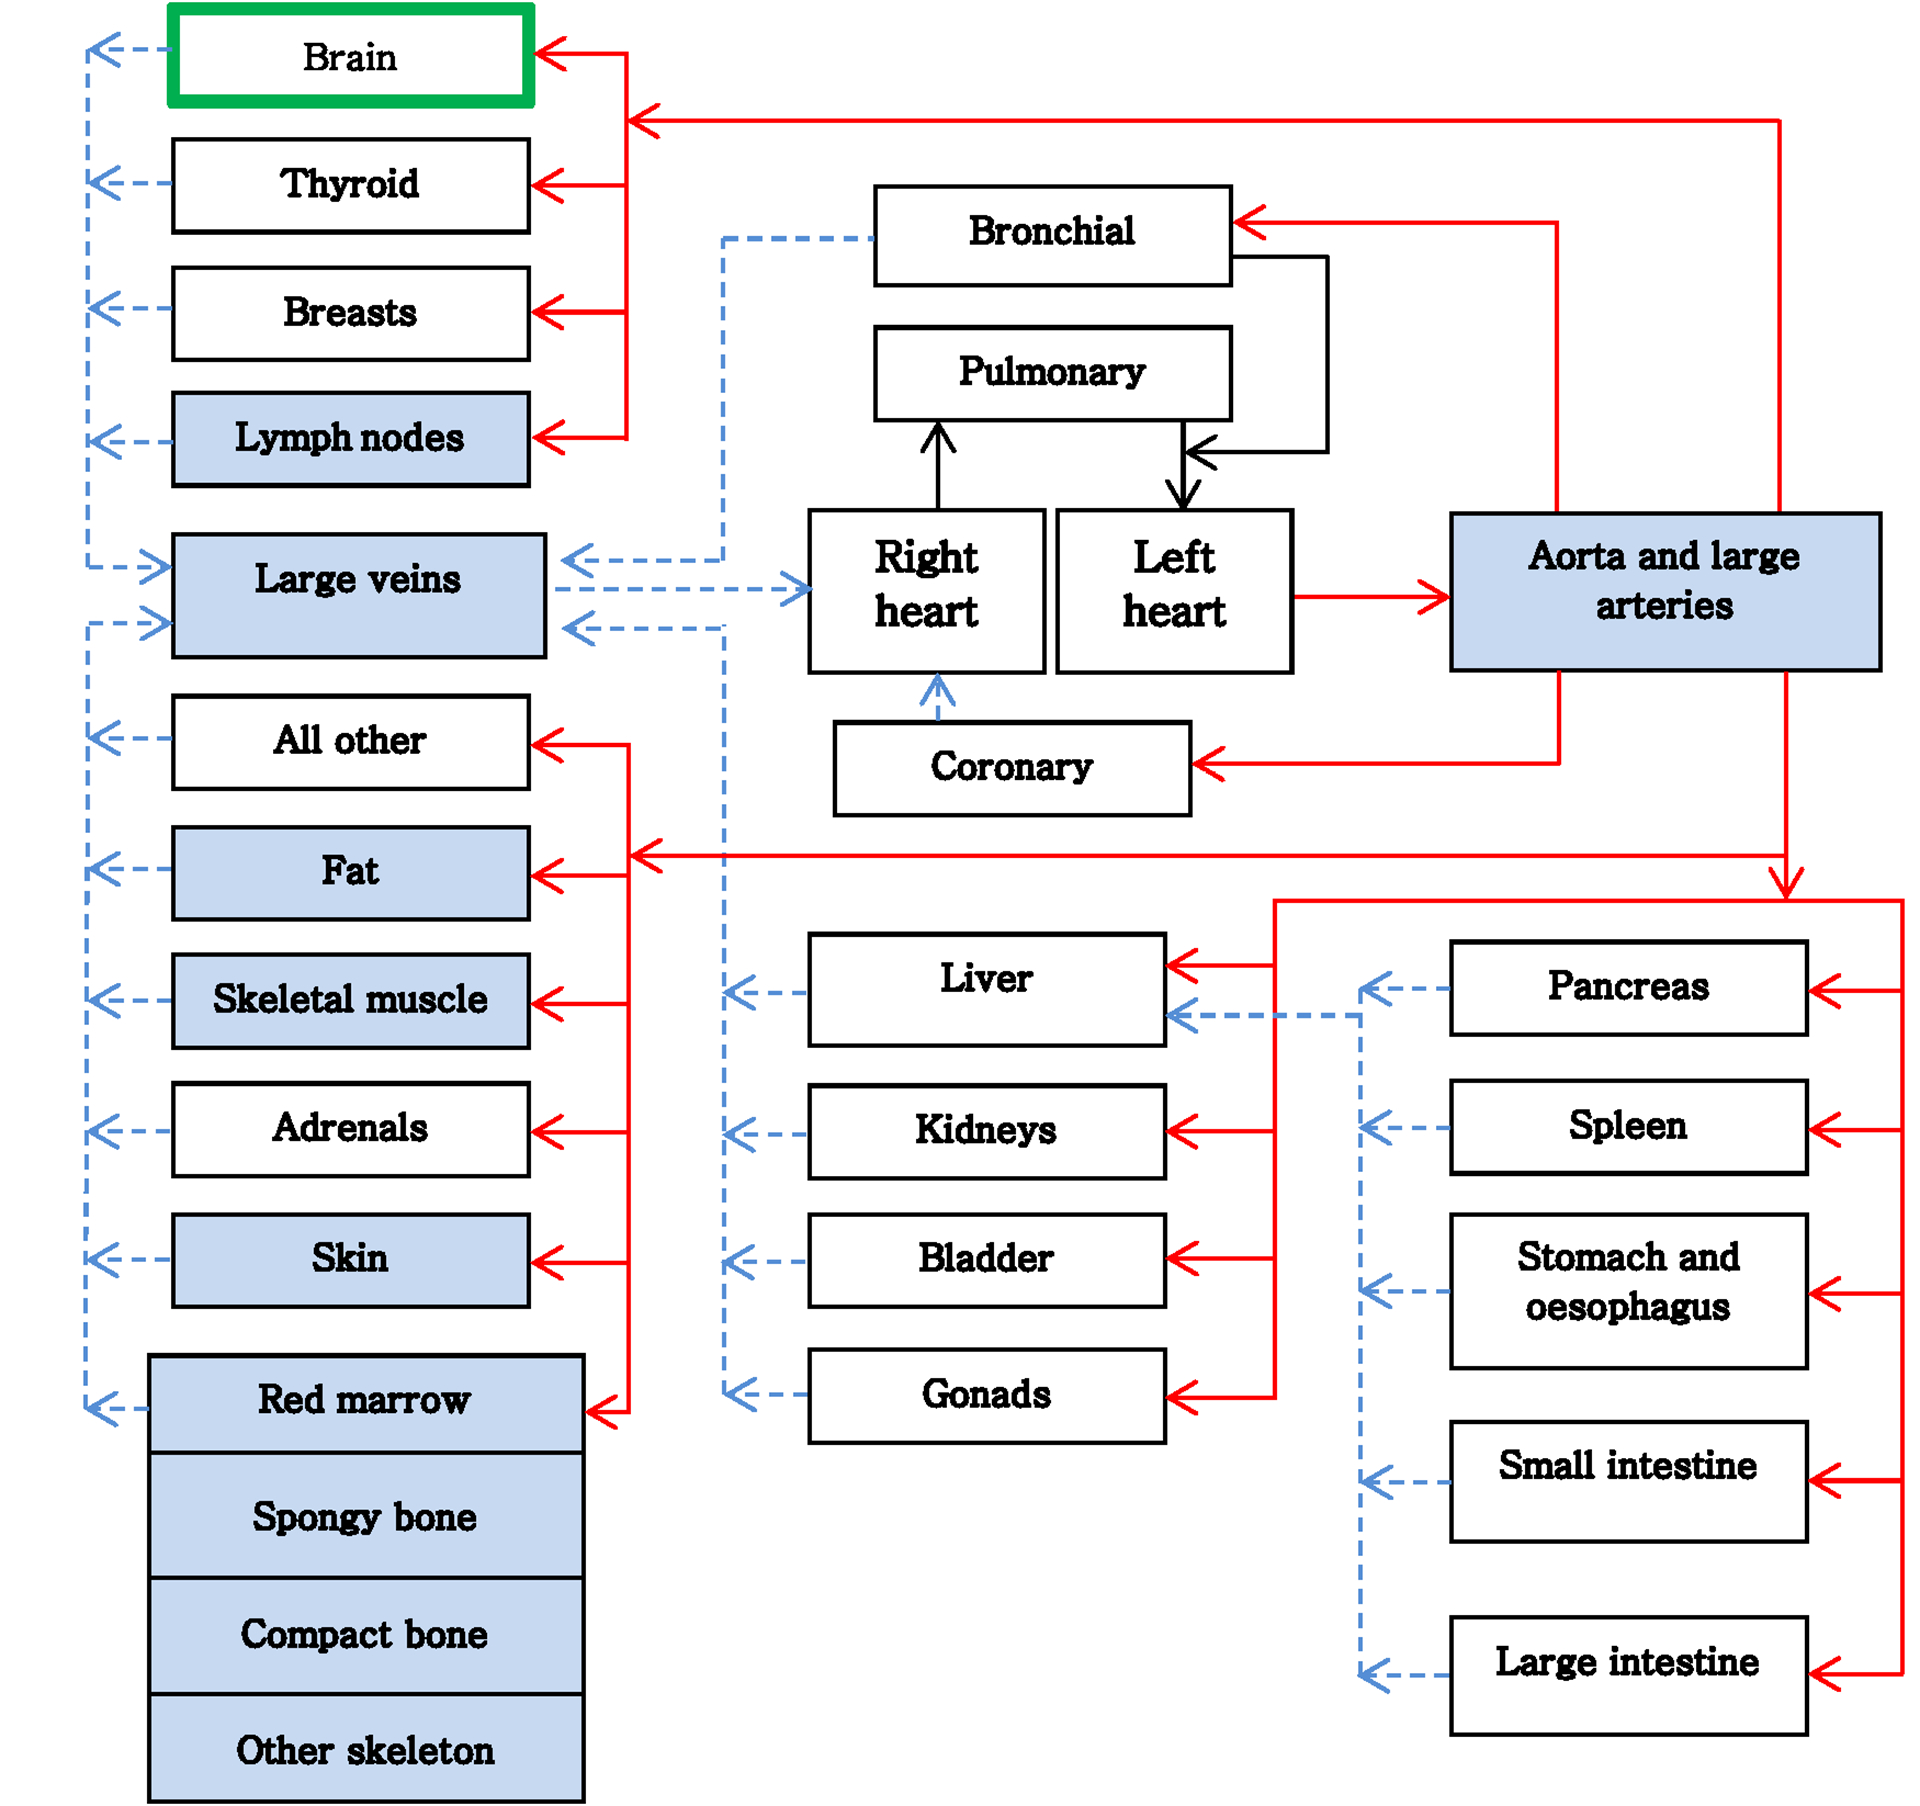
Transition diagram of the blood flow in the human body. Blue compartments are those organs that expand over the upper and lower body. Solid lines (red) are arterial and dashed lines (blue) are venous flow.
To validate our blood flow model, we compared the mixing process with published experimental data (Nylin G and Celander H., 1950). To that end we computed the dilution curve of our BFM and compared it with the measured dilution curve from 32P-labeled erythrocytes in humans. The digital dilution curve was reconstructed by labelling a given quantity of blood in the antecubital veins of the upper body in the BFM. These markers were tracked along the compartments of the model and as a function of time and were then quantified when reaching the brachial arteries. Due to the lack of proper description of the measurements, we have normalized the results in our model to the maximum of the dilution curve. We reconstructed multiple dilution curves as a function of heart rate, total blood volume and cardiac output, in order to consider the physiological diversity of the patients. Each of the parameters has been varied in a range of ± 30% of its reference value (see section 3.1).
The BPs in our model can re-enter the radiation field multiple times and along different path lines during the time interval when the beam is switched on. The probability to re-enter the radiation field is determined by the previous location of the BP and by the ratio of the time delivery of the single field to the time required for a BP to return to the cardiovascular system and re-circulate. The intracranial pathways are chosen randomly by the BPs pumped in the brain. The time evolution of the BP’s regional distribution of a given compartment is assumed to be a stochastic process {Xt:t ∈ T} where T is the treatment time index set and Xt is the value of the blood pool distribution at time t ≥ 0 and X ≔ [X1, X2, …, Xm] is the regional distribution between m compartments. The BFM computes the transition of each BP between the actual (Xt) and the next regional distribution (Xt+1) using a continuous flow propagation based on the transport model described above (see section 2.1.2).
When the beam is switched off and in between fractions, the Xt+1 of those BPs that have already received dose is modelled using a discrete-time Markov Chain process. The transition probability of each state is computed based on the regional blood volume and the corresponding blood flow rate reported here (ICRP89, 2002). The initial probability distribution is computed from the last stage Xt resulting after the treatment beam.
We investigated the impact of radiation modality on the dose received by the blood pool. For this purpose, 2 plans, based on IMRT and passive scattering proton therapy, were created for the same patient and CTV (volume: 316.5 cm3). The IMRT plan consists of 6 fields, while the proton plan is composed of 3 fields (see Figure 4). The MRI data was registered to the patient CT, and the resulting deformation field was used to compute the new blood’s path lines taking into account the intrinsic coordinates of the CT data set and the corresponding dose distribution. Blood DVHs were calculated for each treatment modality. To focus solely on the differences in dose distribution, we neglected the fact that IMRT usually requires a longer delivery time compared to proton therapy and set the machine’s dose rate to 200 cGy/min. We simulated up to 30 fractions to a total dose of 60 Gy. We quantified the fraction of the blood pool receiving dose greater than a threshold dose of 0.43 Gy as this dose level is thought to decrease the CD8 lymphocyte count by 10% according to in vitro data by Nakamura et al., (1990).
3. RESULTS
3.1. Equilibrium and dose scoring
Figure 6 (a–c) shows the BP propagation along their pathways during three different time points, Figure 6 (c) representing the equilibrium stage. Figure 6 (d), depicts the inherent time distribution of the cerebral vasculature of the BFM, i.e. the time it takes to traverse the brain on the different paths. The distribution is left skewed, because the arteries in the occipital lobe connect directly with straight sinus and are characterized by a shorter path length. Both, the location of the first bin (2.27 s) and the variance of the distribution depend only on the selected blood speed. The width of the distribution guarantees mixing of the blood flow before BP circulate back to the heart. Figure 6 (e), shows the evolution of the BP numbers entering the brain until the equilibrium state is reached. The equilibrium blood speed that satisfy the hemodynamic data of the brain was 90 mm/s. For the simulations we assumed the patient as an adult male patient with a heart rate of 60 bpm, a blood volume of 5.3 l and cardiac output of 6.5 l/min (ICRP89, 2002). The flow rate and the volumetric counts of BPs of each compartment were calculated using the calibration approach described in section 2.1.2. This parametrisation results in 266’146 BPs explicitly tracked within the brain vasculature at any given time after equilibrium, corresponding to 22’178’833 circulating BP in the entire system. The time step for the brain simulation was set to 10 ms, to ensure step sizes for the BP in the explicit simulation <1 mm.
Figure 6:
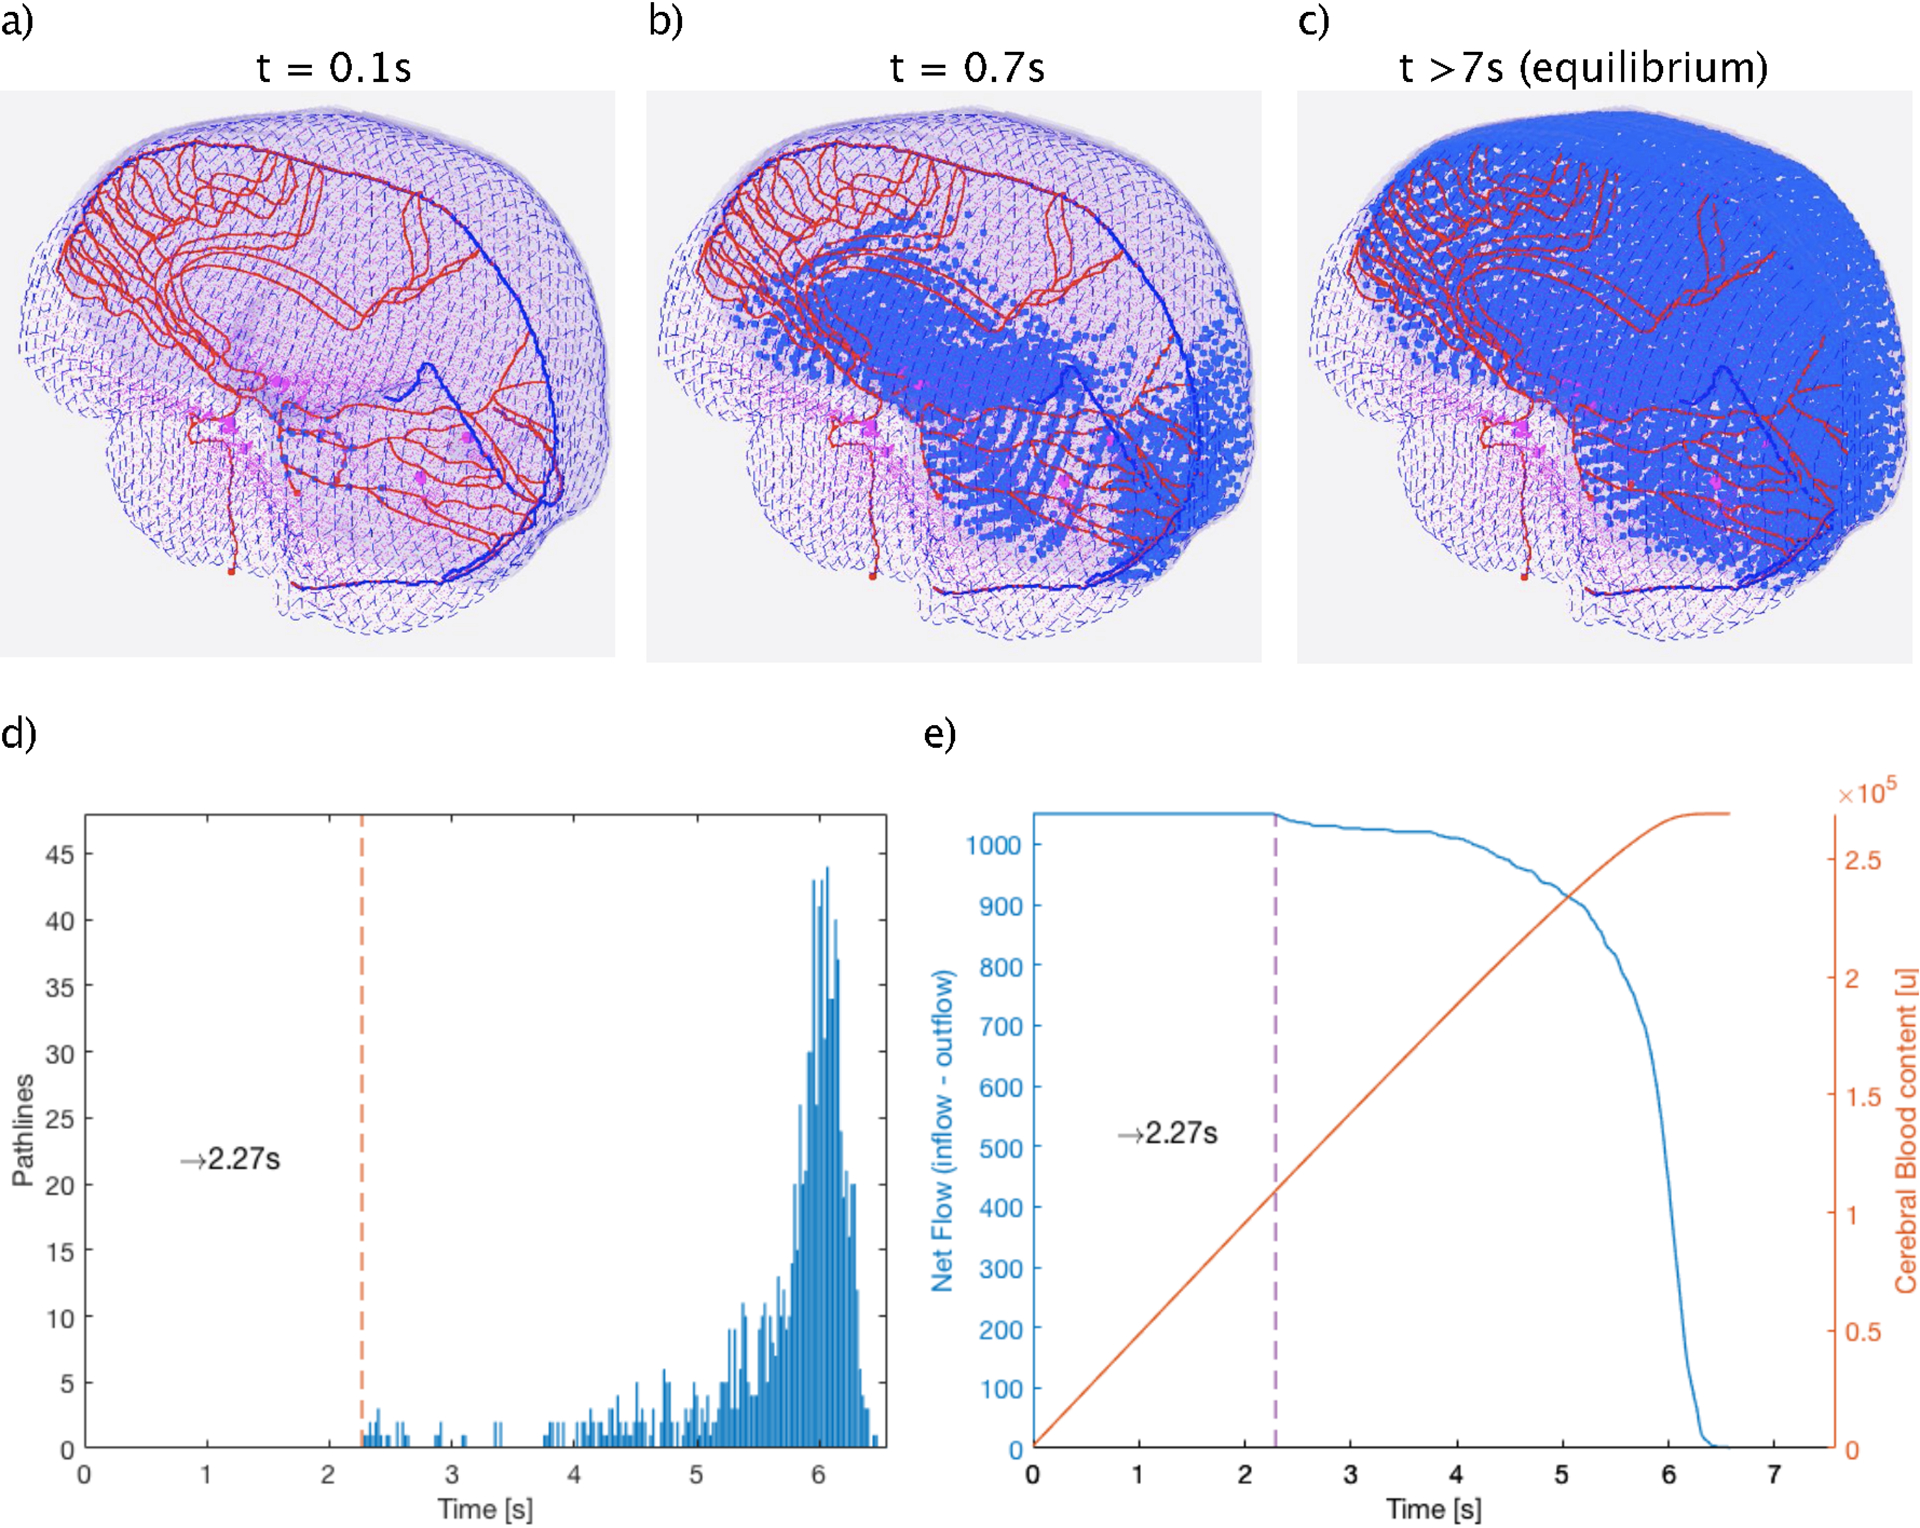
(a-c), Frames of the blood flow model in the brain at three different times points during the path to equilibrium (a: t1=0.1s, b: t2=0.7s and c: t3>7s) showing the spatial and temporal propagation of the blood particles (blue points) along their path lines. d), The differential time distribution of the BP traveling through the vasculature model. Dashed vertical line indicates the shortest Time of Flight required to enter and leave the brain. e), (blue) Number of BPs entering the system at each time until equilibrium is reached and (orange) Evolution of the equilibrium state as function of the entering BPs.
Figure 7 shows the comparison between the digital dilution curve of the BFM and the measured dilution curve of a healthy subject. Due to missing information about the exact experimental conditions, we scaled our data to the maximum value. The general agreement of the two curves, especially regarding the peak-to-plateau ratio and the timeframe of the decay, gives us confidence that our blood flow model is indeed a realistic simulation of the blood mixing process, of course within the uncertainty of unknown patient-specific factors.
Figure 7:
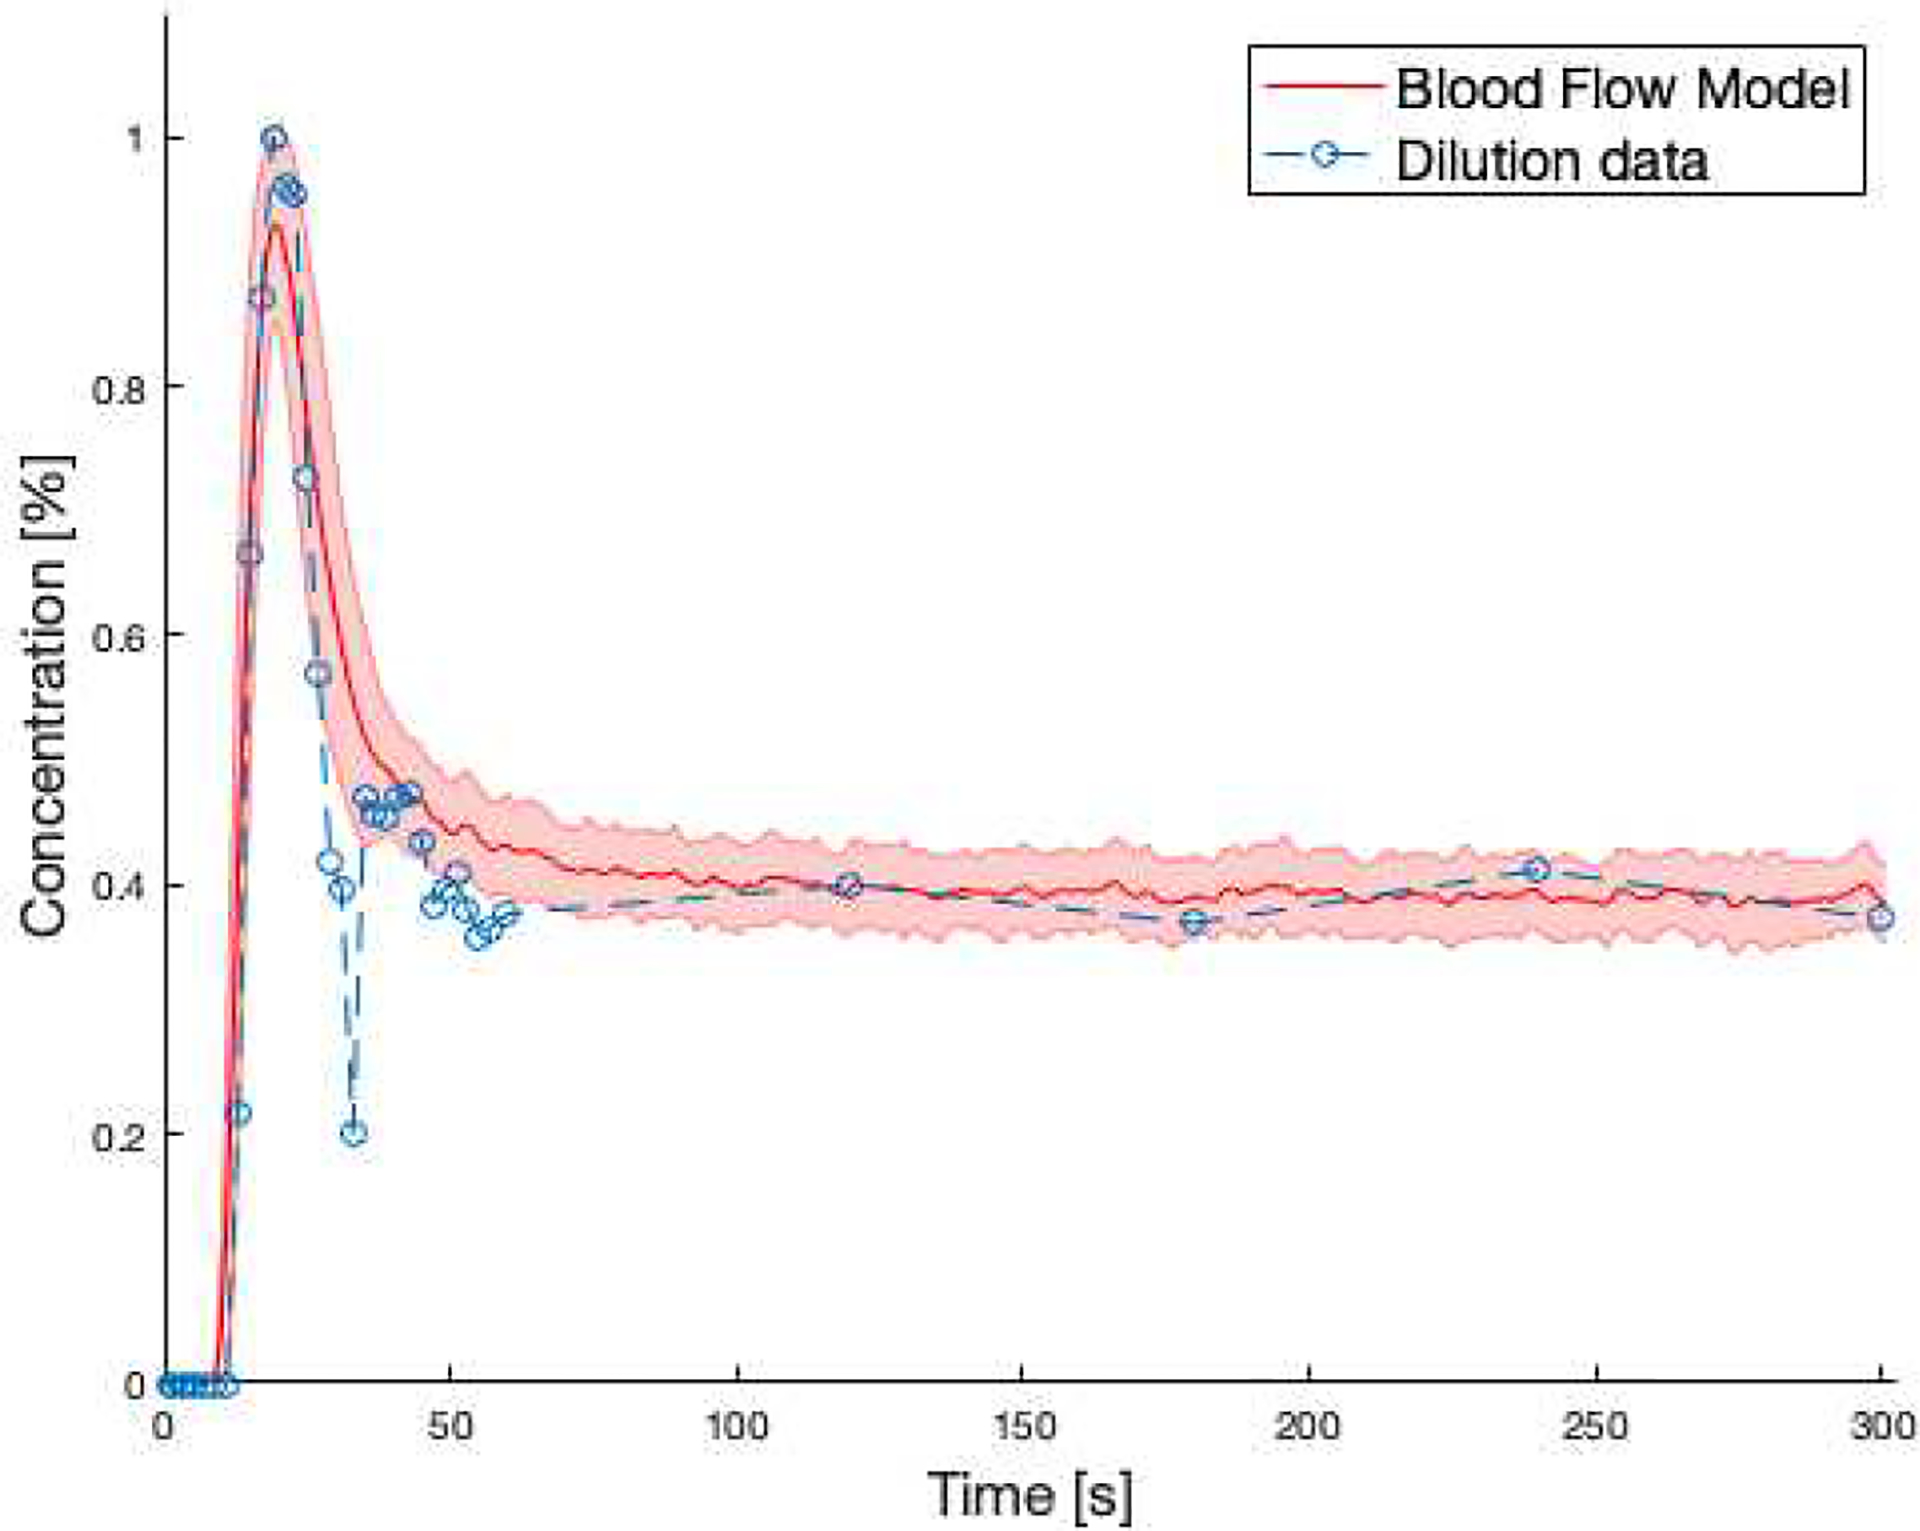
Comparison between averaged dilution curve of the BFM (red solid line) and the same curve from measured data (blue dashed line). The shaded red area represents ± deviation resulting from varying heart frequency, blood volume and cardiac output.
3.2. Effect of treatment modality on dose received by circulating blood
Figure 8 (a/b), show the blood DVH after the first fraction and 30 fractions, respectively, for a treatment using proton therapy compared to photon therapy, assuming 2 Gy dose per fraction and a dose rate of 2 Gy/min. The BFM indicates a mean dose of 0.061 Gy and 0.133 Gy, for proton and IMRT techniques after 30 fractions, respectively. This corresponds to an integral dose difference of more than 118%. The results are summarized in Table 1. The shaded area in Figure 8 reveals the difference between DVHs for proton therapy and IMRT.
Figure 8:
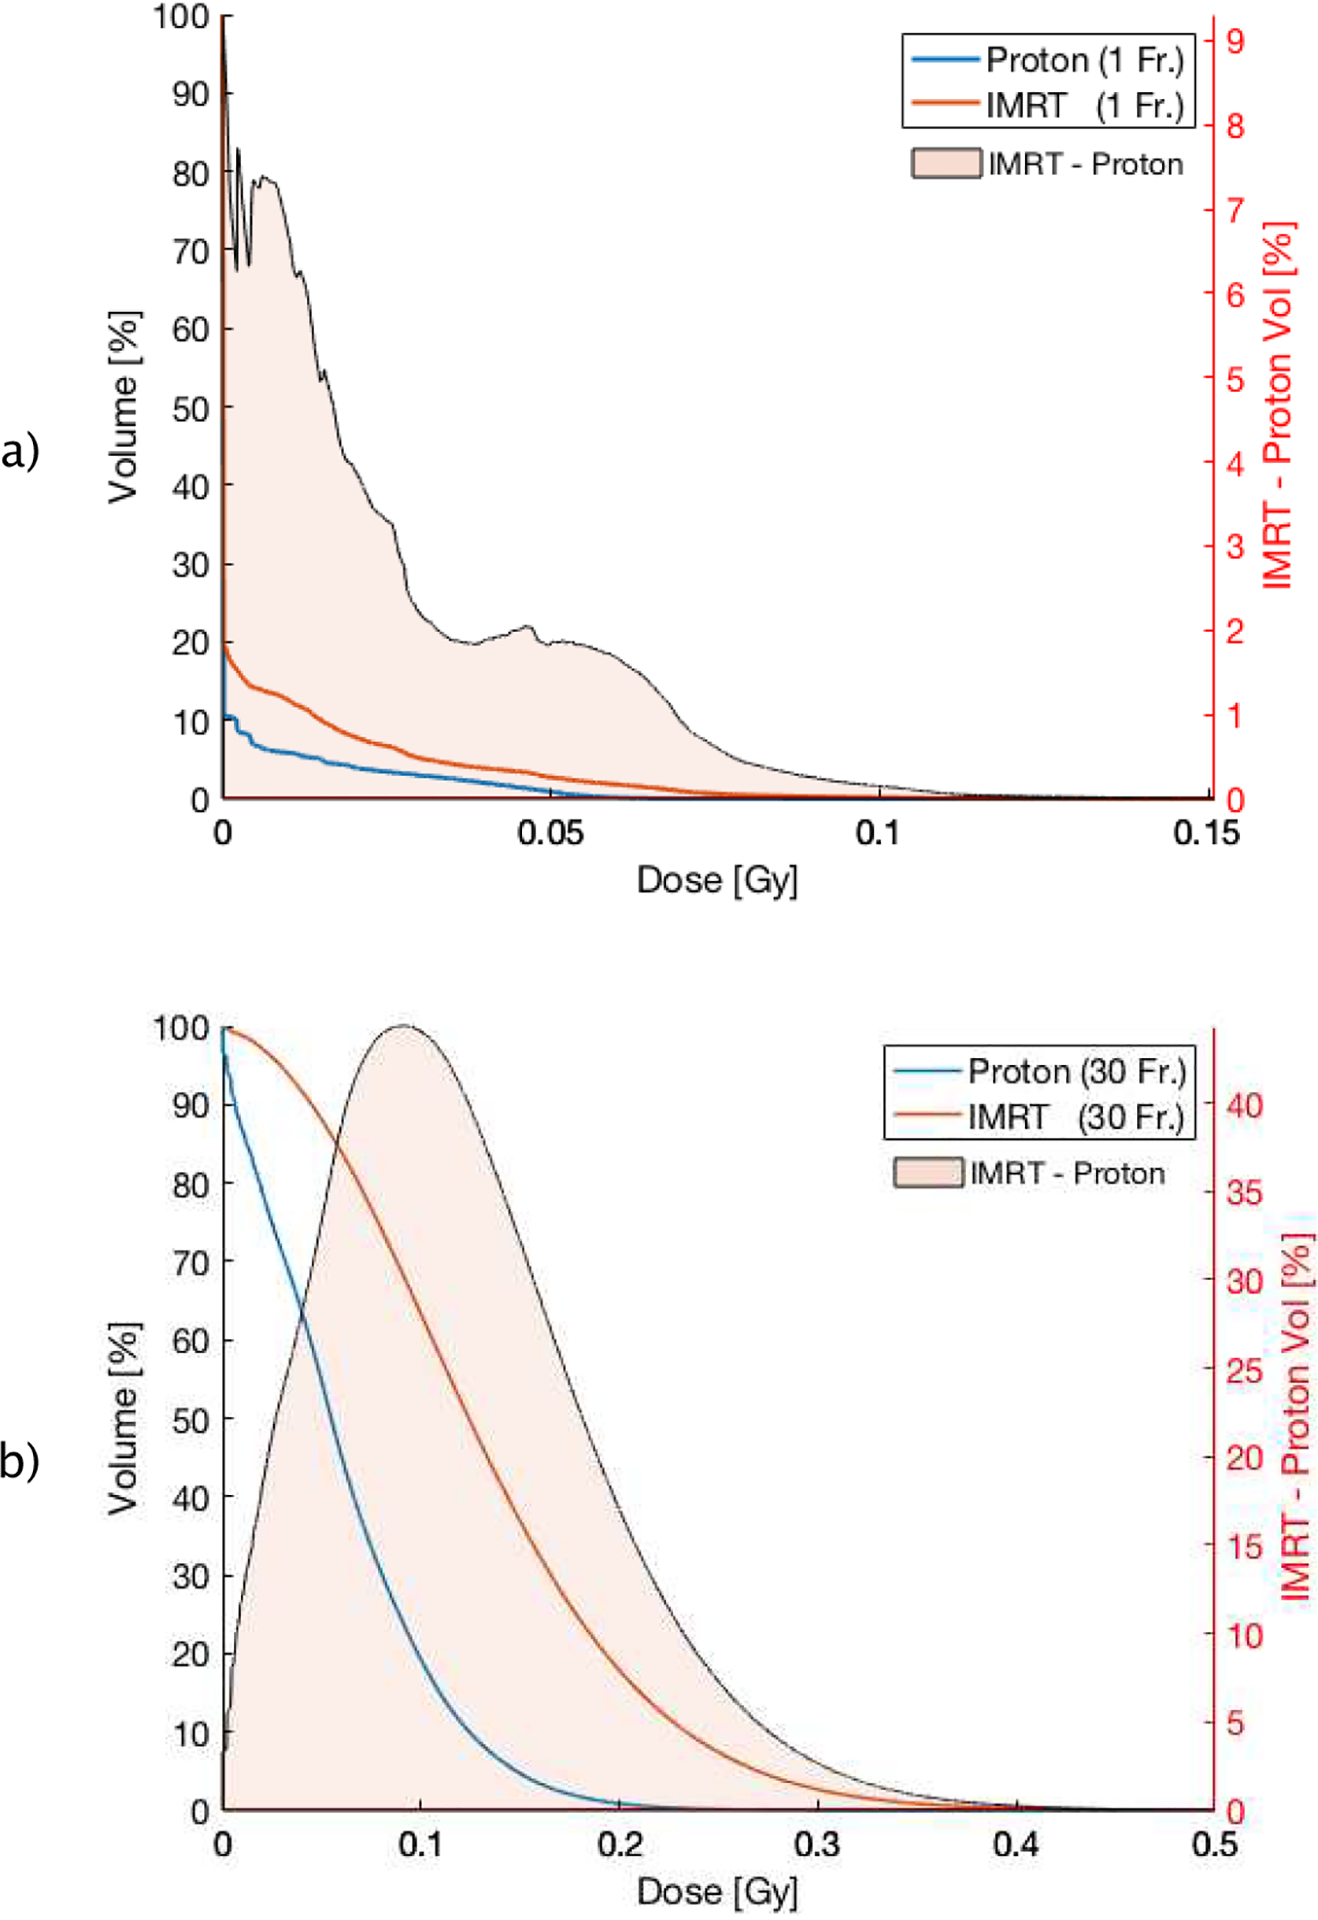
a) DVH (cut-off in dose range of [0 – 0.15 Gy]) of the circulating blood pool of proton (blue) and IMRT (orange) therapy after one fraction and after 30 fractions (b) in the range of [0 – 0.5 Gy]. The orange area corresponds to the differential DVH (IMRT minus proton therapy) for better illustration.
Table 1:
Summary of dosimetric parameters from Figure 8.
| FRACTION # | FR. = 1 | FR. = 30 | ||
|---|---|---|---|---|
| MODALITY | Proton | IMRT | Proton | IMRT |
| MEAN DOSE [GY] | 0.002 | 0.004 | 0.061 | 0.133 |
| MAX DOSE [GY] | 0.160 | 0.221 | 0.460 | 0.753 |
| D1% [GY] | 0.049 | 0.069 | 0.196 | 0.343 |
| D5% [GY] | 0.015 | 0.0310 | 0.148 | 0.267 |
The dosimetric difference after one fraction appears irregular, the difference after 30 fractions, however, becomes more symmetric due to constant mixing after each fraction, with an absolute volume difference of more than 44% in the 0.1 Gy region (see Figure 8 (b)). This difference is due to the lower integral dose inherent in the proton plan, as protons have a finite range in tissue and do not lead to the low-dose bath seen in Figure 4.
3.3. Effect of dose rate on dose received by circulating blood
Figure 9 (a/b) shows the DVHs of the circulating blood as a function of dose rate for both treatment modalities. As expected, changing the dose rate did not affect the mean dose to the blood pool. However, a marginal fluctuation of the resulting mean doses was observed due to the stochastic nature of the simulation. The standard deviation of the mean dose across dose rates is 6.25×10⁻⁴ Gy and 1.8×10⁻³ Gy for proton- and IMRT-based irradiation, respectively.
Figure 9:
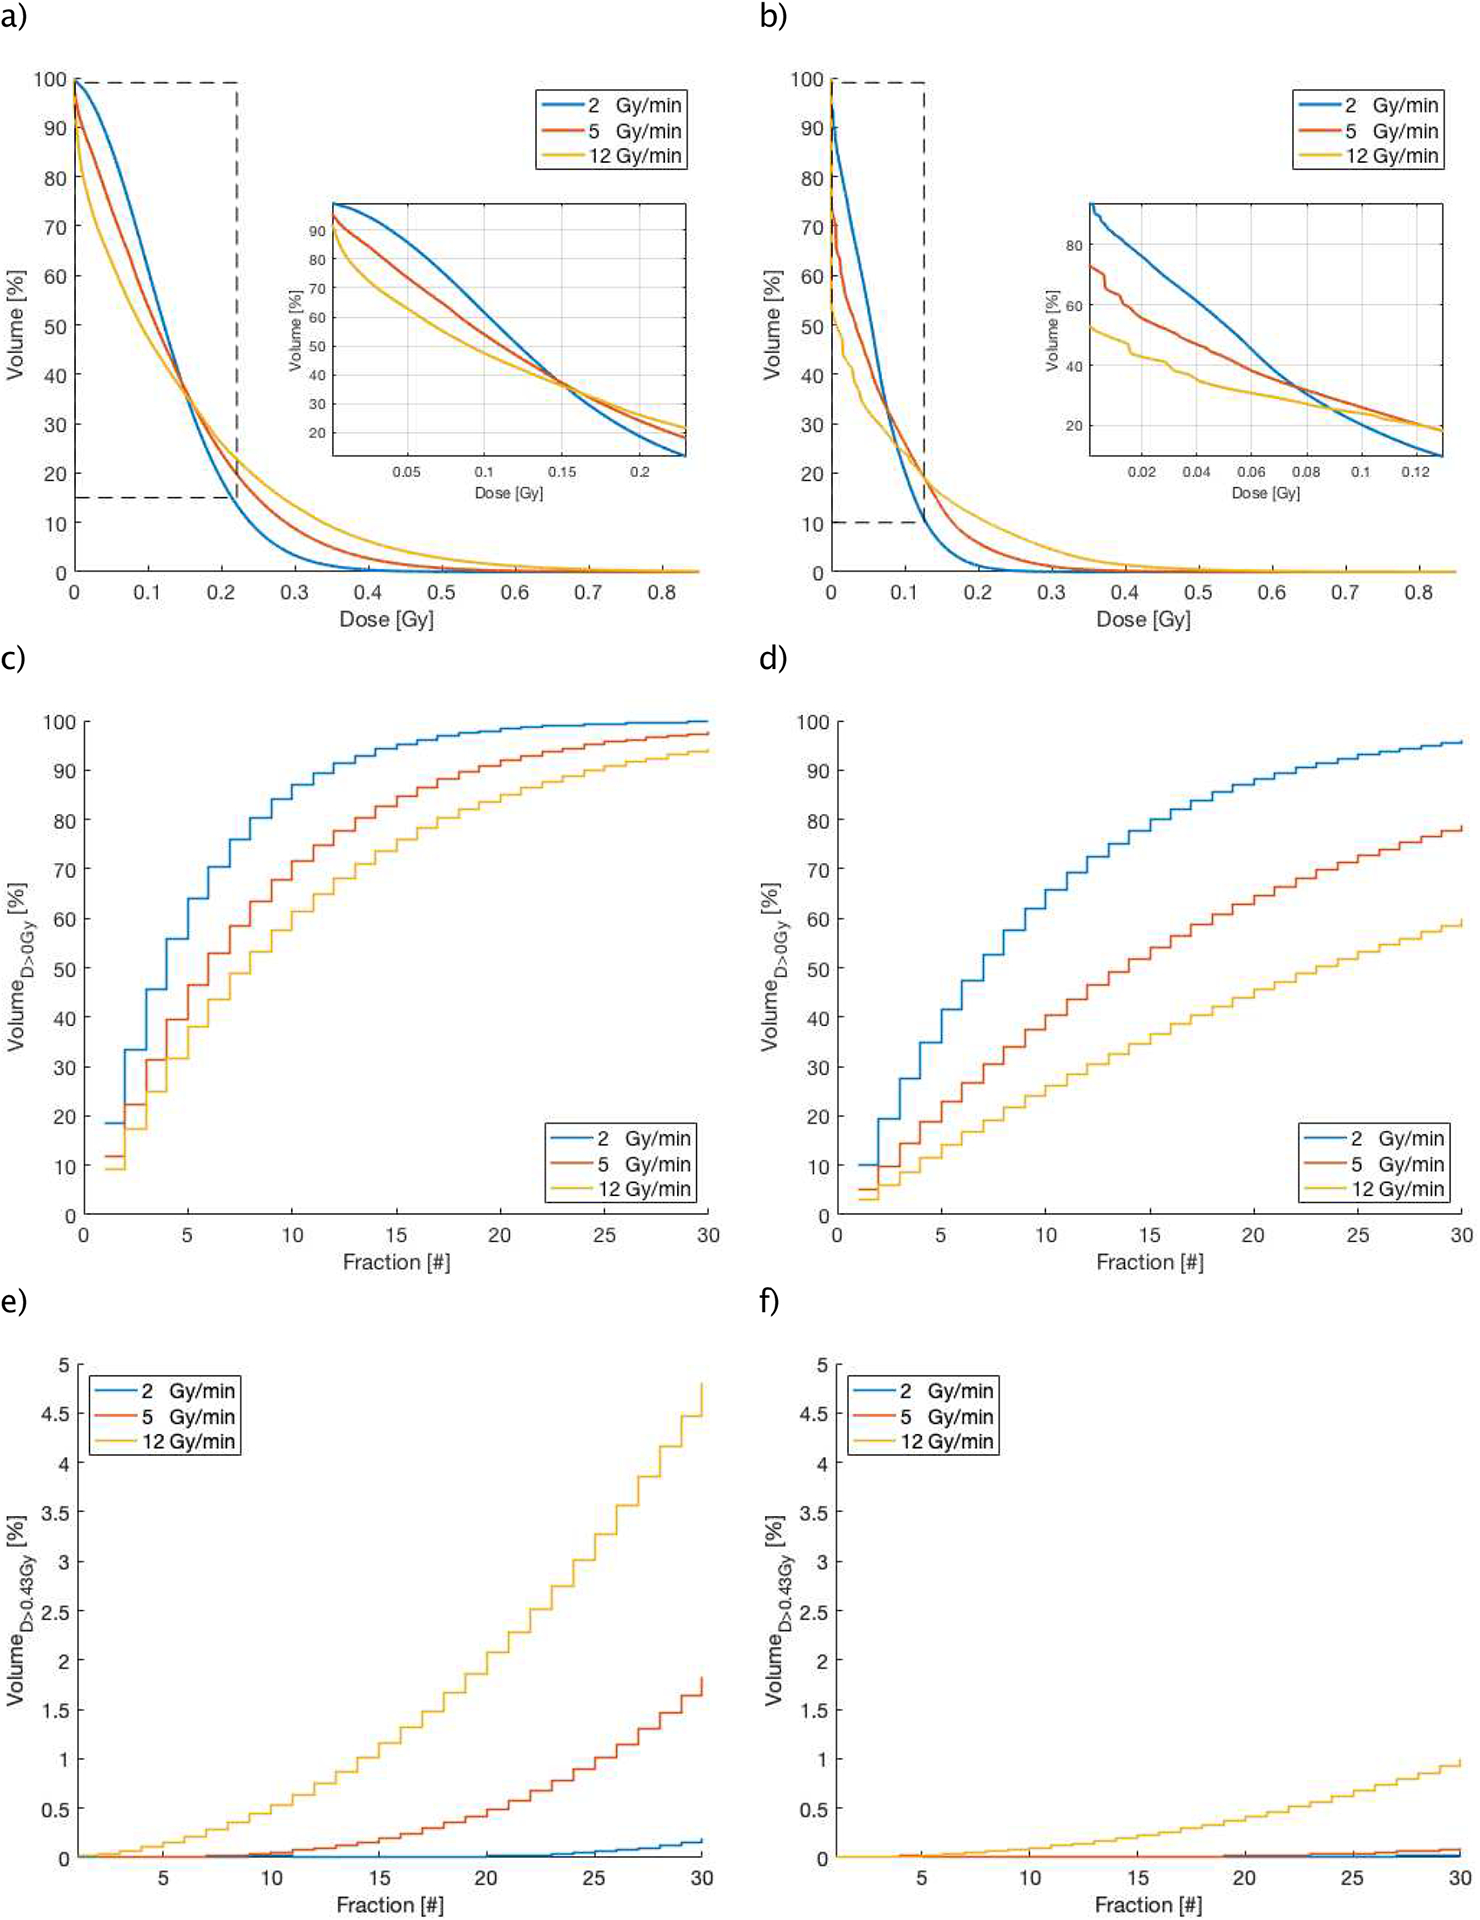
(a/b), Different DVHs (cut-off) for different dose rates (in Gy/min) for IMRT (a) and proton (b) techniques, (c/d) and (e/f), show the accumulated blood volume receiving a threshold dose as a function of the treatment fraction number, (c/d) represent the results of a non-zero threshold dose (D > 0 Gy) and (e/f), show the results of the accumulated high dose threshold of 0.43 Gy (CD8 lymphocytes) for IMRT (left) and proton (right) over the course of treatment.
Since the beam-on time is inversely correlated with the dose rate, increasing the dose rate results in an increase in the fraction of blood receiving high dose and reduces the volume receiving very low dose. Our model shows a narrow inflection region on the DVHs which defines this redistribution of dose. This redistribution is significant for lymphocyte depletion, as it matters how detrimental doses above and below this threshold are to lymphocytes. Further work combining this model with experimental data from patients treated with radiation is needed to clarify the relative importance of different dose levels.
Figure 9 (c/d) shows the accumulated blood volume receiving any dose >0 Gy over a fractionated treatment for different dose rates. After the first fraction and using a conventional dose rate of 2 Gy/min, 10.1% and 18.4% of the blood pool will be irradiated for proton and photon treatments, respectively. The BFM indicates that about 90% of the blood pool will be irradiated after the 11th fraction using IMRT, but only after 21st fraction with proton therapy. Reducing the treatment time, i.e. increasing the dose rate, can spare the circulating blood depending on dose level and treatment modality: for IMRT and doses >0 Gy, increasing the dose rate does not significantly decrease the fraction of blood that received >0 Gy at the end of 30 fractions, so 97.7% and 94.2% of the blood will get any dose using 5 Gy/min and 12 Gy/min (Figure 9 (c)). For proton therapy on the other hand, higher dose rates can also lead to less blood irradiated to >0 Gy: increasing the dose rate to 5 Gy/min and 12 Gy/min can reduce the fraction of blood receiving any dose from above 95% to 78.8% and then further to below 60%, respectively at the end of treatment (Figure 9 (d)).
Figure 9 (e) and (f), depict the evolution of the lymphocyte fraction accumulating a dose level greater than D>0.43 Gy for both modalities. It’s evident that increasing the dose rate leads to larger blood volumes receiving this dose level. The differences are extensive (Figure 9 (e/f)) for both treatment modalities, however proton therapy irradiates significantly less volume to these doses levels, by a factor 5 in comparison to IMRT.
3.4. Effect of physiological factors on dose received by circulating blood
As the hemodynamic parameters are patient specific, we investigated the effect of variation of physiological parameters (i.e. cardiac output, gender and age) on the dose received by the blood. For the cardiac output factor, we have considered a variation in the range of ± 30% from the average value, while for age, we have simulated adult, 15-year-old and 10-year-old patients. Figure 10 (a), depicts that high cardiac output results in an increase of the blood volume receiving low doses and a decrease of the blood volume receiving high doses, which is mainly due to the resulting higher flow rate and blood velocity. This shows that increased heart rate and the corresponding blood speed affect the received dose to the blood analogously to increasing the dose rate, though the changes are smaller.
Figure 10:
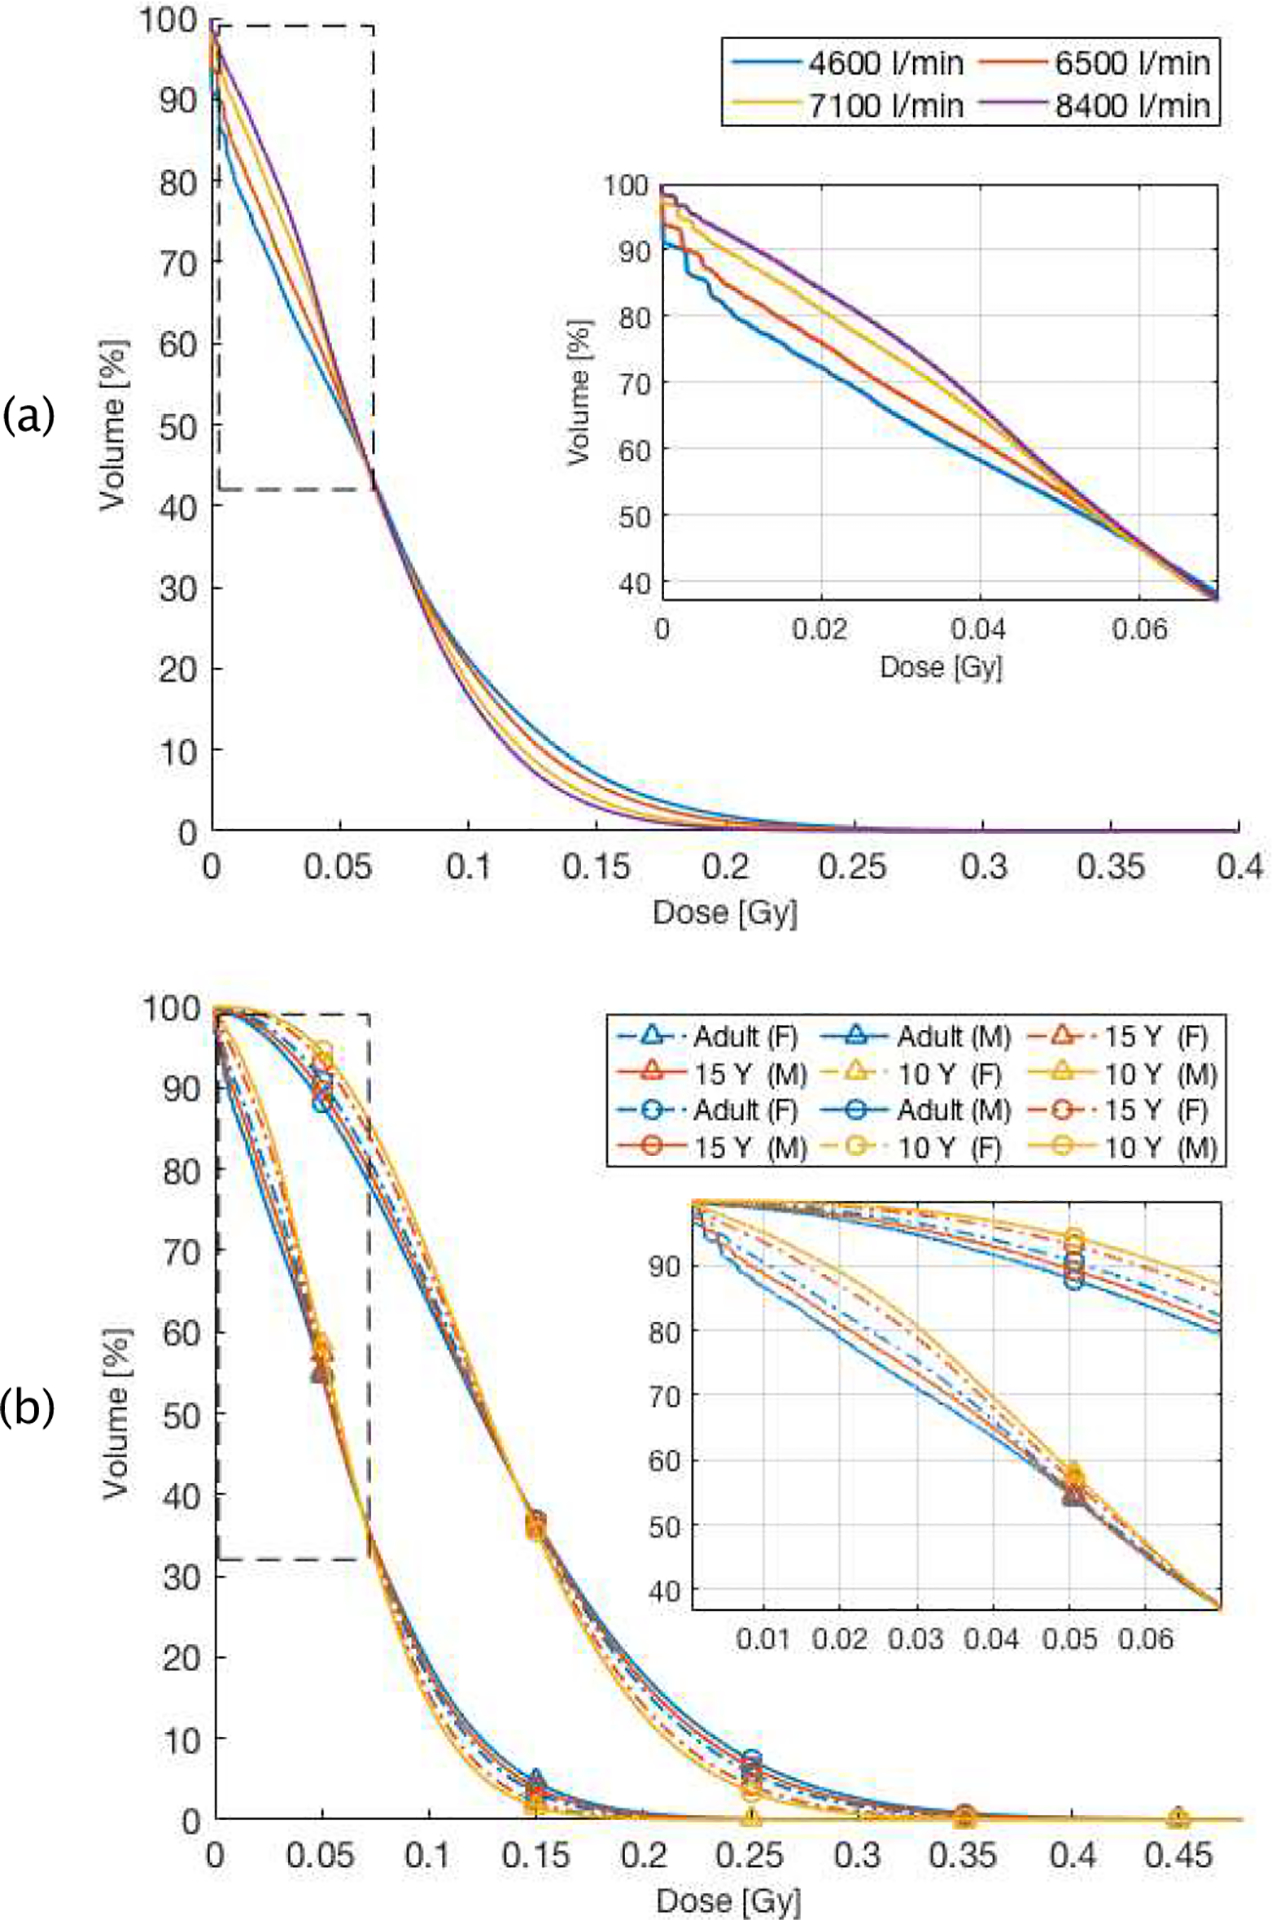
DVHs as a function of patient characteristics: a), cardiac output (litre per min) for proton therapy, the box is a zoom-in of the region enclosed by the dashed rectangle. b), Resulting DVH as a function of age and gender of patient in both treatment modalities. Triangles denote proton therapy, circles photon therapy, The box depicts a zoom-in of the region enclosed by the dashed rectangle.
Figure 10 (b) show the DVHs resulting from age and gender difference in the patient. There are small differences between male and female patients, up to 4.3% at low doses, mainly due to the variation of total blood volume (26%) and cardiac output (10%). This difference could increase when the target is located in other organs where the regional hemodynamic parameters differ between male and female patients (i.e. skeletal muscle, spleen and liver). Younger patients also show a larger volume, by up to 10%, of the circulating blood receiving low dose. This is independent of gender and treatment modality and due to a higher ratio of the cardiac output to the total body blood volume for younger ages.
4. DISCUSSION
The purpose of this study was to develop a model to investigate the accumulated physical radiation dose deposited in the entire circulating blood pool during the course of external radiation treatment for brain tumor patients, that can be matched to the CT of any patient under treatment. The results show how proton therapy and increased dose rates have the ability to reduce the volume of the irradiated blood. Further future studies are needed to investigate more state of art delivery techniques, such pencil beam scanning and VMAT.
Our IMRT results differ significantly from the reported values in Yovino’s work (Yovino, 2013). Beside the inherent disparities in the models discussed already in the introduction, other factors might contribute to this disagreement: The cardiac output to the brain, for which we used the values proposed by the ICRP89 report, differs between the models (12% in our case vs. 16% in Yovino’s work). As we derive other important variables, such as average blood speed, from this value, it is conceivable that this difference has significant effects on the resulting blood DVHs. Other factors related to target volume characteristics may also contribute to different dose estimations, such as location and volume of the target, which differ between the studies.
The purpose of estimating the dose to the circulating blood is to improve our understanding of the dose to the circulating lymphocytes. The circulating lymphocytes only present ~2–5% of the total lymphocyte population, while the majority of lymphocytes, are located in spleen and lymph nodes (Blum and Pabst, 2007). Our model does not include the complex dynamics of lymphocyte production and the migration between blood and other lymphocyte compartments, such as lymphatic vessels and spleen. However, in the case of intracranial irradiation the effect of radiation on non-circulating lymphocytes is small, as the amount of lymphatic tissue in the radiation field is limited. We can thus limit ourselves to the dose to circulating lymphocytes to assess the treatment effect.
Lymphocytes are one of the most radiation sensitive cells in the body (Panek et al., 2018). To calculate the lymphocyte depletion from our DVHs one would need accurate dose-response relationships, which are not considered in our study. Published in-vitro data on lymphocyte radiosensitivity show that D10, the dose required for 10% lymphocyte survival, is approximately 3.2 Gy (Nakamura et al., 1990), however it is unknown how much dose is required to functionally inactivate lymphocytes, which might require much lower doses. Connecting models such as ours to clinical data will enable us to answer these important questions and customize treatment delivery to achieve specific DVH properties that minimize lymphocyte depletion.
Most of the cerebral vasculature model used in this work were anatomy-based generic path lines, while only 6% were generated directly from vessel segmentation. The purpose of these simplified vasculatures was to ensure homogeneous intracranial blood flow but does not account for complex vascular architecture. The intracranial BFM assumes a constant flow velocity along the paths to guarantee the appropriate blood volume and flow rate through the brain. However, it is known that large arteries can have different flow velocities than venous drainage or perfusion through brain tissue, which is currently not taken into account. Further development based on more advanced imaging technique (i.e. 4D flow MRI) is required to evaluate the detailed hemodynamic of vasculature.
Our model does not explicitly consider the patient-specific altered tumor vasculature, which can be highly heterogeneous. As the entire tumor volume is covered with a homogeneous target dose, we think local deviations within that volume would only lead to minor deviations. In general, the blood flow rate in a tumor is limited by the resistance of the heterogeneous network leading to a lower blood velocity; the blood pressure gradient in tumors can be up to 50% lower compared to normal tissues (Lee et al., 2006). In principle, this lower blood speed could be taken into account and even the detailed vasculature in the tumor region could be included if patient-specific, high-resolution MRI data were available.
We have tested the code for robustness towards stochastic fluctuations by varying the offset to delivery start and conclude that our model is stable using the current number of particles for the parameters explored in this investigation. Using 22.17×10⁶ BP, the blood DVH for one single fraction (three fields) takes 6 min to calculate. However, for very high delivery speeds it might be necessary to increase the number of particles simulated explicitly in the brain to reduce stochastic variations, requiring longer calculation times and more memory.
5. Conclusion
We have presented a whole-body blood flow model with explicit blood particle tracking in the brain to estimate the dose to the circulating blood during the course of radiation therapy. Furthermore, we have investigated how different dose distributions, delivery and physiological parameters could impact the dose received by the blood pool during fractionated radiation therapy. Investigating different delivery parameters and how they affect the dose to the circulating lymphocytes will allow us to better understand radiation-induced lymphopenia and could open the door to optimizing and tailoring the delivery to reduce lymphocyte depletion.
Works Cited
- Absinta M, Ha SK, Nair G, Sati P, Luciano NJ, Palisoc M, Louveau A, Zaghloul KA, Pittaluga S, Kipnis J, Reich DS. (2017). Human and nonhuman primate meninges harbor lymphatic vessels that can be visualized noninvasively by MRI. Elife, DOI: 10.7554/eLife.29738. [DOI] [PMC free article] [PubMed] [Google Scholar]
- Basler L, Andratschke N, Ehrbar S, Guckenberger M, Tanadini-Lang S. (2018). Modelling the immunosuppressive effect of liver SBRT by simulating the dose to circulating lymphocytes: an in-silico planning study. Radiation Oncology 13, 1–8. [DOI] [PMC free article] [PubMed] [Google Scholar]
- Blum KS, Pabst R. (2007). Lymphocyte numbers and subsets in the human blood Do they mirror the situation in all organs? Immunology Letters 108, 45–51. [DOI] [PubMed] [Google Scholar]
- Bremnes RM, Al-Shibli K, Donnem T, Sirera R, Al-Saad S, Andersen S, Stenvold H, Camps C, Busund LT. (2011). The Role of Tumor-Infiltrating Immune Cells and Chronic Inflammation at the Tumor Site on Cancer Development, Progression, and Prognosis: Emphasis on Non-small Cell Lung Cancer. Thorac Oncol. 6, 824–833. [DOI] [PubMed] [Google Scholar]
- Campian JL, Ye X, Brock M, Grossman SA. (2013). Treatment-related lymphopenia in patients with stage III non-small-cell lung cancer. Cancer Invest. 31, 183–8. doi: 10.3109/07357907.2013.767342. [DOI] [PMC free article] [PubMed] [Google Scholar]
- Davuluri R, Jiang W, Fang P, Xu C, Komaki R, Gomez DR, Welsh J, Cox JD, Crane CH, Hsu CC, Lin SH. (2017). Lymphocyte Nadir and Esophageal Cancer Survival Outcomes After Chemoradiation Therapy. International Journal of Radiation Oncology, Biology, Physics; 99, 128–135. 10.1016/j.ijrobp.2017.05.037. [DOI] [PubMed] [Google Scholar]
- Dieci MV, Mathieu MC, Guarneri V Conte P, Delaloge S, Andre F, Goubar A. (2015). Prognostic and predictive value of tumor-infiltrating lymphocytes in two phase III randomized adjuvant breast cancer trials. Ann Oncol; 26, 1698–704. [DOI] [PMC free article] [PubMed] [Google Scholar]
- Fogar P, Sperti C, Basso D, Sanzari MC, Greco E, Davoli C, Navaglia F, Zambon CF, Pasquali C, Venza E, Pedrazzoli S, Plebani M. (2006). Decreased total lymphocyte counts in pancreatic cancer: an index of adverse outcome. Pancreas; 32, 22–28. [DOI] [PubMed] [Google Scholar]
- Grassberger C, Ellsworth SG, Wilks MQ, Keane FK, Loeffler JS. (2019). Assessing the interactions between radiotherapy and antitumour immunity. Nature reviews. Clinical oncology. [DOI] [PubMed] [Google Scholar]
- Grinberg L, Insley J, Morozov V, Papka M, Em Karniadakis G, Fedosov D and Kumaran K (2011). A new computational paradigm in multiscale simulations: Application to brain blood flow. 2011 International Conference for High Performance Computing, Networking, Storage and Analysis (pp. 1–12). Washington: IEEE, 2011. [Google Scholar]
- Grossman SA, Ye X, Lesser G, Sloan A, Carraway H, Desideri S, Piantadosi S. (2011). Immunosuppression in patients with high-grade gliomas treated with radiation and temozolomide. Clin Cancer Res. 17, 1078–0432 doi: 10.1158/1078-0432.CCR-11-0774. [DOI] [PMC free article] [PubMed] [Google Scholar]
- Hughes MA, Parisi M, Grossman S, Kleinberg L. (2005). Primary brain tumors treated with steroids and radiotherapy: low CD4 counts and risk of infection. Int J Radiat Oncol Biol Phys. 62(5), 1423–6. [DOI] [PubMed] [Google Scholar]
- ICRP23. (1975). Report of the Task Group on Reference Man. Oxford: ICRP Publication; 23, Pergamon Press. [Google Scholar]
- ICRP89. (2002). Basic Anatomical and Physiological Data for Use in Radiological Protection Reference Values. Ann. ICRP 32 (3–4): ICRP Publication 89. [PubMed] [Google Scholar]
- Janssen I, Heymsfield SB, Wang ZM, Ross R. (2000). Skeletal muscle mass and distribution in 468 men and and women aged 18–88 yr. J Appl Physiol; 89, 81–8. [DOI] [PubMed] [Google Scholar]
- Kikinis R, Pieper SD, Vosburgh K. (2014). 3D Slicer: a platform for subject-specific image analysis, visualization, and clinical support. Intraoperative Imaging Image-Guided Therapy. Jolesz Ferenc A., Editor; 3, 277–289 ISBN: 978-1-4614-7656-6. [Google Scholar]
- Ladbury CJ, Rusthoven CG, Camidge DR, Kavanagh BD, Nath SK. (2019). Impact of Radiation Dose to the Host Immune System on Tumor Control and Survival for Stage III Non-Small Cell Lung Cancer Treated with Definitive Radiation Therapy. International Journal of Radiation Oncology, Biology, Physics, 10.1016/j.ijrobp.2019.05.064. [DOI] [PubMed] [Google Scholar]
- Lee DS, Rieger H, Bartha K. (2006). Flow Correlated Percolation during Vascular Remodeling in Growing Tumors. Physical Review Letters; 96, 058–104. [DOI] [PubMed] [Google Scholar]
- Lee TC, Kashyap RL, Chu CN. (1994). Building SkeletonModels via 3-DMedial Surface/Axis Thinning Algorithms. Graph. Models Image Process. Graph. Models Image Process; 56, 462–478. [Google Scholar]
- Loi S, Sirtaine N, Piette F, Salgado R, Viale G, Van Eenoo F, Rouas G, Francis P, Crown JP, Hitre E, de Azambuja E, Quinaux E, Di Leo A, Michiels S, Piccart MJ, Sotiriou C. (2013). Prognostic and predictive value of tumor-infiltrating lymphocytes in a phase III randomized adjuvant breast cancer trial in node-positive breast cancer comparing the addition of docetaxel to doxorubicin with doxorubicin-based chemotherapy. J Clin Oncol; 31, 860–7. doi: 10.1200/JCO.2011.41.0902. [DOI] [PubMed] [Google Scholar]
- MacLennan IC and Kay HE. (1978). Analysis of treatment in childhood leukemia. IV. The critical association between dose fractionation and immunosuppression induced by cranial irradiation. Cancer; 41, 108–111. [DOI] [PubMed] [Google Scholar]
- Nakamura N, Kusunoki Y, Akiyama M. (1990). Radiosensitivity of CD4 or CD8 Positive Human T-Lymphocytes by an in Vitro Colony Formation Assay. Radiat Res; 123, 224–7. [PubMed] [Google Scholar]
- Nylin G and Celander H. (1950). Determination of blood volume in the heart and lungs and the cardiac output through the injection of radiophosphorus. Circulation, 76–83. 10.1161/01.CIR.1.1.76. [DOI] [PubMed] [Google Scholar]
- Panek A, Miszczyk J, Swakon J. (2018). Biological effects and inter-individual variability in peripheral blood lymphocytes of healthy donors exposed to 60 MeV proton radiotherapeutic beam. Int J Radiat Biol; 94, 1–10. [DOI] [PubMed] [Google Scholar]
- Perdikaris P, Grinberg L, and Em Karniadakis G. (2016). Multiscale modeling and simulation of brain blood flow. Physics of Fluids 28(2): 021304, doi: 10.1063/1.4941315. [DOI] [PMC free article] [PubMed] [Google Scholar]
- Popanda O, Ebbeler R, Twardella D, Helmbold I, Gotzes F, Schmezer P, Thielmann HW, von Fournier D, Haase W, Sautter-Bihl ML, Wenz F, Bartsch H, Chang-Claude J. (2003). Radiation-induced DNA damage and repair in lymphocytes from breast cancer patients and their correlation with acute skin reactions to radiotherapy. Int J Radiat Oncol Biol Phys; 55, 1216–25. [DOI] [PubMed] [Google Scholar]
- Sellins KS and Cohen JJ. (1987). Gene induction by gamma-irradiation leads to DNA fragmentation in lymphocytes. J Immunol. 139, 3199–206. [PubMed] [Google Scholar]
- Westermann J and Pabst R. (1992). Distribution of lymphocyte subsets and natural killer cells in the human body. Clin Investig; 70, 539–44. [DOI] [PubMed] [Google Scholar]
- Wild AT, Ye X, Ellsworth SG, Smith JA, Narang AK, Garg T, Campian J, Laheru DA, Zheng L, Wolfgang CL, Tran PT, Grossman SA, Herman JM. (2015). The Association Between Chemoradiation-related Lymphopenia and Clinical Outcomes in Patients With Locally Advanced Pancreatic Adenocarcinoma. Am J Clin Oncol. 38, 259–65. doi: 10.1097/COC.0b013e3182940ff9. [DOI] [PMC free article] [PubMed] [Google Scholar]
- Yovino S, K. L (2013). The etiology of treatmentrelated lymphopenia in patients with malignant gliomas: modeling radiation dose to circulating lymphocytes explains clinical observations and suggests methods of modifying the impact of radiation on immune cells. Cancer Invest, 140–144. [DOI] [PMC free article] [PubMed] [Google Scholar]
- Yovino S, Kleinberg LR, Grossman SA. (2013). The etiology of treatmentrelated lymphopenia in patients with malignant gliomas: modeling radiation dose to circulating lymphocytes explains clinical observations and suggests methods of modifying the impact of radiation on immune cells. Cancer Invest; 31, 140–144. [DOI] [PMC free article] [PubMed] [Google Scholar]


