Abstract
Self-incompatibility (SI) is conserved among members of the Brassicaceae plant family. This trait is controlled epigenetically by the dominance hierarchy of the male determinant alleles. We previously demonstrated that a single small RNA (sRNA) gene is sufficient to control the linear dominance hierarchy in Brassica rapa and proposed a model in which a homology-based interaction between sRNAs and target sites controls the complicated dominance hierarchy of male SI determinants. In Arabidopsis halleri, male dominance hierarchy is reported to have arisen from multiple networks of sRNA target gains and losses. Despite these findings, it remains unknown whether the molecular mechanism underlying the dominance hierarchy is conserved among Brassicaceae. Here, we identified sRNAs and their target sites that can explain the linear dominance hierarchy of Arabidopsis lyrata, a species closely related to A. halleri. We tested the model that we established in Brassica to explain the linear dominance hierarchy in A. lyrata. Our results suggest that the dominance hierarchy of A. lyrata is also controlled by a homology-based interaction between sRNAs and their targets.
Keywords: dominance hierarchy, self-incompatibility, epigenetics, small RNA, Brassicaceae, Arabidopsis lyrata
1. Introduction
Almost half of all angiosperms have a self-incompatibility (SI) system to avoid self-fertilization which helps maintain genetic diversity within the species. Most Brassicaceae plants, including Arabidopsis lyrata, have SI systems ensuring that the plants’ sporophytic stigmas reject their own pollen grains. This SI reaction is genetically controlled by a single multiallelic locus called the S locus, which contains the pollen and stigma determinant genes S-LOCUS PROTEIN 11 (SP11, also called SCR) [1,2,3] and S-LOCUS RECEPTOR KINASE (SRK) [4,5], respectively. The SI reaction in Brassica rapa is caused by the S haplotype-specific direct interaction between SP11 and SRK in the stigma epidermis [6,7]. These two genes are conserved in members of the Brassicaceae family, such as Brassica oleracea [4], A. lyrata [8], and Arabidopsis halleri [9].
B. rapa has a complicated dominance hierarchy among SP11 alleles, which are expressed sporophytically in anther tapetum cells. Based on analysis of pollen phenotypes, class I (S8, S9, S52, S12) SP11 alleles are dominant over class-II alleles (S44, S60, S40, S29) [10]. In addition, class-II alleles follow a linear dominance hierarchy: S44 > S60 > S40 > S29 [10]. This complex hierarchy is controlled by interactions between just two sRNAs, SP11 methylation inducer (Smi) and Smi2, and their targets [11,12]. These sRNAs derive from inverted repeat sequences and silence the relatively recessive SP11 allele by inducing de novo DNA methylation of its promoter region [12,13]. Smi determines the dominance–recessivity relationships between class-I and class-II SP11 alleles, and Smi2 determines the linear relationships among the four class-II SP11 alleles in a fashion dependent on the nucleotide sequences of the alleles. In particular, Smi2 and its targets contain polymorphisms to control these complex linear relationships. Thus, we previously proposed a model in which interactions between sRNAs and targets based on sequence similarity control the complicated linear dominance hierarchy of male SI determinants [12].
Compared with cultivated B. rapa, A. halleri, a wild Brassicaceae species closely related to Arabidopsis thaliana, exhibits a more divergent hierarchical pollen dominance: (S20, S13) > S12 > S4 > S3 > S1 [14]. A model describing how this male dominance hierarchy arose from multiple networks of sRNA target gains and losses has been proposed [9]. In addition, whether dominant S alleles carry a larger set of sRNAs, or whether a larger set of sRNA targets are carried by recessive S alleles, has been investigated [9].
A. lyrata also exhibits a complex pollen side dominance hierarchy among S haplotypes: class A2 (S39, S20, S50) > class A3 (S13, S16) > class B (S18, S14) > class A1 (S1) [14,15,16,17,18]. However, the mechanism underlying this dominance hierarchy, including whether it involves sRNA(s), was unknown. Here, we identified sRNAs controlling the linear dominance hierarchy in A. lyrata, and we propose a homology-dependent model to explain the dominance–recessivity interaction of SP11 in A. lyrata.
2. Results
2.1. Analysis of the Dominance–Recessivity Hierarchy of the SP11 Alleles
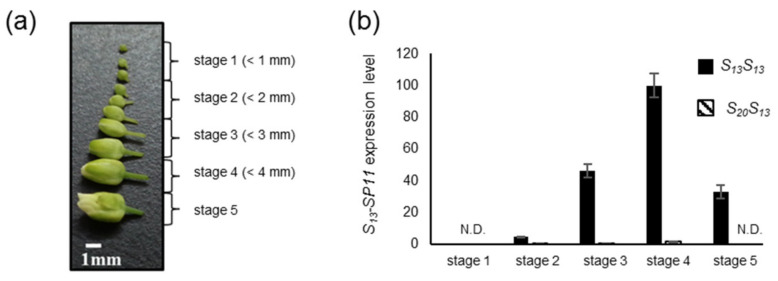
A. lyrata exhibits a male side dominance hierarchy of S haplotypes, comprising class A2 (S39, S20, S50) > class A3 (S13, S16) > class B (S18, S14) > class A1 (S1) [14,15,16,17,18]. Here, for simplicity, we renamed these classes as follows: class IV (S20, S39, S50) > class III (S13, S16) > class II (S18, S14) > class I (S1). We focused on the dominance–recessivity relationship between S20-SP11 (class IV) and S13-SP11 (class III) (S20 > S13) because the only previously reported data about such relationships in A. lyrata pollen was that the expression of S13-SP11 is reduced in a S20S13 heterozygote, as revealed by gel blot analysis and in situ hybridization [19]. First, we analyzed SP11 expression in anthers from both S13S13 homozygous and S20S13 heterozygous plants at different stages of development. Developing buds were divided into five stages based on size (Figure 1a). Reverse transcription quantitative real-time PCR (RT-qPCR) analysis showed that S13-SP11 transcripts started to accumulate at stage 2 (bud size: 1–2 mm) and showed maximum expression at stage 4 (bud size: 3–4 mm) in S13S13 homozygotes (Figure 1b). Similarly, in a previous study, RNA gel blot analysis revealed that SP11 expression in B. rapa anthers reaches a maximum before flower opening, when tapetum cells are intact [3]. In contrast, we found that S13-SP11 transcript accumulation in S20S13 heterozygotes was strongly suppressed (to approximately 1%) compared with that in S13S13 homozygotes (Figure 1b), suggesting that S20-SP11 is dominant over S13-SP11. This result is consistent with previously reported pollen phenotype data [14] and gel blot analysis of S13-SP11 in S20S13 heterozygotes [8]. Therefore, we focused on the molecular mechanism of the dominance–recessivity relationship among these S haplotypes.
Figure 1.
S13-SP11 expression in anthers during each stage of development and dominance–recessivity relationship between the S20 and S13 haplotypes. (a) Developmental stages of Arabidopsis lyrata anthers: stage 1, <1 mm; stage 2, <2 mm; stage 3, <3 mm; stage 4, <4 mm; stage 5, the day before flowering. (b) RT-qPCR analysis of S13-SP11 expression in S13S13 homozygotes and S13S20 heterozygotes. Elf1α was used as an endogenous reference gene. The results shown are means ± s.d. of 3 replicates. N.D., not detected.
2.2. Identification of sRNA and Its Precursor Genes in Class-IV S Haplotypes
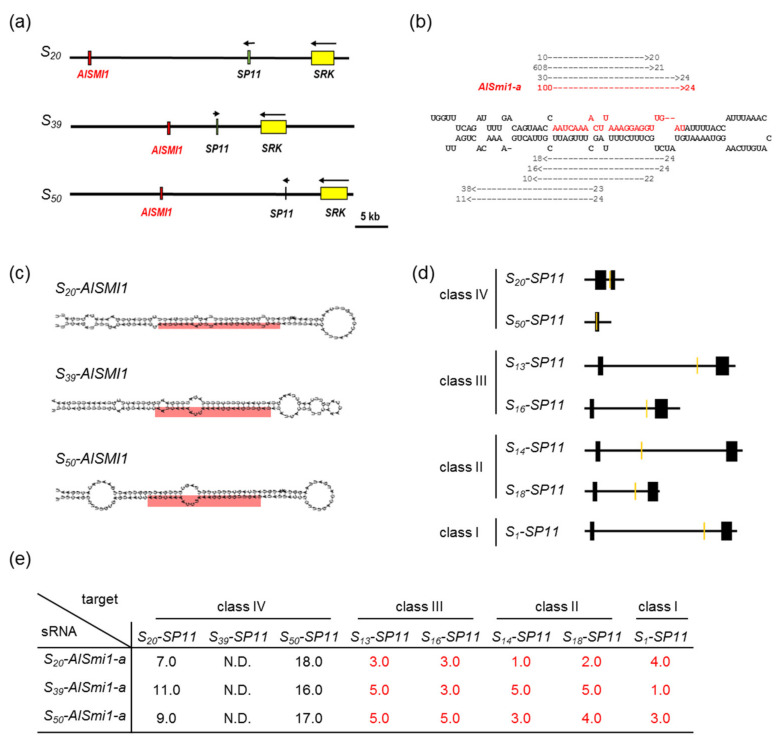
To identify sRNA candidates controlling the dominance–recessivity relationships between S20-SP11 and S13-SP11, we performed in silico analysis of the S-locus genomic sequences of the S20 haplotype. The aim was to identify sRNA candidate genes sharing high similarity with S13-SP11 between the region 500 base pairs (bp) upstream from its translational initiation site and 500 bp downstream from its termination codon. We identified an inverted repeat sequence that we named Arabidopsis lyrata SMI1 (AlSMI1) (Figure 2a), which shares high similarity with the S13-SP11 intron region. AlSMI1 is located 27.5 kbp downstream from S20-SP11 and approximately 37 kbp from S20-SRK. We detected inverted repeat sequences similar to that of S20-AlSMI1 in both the S39 and S50 haplotypes (class IV) (Figure 2a).
Figure 2.
Identification of candidate sRNAs controlling the dominance–recessivity relationships: class IV > (class III, class II, class I). (a) Schematic diagrams of the S locus in the S20 haplotype (HQ379628), S39 haplotype (KJ772418–KJ772419), and S50 haplotype (HQ379631). Green, yellow, and red boxes indicate SP11, SRK, and AlSMI1, respectively. (b) Massively parallel sequencing analysis of sRNA expression from the AlSMI1 inverted repeat sequence. sRNAs that obtained at least 10 reads were mapped against the AlSMI1 inverted repeat sequence. Arrows indicate mapped sRNAs and their directions. Numbers at the tips of arrows indicate the number of obtained sRNA reads, and numbers at the ends of arrows indicate the length of each sRNA (in nucleotides). Bases in red represent the 24-nt AlSmi1-a region. (c) Stem-loop structures of AlSMI1 of the S20, S39, and S50 haplotypes predicted by RNAfold [20]. The predicted mature 24-nt AlSmi1-a region is shown in red. (d) Schematic diagrams of the S20, S50, S13, S16, S14, S18, and S1-SP11 genomic regions. Black boxes indicate exon regions of SP11 genes, orange boxes indicate regions with high sequence similarity to AlSmi1-a. (e) Sequence similarity between AlSmi1-a and SP11. Each number shows the mispair score between the class IV (S20, S39, S50)-AlSmi1-a and the SP11 introns of class-IV, class-III, class-II, and class-I S haplotypes. N.D., not detected. Mispair scores < 5.5 are shown in red.
We performed massively parallel sequencing to determine whether a 24-nucleotide (nt) sRNA is processed from S20-AlSMI1 prior to S13-SP11 expression. Since S13-SP11 expression begins at stage 2 (Figure 1b), we analyzed sRNA from stage 1 and 2 anthers of S20S13 heterozygotes and obtained 44,553,252 sRNA sequence reads. We identified 100 reads of the 24-nt sRNA AlSmi1-a (Figure 2b, Supplementary Table S1), which were processed from the S20-AlSMI1 precursor. RNAfold [20] predicted that S20-AlSMI1, S39-AlSMI1, and S50-AlSMI1 have hairpin-structured precursors (Figure 2c). We detected AlSmi1-a in the stem regions of S20-AlSMI1, S50-AlSMI1, and S39-AlSMI1 (Figure 2c; Supplementary Figure S1).
We also analyzed other S-locus genomic sequences of the S16 (class III), S14 and S18 (class II), and S1 (class I) haplotypes, which are recessive to the S20 haplotype in the pollen dominance hierarchy. We searched the sequences of the S16-, S18-, S14-, and S1-SP11 genes ±500 bp and determined that only the AlSMI1-a region in the S locus of the S20 haplotype shares high similarity with these SP11 genes (Figure 2d; Supplementary Figures S1 and S2).
To evaluate the activity of AlSmi1-a, we calculated mispair scores [21] between the sRNA and S13-SP11. Although the mispair score system was originally developed to predict whether a 21-nt microRNA (miRNA) cuts its target, it also efficiently predicted the 24-nt Smi and Smi2 targets [12]. Mispair scores represent the number of mismatches of the complementary sites between an sRNA and its target, thus, high complementarity between an sRNA and its target leads to a lower mispair score. In our previous study, the SI phenotypes were not observed in transgenic B. rapa plants expressing Smi/Smi2 with high sequence similarity with their own SP11 (mispair scores ≤ 5.5), exhibiting DNA methylation at SP11 and its silencing [11,12]. On the other hand, transgenic B. rapa plants expressing Smi2 showing low similarity with their own SP11 (mispair scores ≥ 6.5), exhibited unchanged SI phenotypes [12]. Therefore, the mispair scores between dominant Smi or Smi2 and the target sites of recessive SP11 were ≤5.5. Here, S20-AlSmi1-a had a mispair score of <3.0 against the class-III SP11 intron, <2.0 against the class-II SP11 intron, and 4.0 against the class-I SP11 intron (Figure 2e; Supplementary Figure S2). Both S39-AlSmi1-a and S50-AlSmi1-a had mispair scores of <5.0 against the SP11 intron regions of all recessive S haplotypes (Figure 2e; Supplementary Figure S2), suggesting that AlSmi1-a potentially targets SP11 in all recessive S haplotypes with the same dominance relationship: class IV > (class III, class II, class I). On the other hand, although class-IV S haplotypes (S20, S50) had target sites for AlSmi1-a (Figure 2d, Supplementary Figure S2), all AlSmi1-a sequences had mispair scores > 7.0 against these target sites (Figure 2e; Supplementary Figure S2).
Based on these results, we suggest that AlSmi1-a is the only sRNA controlling the class IV > (class III, class II, class I) dominance hierarchy. On the other hand, AlSMI1 genes are also conserved in class-III and class-II S locus with polymorphisms (Supplementary Figure S1).
2.3. Identification of sRNA and Its Precursor Genes in Class-II S Haplotypes
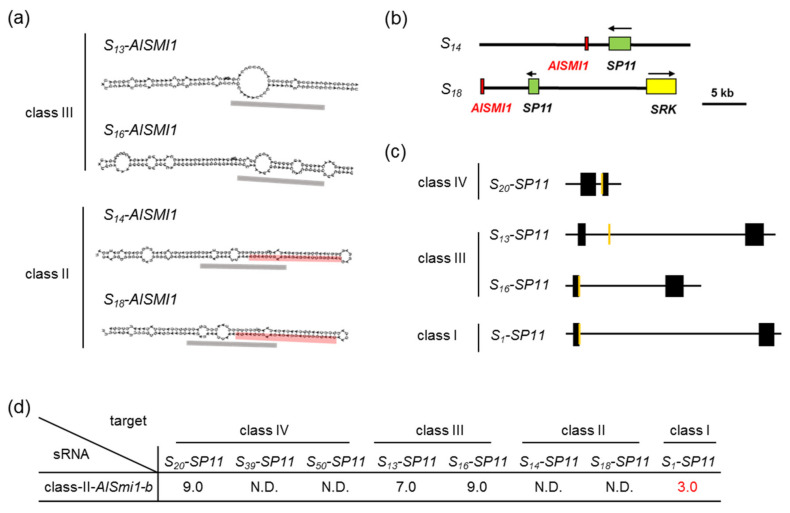
Next, we focused on the sequence polymorphisms of AlSMI1 among class-III and class-II S haplotypes. AlSMI1 genes from the S13 and S16 haplotypes (class III) and the S18 and S14 haplotypes (class II) have similar inverted repeat structures. However, the 24-nt S20-AlSmi1-a sequence is not conserved among either class-III or class-II S haplotypes (Figure 3a; Supplementary Figure S1). To analyze whether AlSmi1 is processed in class-III S haplotypes, we mapped reads obtained by the massively parallel sequencing of S20S13 against the S13-AlSMI1 inverted repeat sequence. No reads were mapped onto the S13-AlSMI1 precursor. These results suggest that S13-AlSMI1 is not processed into 24-nt sRNAs and that AlSMI1 is not functional in this class-III S haplotype (Figure 3a).
Figure 3.
Identification of sRNAs controlling the dominance–recessivity relationships: class II > class I. (a) Stem-loop structures of the S13, S16, S14, and S18 haplotypes of AlSMI1 predicted by RNAfold [20]. Black dashed boxes indicate 24-nt snRNAs corresponding to class-III and class-II AlSmi1-a. The predicted 24-nt mature AlSmi1-b is shown in red. (b) Schematic diagrams of the S locus in the S14 haplotype (KJ772406) and S18 haplotype (KJ772412). Green, yellow, and red boxes indicate SP11, SRK, and AlSMI1, respectively. (c) Schematic diagrams of the SP11 genomic regions of the S20, S13, S16, and S1 haplotypes. Black boxes indicate exon regions of SP11, orange boxes indicate the target regions homologous to AlSmi1-b. (d) Sequence similarity between AlSmi1-b and SP11. Numbers are the mispair scores between class-II AlSmi1-b and class-IV, class-III, class-II, and class-I S haplotypes of SP11. N.D., not detected. Mispair scores < 5.5 are shown in red.
Interestingly, S18 and S14-AlSMI1 (class II) contain another 24-nt sequence (AlSmi1-b) that shares high similarity with a relatively recessive S1-SP11 (class I) exon junction (mispair score 3.0) (Figure 3a–d; Supplementary Figures S1 and S2). This suggests that sRNA processed from this region might be involved in the dominance relationship between class II and class I (class II > class I). AlSmi1-b had a mispair score > 7.0 against S20-SP11 (class IV) and S13, S16-SP11 (class III), consistent with dominance hierarchy (class IV and class III > class II) (Figure 3c,d; Supplementary Figure S2). These results suggest that the interaction between AlSmi1-a from class-IV S haplotypes and its target site at the SP11 intron of recessive class-III, class-II, and class-I S haplotypes controls the dominance relationships among these S haplotypes. On the other hand, the interaction between AlSmi1-b from class-II S haplotypes and its target site at the SP11 exon junction of recessive class-I S haplotypes controls the dominance relationships among these S haplotypes.
2.4. Identification of sRNA and Its Precursor Genes in Class-III S Haplotypes
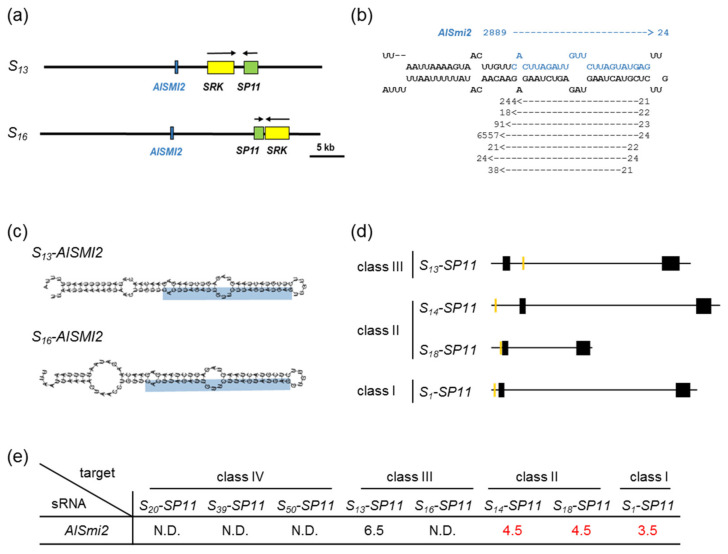
Since processed S13-AlSmi1 was not detected in S20S13 heterozygotes, we searched for other sRNAs that could control the dominance relationship class III > (class II and class I). We searched the S locus genomic sequence of the S13 haplotype, which shares high similarity with class-II S14- and S18-SP11 and class-I S1-SP11 genes ± 500 bp. We identified another inverted repeat sequence with high similarity to the 30-bp region upstream from the translation initiation sites of class-I and class-II SP11 genes, which we named A. lyrata SMI2 (AlSMI2) (Figure 4a). A database search identified the AlSMI2 sequence only in the class-III S13 and S16 haplotypes (Figure 4a).
Figure 4.
Identification of the candidate sRNAs controlling dominance–recessivity relationships: class III > (class II, class I). (a) Schematic diagrams of the S locus in the S13 haplotype (ADBK01001387) and the S16 haplotype (HQ379629). Green, yellow, and blue boxes indicate SP11, SRK, and AlSMI2, respectively. (b) Massively parallel sequencing analysis of sRNA expression from the S13-AlSMI2 inverted repeat sequence. sRNAs obtained from more than 10 reads were mapped against the S13-AlSMI2 inverted repeat sequence. Arrows indicate mapped sRNAs and their directions. Numbers at the tips of arrows indicate the obtained read numbers, and numbers at the ends of arrows indicate the base length of each sRNA. Bases in blue indicate the 24-nt AlSmi2 region. (c) Stem-loop structures of AlSMI2 of the S13 and S16 haplotypes predicted by RNAfold [20]. The predicted 24-nt mature AlSmi2 is shown in blue. (d) Schematic diagrams of the SP11 genomic regions of the S13, S14, S18, and S1 haplotypes. Black boxes indicate exon regions of SP11, orange boxes indicate the target region homologous to AlSmi2. (e) Sequence similarity between AlSmi2 and SP11. Each number indicates the mispair score between class-III AlSmi2 and class-IV, class-III, class-II, and class-I S haplotypes of SP11. N.D., not detected. Mispair scores < 5.5 are shown in red.
We mapped sRNA sequence reads derived from the anthers of S20S13 heterozygotes against the S13-AlSMI2 region and identified 2,889 AlSmi2 reads sharing high similarity with the 5’ upstream region of SP11 (Figure 4b; Supplementary Table S1). RNAfold [20] predicted that S13-AlSMI2 and S16-AlSMI2 had hairpin-structured precursors (Figure 4c). The mature 24-nt AlSmi2 sequence was identified in the stem regions of S13-AlSMI2 and S16-AlSMI2 (Figure 4c).
AlSmi2 shares high similarity with the 5’ regions of the relatively recessive haplotypes S14- and S18-SP11 (class II) and S1-SP11 (class I), with mispair scores < 4.5 (Figure 4d,e; Supplementary Figure S2). Although S13-SP11 intron contains a candidate target site of AlSmi2, it showed low similarity with this sequence (mispair score 6.5) (Figure 4d,e; Supplementary Figure S2). These results suggest that AlSmi2 controls the dominance relationship class III > (class II, class I) as a result of its high similarity (mispair score < 4.5) with the SP11 sequences of relatively recessive S haplotypes.
2.5. Quantification of a 24-nt sRNA and Its Precursor
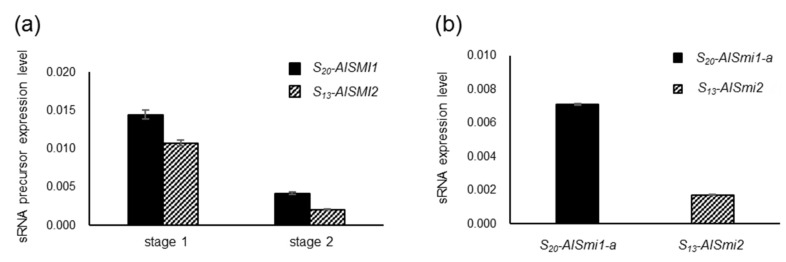
To confirm the expression of S20-AlSMI1 and S13-AlSMI2, which are precursors of S20-AlSmi1-a and S13-AlSmi2, respectively, in S20S13 heterozygotes, we performed RT-qPCR (Figure 5a). In B. rapa, the expression of Smi1 and Smi2 is induced before the initiation of SP11 transcription [13]. Since SP11 transcription is initiated at stage 2 in A. lyrata (Figure 1b), we analyzed S20-AlSMI1 and S13-AlSMI2 precursors in stage 1 and 2 anthers. We detected strong accumulation of both the S20-AlSMI1 and S13-AlSMI2 precursors at stage 1, which then declined by stage 2 (Figure 5a). This expression pattern suggests that S20-AlSMI1 and S13-AlSMI2 might act to suppress SP11. Additionally, we analyzed the expression of mature 24-nt S20-AlSmi1-a and S13-AlSmi2 in early stage anthers (stages 1–2) of S20S13 heterozygotes via stem-loop RT-qPCR of RNA samples [22] (Figure 5b). The results suggest that the precursors of these sRNAs and mature 24-nt sRNAs are expressed in vivo.
Figure 5.
Accumulation of sRNA precursors and a 24-nt sRNA in early stage anthers of S20S13 heterozygotes. (a) RT-qPCR of S13-AlSMI2 and S20-AlSMI1 precursors at stages 1 and 2 in S20S13 heterozygotes. GAPDH was used as an endogenous reference gene. The results shown are means ± s.d. of 3 replicates. (b) Quantification of S13-AlSmi2 and S20-AlSmi1 in mixtures of stage 1 and 2 anthers in S20S13 heterozygotes via stem-loop RT-PCR analysis. miR166 was used as an endogenous reference gene. The results shown are means ± s.d. of 3 replicates.
3. Discussion
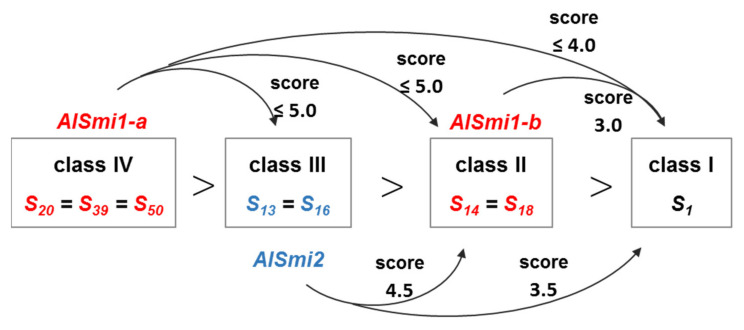
In this study, we identified two sRNAs homologous to SP11 genes in A. lyrata. The accumulation of the S13-SP11 transcript in S20S13 heterozygotes was strongly suppressed (to approximately 1%) compared with that in S13S13 homozygotes (Figure 1b), suggesting that class-IV S20-SP11 is dominant over class-III S13-SP11. AlSmi1-a from class IV is thought to be the only sRNA that controls the relationship class IV > (class III, class II, class I) (Figure 2a–e). Class-II and class-III AlSMI1 gene sequences with polymorphisms are also conserved (Supplementary Figure S1). Class II-specific AlSmi1-b shares high similarity with a relatively recessive S1-SP11 (class I) exon junction (mispair score 3.0) (Figure 3a–d; Supplementary Figure S1 and S2), suggesting that sRNA processed from this region might be involved in the dominance relationship between class-II and class-I sRNAs (class II > class I). Another sRNA, AlSmi2, which shares high similarity with SP11 genes of relatively recessive S haplotypes, is involved in the dominance relationship class III > (class II, class I) (Figure 4a–e). The accumulation of both S20-AlSMI1 and S13-AlSMI2 precursors was detected (Figure 5a), and mature 24-nt sRNAs of S20-AlSmi1-a and S13-AlSmi2 were expressed in vivo (Figure 5b). These results suggest that the linear dominance hierarchy in A. lyrata is controlled by two polymorphic sRNAs, AlSmi1 and AlSmi2 (Figure 6).
Figure 6.
Regulatory network of the identified sRNAs and their predicted targets in A. lyrata. Class-IV S20-SP11 is dominant over class-III S13-SP11 (Figure 1). AlSmi1-a from class-IV S haplotypes is homologous to SP11 from recessive S haplotypes (classes III, II, and I), showing a mispair score < 5.0 (Figure 2). AlSmi1-b predicted from class-II S haplotypes is homologous to a class-I SP11, showing a mispair score < 3.0 (Figure 3). AlSmi2 from class-III S haplotypes is homologous to SP11 from relatively recessive S haplotypes (classes II and I), showing a mispair score < 4.5 (Figure 4). Both precursors and mature 24-nt sRNA of AlSmi1-a and AlSmi2 were detected in vivo (Figure 5).
AlSmi1 and AlSmi2 correspond to mirS3 and mir1887 in A. halleri, respectively [9]. A species-wide survey of sequence diversity revealed that a large fraction of alleles at the pistil side SI determinant SRK are trans-specifically shared between A. lyrata and A. halleri [23]. Our findings suggest that not only SRK but also other S-locus genes, including sRNAs, are shared between A. lyrata and A. halleri. These sRNAs are conserved in both species in the regulation of pollen side dominance. A pollen side linear dominance hierarchy controlled by sRNAs has also been identified in B. rapa [11,12], pointing to a common sRNA-based dominance–recessivity mechanism in Brassicaceae plants.
Furthermore, our data suggest that the dominance–recessivity mechanism in both B. rapa and A. lyrata is explained by the sequence homology between sRNA and its target. In our previous report, the sRNA from the dominant allele had a mispair score < 5.5 against the target region of recessive SP11. In the current study, AlSmi1 and AlSmi2 in A. lyrata also had mispair scores < 5.0 against relatively recessive SP11s (Figure 2e, Figure 3d, Figure 4e and Figure 6; Supplementary Figure S2). Concurrently, these sRNAs had a mispair score > 6.5 against self- and relatively dominant SP11s (Figure 2e, Figure 3d and Figure 4e; Supplementary Figure S2). Two models have been examined in A. halleri: (1) dominant S alleles carry a larger set of sRNAs; and (2) recessive S alleles carry a larger set of sRNA targets [9]. Here, we identified only one sRNA, AlSmi1-a, from the most dominant S haplotype (class IV), and found that recessive S haplotypes did not contain a larger number of sRNA targets (Figure 2b, Figure 3c and Figure 4d). These results strongly suggest that the polymorphic dominance modifier model we proposed for B. rapa also explains the dominance relationships in A. lyrata. Further analysis of the role of the interactions between sRNAs and their target regions should provide support for this model.
Similar complex dominance–recessivity relationships can be observed in other SI plants of the Asteraceae and Convolvulaceae [24,25]. Moreover, dominance relationships have been reported among mimicry genes in butterflies [26] and among genes in various plants and animals [27,28,29,30]. Further studies are needed to determine whether our model can explain these complicated dominance–recessivity networks and monoallelic gene expression.
4. Materials and Methods
4.1. Plant Materials
A. lyrata SaSb seeds were a gift from Y. Takada (Tohoku University). For all experiments, floral buds from clonally propagated progenies of a single individual were used. The plants were grown in a growth chamber under long-day conditions (16 h light/8 h dark).
4.2. RT-qPCR of SP11
Total RNA was isolated from the anthers of S13S13 homozygotes and S20S13 heterozygotes at each stage of development and used for RT-qPCR, as previously described [13]. The S13-SP11 region was amplified using specific primers: forward primer, 5’-AGCCATGTTCAAGGAATGGAAGA-3’; reverse primer, 5’-TTGTTGCCATCCTCCGTAAGGTC-3’. Elf1α was used as an endogenous reference gene and amplified using specific primers: forward primer, 5’-TGGTGACGCTGGTATGGTTA-3’; reverse primer, 5’-GGTCTGCCTCATGTCCCTAA-3’.
4.3. Prediction of Inverted Repeat Sequence Regions
Inverted repeat sequences were searched from the S-locus sequence data of each haplotype: S20 (HQ379628), S39 (KJ772415–KJ772419), S50 (HQ379631), S13 (ADBK01001387), S16 (HQ379629), S14 (KJ772405–KJ772407), S18 (KJ772408–KJ772414), and S1 (KJ772401–KJ772404). The S locus was defined as the region between PUB8 (At4g21350) and ARK3 (At4g21380), as described previously [15]. First, each SP11 gene containing both upstream and downstream 500-bp fragments was divided into 500-bp fragments overlapping every 30-bp region. These fragments were used as queries in BLAST searches against the S loci of the S20 and S13 haplotypes. Sequences showing E-values < 1 × 10⁻³ were further analyzed. The secondary structures of the precursors from the obtained inverted repeat were predicted using RNAfold [20]. Hairpin-structured miRNA-like sequences having low energy values under −30 kcal mol−1 were screened.
4.4. Small RNA Sequencing and Mapping
Total RNA containing the sRNA fraction was isolated from a mixture of stage 1 and 2 anthers using a mirVana miRNA Isolation Kit (Ambion/Thermo Fisher Scientific, Waltham, MA, USA). Preparation of the small RNA library, Illumina GAII sequencing, and adaptor trimming of sequencing reads were performed at Hokkaido System Science Co., Ltd (Sapporo, Japan). sRNA sequences with more than 10 reads were mapped against the S locus of the S20 haplotype (HQ379628) and the S13 haplotype (ADBK01001387). We also mapped the obtained reads against the predicted precursors of AlSMI1 and AlSMI2 using the Bowtie program [31]. The mispair score was calculated as described [21]: mismatches were scored as 1, and G:U pairs were scored as 0.5. Mismatched and G:U pair scores within the core segment were doubled.
4.5. RT-qPCR of sRNA Precursor
Total RNA was isolated from anthers of S20S13 heterozygotes at each stage of development using an RNeasy Mini Kit (QIAGEN GmbH, Hilden, Germany) and used for RT-qPCR, as previously described [13]. Each sRNA precursor region was amplified using specific primers: S20-AlSMI1 forward primer, 5’-AGCAATGGTTTCAGATTTTGACAGTAACC-3’; S20-AlSMI1 reverse primer, 5’-AGATACATTTTACCTTGAACATGGTTTAAATGG-3’; S13-AlSMI2 forward primer, 5’-TTAATTAAAAGTAACTTGTTCACTTAGATTGTTCTTAG-3’; S13-AlSMI2 reverse primer, 5’-ATGTTGTTCTCTTAGACTCTACTTAGTACG-3’. GAPDH was used as an endogenous reference gene and amplified using specific primers: forward primer, 5’-GACCTTACTGTCAGACTCGAG-3’; reverse primer, 5’-CGGTGTATCCAAGGATTCCCT-3’.
4.6. Stem-Loop RT-PCR
Quantification of 24-nt S20-AlSmi1 and S13-AlSmi2 sRNAs was performed as previously described [22]. sRNAs were isolated from anthers (mixture of stages 1 and 2) from S20S13 heterozygotes using a mirVana miRNA Isolation Kit (Ambion/Thermo Fisher Scientific, Waltham, MA, USA) and reverse transcribed using a TaqMan MicroRNA Reverse Transcription Kit (Applied Biosystems/Thermo Fisher Scientific, Waltham, MA, USA) with 24-nt sRNA-specific RT primers: S20-AlSmi1 RT-forward primer, 5’-GTTGGCTCTGGTGCAGGGTCCGAGGTATTCGCACCAGA-3’; S13-AlSmi2 RT-forward primer, 5’-GTTGGCTCTGGTGCAGGGTCCGAGGTATTCGCACCAGA-3’. The reverse transcription products were quantified using Light Cycler 480 Probes Master Mix (Roche, Basel, Switzerland) and Universal Probe Library #21 (Roche) with small RNA-specific primers and universal primers: S20-AlSmi1 forward primer, 5’-CGGCGGCAATCAAAACTTAAAGGAG-3’; S13-AlSmi2 forward primer, 5’-CGGCGGCCACTTAGATTGTTCTTAG-3’; universal primer, 5’-GTGCAGGGTCCGAGGT-3’. miR166 was used as an endogenous reference miRNA and was amplified using specific primers: RT-forward primer, 5’-GTTGGCTCTGGTGCAGGGTCCGAGGTATTCGCACCAGAGCCAACGGGGAA-3’; forward primer, 5’-CAGCATCGGACCAGGCTTCA-3’.
Acknowledgments
We thank Y. Takada for helpful comments and F. Kodama, M. Nara, and Y. Yoshimura for technical assistance.
Supplementary Materials
Supplementary materials can be found at https://www.mdpi.com/article/10.3390/ijms22136990/s1.
Author Contributions
S.Y., Y.W. and S.T. designed the research; S.Y. and R.K. performed the research; S.Y., R.K. and Y.W. analyzed data; R.K., T.I., Y.W. and S.T. wrote the article. All authors have read and agreed to the published version of the manuscript.
Funding
This work was supported in part by Grants-in-Aid for Scientific Research (16H06380 to S.T. and Y.W.; 20H00470 to T.I. and Y.W.; 19H04865 to T.I.; 19K06781 and 18H02456 to Y.W.; 16H06467 to S.T.), a Grant-in-Aid for JSPS Research Fellow (14J10324 to S.Y.), and a grant from the Takeda Science Foundation to Y.W.
Data Availability Statement
Sequence data for S20-AlSMI1 and S13-AlSMI2 have been deposited in DDBJ under accession numbers LC629453 and LC629454.
Conflicts of Interest
The authors declare that the research was conducted in the absence of any commercial or financial relationships that could be construed as a potential conflict of interest.
Footnotes
Publisher’s Note: MDPI stays neutral with regard to jurisdictional claims in published maps and institutional affiliations.
References
- 1.Suzuki G., Kai N., Hirose T., Fukui K., Nishio T., Takayama S., Isogai A., Watanabe M., Hinata K. Genomic organization of the S locus: Identification and characterization of genes in SLG/SRK region of S9 haplotype of Brassica campestris (syn. rapa) Genetics. 1999;153:391–400. doi: 10.1093/genetics/153.1.391. [DOI] [PMC free article] [PubMed] [Google Scholar]
- 2.Schopfer C.R., Nasrallah M.E., Nasrallah J.B. The male determinant of self-incompatibility in Brassica. Science. 1999;286:1697–1700. doi: 10.1126/science.286.5445.1697. [DOI] [PubMed] [Google Scholar]
- 3.Takayama S., Shiba H., Iwano M., Shimosato H., Che F.S., Kai N., Watanabe M., Suzuki G., Hinata K., Isogai A. The pollen determinant of self-incompatibility in Brassica campestris. Proc. Natl. Acad. Sci. USA. 2000;97:1920–1925. doi: 10.1073/pnas.040556397. [DOI] [PMC free article] [PubMed] [Google Scholar]
- 4.Stein J.C., Howlett B., Boyes D.C., Nasrallah M.E., Nasrallah J.B. Molecular cloning of a putative receptor protein kinase gene encoded at the self-incompatibility locus of Brassica oleracea. Proc. Natl. Acad. Sci. USA. 1991;88:8816–8820. doi: 10.1073/pnas.88.19.8816. [DOI] [PMC free article] [PubMed] [Google Scholar]
- 5.Takasaki T., Hatakeyama K., Suzuki G., Watanabe M., Isogai A., Hinata K. The S receptor kinase determines self-incompatibility in Brassica stigma. Nature. 2000;403:913–916. doi: 10.1038/35002628. [DOI] [PubMed] [Google Scholar]
- 6.Kachroo A., Schopfer C.R., Nasrallah M.E., Nasrallah J.B. Allele-specific receptor-ligand interactions in Brassica self-incompatibility. Science. 2001;293:1824–1826. doi: 10.1126/science.1062509. [DOI] [PubMed] [Google Scholar]
- 7.Takayama S., Shimosato H., Shiba H., Funato M., Che F.S., Watanabe M., Iwano M., Isogai A. Direct ligand-receptor complex interaction controls Brassica self-incompatibility. Nature. 2001;413:534–538. doi: 10.1038/35097104. [DOI] [PubMed] [Google Scholar]
- 8.Kusaba M., Dwyer K., Hendershot J., Vrebalov J., Nasrallah J.B., Nasrallah M.E. Self-incompatibility in the genus Arabidopsis: Characterization of the S locus in the outcrossing A. lyrata and its autogamous relative A. thaliana. Plant Cell. 2001;13:627–644. doi: 10.1105/tpc.13.3.627. [DOI] [PMC free article] [PubMed] [Google Scholar]
- 9.Durand E., Méheust R., Soucaze M., Goubet P.M., Gallina S., Poux C., Fobis-Loisy I., Guillon E., Gaude T., Sarazin A., et al. Dominance hierarchy arising from the evolution of a complex small RNA regulatory network. Science. 2014;346:1200–1205. doi: 10.1126/science.1259442. [DOI] [PubMed] [Google Scholar]
- 10.Hatakeyama K., Watanabe M., Takasaki T., Ojima K., Hinata K. Dominance relationships between S-alleles in self-incompatible Brassica campestris L. Heredity. 1998;80:241–247. doi: 10.1046/j.1365-2540.1998.00295.x. [DOI] [Google Scholar]
- 11.Tarutani Y., Shiba H., Iwano M., Kakizaki T., Suzuki G., Watanabe M., Isogai A., Takayama S. Trans-acting small RNA determines dominance relationships in Brassica self-incompatibility. Nature. 2010;466:983–986. doi: 10.1038/nature09308. [DOI] [PubMed] [Google Scholar]
- 12.Yasuda S., Wada Y., Kakizaki T., Tarutani Y., Miura-Uno E., Murase K., Fujii S., Hioki T., Shimoda T., Takada Y., et al. A complex dominance hierarchy is controlled by polymorphism of small RNAs and their targets. Nat. Plants. 2016;3:16206. doi: 10.1038/nplants.2016.206. [DOI] [PubMed] [Google Scholar]
- 13.Shiba H., Kakizaki T., Iwano M., Tarutani Y., Watanabe M., Isogai A., Takayama S. Dominance relationships between self-incompatibility alleles controlled by DNA methylation. Nat. Genet. 2006;38:297–299. doi: 10.1038/ng1734. [DOI] [PubMed] [Google Scholar]
- 14.Prigoda N.L., Nassuth A., Mable B.K. Phenotypic and genotypic expression of self-incompatibility haplotypes in Arabidopsis lyrata suggests unique origin of alleles in different dominance classes. Mol. Biol. Evol. 2005;22:1609–1620. doi: 10.1093/molbev/msi153. [DOI] [PubMed] [Google Scholar]
- 15.Guo Y.L., Zhao X., Lanz C., Weigel D. Evolution of the S-locus region in Arabidopsis relatives. Plant Physiol. 2011;157:937–946. doi: 10.1104/pp.111.174912. [DOI] [PMC free article] [PubMed] [Google Scholar]
- 16.Goubet P.M., Bergès H., Bellec A., Prat E., Helmstetter N., Mangenot S., Gallina S., Holl A.C., Fobis-Loisy I., Vekemans X., et al. Contrasted patterns of molecular evolution in dominant and recessive self-incompatibility haplotypes in Arabidopsis. PLoS Genet. 2012;8:e1002495. doi: 10.1371/journal.pgen.1002495. [DOI] [PMC free article] [PubMed] [Google Scholar]
- 17.Schierup M.H., Mable B.K., Awadalla P., Charlesworth D. Identification and characterization of a polymorphic receptor kinase gene linked to the self-incompatibility locus of Arabidopsis lyrata. Genetics. 2001;158:387–399. doi: 10.1093/genetics/158.1.387. [DOI] [PMC free article] [PubMed] [Google Scholar]
- 18.Mable B.K., Beland J., Di Berardo C. Inheritance and dominance of self-incompatibility alleles in polyploid Arabidopsis lyrata. Heredity. 2004;93:476–486. doi: 10.1038/sj.hdy.6800526. [DOI] [PubMed] [Google Scholar]
- 19.Kusaba M., Tung C.W., Nasrallah M.E., Nasrallah J.B. Monoallelic expression and dominance interactions in anthers of self-incompatible Arabidopsis lyrata. Plant Physiol. 2002;128:17–20. doi: 10.1104/pp.010790. [DOI] [PMC free article] [PubMed] [Google Scholar]
- 20.Lorenz R., Bernhart S.H., Höner zu Siederdissen C., Tafer H., Flamm C., Stadler P.F., Hofacker I.L. ViennaRNA package 2.0. Algorithms Mol. Biol. 2011;6:26–39. doi: 10.1186/1748-7188-6-26. [DOI] [PMC free article] [PubMed] [Google Scholar]
- 21.Fahlgren N., Carrington J.C. miRNA target prediction in plants. Methods Mol. Biol. 2010;592:51–57. doi: 10.1007/978-1-60327-005-2_4. [DOI] [PubMed] [Google Scholar]
- 22.Chen C., Ridzon D.A., Broomer A.J., Zhou Z., Lee D.H., Nguyen J.T., Barbisin M., Xu N.L., Mahuvakar V.R., Andersen M.R., et al. Real-time quantification of microRNAs by stem–loop RT–PCR. Nucleic Acids Res. 2005;33:e179. doi: 10.1093/nar/gni178. [DOI] [PMC free article] [PubMed] [Google Scholar]
- 23.Castric V., Bechsgaard J., Schierup M.H., Vekemans X. Repeated Adaptive introgression at a gene under multiallelic balancing selection. PLoS Genet. 2008;4:e1000168. doi: 10.1371/journal.pgen.1000168. [DOI] [PMC free article] [PubMed] [Google Scholar]
- 24.Kowyama Y., Takahasi H., Muraoka K., Tani T., Hara K., Shiotani I. Number, frequency and dominance relationships of S-alleles in diploid Ipomoea trifida. Heredity. 1994;73:275–283. doi: 10.1038/hdy.1994.134. [DOI] [Google Scholar]
- 25.Brennan A.C., Tabah D.A., Harris S.A., Hiscock S.J. Sporophytic self-incompatibility in Senecio squalidus (Asteraceae): S allele dominance interactions and modifiers of cross-compatibility and selfing rates. Heredity. 2011;106:113–123. doi: 10.1038/hdy.2010.29. [DOI] [PMC free article] [PubMed] [Google Scholar]
- 26.Joron M., Papa R., Beltrán M., Chamberlain N., Mavárez J., Baxter S., Abanto M., Bermingham E., Humphray S.J., Rogers J., et al. A conserved supergene locus controls colour pattern diversity in Heliconius butterflies. PLoS Biol. 2006;4:e303. doi: 10.1371/journal.pbio.0040303. [DOI] [PMC free article] [PubMed] [Google Scholar]
- 27.Guo M., Rupe M.A., Zinselmeier C., Habben J., Bowen B.A., Smith O.S. Allelic variation of gene expression in maize hybrids. Plant Cell. 2004;16:1707–1716. doi: 10.1105/tpc.022087. [DOI] [PMC free article] [PubMed] [Google Scholar]
- 28.Gimelbrant A., Hutchinson J.N., Thompson B.R., Chess A. Widespread monoallelic expression on human autosomes. Science. 2007;318:1136–1140. doi: 10.1126/science.1148910. [DOI] [PubMed] [Google Scholar]
- 29.Zhuang Y., Adams K.L. Extensive allelic variation in gene expression in populus F1 hybrids. Genetics. 2007;177:1987–1996. doi: 10.1534/genetics.107.080325. [DOI] [PMC free article] [PubMed] [Google Scholar]
- 30.Wang J., Valo Z., Smith D., Singer-Sam J. Monoallelic expression of multiple genes in the CNS. PLoS ONE. 2007;2:e1293. doi: 10.1371/journal.pone.0001293. [DOI] [PMC free article] [PubMed] [Google Scholar]
- 31.Langmead B., Trapnell C., Pop M., Salzberg S.L. Ultrafast and memory-efficient alignment of short DNA sequences to the human genome. Genome Biol. 2009;10:R25. doi: 10.1186/gb-2009-10-3-r25. [DOI] [PMC free article] [PubMed] [Google Scholar]
Associated Data
This section collects any data citations, data availability statements, or supplementary materials included in this article.
Supplementary Materials
Data Availability Statement
Sequence data for S20-AlSMI1 and S13-AlSMI2 have been deposited in DDBJ under accession numbers LC629453 and LC629454.


