

Abstract
OBJECTIVE.
The purpose of this study was to evaluate agreement among radiologists in detecting and assessing prostate cancer at multiparametric MRI using Prostate Imaging Reporting and Data System version 2 (PI-RADSv2).
MATERIALS AND METHODS.
Treatment-naïve patients underwent 3-T multiparametric MRI between April 2012 and June 2015. Among the 163 patients evaluated, 110 underwent prostatectomy after MRI and 53 had normal MRI findings and transrectal ultrasound–guided biopsy results. Nine radiologists participated (three each with high, intermediate, and low levels of experience). Readers interpreted images of 58 patients on average (range, 56–60) using PI-RADSv2. Prostatectomy specimens registered to MRI were ground truth. Interobserver agreement was evaluated with the index of specific agreement for lesion detection and kappa and proportion of agreement for PI-RADS category assignment.
RESULTS.
The radiologists detected 336 lesions. Sensitivity for index lesions was 80.9% (95% CI, 75.1–85.9%), comparable across reader experience (p = 0.392). Patient-level specificity was experience dependent; highly experienced readers had 84.0% specificity versus 55.2% for all others (p < 0.001). Interobserver agreement was excellent for detecting index lesions (index of specific agreement, 0.871; 95% CI, 0.798–0.923). Agreement on PI-RADSv2 category assignment of index lesions was moderate (κ = 0.419; 95% CI, 0.238–0.595). For individual category assignments, proportion of agreement was slight for PI-RADS category 3 (0.208; 95% CI, 0.086–0.284) but substantial for PI-RADS category 4 (0.674; 95% CI, 0.540–0.776). However, proportion of agreement for T2-weighted PI-RADS 4 in the transition zone was 0.250 (95% CI, 0.108–0.372). Proportion of agreement for category assignment of index lesions on dynamic contrast-enhanced MR images was 0.822 (95% CI, 0.728–0.903), on T2-weighted MR images was 0.515 (95% CI, 0.430–0623), and on DW images was 0.586 (95% CI, 0.495–0.682). Proportion of agreement for dominant lesion was excellent (0.828; 95% CI, 0.742–0.913).
CONCLUSION.
Radiologists across experience levels had excellent agreement for detecting index lesions and moderate agreement for category assignment of lesions using PI-RADS. Future iterations of PI-RADS should clarify PI-RADS 3 and PI-RADS 4 in the transition zone.
Keywords: agreement, multiparametric MRI, PI-RADS version 2, prostate cancer
The use of prostate multiparametric MRI (mpMRI) and targeted biopsy increases detection of clinically significant cancers while decreasing the diagnosis of indolent disease [1–3]. One obstacle to broad application of prostate mpMRI is the lack of standardization and training necessary to interpret mpMR images [4]. A prostate MRI steering committee formed by the American College of Radiology, the European Society of Urogenital Radiology, and the AdMeTech Foundation introduced the Prostate Imaging Reporting and Data System version 2 (PI-RADSv2) in 2015 to address these concerns [5]. PI-RADSv2 is a simplified assessment system developed from previous versions on the basis of expert opinion and scientific experience with prostate mpMRI. It was published as a living document to be updated with the accrual of data [6].
One question to be addressed with the implementation of PI-RADSv2 is how reproducible the guidelines are among radiologists with different training and different levels of experience. Adequate prostate mpMRI interpretation requires evaluating images obtained with multiple sequences (T2-weighted imaging, DWI, and dynamic contrast-enhanced [DCE] imaging); detecting all concerning lesions; assessing the category assignment of a lesion according to the appropriate sequence; and communicating the findings for successful targeted biopsy. The interobserver agreement of PI-RADSv2 must therefore be evaluated for each step in this process.
PI-RADSv2 has been the focus of a number of multireader diagnostic studies since its release [7–15]. Those studies showed moderate reproducibility in assessing prostate cancer lesions with PI-RADSv2 and good sensitivity (≈ 70–90%) for clinically significant lesions. However, the studies did not analyze reproducibility among readers in lesion detection, because most studies have been designed to present readers with preselected lesions and ask them to assign a category to the lesion. We conducted a nine-reader study with readers from a spectrum of medical centers and countries with varying experience with prostate mpMRI. This study was originally conducted to evaluate a computer-aided diagnosis platform for diagnosing cancers. As part of this study, readers interpreted MR images without knowing lesion location and without assistance from computer-aided diagnosis [16, 17]. Data from this portion of the study allow analysis of interreader agreement for lesion detection and for variations in PI-RADSv2 category assignment across reader experience levels. In addition, these data may provide insight into previous points of discussion about PI-RADSv2, specifically the appropriate PI-RADS threshold for optimal diagnostic accuracy [18], agreement on DCE-MRI category assignment [19], and category assignment and agreement in the transition zone (TZ) [8]. We sought to evaluate agreement among radiologists of varying experience retrospectively using PI-RADSv2 to detect and assign a category to prostate cancers on mpMR images.
Materials and Methods
Study Population
This HIPAA-compliant retrospective study received ethics committee approval. All patients underwent 3-T MRI with an endorectal coil and T2-weighted, DWI (apparent diffusion coefficient, b = 2000 s/mm2), and DCE sequences. Patients were consecutively enrolled and underwent mpMRI between April 2012 and June 2015 that was followed by radical prostatectomy (n = 179). A control group of consecutively registered patients underwent imaging between May 2013 and May 2015 for an elevated prostate-specific antigen (PSA) level but had no lesions detected at mpMRI and no history of a positive result of systematic 12-core transrectal ultrasound–guided biopsy (n = 92). Patients in both groups were excluded for a hip prosthesis or missing mpMRI sequences (n = 6). Patients with prostate cancer were excluded if whole-mount specimens were not available (n = 66). Patients without cancer were randomly excluded to reach a ratio of 2:1 cancer to noncancer (n = 35). Two control patients were excluded for a subsequent positive biopsy result during the course of the study. The total exclusions were 69 cancer patients and 39 control subjects. The total study population was 163 patients (110 patients with prostate cancer, 53 control subjects). Characteristics of cancer patients and control patients are reported in Table 1. Results from this patient population were previously published [17] but did not address interreader variability. The prior publication addressed the cancer-predictive value of PI-RADS assessments across a variety of readers.
TABLE 1:
Baseline Characteristics of Patients
| Characteristic | Cancer Patients | Control Patients | p |
|---|---|---|---|
|
| |||
| No. | 110 | 53 | |
| Age (y) | 61.3 (44.3–75.6) | 63.8 (43.4–82.8) | 0.037 |
| Prostate-specific antigen level (ng/mL) | 11.0 (1.7–84.6) | 7.4 (1.5–28.7) | 0.028 |
| Whole prostate volume (mL) | 41.2 (15.0–117.0) | 80.5 (31.0–160.0) | < 0.001 |
| Time between multiparametric MRI and surgery or biopsy (mo) | 5.2 (0.03–21.7) | 43.0 (0.03–188.5) | < 0.001 |
| Total ground truth lesions (no.) | 268 | — | |
| GS 3 + 3 | 24 | — | |
| GS 3 + 4 | 151 | — | |
| GS 4 + 3 or 4 + 4 | 83 | — | |
| GS > 4 + 4 | 10 | — | |
| Lesion volume (mL) | 1.69 (0.1–20.1) | — | |
| Index lesion volume (mL) | 2.93 (0.23–20.1) | — | |
| Peripheral zone lesions (no.) | 185 | — | |
| GS 3 + 3 | 18 | — | |
| GS 3 + 4 | 108 | — | |
| GS 4 + 3 or 4 + 4 | 52 | — | |
| GS > 4+4 | 7 | — | |
| Transition zone lesions (no.) | 83 | — | |
| GS 3 + 3 | 6 | — | |
| GS 3 + 4 | 43 | — | |
| GS 4 + 3 or 4 + 4 | 31 | — | |
| GS > 4 + 4 | 3 | — | |
Note—Values are number or mean with range in parentheses. Dash (—) indicates not applicable. GS = Gleason score.
MRI Protocol
All mpMRI images were acquired with a 3-T MRI system (Achieva 3 T-TX, Philips Healthcare) and an endorectal coil (BPX-30, Medrad) filled with 45 mL of electronic liquid (Fluorinert, 3M). The anterior half of a 32-channel cardiac sensory encoding coil (SENSE, Invivo) was also used. Table S1 shows the MRI acquisition parameters used in this study. (Tables S1 and S2 can be viewed in the AJR electronic supplement to this article, available at www.ajronline.org.)
Study Design
Nine radiologists volunteered to participate in this study. Three had a high level of experience in prostate mpMRI (> 2000 cases in the last 2 years), three a moderate level (500–2000 cases in the last 2 years), and three a low level of experience (< 500 cases in the last 2 years). The readers represented six countries and eight institutions. All had experience with PI-RADSv2 before this study.
Patients were randomly allocated to pairwise combinations of readers to reduce the number of studies each individual needed to evaluate. Randomization was stratified by disease status (cancer patient vs control patient) so that patient allocation maintained a 2:1 ratio for each reader. Specifically, the images of 19 patients with cancer and nine control patients were randomly presented to and evaluated by all nine readers. The other 135 patients (91 patients with cancer, 44 control subjects) were randomly allocated to a total of 36 pairs of readers with each reader pair evaluating two or three patients with cancer and one or two control patients. Each reader evaluated an average of 58 patients (range, 56–60 patients).
MRI Interpretation
All readers were blinded to PSA level, previous biopsy results, disease status, post-MRI biopsy result, and prostatectomy outcome. Readers were given no indication of lesion location at mpMRI. Images, which were acquired at a single institution, were delivered to readers as DICOM files containing all pertinent sequences. Patient information was stripped from the DICOM files. Readers used RadiAnt DICOM viewer (Medixant) with image registration to facilitate viewing images obtained with all four sequences simultaneously and used temporal contrast enhancement at any given axial slice. Readers were asked to detect and assign a category to lesions using PI-RADSv2 and could use any resources available except other readers. Each reader evaluated patient studies at personal workstations under typical reading conditions.
Readers used an application based on Microsoft Access Professional Plus 2010 to record their findings. This application uses patient pseudoidentifiers to indicate which study to read, keep track of time to interpret, and ensure data validation. Once readers detected a lesion, they marked it on its long axis and saved a screen shot of each lesion in the Microsoft Access application. They then recorded the number of lesions in the prostate, the individual assignments for the three types of images (T2-weighted MRI, DWI, and DCE-MRI), the zone assignment, and extraprostatic extension status for each lesion and indicated a dominant lesion.
Radiologic and Pathologic Comparison
Screen shots for each lesion were compared among readers to determine agreement in detection. The morphologic features of the prostate and the lesion (e.g., benign prostatic hypertrophy nodules, slice location, zonal location) were used to ensure that the same lesion was detected with allowance of a difference of two 3-mm axial slices among readers. This comparison among readers was performed by a research fellow and validated by a prostate-dedicated radiologist.
MRI-detected lesions were compared with whole-mount radical prostatectomy specimens processed with a 3D-printed mold modeled after MRI segmentation, as previously described [20]. Lesion outlines and Gleason score (GS) assignment of prostatectomy specimens were performed by a genitourinary pathologist blinded to MRI results. Comparison between MRI and prostatectomy was performed by a research fellow according to lesion location and prostate morphologic features. Index lesions were defined on prostatectomy specimens as the highest-grade lesion or, if the lesions were of equivalent grade, the largest lesion.
Statistical Analysis
PI-RADS category assignment at the patient level was defined as the maximal PI-RADS category assignment among all lesions identified by each reader. Reader sensitivity at both patient and lesion level was determined at PI-RADS category thresholds ≥ 3 and ≥ 4. Specificity at these thresholds was analyzed only on a patient level because negative regions were not defined, but patients with normal mpMRI and biopsy findings were included. GS ≥ 3 + 4 was defined as positive for sensitivity and specificity analysis.
Interobserver agreement was assessed with respect to tumor detection, PI-RADS category assignment, and assignment of extraprostatic extension, zone, and dominant lesion. PI-RADSv2 does not include clear instructions regarding how to assign a category to lesions spanning both zones. To facilitate analysis, lesions assigned both categories by a reader were assigned a zone based on the prostatectomy result. Agreement on detection of lesions was determined by the index of specific agreement (SA) [12, 21]. The index of SA is defined as the probability that given a pairwise combination of readers, if one randomly selected reader makes a specific rating, the other rater will also do so. Index of SA is appropriate for lesion assessment given the low probability of readers’ detecting the same lesion by chance.
Agreement on lesion assessment was examined with respect to exact and specific category assignment for overall and individual pulse sequence PI-RADS assessments. Both the unweighted kappa statistic and proportion of agreement (PA), defined as the proportion of lesions detected by both readers and given the same assignment, were used to determine reader agreement on exact assessment of all category assignments and lesion assessments. Both kappa statistic and PA were used because the kappa statistic is susceptible to disproportionately low agreement with variable marginal frequencies. Kappa values were defined as slight, 0–0.20; fair, 0.21–0.40; moderate, 0.41–0.60; substantial, 0.61–0.80; and excellent, 0.81–1 [22]. This convention was used for PA for consistency, though kappa statistic and PA are not directly comparable. Agreement of specific assessments was quantified by index of SA.
All estimators were averaged across all readers and by experience. The bootstrap resampling procedure on the patient level was used to obtain standard error and 95% CI, where the confidence limits were the 2.5th and 97.5th percentiles of the bootstrap distribution. The two-sided Wald test was used for comparisons between subgroups. Values of p < 0.05 were considered statistically significant.
Results
Radiologic Lesion Characteristics
Among 163 patients 336 unique lesions were detected by all readers. Because most lesions were detected by more than one reader, a total of 654 PI-RADS category assessments were assigned: 63.8% (417/654) in the peripheral zone (PZ), 2.8% (18/654) labeled as spanning both zones, and 33.5% (219/654) in the TZ. The frequency of each PI-RADS category assignment for the whole prostate, PZ, and TZ is shown in Table S2. PI-RADS category 1 lesions were excluded from further analysis owing to the small sample size (n = 3).
Sensitivity and Specificity of Prostate Imaging Reporting and Data System Version 2
Table 2 shows patient-level sensitivity and specificity for all readers and by reader experience. Sensitivity was similar across experience levels (average, 92.2%; p = 0.360), but specificity was experience dependent (high level of experience, 84.0%; for all other readers, 55.2%; p < 0.001). A threshold of PI-RADS ≥ 4 had higher specificity than did PI-RADS ≥ 3 (77.3% vs 64.8%, p < 0.001) for all readers with lower sensitivity (86.7% vs 92.2%, p < 0.001).
TABLE 2:
Patient-Level Accuracy (%) of Prostate Imaging Reporting and Data System Version 2 for All Readers and by Reader Experience
| Experience Level |
||||
|---|---|---|---|---|
| Category Assignment | All Readers | High | Moderate | Low |
|
| ||||
| ≥ 3 | ||||
| Sensitivity | 92.2 (87.6–95.8) | 93.9 (87.2–98.5) | 91.9 (86.4–97.0) | 90.9 (84.1–96.4) |
| Specificity | 64.8 (55.7–74.6) | 84.0 (72.1–94.6) | 46.3 (34.5–59.1) | 64.1 (51.6–77.2) |
| ≥ 4 | ||||
| Sensitivity | 86.7 (80.4–91.8) | 86.6 (78.2–93.7) | 87.3 (79.8–94.4) | 86.3 (78.0–93.3) |
| Specificity | 77.3 (67.8–86.8) | 90.2 (79.8–98.4) | 66.3 (52.7–79.2) | 75.5 (64.0–87.3) |
Note—Values in parentheses are 95% CIs.
Sensitivity by PI-RADS category assignment in lesion-level analysis for index lesions and all lesions is shown in Table 3. Sensitivity for index lesions was 80.9% (95% CI, 75.1–85.9%) in PI-RADS category ≥ 3 and was comparable across reader experience (p = 0.392). Sensitivity decreased in PI-RADS category ≥ 4 at (76.6%) versus PI-RADS ≥ 3 (80.9%) (p = 0.002).
TABLE 3:
Prostate Imaging Reporting and Data System Version 2 Sensitivity (%) for Index Lesions and All Lesions by Reader Experience
| Category Assignment | All Readers | Experience Level |
||
|---|---|---|---|---|
| High | Moderate | Low | ||
|
| ||||
| Index lesions | ||||
| ≥ 3 | 80.9 (75.1–85.9) | 83.4 (74.2–91.2) | 80 (72.7–8759) | 79.2 (71.7–86.2) |
| ≥ 4 | 76.6 (69.8–82.7) | 79.4 (69.9–87.7) | 75.7 (67.0–84.6) | 74.7 (65.6–82.7) |
| All lesions | ||||
| ≥ 3 | 52.6 (47.3–58.9) | 54.8 (47.5–63.1) | 53.9 (47.4–61.1) | 49.2 (43.1–56.1) |
| ≥ 4 | 47.6 (41.6–54.4) | 47.5 (40.2–56.7) | 49.4 (42.5–57.2) | 46.0 (39.1–53.7) |
Note—Values in parentheses are 95% CIs.
Interobserver Agreement on Lesion Detection
Agreement in detecting all lesions, all true-positive lesions, and index lesions is shown Figure 1. Average agreement (index of SA) for all readers for detecting all lesions was moderate (0.569; 95% CI, 0.503–0.631). Agreement for index lesion detection was excellent (0.871, 95% CI, 0.798–0.923) and for true-positive findings was substantial (0.742; 95% CI, 0.670–0.810). This trend remained for the PZ and the TZ. Agreement reached as high as 0.903 (95% CI, 0.818–0.956) for detecting index lesions in the PZ and 0.789 (95% CI, 0.600–0.908) in the TZ, although with more variability in the TZ.
Fig. 1—
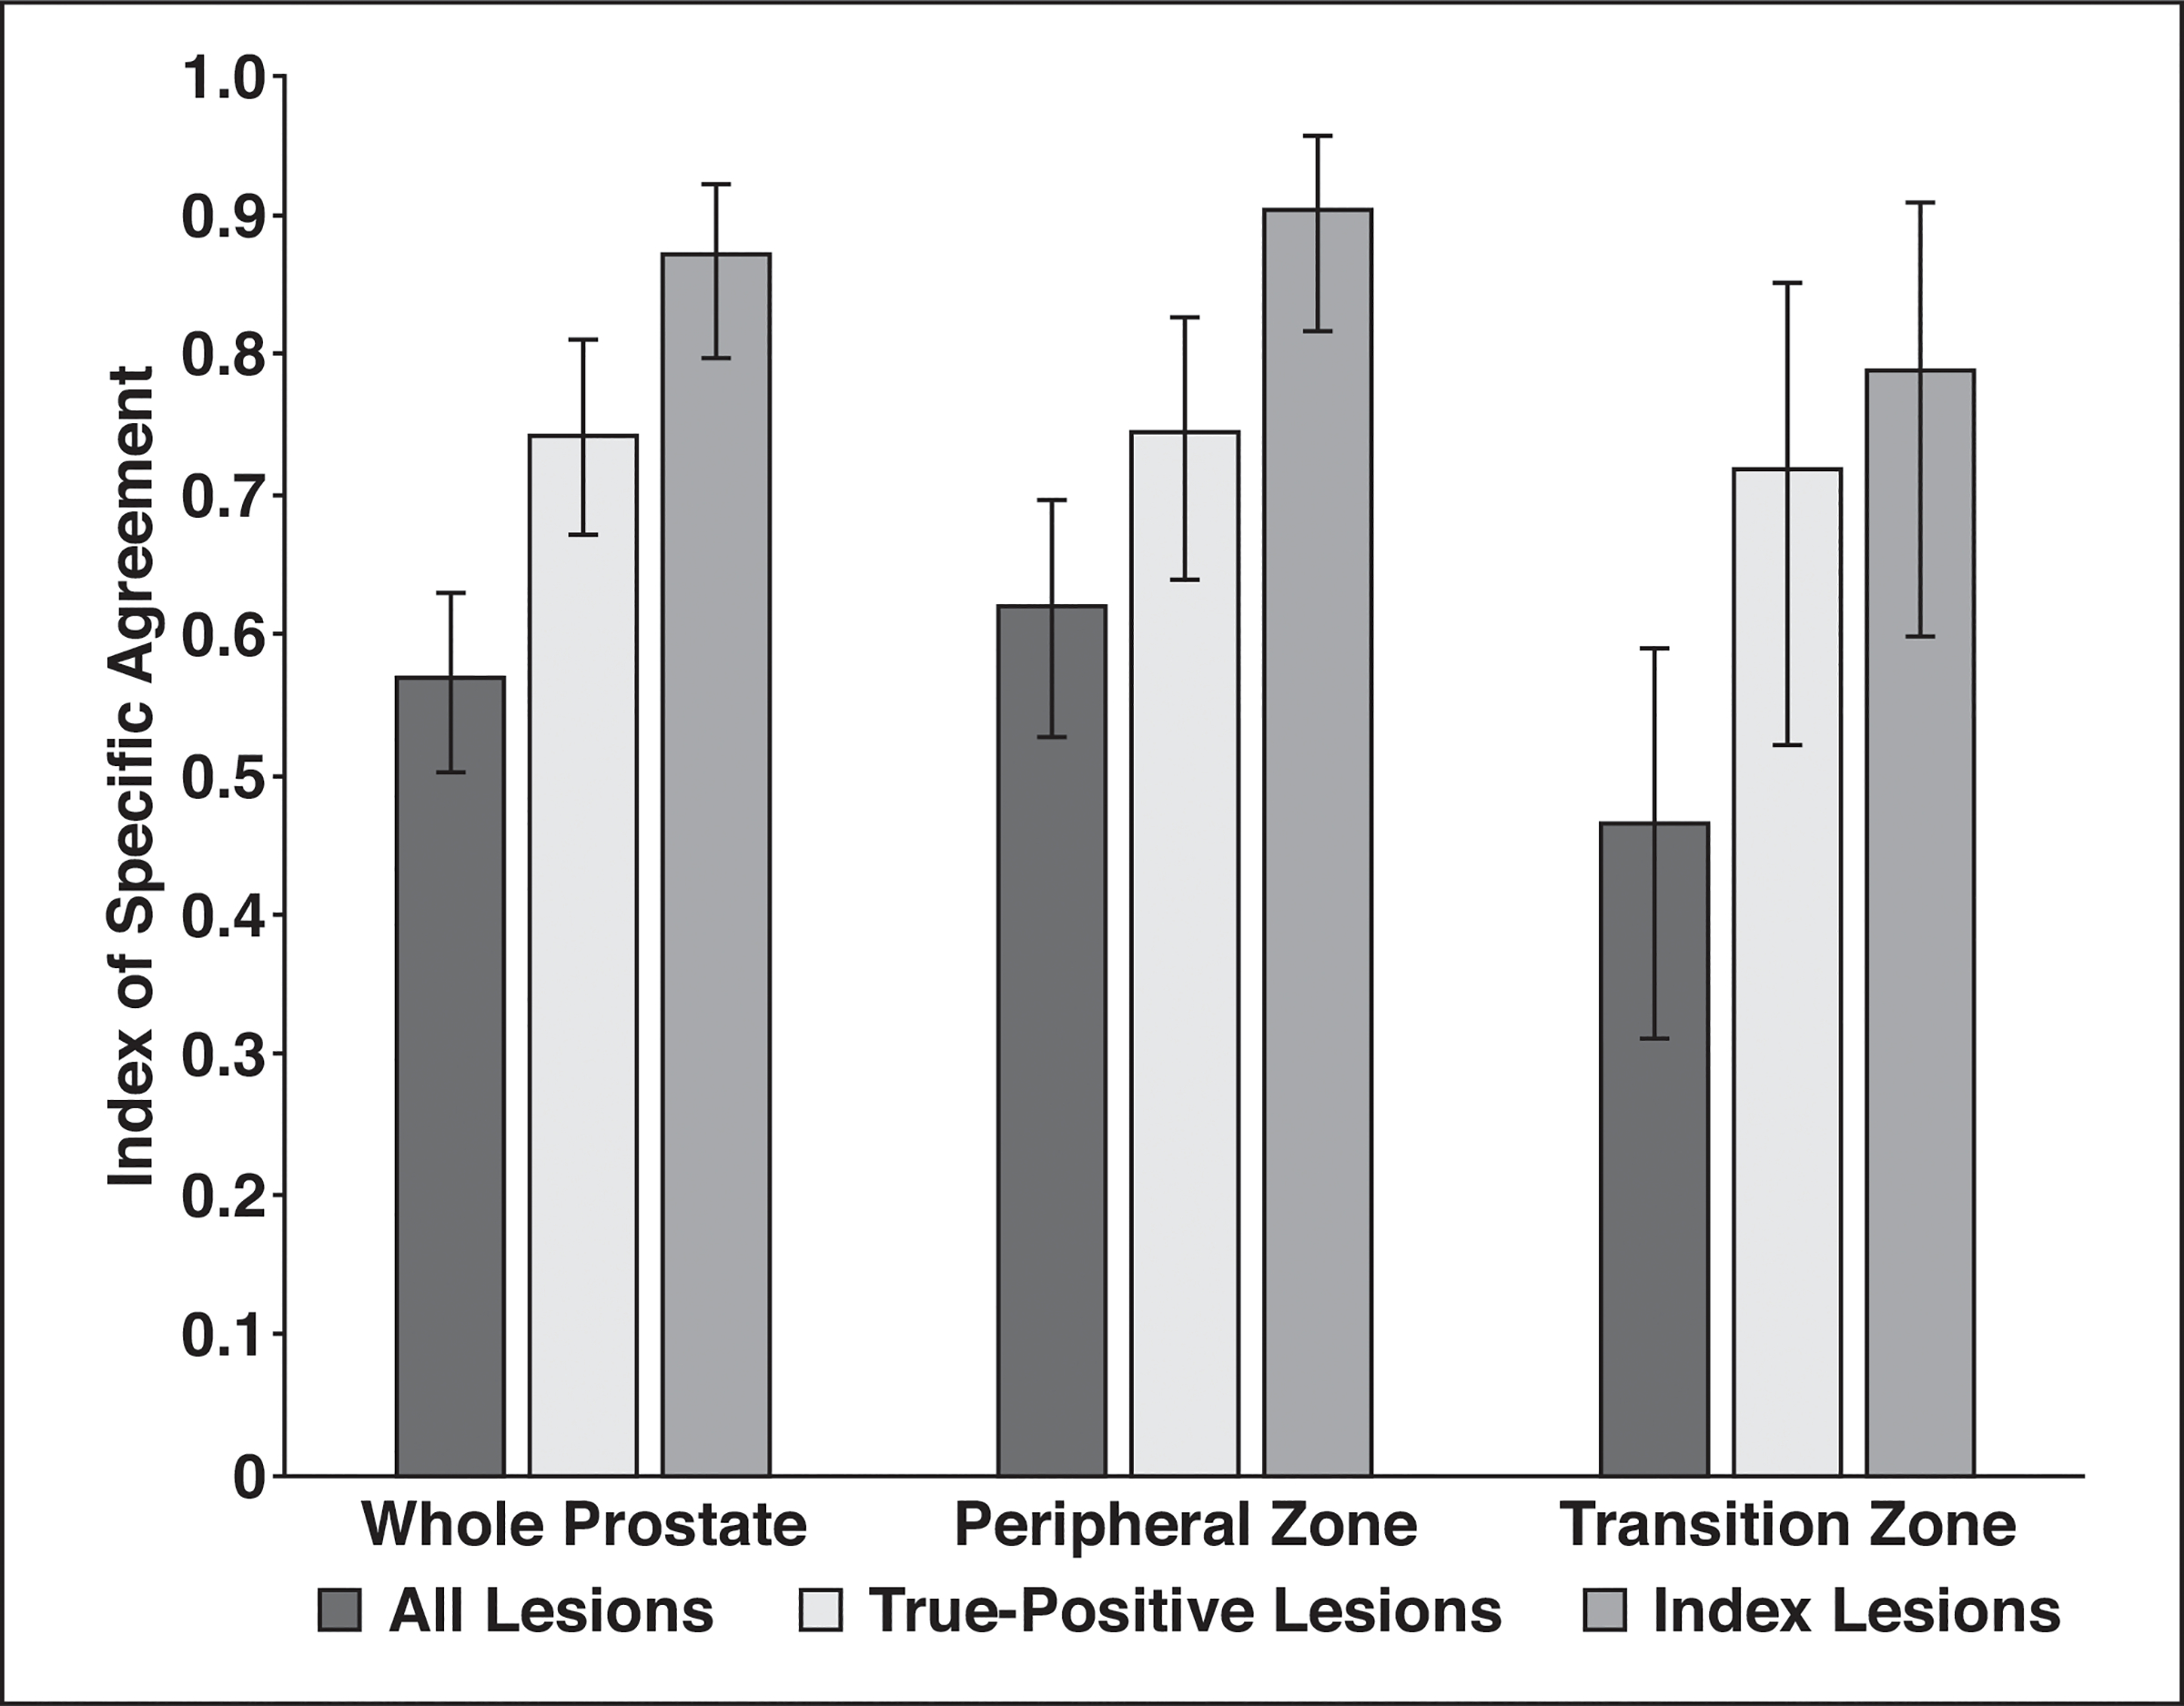
Histogram shows agreement on lesion detection. Readers had excellent agreement for detecting index lesions using Prostate Imaging Reporting and Data System version 2 criteria. More variability for lesion detection was found in transition zone.
Agreement in detecting index lesions by reader experience was excellent for all reader experience categories: 0.907 (95% CI, 0.828–0.971) for highly experienced readers, 0.834 (95% CI, 0.703–0.925) for moderately experience readers, and 0.872 (95% CI, 0.767–0.949) for readers with a low level of experience. Agreement among highly experienced readers and all other readers for index lesion detection was 0.887 (95% CI, 0.820–0.933). Agreement for detecting index lesions was variable in the TZ (0.739; 95% CI, 0.512–0.892) for readers with moderate and low levels of experience versus for highly experienced readers (0.885; 95% CI, 0.701–0.980).
Agreement on Prostate Imaging Reporting and Data System Version 2 Category Assignment
Agreement (kappa statistics and PA) for all readers for assessing lesions with PI-RADSv2 is shown in Table 4. The kappa values were fair (0.371) for category assignment of all lesions and moderate (0.419) for category assignment of index lesions. PA was 0.619 for category assignment of all lesions and 0.677 for index lesions. PA was moderate to substantial for PZ (0.631) and TZ (0.585) lesions.
TABLE 4:
Agreement in Prostate Imaging Reporting and Data System Scoring and Feature Identification at Prostate Multiparametric MRI
| Feature | Score | 95% Confidence Limits |
Agreement Level | |
|---|---|---|---|---|
| Lower | Upper | |||
|
| ||||
| Kappa value for scoring | ||||
| All lesions | 0.371 | 0.238 | 0.513 | Fair |
| Index lesions | 0.419 | 0.238 | 0.595 | Moderate |
| PA for category assignment | ||||
| All lesions | 0.619 | 0.535 | 0.717 | Substantial |
| Index lesions | 0.677 | 0.577 | 0.788 | Substantial |
| All PZ lesions | 0.631 | 0.52 | 0.743 | Substantial |
| Index PZ lesions | 0.690 | 0.575 | 0.834 | Substantial |
| All TZ lesions | 0.585 | 0.435 | 0.771 | Moderate |
| Index TZ lesions | 0.625 | 0.446 | 0.847 | Substantial |
| Kappa value by sequence | ||||
| T2-weighted (all) | 0.312 | 0.189 | 0.435 | Fair |
| T2-weighted (index) | 0.293 | 0.151 | 0.430 | Fair |
| DWI (all) | 0.352 | 0.238 | 0.468 | Fair |
| DWI (index) | 0.327 | 0.183 | 0.467 | Fair |
| DCE (all) | 0.157 | 0.044 | 0.246 | Slight |
| DCE (index) | 0.152 | −0.009 | 0.251 | Slight |
| PA by sequence | ||||
| T2-weighted (all) | 0.515 | 0.43 | 0.623 | Moderate |
| T2-weighted (index) | 0.534 | 0.425 | 0.651 | Moderate |
| DWI (all) | 0.569 | 0.498 | 0.653 | Moderate |
| DWI (index) | 0.586 | 0.495 | 0.682 | Moderate |
| DCE (all) | 0.781 | 0.698 | 0.867 | Substantial |
| DCE (index) | 0.822 | 0.728 | 0.903 | Excellent |
| Kappa value for extraprostatic extension | ||||
| All lesions | 0.334 | 0.188 | 0.456 | Fair |
| Index lesions | 0.356 | 0.204 | 0.484 | Fair |
| PA for extraprostatic extension | ||||
| All lesions | 0.790 | 0.709 | 0.865 | Substantial |
| Index lesions | 0.758 | 0.651 | 0.857 | Substantial |
| Kappa for zone | ||||
| All lesions | 0.746 | 0.610 | 0.843 | Substantial |
| Lesions labeled both excluded | 0.888 | 0.778 | 0.944 | Excellent |
| PA for zone | ||||
| All lesions | 0.886 | 0.830 | 0.936 | Excellent |
| Lesions labeled both excluded | 0.955 | 0.928 | 0.978 | Excellent |
| Assigning dominant lesion | ||||
| Kappa value | 0.461 | 0.315 | 0.607 | Moderate |
| PA | 0.828 | 0.742 | 0.913 | Excellent |
| PZ (PA) | 0.820 | 0.706 | 0.928 | Excellent |
| TZ (PA) | 0.851 | 0.744 | 0.936 | Excellent |
Note—PZ = peripheral zone, TZ = transition zone, PA = proportion of agreement, DCE = dynamic contrast-enhanced.
Agreement for individual PI-RADS category assignments for all readers and by reader experience is shown in Figure 2. All readers had slight agreement on PI-RADS 3 (PA, 0.208; 95% CI, 0.086–0.284) but substantial agreement on PI-RADS category 4 (PA, 0.674; 95% CI, 0.540–0.776) and category 5 (PA, 0.645; 95% CI, 0.450–0.785). Highly (PA, 0.614; 95% CI, 0.451–0.783) and moderately (PA, 0.679; 95% CI, 0.779–0.584) experienced readers reached substantial agreement. Readers with a low level of experience trended toward worse agreement compared with more experienced readers (PA, 0.502; 95% CI, 0.382–0.645).
Fig. 2—
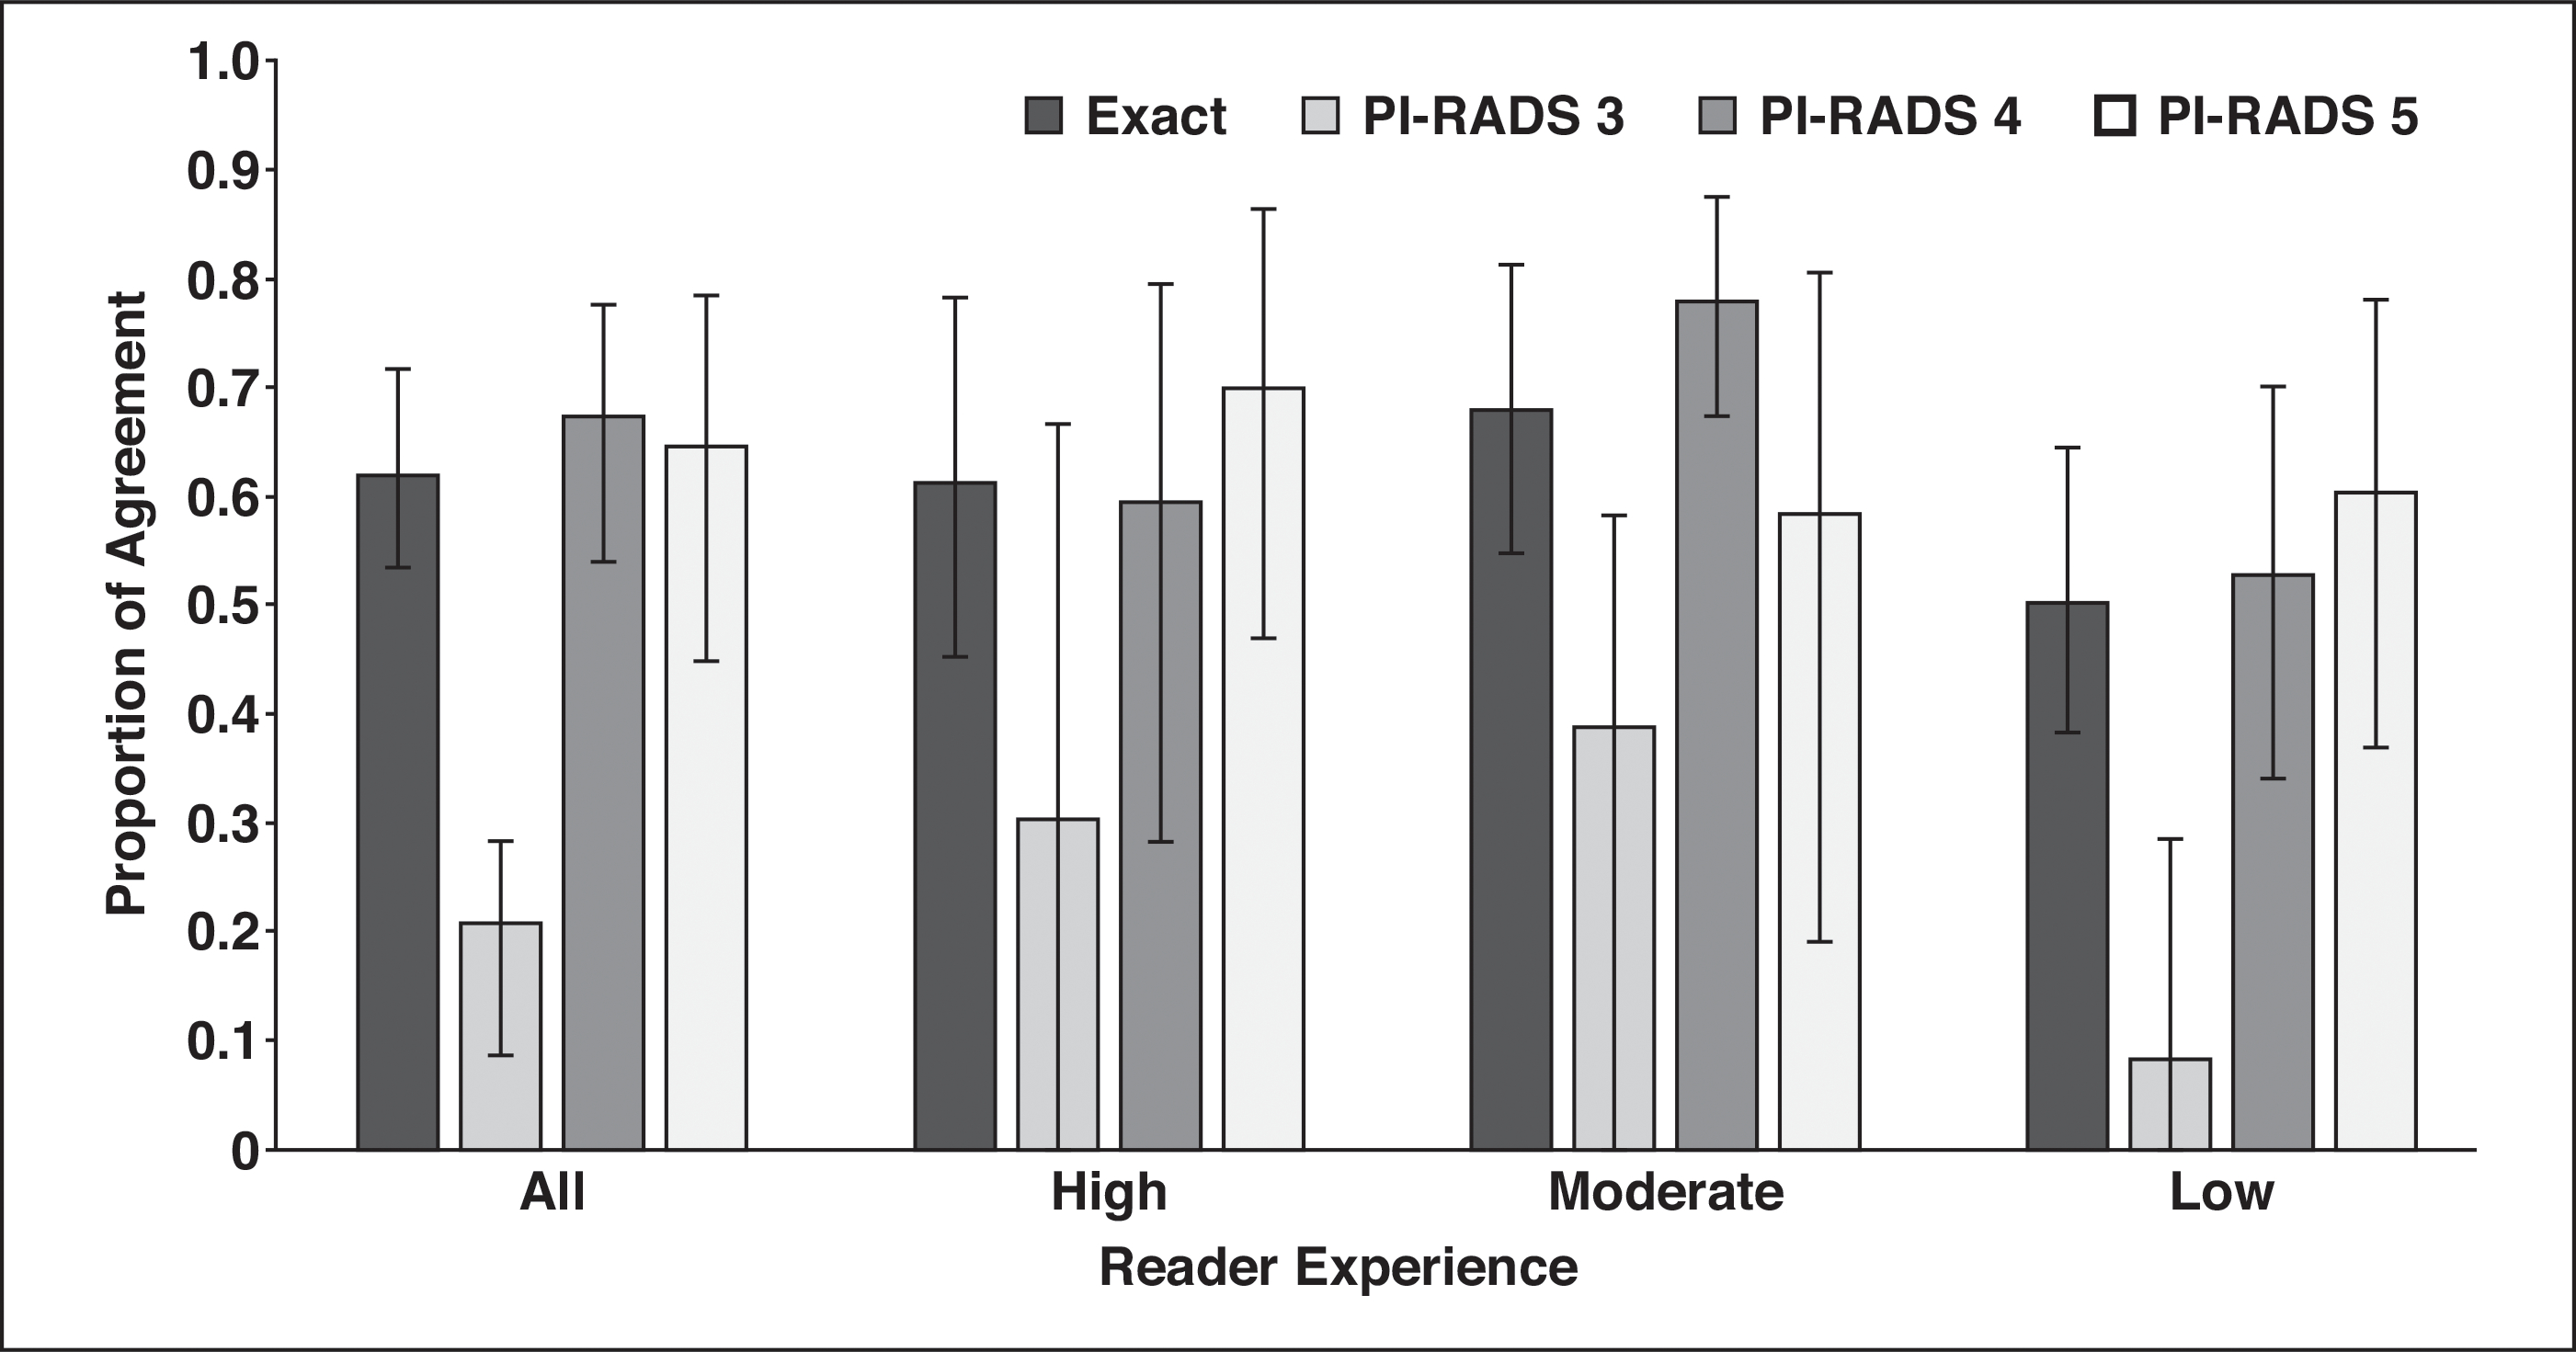
Histogram shows agreement on scoring detected lesions by use of Prostate Imaging Reporting and Data System (PI-RADS) version 2. Readers agreed on exact category assignment of 61% of detected lesions, but assignment of PI-RADS category 3 to lesions had poor agreement across reader experience.
Agreement by Pulse Sequence and Zone
Kappa values for category assignment by sequence showed fair agreement for T2-weighted (0.312) and DWI (0.352) MRI but slight agreement for DCE-MRI (0.157) (Table 4). Importantly, PA on DCE images (0.781) was greater than agreement on T2-weighted (0.515) and DW (0.569) images. Agreement on DCE images was substantial for the PZ (PA, 0.797; 95% CI, 0.700–0.882) and TZ (PA, 0.768; 95% CI, 0.585–0.902). As shown in Table S2, the marginal frequencies for DCE-MRI category assignment were skewed toward positivity, which would give a lower kappa score.
Figure 3 shows agreement for T2-weighted and DW images in the PZ and TZ. Overall category assignment agreement on T2-weighted images in the TZ was moderate (PA, 0.530; 95% CI, 0.359–0.748). Individual PI-RADS category assignments on T2-weighted images in the TZ were fair (PA, 0.366; 95% CI, 0.231–0.438) for PI-RADS 3 and PI-RADS 4 (PA, 0.250; 95% CI, 0.108–0.372) and substantial for PI-RADS 5 (PA, 0.696; 95% CI, 0.321–0.889). Agreement on DWI assignments in the PZ was moderate overall (PA, 0.574; 95% CI, 0.492–0.668). Individual agreement on PI-RADS category assignments was fair (PA, 0.349; 95% CI, 0.194–0.428) for PI-RADS 3 and moderate to substantial for PI-RADS 4 (PA, 0.617; 95% CI, 0.493–0.691) and PI-RADS 5 (PA, 0.584; 95% CI, 0.223–0.792).
Fig. 3—
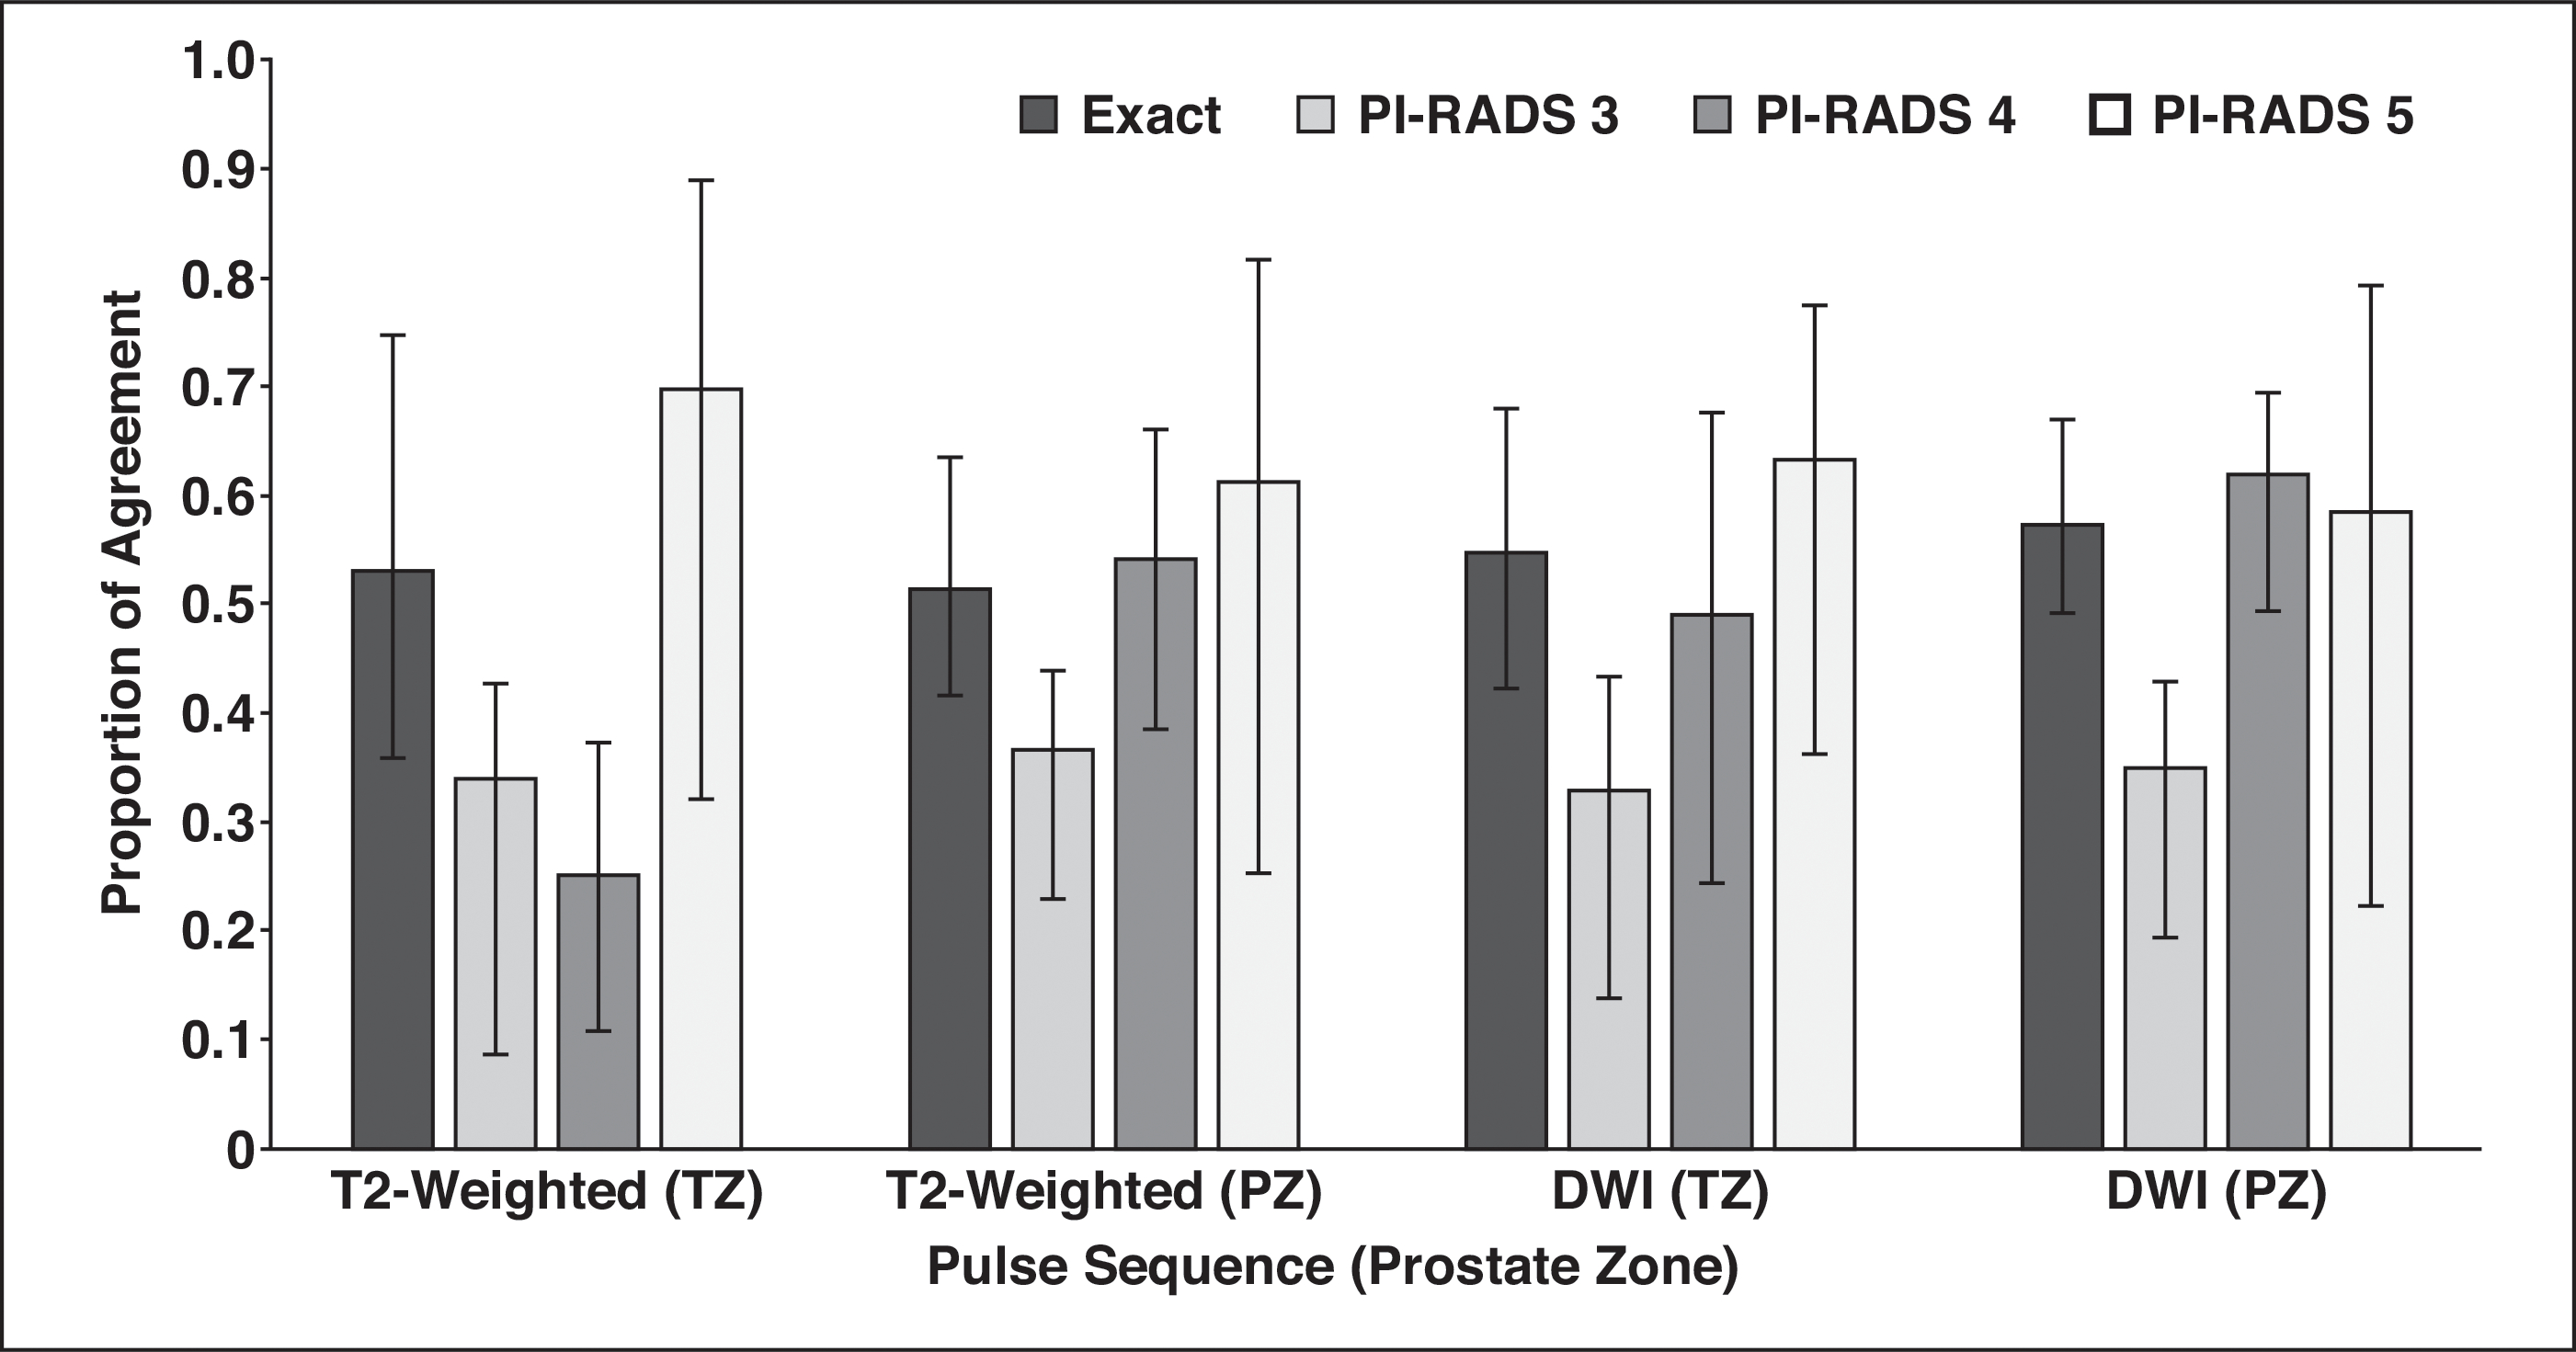
Histogram shows agreement by pulse sequence and Prostate Imaging Reporting and Data System (PI-RADS) category assignment. T2-weighted sequence, which was dominant in transition zone (TZ) according to PI-RADS, had poor agreement for PI-RADS category 4 lesions. PZ = peripheral zone.
Agreement on Zone, Dominant Lesion, and Extraprostatic Extension
Table 4 shows agreement for miscellaneous tasks of PI-RADS category assignment, namely assigning a zone (PZ or TZ), a dominant lesion, and presence of extraprostatic extension. After exclusion of the 18 lesions labeled as both zones, the kappa value for zone was excellent (0.888), as was PA (0.955). The kappa value for assigning extraprostatic extension was fair (0.334) but the PA was substantial (0.790). Similarly, agreement on assigning a dominant lesion was moderate for kappa values (0.461) but excellent for PA (0.828).
Discussion
We found excellent interobserver agreement for index lesion detection across reader experience. This suggests that the PI-RADSv2 criteria are useful for finding clinically significant index lesions across a range of reader experience levels. The high reader agreement for index lesion detection and dominant lesion identification suggests that the approximately 20% of index lesions not detected are either outside the PI-RADSv2 criteria or outside the detection limits of mpMRI. However, readers are unlikely to detect all of the same lesions in any given patient; just over one-half of all lesions were agreed on by pairwise combinations of readers. Thus, false-negative readings will vary among readers.
We found moderately high sensitivity for detection of index lesions (80.9%) that was similar across reader experience. Specificity, however, was highly dependent on reader experience. One of the primary goals of PI-RADSv2 is to detect clinically significant cancer. Our findings suggest that this goal is attained independently of reader experience. The experience dependence of specificity suggests the decision to perform biopsy should be set at a lower threshold for novice prostate mpMRI radiologists and in centers where prostate MRI is an uncommon examination. As a caveat, we did not give previous PSA or biopsy information to readers so that we could isolate PI-RADSv2 category assignment without bias. Such information could improve results. Study results [23–25] suggest that the negative predictive value of mpMRI increases significantly with lower PSA density values. Further accrual of prospective clinical data will likely facilitate validated mpMRI-based nomograms for biopsy decision.
One biopsy decision point centers on the performance of PI-RADS 3 and PI-RADS 4. We observed higher lesion-level sensitivity for PI-RADS ≥ 3 than for PI-RADS ≥ 4 but higher patient-level specificity for PI-RADS ≥ 4. In addition, PI-RADS 3 lesions had low agreement in both the PZ and the TZ across different experience levels. Our previous analysis showed 33.0% probability of clinically significant cancer detection in this cohort for PI-RADS 3 [17]. One possible reason for the poor reproducibility of PI-RADS 3 but persistent cancer detection rates may be the equivocal terms used for this category in the lexicon. Rosenkrantz et al. [8] found in a study with six highly experienced readers that descriptors of “moderately hypointense” had poor agreement. Future iterations of PI-RADS could include an atlas with definitions of PI-RADS 3 to clarify features of these equivocal lesions. However, a PI-RADSv2 category 3 assignment if acted on (i.e., biopsy performed) still has high sensitivity for index lesions.
Previous studies of PI-RADSv2 have addressed interobserver agreement with regard to reaching overall PI-RADS category assignment or recognizing lesion descriptors. For example, Chen et al. [11] asked two experienced readers to detect and assess lesions according to PI-RADSv2 with an interclass correlation coefficient of 0.74 (moderate agreement) for all lesions and 0.67 for the TZ. Multiple other studies have reached similar conclusions: there is moderate agreement among radiologists assessing predetermined prostate mpMRI lesions with PI-RADSv2 [7, 9, 10, 12, 14, 15, 26]. Our results for overall category assignment agree with these findings with a kappa value of 0.419 for category assignment of index lesions, although our study design was somewhat different.
Two studies [8, 13] have delved into the details of where radiologists disagree most on the PI-RADSv2 lexicon. Benndorf et al. [13] evaluated two readers to assess a number of descriptors and PI-RADSv2 assessment category for a set of predetermined lesions. This analysis showed overall poor agreement on the TZ and on T2-weighted descriptor assignment in the PZ. Similarly, we found more variability in agreement for the TZ. One important finding was the low level of agreement on T2-weighted category assignment of PI-RADS 4 lesions in the TZ. The descriptor for moderately hypointense was also challenging for readers to agree on in the study conducted by Rosenkrantz et al. [8]. Future iterations of PI-RADS will have to clarify this descriptor, perhaps with a pictorial atlas.
The role of a DCE sequence in prostate mpMRI remains controversial [19, 27]. Two studies [17, 28] validated the use of abnormal DCE-MRI findings in the PZ to upgrade PI-RADS 3 lesions to PI-RADS 4. Rosenkrantz et al. [8], however, also found agreement suffered in category assignment of the PZ on DCE images. Our results of a low kappa value and high PA give a conflicting conclusion on the agreement of DCE-MRI assessment. We found a marginal frequency of 77.2% of all lesions called DCE positive. A weakness of kappa statistics is susceptibility to variable marginal frequencies [8, 12, 22]. However, a binary decision point is subject to agreement by chance, which is accounted for in kappa statistics. Our previous analysis of DCE positivity showed an odds ratio of 2.0 for DCE-positive lesions’ being pathologically positive compared with DCE-negative lesions [17]. This suggests agreement on DCE images is not due to chance alone but that readers have high agreement on DCE-MRI assessment.
This study had limitations. First, all patients with cancer underwent prostatectomy, and this patient population may have disease that is more readily detectible. In addition, rates of positivity may differ from those of a biopsy population because added degrees of variability are associated with targeted biopsy. We attempted to control for detection bias by selecting a group of patients with previously normal mpMRI findings and without positive biopsy results. However, there remains a possibility that these patients had undetected prostate cancer. Second, all images originated from a single institution and were acquired with a single MRI system. One advantage of this is that we were able to test PI-RADSv2 without an additional variable of image quality. In reality, however, different systems and imaging parameters may introduce additional variability to PI-RADSv2 category assignment. Fortunately, radiologists generally read studies only from their own institutions, so such variability is less than if they were asked to read studies from multiple institutions. Finally, this study was conducted as part of a larger study evaluating the efficacy of computer-aided diagnosis and therefore was not powered to the endpoints presented in this article.
Conclusion
Radiologists across reader experience levels using PI-RADSv2 for prostate cancer mpMRI had excellent agreement for detecting index lesions, moderate agreement for PI-RADS category assignment, and good sensitivity for index lesions. Specificity was experience dependent. PI-RADSv2 category assignment was limited for all PI-RADS 3 lesions and for PI-RADS 4 lesions in the TZ. DCE-MRI category assignment had good agreement. Future pictorial atlases and nomograms can clarify assessment and biopsy utility for PI-RADS 3 and 4 lesions.
Supplementary Material
Footnotes
The opinions and assertions contained herein are the private views of the authors and are not to be construed as official or as representing the views of the National Institutes of Health or the Walter Reed National Medical Center.
Supplemental Data Available online at www.ajronline.org.
References
- 1.Siddiqui MM, Rais-Bahrami S, Turkbey B, et al. Comparison of MR/ultrasound fusion-guided biopsy with ultrasound-guided biopsy for the diagnosis of prostate cancer. JAMA 2015; 313:390–397 [DOI] [PMC free article] [PubMed] [Google Scholar]
- 2.Filson CP, Natarajan S, Margolis DJ, et al. Prostate cancer detection with magnetic resonance-ultrasound fusion biopsy: the role of systematic and targeted biopsies. Cancer 2016; 122:884–892 [DOI] [PMC free article] [PubMed] [Google Scholar]
- 3.Yaxley AJ, Yaxley JW, Thangasamy I, Ballard E, Pokorny M. Comparison between target MRI ingantry and cognitive target transperineal or transrectal guided prostate biopsies for PIRADS 3–5 MRI lesions. BJU Int 2017; 120 (suppl 3):43–50 [DOI] [PubMed] [Google Scholar]
- 4.Rosenkrantz AB, Ayoola A, Hoffman D, et al. The learning curve in prostate MRI interpretation: self-directed learning versus continual reader feedback. AJR 2017; 208:[web]W92–W100 [DOI] [PubMed] [Google Scholar]
- 5.American College of Radiology. Prostate Imaging Reporting and Data System version 2.0 www.acr.org/Quality-Safety/Resources/PIRADS. Published 2015. Accessed March 11, 2019
- 6.Barentsz JO, Weinreb JC, Verma S, et al. Synopsis of the PI-RADS v2 guidelines for multiparametric prostate magnetic resonance imaging and recommendations for use. Eur Urol 2016; 69:41–49 [DOI] [PMC free article] [PubMed] [Google Scholar]
- 7.Muller BG, Shih JH, Sankineni S, et al. Prostate cancer: interobserver agreement and accuracy with the revised Prostate Imaging Reporting and Data System at multiparametric MR imaging. Radiology 2015; 277:741–750 [DOI] [PMC free article] [PubMed] [Google Scholar]
- 8.Rosenkrantz AB, Ginocchio LA, Cornfeld D, et al. Interobserver reproducibility of the PI-RADS version 2 lexicon: a multicenter study of six experienced prostate radiologists. Radiology 2016; 280:793–804 [DOI] [PMC free article] [PubMed] [Google Scholar]
- 9.Baldisserotto M, Neto EJ, Carvalhal G, et al. Validation of PI-RADS v.2 for prostate cancer diagnosis with MRI at 3T using an external phased-array coil. J Magn Reson Imaging 2016; 44:1354–1359 [DOI] [PubMed] [Google Scholar]
- 10.Purysko AS, Bittencourt LK, Bullen JA, Mostardeiro TR, Herts BR, Klein EA. Accuracy and interobserver agreement for Prostate Imaging Reporting and Data System, version 2, for the characterization of lesions identified on multiparametric MRI of the prostate. AJR 2017; 209:339–349 [DOI] [PubMed] [Google Scholar]
- 11.Chen F, Cen S, Palmer S. Application of Prostate Imaging Reporting and Data System version 2 (PI-RADS v2): interobserver agreement and positive predictive value for localization of intermediate- and high-grade prostate cancers on multiparametric magnetic resonance imaging. Acad Radiol 2017; 24:1101–1106 [DOI] [PubMed] [Google Scholar]
- 12.Greer MD, Brown AM, Shih JH, et al. Accuracy and agreement of PIRADSv2 for prostate cancer mpMRI: a multireader study. J Magn Reson Imaging 2017; 45:579–585 [DOI] [PMC free article] [PubMed] [Google Scholar]
- 13.Benndorf M, Hahn F, Krönig M, et al. Diagnostic performance and reproducibility of T2w based and diffusion weighted imaging (DWI) based PI-RADSv2 lexicon descriptors for prostate MRI. Eur J Radiol 2017; 93:9–15 [DOI] [PubMed] [Google Scholar]
- 14.Flood TF, Pokharel SS, Patel NU, Clark TJ. Accuracy and interobserver variability in reporting of PI-RADS version 2. J Am Coll Radiol 2017; 14:1202–1205 [DOI] [PubMed] [Google Scholar]
- 15.Glazer DI, Mayo-Smith WW, Sainani NI, et al. Interreader agreement of Prostate Imaging Reporting and Data System version 2 using an inbore MRI-guided prostate biopsy cohort: a single institution’s initial experience. AJR 2017; 209:[web]W145–W151 [DOI] [PMC free article] [PubMed] [Google Scholar]
- 16.Greer MD, Lay N, Shih JH, et al. Computer-aided diagnosis prior to conventional interpretation of prostate mpMRI: an international multi-reader study. Eur Radiol 2018; 28:4407–4417 [DOI] [PMC free article] [PubMed] [Google Scholar]
- 17.Greer MD, Shih JH, Lay N, et al. Validation of the dominant sequence paradigm and role of dynamic contrast-enhanced imaging in PI-RADS version 2. Radiology 2017; 285:859–869 [DOI] [PMC free article] [PubMed] [Google Scholar]
- 18.Zhang L, Tang M, Chen S, Lei X, Zhang X, Huan Y. A meta-analysis of use of Prostate Imaging Reporting and Data System Version 2 (PI-RADS V2) with multiparametric MR imaging for the detection of prostate cancer. Eur Radiol 2017; 27:5204–5214 [DOI] [PubMed] [Google Scholar]
- 19.Scialpi M, Rondoni V, Aisa MC, et al. Is contrast enhancement needed for diagnostic prostate MRI? Transl Androl Urol 2017; 6:499–509 [DOI] [PMC free article] [PubMed] [Google Scholar]
- 20.Shah V, Pohida T, Turkbey B, et al. A method for correlating in vivo prostate magnetic resonance imaging and histopathology using individualized magnetic resonance-based molds. Rev Sci Instrum 2009; 80:104301. [DOI] [PMC free article] [PubMed] [Google Scholar]
- 21.Shih JH, Greer MD, Turkbey B. The problems with the kappa statistic as a metric of interobserver agreement on lesion detection using a third-reader approach when locations are not prespecified. Acad Radiol 2018; 25:1325–1332 [DOI] [PubMed] [Google Scholar]
- 22.Landis JR, Koch GG. The measurement of observer agreement for categorical data. Biometrics 1977; 33:159–174 [PubMed] [Google Scholar]
- 23.Distler FA, Radtke JP, Bonekamp D, et al. The value of PSA density in combination with PI-RADS™ for the accuracy of prostate cancer prediction. J Urol 2017; 198:575–582 [DOI] [PubMed] [Google Scholar]
- 24.Washino S, Okochi T, Saito K, et al. Combination of Prostate Imaging Reporting and Data System (PI-RADS) score and prostate-specific antigen (PSA) density predicts biopsy outcome in prostate biopsy naïve patients. BJU Int 2017; 119:225–233 [DOI] [PubMed] [Google Scholar]
- 25.Niu XK, He WF, Zhang Y, et al. Developing a new PI-RADS v2-based nomogram for forecasting high-grade prostate cancer. Clin Radiol 2017; 72:458–464 [DOI] [PubMed] [Google Scholar]
- 26.Lim CS, McInnes MD, Lim RS, et al. Prognostic value of Prostate Imaging and Data Reporting System (PI-RADS) v. 2 assessment categories 4 and 5 compared to histopathological outcomes after radical prostatectomy. J Magn Reson I maging 2017; 46:257–266 [DOI] [PubMed] [Google Scholar]
- 27.Rud E, Baco E. Re: Weinreb Jeffrey C., Barentsz Jelle O., Choyke Peter L., et al. PI-RADS Prostate Imaging—Reporting and Data System: 2015, version 2. Eur Urol 2016;69:16–40: is contrast-enhanced magnetic resonance imaging really necessary when searching for prostate cancer? Eur Urol 2016; 70:e136. [DOI] [PubMed] [Google Scholar]
- 28.Druskin SC, Ward R, Purysko AS, et al. Dynamic contrast enhanced MRI improves classification of prostate lesions: a study of pathologic outcomes on targeted prostate biopsy. J Urol 2017; 198:1301–1308 [DOI] [PubMed] [Google Scholar]
Associated Data
This section collects any data citations, data availability statements, or supplementary materials included in this article.