Abstract
It is well known that changes in the starting powder can have a significant impact on the laser powder bed fusion process and subsequent part performance. Relationships between the powder particle size distribution and powder performance such as flowability and spreadability are generally known; however, links to part performance are not fully established. This study attempts to more precisely isolate the effect of particle size by using three customized batches of 17-4 PH stainless steel powders with small shifts in particle size distributions having non-intersecting cumulative size distributions, designated as Fine, Medium, and Coarse. It is found that the Fine powder has the worst overall powder performance with poor flow and raking during spreading while the Coarse powder has the best overall flow. Despite these differences in powder performance, the microstructures (i.e., porosity, grain size, phase, and crystallographic texture) of the built parts using the same process parameters are largely the same. Furthermore, the Medium powder produced parts with the highest mechanical properties (i.e., hardness and tensile strength) while the Fine and Coarse powders produced parts with effectively identical mechanical properties. Parts with good static mechanical properties can be produced from powders with a wide range of powder performance.
Keywords: laser powder bed fusion, electron backscatter diffraction, martensite, precursor material qualification, tensile properties
Graphical Abstract:
1. Introduction
Many additive manufacturing (AM) technologies rely on powders for feedstock material. Changes to the powder including chemistry, powder size, morphology, etc. from different batches, vendors, or reuse may impact the manufacturing process. Thus, there are significant measurement science needs for AM powder characterization and performance [1–6]. Besides chemistry, one of the fundamental powder characteristics is the particle size distribution (PSD). Literature studying the effects of PSD on powder and part performance have been summarized in recent reviews [3, 5, 7]. For the purpose of this study we focus on findings for metals-based laser powder bed fusion (LPBF). There are some general notions about what makes a good or acceptable powder for LPBF. One criterion is the powder should have a high, uniform packing density in the powder bed. Packing density is typically determined by measurements of undisturbed powder and agitated powder (e.g., apparent and tapped density), and the difference is quantified by ratios or indexes (e.g., Hausner and Carr) which are empirically correlated with good and bad performing powders. It is generally accepted that achieving a uniform and consistent packing density is linked to flowability and spreadability [3, 8, 9]. However, there is little consensus on how to best to define and quantify these properties. Funnel flow tests (e.g., Hall and Carney), powder rheometers, and rotating drum devices are most commonly applied to quantify flowability [10–12]. There are a lack of common tests and metrics to describe spreadability [13–15]. Additionally the spreading mechanism influences the powder performance (e.g., blade versus roller systems [16]). Vock et al. [3] summarize three general findings consistent across the literature: a narrower PSD increases flowability, larger particles improve flowability, and increasing moisture content decreases flowability.
Links between powder performance and part performance are difficult to surmise. Here we focus on mechanical properties. Often there may be differences in powder performance with no change in mechanical properties or there may be changes in mechanical properties unrelated to powder performance (e.g., solely attributed to changes in chemical composition) [3, 8, 17–20]. It should be noted that the powder performance has an effect on the window of acceptable process parameters; however, there can be a wide window of process parameters which produces similar results for different powders [19, 21–23]. Relationships between final part density, PSD, and flowability have been observed: higher density correlates with wider PSDs, finer (i.e., smaller particle size) PSDs, more spherical powders, and increased flowability [3, 5, 8, 9, 23, 24]. Relationships between mechanical properties, PSD, and flowability are fewer: increased mechanical properties occur for narrower PSDs and increased flowability [3, 5, 25, 26]. These relationships are based on relative changes in the PSD and require compromises. For example, a fine, narrow PSD, expected to have good density and mechanical properties, may in fact have poor density and properties because of decreased flowability. One aspect of powder performance not discussed yet that may provide a bridge between powder and part performance is the powder-laser interaction, as determined by such properties as laser absorptivity and powder bed thermal conductivity [3]. However, it is unclear how important these are to the final part performance (e.g., [27]).
Isolating the effect of powder performance on mechanical properties is difficult because additive manufacturing appears to be more sensitive to variations in chemical composition than traditional manufacturing processes. The material used in this study, stainless steel (17-4), exhibits a wide range of mechanical properties [28–31]. LPBF 17-4 is not always fully martensitic like traditionally manufactured 17-4 [28, 30–39]. Depending on the chemistry and processing history, the material may contain significant amounts of retained austenite. The Cr and Ni equivalent values on the Schaffner diagram [36, 40], which account for the influence of several elements, have been used to explain why some powders result in high amounts of retained austenite. Higher Ni equivalent values and lower Cr/Ni equivalent ratios indicate austenite will be more stable. Higher nitrogen content in nitrogen atomized powders, resulting in a higher Ni equivalent value, is believed to be the main cause of high amounts of retained austenite in LPBF 17-4 [32–36]. Quantifying the amount of retained austenite is challenging using surface measurement techniques because the austenite transforms to martensite from mechanical loading including grinding and polishing. Phase volume fractions are further complicated by the low c/a ratio of the crystal lattice in body centered tetragonal (BCT) martensite, which appears nearly body centered cubic (BCC) from X-ray and electron backscatter diffraction (XRD and EBSD, respectively). Some have reported that AM 17-4 is primarily BCC-Fe (δ-Ferrite) [31, 41–43] based on secondary EBSD signals such as image quality. This type of analysis has been used in traditionally manufactured multi-phase steels [44, 45] where a higher dislocation density along with fine sub-grain microstructures of martensite results in a lower image quality compared to δ-Ferrite. However, some caution should be used with such techniques, because martensitic microstructures are hierarchical with varying dislocation densities depending on the transformation sequence. This can result in different categories of martensite within a single material (e.g., coarse and traditional lathes) [46]. The amount of coarse and fine BCC/BCT grains varies within AM 17-4 depending on chemistry and thermal history [42, 47]. Further work is required to understand martensitic transformations in AM 17-4.
There are a couple of studies on LPBF 17-4 which focused on powder size and morphology effects on the part performance [21, 43]. Irrinki et al. [21] studied three water atomized powders with varying size distributions compared to a single gas atomized powder. They found the process (i.e., energy density) could be tuned to produce similar microstructures, densities, strength, and hardness with slightly lower elongation to failure for the water atomized powders compared to the gas atomized powder. Higher energy densities were required to produce dense parts for the water atomized powders compared to the gas atomized powders, and the energy density required to produce dense parts increased with increasing powder size for the water atomized powder [21]. Auguste et al. [43] studied two gas atomized powders with one powder having a narrower size distribution. They saw differences in mechanical properties that they attributed to differences in microstructure (coarse and fine grained microstructures). The differences in microstructure were then attributed to differences in chemical composition which caused different solidification paths and phase transformations. The influence of the powder size distribution was not discussed as a contributor to the different in part performance.
The current study aims to provide additional experimental data to draw links between powder performance and mechanical properties. The study differs from other studies in that it focuses on moderate shifts in the PSD with powders that have non-intersecting cumulative size distributions rather than powders from different manufacturing processes, different vendors, significant changes in the distribution shape, and/or large changes in the PSD. The intention is to isolate the effect of particle size on powder performance and part performance.
2. Materials and Methods
2.1. Intrinsic powder properties
Three batches of stainless steel (17-4), argon atomized powders were procured from a commercial vendor for this study with non-intersecting cumulative particle size distributions. These three batches are referred to as Fine (F), Medium (M), and Coarse (C) based on their relative particle size distributions as shown in Fig. 1. The Fine, Medium, and Coarse powders come from three separate lots: US80459, UK5060, and US80356, respectively. Particle size distributions were measured using a commercially available dynamic image analysis (DIA) with a measurement resolution of 1 μm. The instrument complies to ISO 13322-2. Multiple samples of powders were prepared using a rotary riffler. In one case, for powder designated as OEM 2, the powder sample was simply scooped from the container and measured. A dry dispersion is used and the particle size is reported as Xc min, which is the minimum of all the maximum chord particle projections. In addition, two original equipment manufacturer (OEM) powders were also measured for comparison in Fig. 1. These two powders are also stainless steel (17-4) atomized with two different gases: argon (OEM 1) and nitrogen (OEM 2). OEM 2 powder spans the Medium and Coarse cumulative distributions, and OEM 1 powder is coarser than the custom Coarse cumulative distribution with a smaller span than OEM 2. The 10th, 50th, and 90th percentiles of the cumulative particle size distribution (based on volume fraction) are given in Table 1 as d10, d50, and d90, respectively. Three measurements of OEM 1 were performed to capture the repeatability of the DIA measurements (also listed in Table 1). Whiting et al. [48] recently demonstrated a method to determine the uncertainty of DIA measurements using SEM analysis. They determined the systematic error ± the uncertainty of powder OEM 2 equivalent circular area diameter d10, d50, and d90 to be 0.06 ± 0.58 μm, 2.13 ± 0.50 μm, and 5.04 ± 0.82 using the same instrument used in this study [48]. Based on this, all five powders are significantly different from each other in their PSD.
Fig. 1.
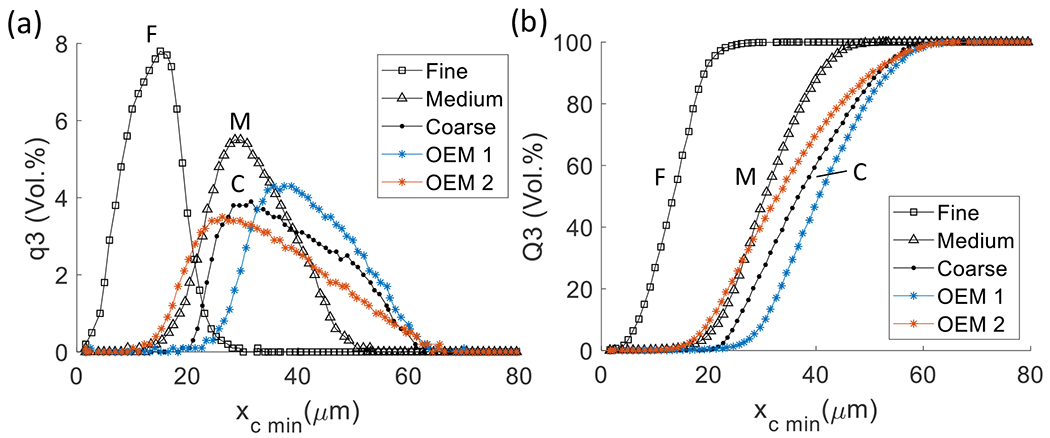
(a) frequency distribution of powder size based on volume fraction, q3, (b) cumulative distribution of powder size based on volume fraction, Q3. Particle size is the shortest chord of the measured set of maximum chords, xc min.
Table 1.
Particle size analysis for Fine, Medium, Coarse, and OEM powders. The span is calculated as (d90 – d10)/d50. Sphericity is calculated as 4πA/P2 where A is the area of the particle projection and P is the perimeter of the particle projection. Aspect ratio is calculated as the breadth to length ratio or xc min over xFe max. Three samples of OEM 1 (a, b, c) were measured to show the repeatability of DIA measurements.
| Fine | Medium | Coarse | OEM 2 | OEM 1a | OEM 1b | OEM 1c | |
|---|---|---|---|---|---|---|---|
| d10 (μm) | 7.0 | 21.5 | 25.1 | 20.0 | 29.9 | 30.0 | 29.8 |
| d50 (μm) | 13.3 | 29.8 | 36.1 | 32.2 | 39.8 | 40.1 | 39.9 |
| d90 (μm) | 19.1 | 39.8 | 50.8 | 49.7 | 52.6 | 53.0 | 52.9 |
| Span | 0.91 | 0.62 | 0.71 | 0.92 | 0.57 | 0.57 | 0.58 |
| Sphericity | 0.92 | 0.89 | 0.91 | 0.91 | 0.92 | 0.92 | 0.92 |
| Aspect Ratio | 0.86 | 0.83 | 0.87 | 0.86 | 0.87 | 0.87 | 0.87 |
In addition to size distributions, the morphology of the custom powders was qualitatively analyzed with SEM imaging and measured with DIA. The powders are all primarily spherical as shown in Fig. 2 with average sphericities ranging from 0.89 to 0.92 (Table 1). The Medium powder appears to have a population of elongated particles compared to the Fine and Coarse powders. This observation is supported by the DIA measurements which show that the Medium powder has a lower average aspect ratio over the d10 to d90 size range (Fig. 2d).
Fig. 2.
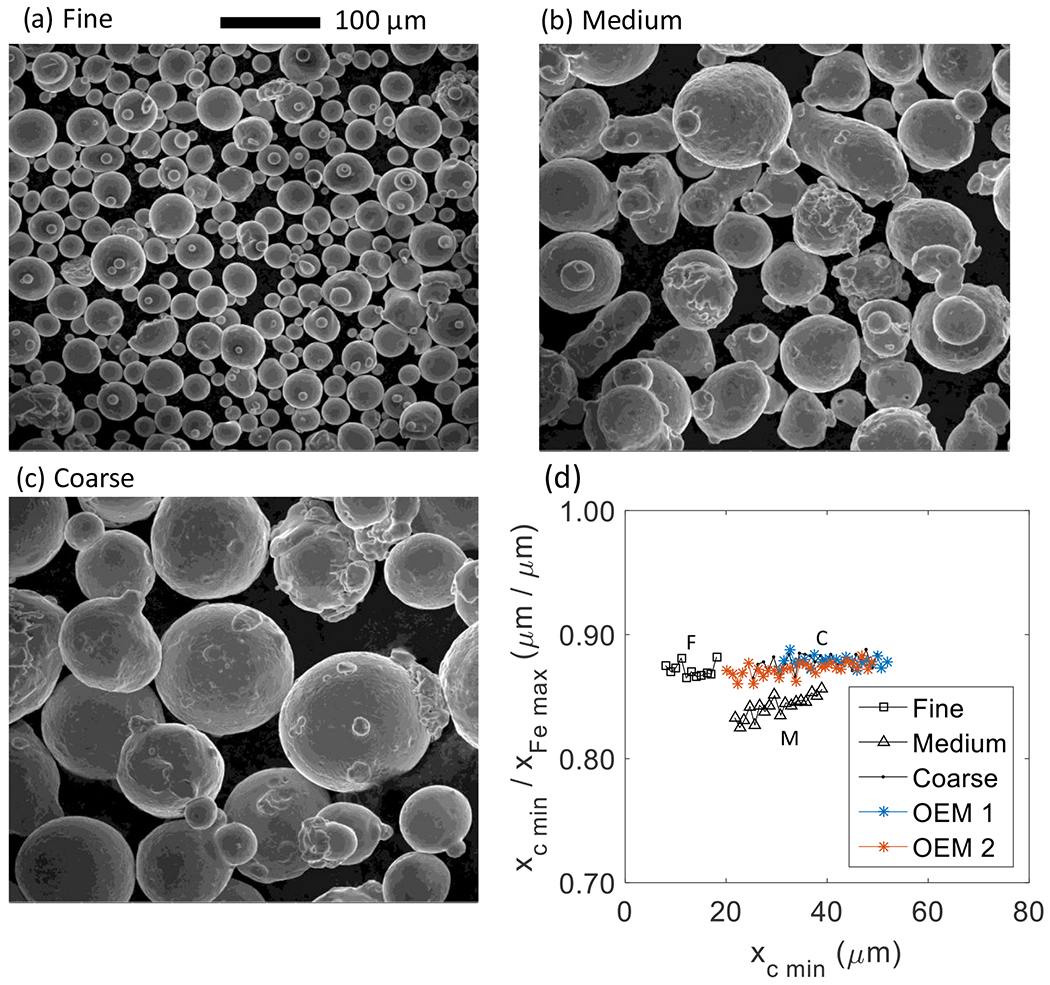
Representative SEM images of (a) Fine, (b) Medium, and (c) Coarse powders. (d) DIA measurements of aspect ratio defined as the ratio of the minimum chord of all the maximum chords (xc min) over the maximum Feret diameter (xFe max)
The skeletal density of the custom powders was measured with a He pycnometer. Three samples of approximately five grams each were measured for each powder type. Each five-gram sample was measured ten times. The standard deviation of the three samples per powder was determined by quadrature from the standard deviation of the 10 measurements per sample. The confidence intervals for p = 95 % were determined using n = 3 (three five gram samples). A solid density of 7.8 g cm−3 was used to determine the relative density and porosity [10, 49, 50]. Note that austenite is denser than martensite (e.g., [51]). If there is significant difference in the amount of these phases in the powder, then their solid densities will be slightly different compared to each other. Figure 3a shows that the Medium powder is close to having a significantly lower density; however, the confidence intervals overlap with the Fine and Coarse powders. The low skeletal densities for all three powders indicate there may be entrapped gas with internal porosity on the order of 2 % to 3 %, Fig. 3b. This was qualitatively confirmed by mounting and metallographically preparing powders that showed internal porosity as shown in Fig. 4. It also qualitatively appears that the Medium powder has a higher number of internal pores.
Fig. 3.
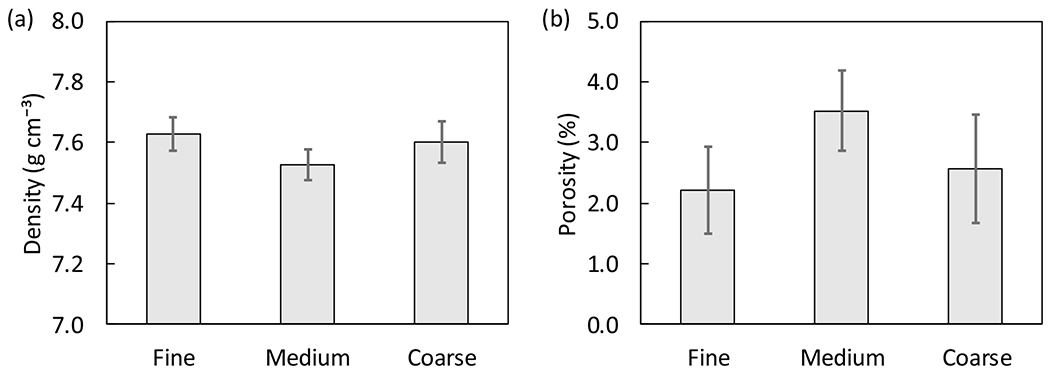
(a) average powder skeletal density and (b) estimated average internal porosity from He pycnometry. A theoretical density of 7.8 g cm−3 was assumed for porosity estimates. Confidence interval estimates are for p = 95 % and n = 3.
Fig. 4.
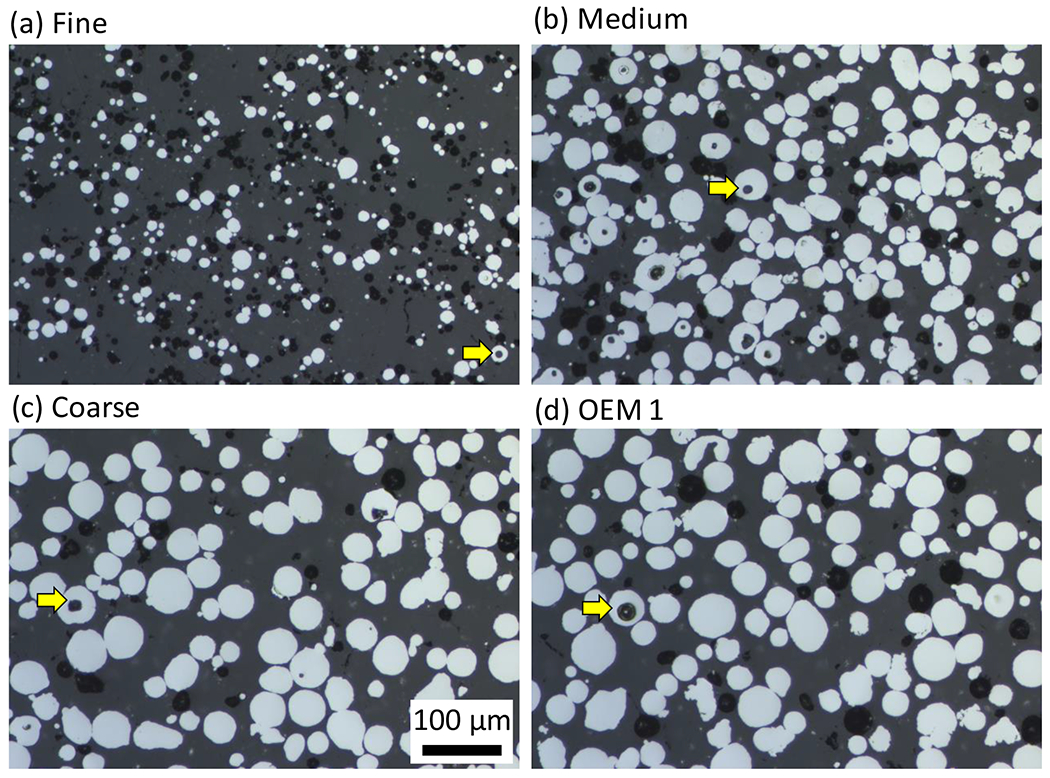
Optical cross-sections of powder showing internal porosity for (a) Fine, (b) Medium, (c) Coarse, and (d) OEM 1 powders. Arrows point to pores. Scale bar is the same for each image.
Lastly, the chemical compositions of the three custom powders and two OEM powders are listed in Table 2. Argon atomized powder (Fine, Medium, Coarse, and OEM 1) typically contains low amounts of nitrogen compared to nitrogen atomized powder (OEM 2). As mentioned in the introduction, higher nitrogen results in a high volume fraction of retained austenite in the as-built microstructure. The Cr/Ni equivalent ratios [36, 40] for the powders in Table 2 are 3.9, 3.0, 3.5, 3.7, and 1.7 for Fine, Medium, Coarse, OEM 1, and OEM 2, respectively. It is not apparent if the small differences in Cr/Ni ratios between the Fine, Medium, and Coarse powders have a significant effect on the microstructure.
Table 2.
Chemical compositions of virgin powder. All powders meet UNS S17400 according to ASTM A564/A564M - 19a [52]. Values are in mass fraction (%). Elements were measured using inductively coupled plasma (ICP) except for N and O which were measured using inert gas fusion and C and S which were measured using combustion analysis.
| Units: mass fraction (%) | C | Nb | Cr | Cu | Mn | N | Ni | O | P | S | Si |
|---|---|---|---|---|---|---|---|---|---|---|---|
| Fine | 0.02 | 0.22 | 15.7 | 3.41 | 0.04 | 0.009 | 3.38 | 0.074 | 0.002 | 0.005 | 0.59 |
| Medium | 0.02 | 0.33 | 16.8 | 4.51 | 0.22 | 0.027 | 4.27 | 0.042 | 0.020 | 0.002 | 0.35 |
| Coarse | 0.02 | 0.21 | 16.7 | 3.56 | 0.03 | 0.008 | 4.21 | 0.034 | 0.002 | 0.005 | 0.53 |
| OEM 1 | <0.01 | 0.33 | 15.2 | 4.19 | 0.02 | 0.008 | 3.66 | 0.030 | 0.002 | 0.004 | 0.09 |
| OEM 2 | 0.05 | 0.25 | 15.1 | 4.56 | 0.46 | 0.120 | 4.01 | 0.038 | 0.007 | 0.004 | 0.69 |
2.2. Powder Performance
The three customized batches of powders (Fine, Medium, and Coarse) were further characterized in order to understand the effect of changing powder PSD on powder performance (i.e., tap density, flowability, and spreadability). Apparent and tapped density was determined following ASTM B527 – 15 [53]. A 25 mL graduated cylinder was used to measure the apparent and tapped (5000 taps used) density of 100 g of powder. From these measurements the Hausner ratio, the ratio of the tapped density to the apparent density, was determined. Hall flow measurements were made following ASTM B213-17 [54] using the static start method. A personal computer connected scale was placed under the funnel to more precisely record the start and stop time of the powder flow. This has been shown to reduce the variability of flow rate measurements of ferrous powders by over 23% [55]. Additionally, the powder flow rate was determined as the linear slope of the steady state flow portion of the mass versus time curve. A commercial rheometer was used to measure the flow energy, which is the powder’s resistance to flow in a dynamic state. A dynamic state is generated by a rotating blade that is forced downward through a cylinder of powder. Lastly, a qualitative assessment of the spreadability of the powder was made using the layer-wise imaging on the commercial LPBF machine. An image is recorded before and after each powder layer is spread. Regions with poor powder coverage and raking (streaks in the powder layer) are noted.
2.3. Part Performance
A single build for each customized batch of powder (Fine, Medium, and Coarse) was carried out on a commercial laser powder bed fusion machine (EOS M2901). The build layout is shown in Fig. 5, which contains many extra parts not included in this study. Tensile bars with the loading axis along the X-direction (recoating direction) and corresponding witness blocks for hardness and microstructure (directly before or after tensile bars) in positions 1, 4, 5, and 8 are included in this study. The process parameters used in this study are listed in Table 3, which were used for each customized powder. Additionally, a ceramic recoating blade was used in line with the OEM recommendation. The PSDs indicate there is a fraction of powder greater than the prescribed layer thickness of 40 μm for the medium, coarse, and OEM powders. This is not atypical because the actual powder layer thickness ranges from approximately 1.5 to 5 times the prescribed layer thickness due to consolidation, evaporation, and loss of powder caused by laser-powder interactions [56–58]. Note that the process parameters are optimized for OEM powder (OEM 1) and not necessarily the optimal parameters for each of the three powder types. LPBF metals often exhibit location specific and directionally dependent microstructures and properties (i.e., heterogenous and anisotropic) [59]. These aspects were not studied; however, we compared and tested the same locations and sample direction (X direction) whenever comparing parts produced by the three powders. The geometry of the tensile bars and witness blocks are described next.
Fig. 5.
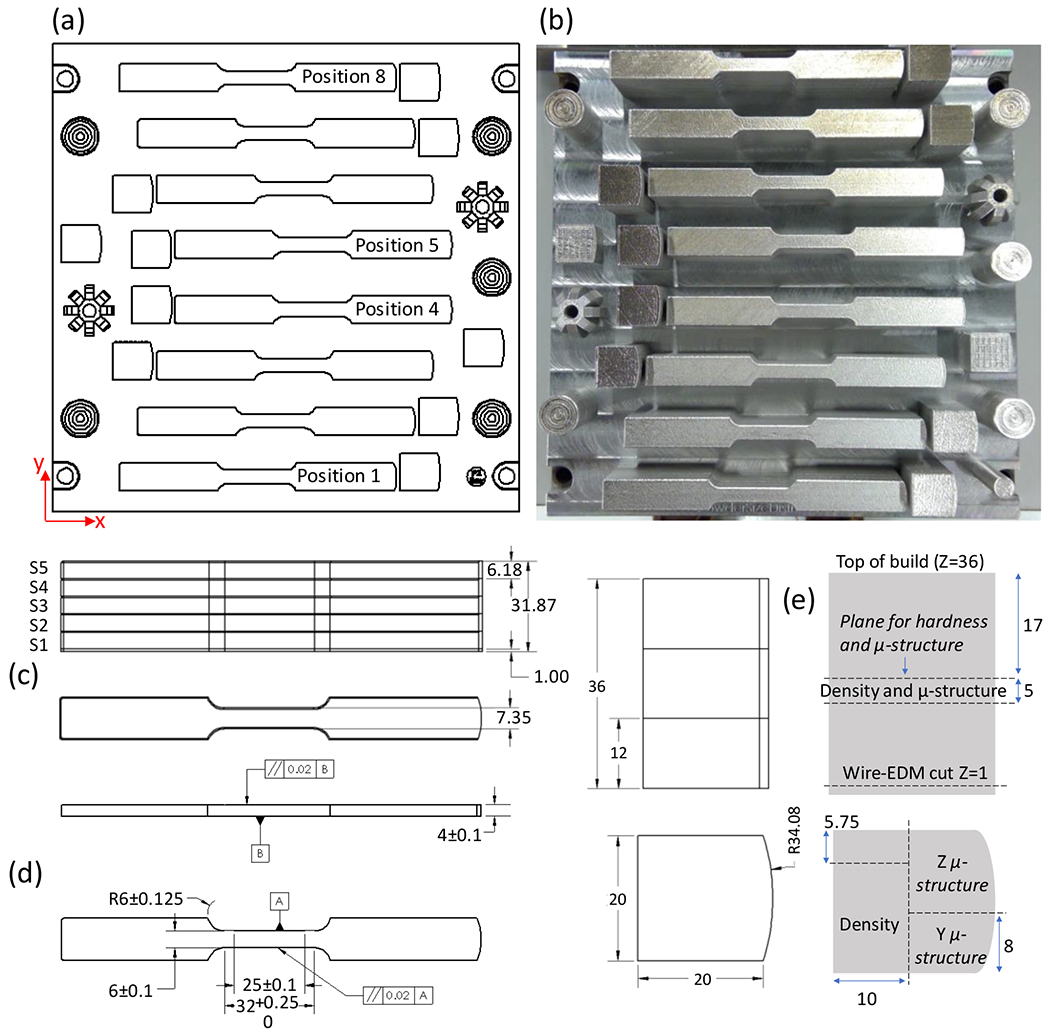
(a) build layout and (b) image of completed build. The build plate is 252 mm x 252 mm for reference. (c) stack of five oversized tensile bars, (d) machined dimensions of tensile bars, (e) stack of three witness blocks and schematic of cross-sectioning for hardness, density, and microstructure (μ-structure) characterization of the Z and Y planes. Dimensions are in millimeters.
Table 3.
Main LPBF process parameters used for all three powders: fine, medium and coarse. The recoating blade was ceramic.
| Laser Power (W) | 220.1 | Stripe Width (mm) | 12 | |
| Laser scan speed (mm s−1) | 775.5 | Scan Strategy | 67° rotation | |
| Powder Layer Thickness (μm) | 40 | Build Atmosphere | Argon | |
| Hatch spacing (mm) | 0.11 | Gas Flow Nozzle Type | Standard |
The tensile bars were built oversized in stacks of five bars as shown in Fig. 5c. Witness blocks were 20 mm x 20 mm x 36 mm with a curved edge facing the recoating blade as shown in Fig. 5e. Tensile bars and witness blocks were stress-relieved on the build plate at 650 °C for 1 h in an argon atmosphere followed by furnace cooling. After stress-relieving, parts were wire-electrical discharge machined (EDM) from the build plate. Tensile bar stacks were wire-EDM into five separate bars. Tensile bars were machined and ground to the specified final dimensions in Fig. 5d. Only bars S2, S3, and S5, denoted in Fig. 5c, were tested. The actual cross-sectional dimensions of the gage section were measured with calipers on each specimen. Tensile tests were carried out according to ASTM E8 [60] on a MTS hydraulic load frame with a 50 kN load cell. A 25.4 mm clip gage was attached to the sample to measure strain. The sample was strained at a rate of 0.015 min−1 up to a strain of 0.05. The strain gage was removed, and the sample was further strained to failure at an increased strain rate of 0.05 min−1. Stress-strain curves were calculated up to a strain of 0.05 mm mm−1 from which the Young’s modulus and yield stress were determined. The ultimate tensile strength (UTS) was determined from the maximum force and initial cross-sectional area. Elongation after failure (as opposed to elongation at failure) was measured by scribing lines spaced 25 mm apart prior to testing and pushing together broken specimens after testing to measure final distance between the scribed lines. The distance was measured using an optical microscope with a digital stage.
Witness blocks were sectioned with a precision saw approximately 17 mm from the top of the build, Fig. 5e. The top half was reserved for Rockwell hardness (HRC and HRA) measurements following ASTM E18 [61] on the cross-sectioned plane. The top and bottom surfaces were ground to a final step with 1200 grit paper. The bottom half of the witness block was sectioned further with a second cut to produce an approximately 5 mm thick slice, Fig. 5e. This 5 mm slice was quartered into samples for scanning electron microscopy and He pycnometer density measurements. All electron microscopy measurements were made on the witness block in position 4 of the build layout. Samples for electron microscopy were polished with a final step of 0.02 μm colloidal silica in a vibratory polisher. Electron backscatter diffraction (EBSD) was performed on a JOEL JSM7100F field-emission scanning electron microscope (SEM) in combination with an Oxford NordlysMax2 detector using a beam voltage of 20 keV, working distance of 15 mm to 17 mm, spot size setting of 12, and 4 × 4 camera binning. Scans on each sample were performed on the Y-plane and Z-plane at a magnification of 500 x with a step size (pixel size) of 700 nm. One higher resolution scan was performed on the Medium Y-plane specimen with a step size of 200 nm. As mentioned in the introduction, the martensitic body centered tetragonal (BCT) phase is difficult to identify with EBSD due to the c/a ratio close to unity. In this case, body centered cubic (BCC) Fe was used to index diffraction patterns, and it is referred to as BCC-martensite or BCC/BCT. Face centered cubic (FCC) Fe was also included in the diffraction pattern indexing; however, it was only occasionally indexed in noisy data. EBSD data were analyzed using MTEX, a free MATLAB toolbox for analyzing and modeling crystallographic textures by means of EBSD or pole figure data [62]. Grains were defined by a minimum misorientation angle of 3° and minimum size of 9 pixels. Small clusters of non-indexed data less than 10 pixels in size were assigned to surrounding grains which is referred to as clean up. The orientation distribution function (ODF), necessary for texture analysis, was calculated using the mean orientation per grain weighted by the grain area [63, 64]. The texture index, the L2-norm of the ODF, was used to track changes in the overall texture [65]. X-ray diffraction (XRD) was performed on the same Z-axis samples with a Rigaku SmartLab system.
Density measurements were made using a He pycnometer. One sample per witness block was measured 10 times each. This was completed for all four positions: 1, 4, 5, and 8. Prior to density measurements, samples were ground to remove burs from sectioning as well as the as-built surfaces that were present on two faces. Porosity was estimated using a solid density of 7.8 g cm−1. The porosity was also estimated from optical microscopy. Additional sectioning of witness blocks not shown in Fig. 5e was made for these measurements. After hardness testing, the top and bottom halves of witness blocks were sectioned to reveal the X-plane in the approximate middle of the witness block. This was done on all four witness blocks: positions 1, 4, 5, and 8. These samples were metallographically prepared similar to SEM samples; however, the final step of 0.02 μm colloidal silica was performed with an automatic wheel polisher instead of a vibratory polisher. Images were taken with a 5x objective and pixel size 0.62 μm. A shading correction was applied to all micrographs prior to segmentation. Micrographs were analyzed with FIJI [66] using the automatic threshold method and particle analysis tool. A minimum pore size of three pixels was used. The total imaged area per witness block, which includes the top and bottom halves, was approximately 28 mm × 9 mm. This resulted in identification of 9,000 to 17,000 pores.
3. Results
Similar to the materials and methods section, the results are organized into two sections: power performance and part performance. The part performance is further subdivided into microstructure characterization and mechanical properties. Relevant details can be found in the corresponding materials and methods sections: Sec. 2.2 and 2.3. The starting powder properties such as PSD, density, and chemistry were presented in Sec. 2.1.
3.1. Powder Performance
This section contains Hausner ratio (apparent and tapped density), Hall flow, and rheometer measurements of virgin powder as well as qualitative observations of spreading in the commercial LPBF machine during the building process. The apparent density, tapped density, and Hausner ratios of the three powders are shown in Fig. 6. The Coarse powder has a lowest Hausner ratio at 1.13 ± 0.01, and the Fine and the Medium have the same Hausner ratio at 1.23 ± 0.01 and 1.22 ± 0.01, respectively. Generally, a Hausner ratio closer to one has better flowability; however, trends in Hausner ratio do not always relate to flowability, spreadability, or process performance [3, 11]. The average tapped densities are similar for all three powders ranging from 4.45 kg cm−3 to 4.57 kg cm−3. According to the OEM specification sheet, OEM 1 powder has an average Hausner ratio of 1.23 with a tapped density of 4.7 kg cm−3. The higher average tapped density for OEM 1 could be the result of a higher skeletal density, i.e., fewer internal pores. The lower Hausner ratio for the Coarse powder and increasing apparent density with increasing size agrees with trends reported in literature [8, 67].
Fig. 6.
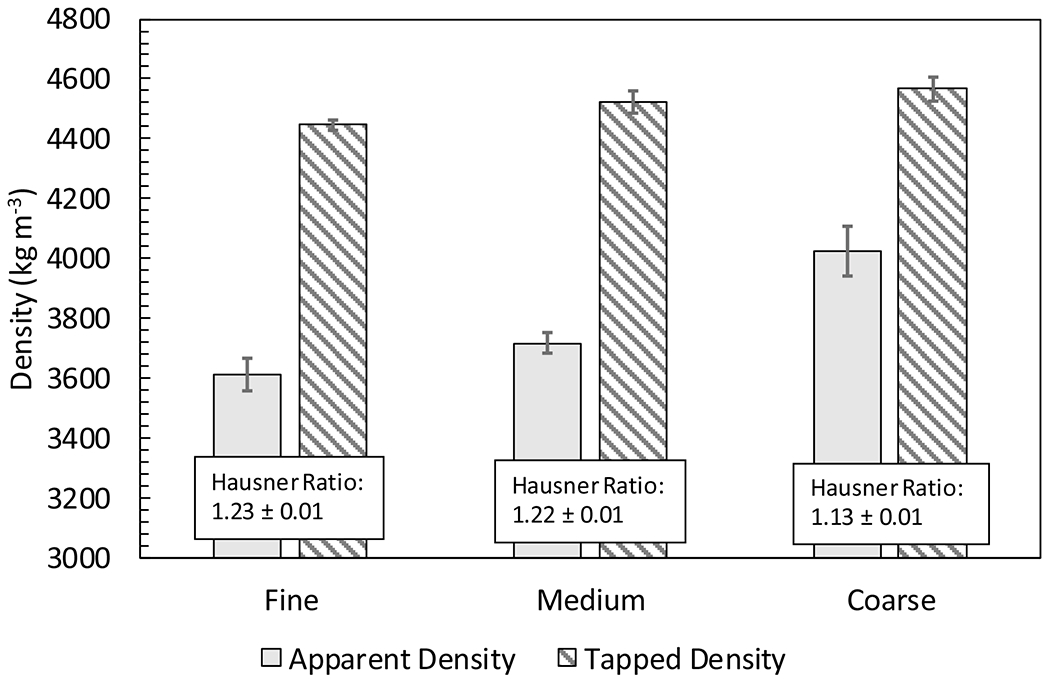
Average apparent and tapped density measurements with corresponding Hausner ratio for the three powders. Confidence interval estimates are for p = 95 % and n = 3.
In addition to apparent density and tapped density, the Hall flow test is commonly used to access the flowability of a powder. The Hall flow test measures the time it takes for 50 grams of powder to flow through a specific funnel geometry. The results for three measurements per powder batch are shown in Fig. 7. The first observation is that the Fine powder did not flow at all when following ASTM B213-15, which sets a maximum of two taps on the funnel. This is a common result even for acceptable metal powders (e.g., [36]). Despite this shortcoming of the test on metal powders, powders that flow or flow faster are believed to be more robust for AM processes. The Coarse powder has a 6.1 % faster average flow time than that of the Medium powder (i.e., 14. 8 s ± 0.5 s compared to the Medium powder’s average flow time of 15.7 s ± 0.5 s). However, the mass flow rate, determined from the slope of the linear portion of the mass versus time curve, shows a more significant difference with the Coarse powder having a 16.2% faster flow rate than the Medium powder (i.e., 3.81 g s−1 ± 0.08 g s−1 compared to the Medium powder’s flow rate of 3.28 g s−1 ± 0.01 g s−1). This difference is attributed to the incipient nature of the test method and the fact that the powder’s flow takes time to fully develop. If the time taken for the powder’s flow to develop into a steady state is considered as part of the powder’s flow rate (as is suggested in ASTM B213-15) it seems the actual differences are underestimated. The rate of steady state flow of each of the powders differs much more than the total flow times. Considering both the overall flow time and the steady state flow rate may increase the Hall flow test’s relevancy to AM powders. The trends of faster flow with increasing particle size agree with literature [67]. Hall flow type tests are free flowing which solely rely on gravity compared to forced flow which relies on both agitation and gravity such as a rheometer. The relationship between free-flowing tests to spreading remains an unanswered question. While a forced flow may be closer to the spreading process in LPBF, the stress conditions need to be similar in order to argue that it is more relevant to spreading.
Fig. 7.

Average hall flow results for (a) total time and (b) mass flow rate. The fine powder did not flow (DNF). Confidence interval estimates for p = 95 % and n = 3.
Rheometer flow results are shown in Fig. 8 based on total energy versus measurement number. The total energy is the work required to rotate and translate a blade downward into a cylinder of powder. The total energy is the integral of the forces from the normal load and torsional load over the distance the blade travels. Eight subsequent measurements are taken for each test. Before each of the eight measurements the powder undergoes a conditioning step in which the blade is rotated in a fashion to encourage upward motion of the powder. This motion is thought to remove a degree of the ‘history’ of the sample that is introduced from either the previous test or initial loading of powder into the cylinder. The robustness of this test is discussed in Ref. [68]. The Fine powder requires less energy to deform under these conditions than the Medium and Coarse. The Medium has slightly higher values than the Coarse powder; however, in the absence of reliable confidence intervals and considering the level of reproducibility shown in Ref. [68], these should be considered nearly the same. The results agree with those reported by Refs. [17, 69] in that the fine powders have lower flow energy. Since the Fine powder is more cohesive it has a lower apparent density (Fig. 6), and therefore the lower apparent density provides less resistance to the blade’s motion despite a higher cohesion between particles.
Fig. 8.
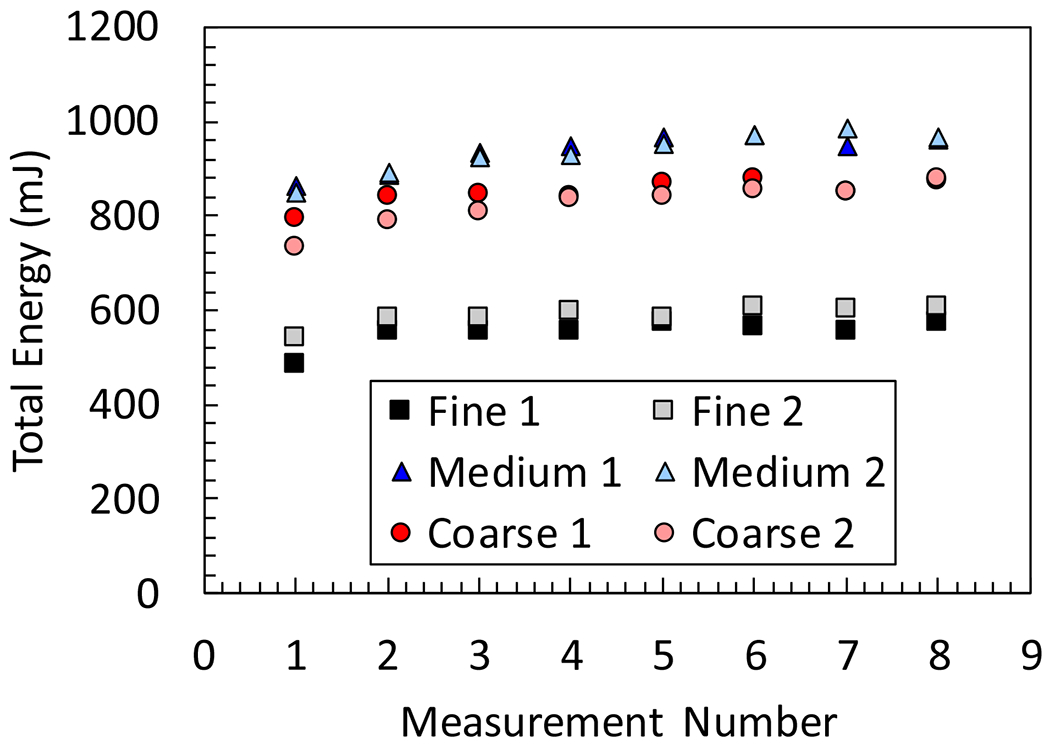
Total energy or basic flow energy versus measurement number from FT4 powder rheology instrument. Two samples per powder were measured indicated as 1 and 2.
Lastly, qualitative observations of the spreading of the powder were made from the AM machine camera, which takes images after each layer is spread and the laser exposure of the parts. Figure 9 shows representative images at approximately the mid-point of the build height. No differences between the Medium and Coarse powders were observed. However, the Fine powder showed streaking or horizontal lines across the powder bed. This indicates a non-uniform powder layer. Additionally, the Fine powder occasionally had spotty regions with poor coverage on parts. The deficiencies of the spotty regions seemed to be overcome with the next spread layer which introduced new deficiencies in a random fashion such that no large defects built up over several layers. Clearly, the Fine powder spreads poorly in the qualitative sense; however, it did not result in any build stops or failed parts.
Fig. 9.
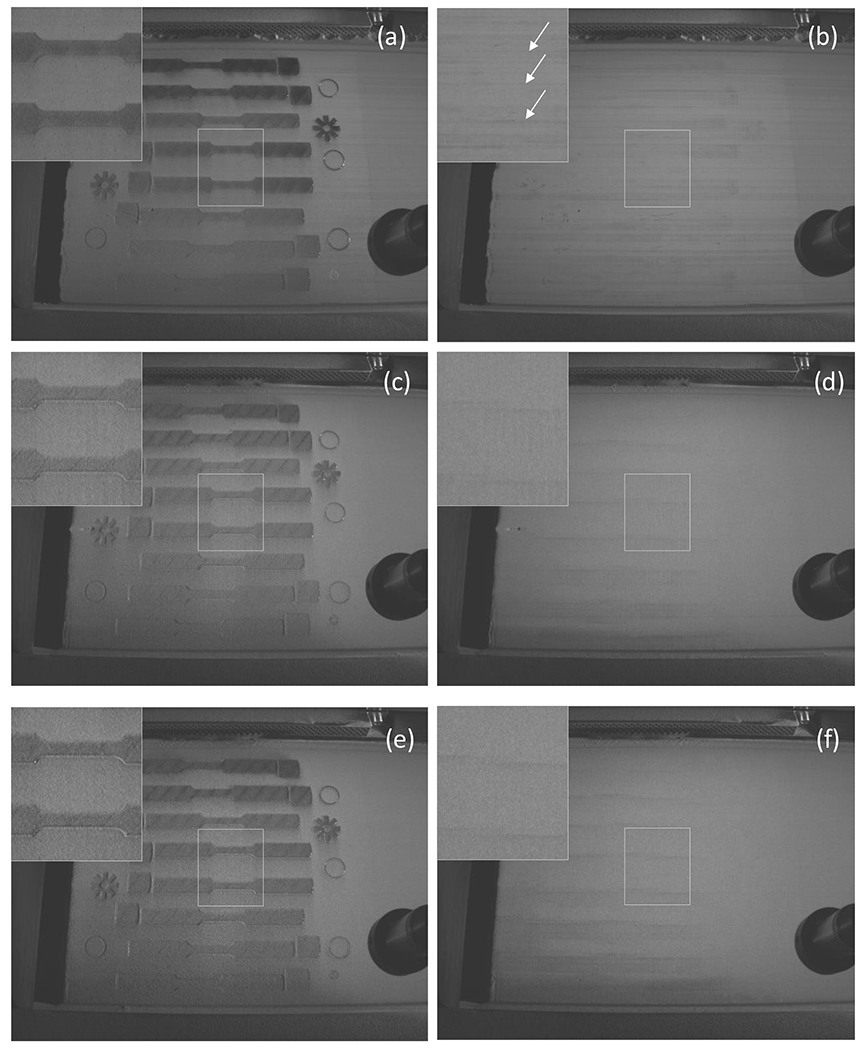
Layer-wise imaging of process before and after spreading a single layer for (a, b) Fine, (c, d) Medium, and (e, f) Coarse powders. The layer is approximately the middle of the build height at layer number 451. Insets are magnified by 2 times. For reference, the build area is approximately 252 mm by 252 mm, and the tensile bar reduced section is approximately 32 mm by 6 mm. Arrows in (b) show streaks.
3.2. Part Performance
3.2.1. Microstructure
Microstructure measurements in this study include density from optical microscopy and He pycnometry, electron backscatter diffraction (EBSD) grain size and crystallographic texture, and X-ray diffraction (XRD) for phase identification. Optical micrographs reveal small circular pores throughout the samples as shown in Fig. 10. The origins of the porosity are not clear. It could come from entrapped gas in the powder or metallurgical pores from the melt-atmosphere interactions. As mentioned previously, the optical microscopy-based porosity analysis included 9,000 to 17,000 pores (see Section 2.3). The estimated porosity based on optical micrographs is less than 0.2 % for all cases as shown in Fig. 11b. Parts from the Medium powder have a higher average than Fine and Coarse; however, the confidence intervals are nearly overlapping. In contrast, He pycnometer measurements reveal porosity on the order of 2 %, and parts from the Medium powder have the lowest average porosity, Fig. 11a. Again, confidence intervals overlap between all three powders such that there is no significant difference. Optical micrographs tend to underestimate the porosity compared to He pycnometry by as much as an order of magnitude when porosities are on the order of 1 % [70]. The drawback with estimating porosity from He pycnometry is that a theoretical density must be assumed or measured on a fully dense sample. Errors in the theoretical density will translate to errors in the estimated porosity. In summary, the porosity of parts from Fine, Medium, and Coarse powders is nearly identical on the order of 0.2 % to 2 %, and the pores are mostly spherical.
Fig. 10.
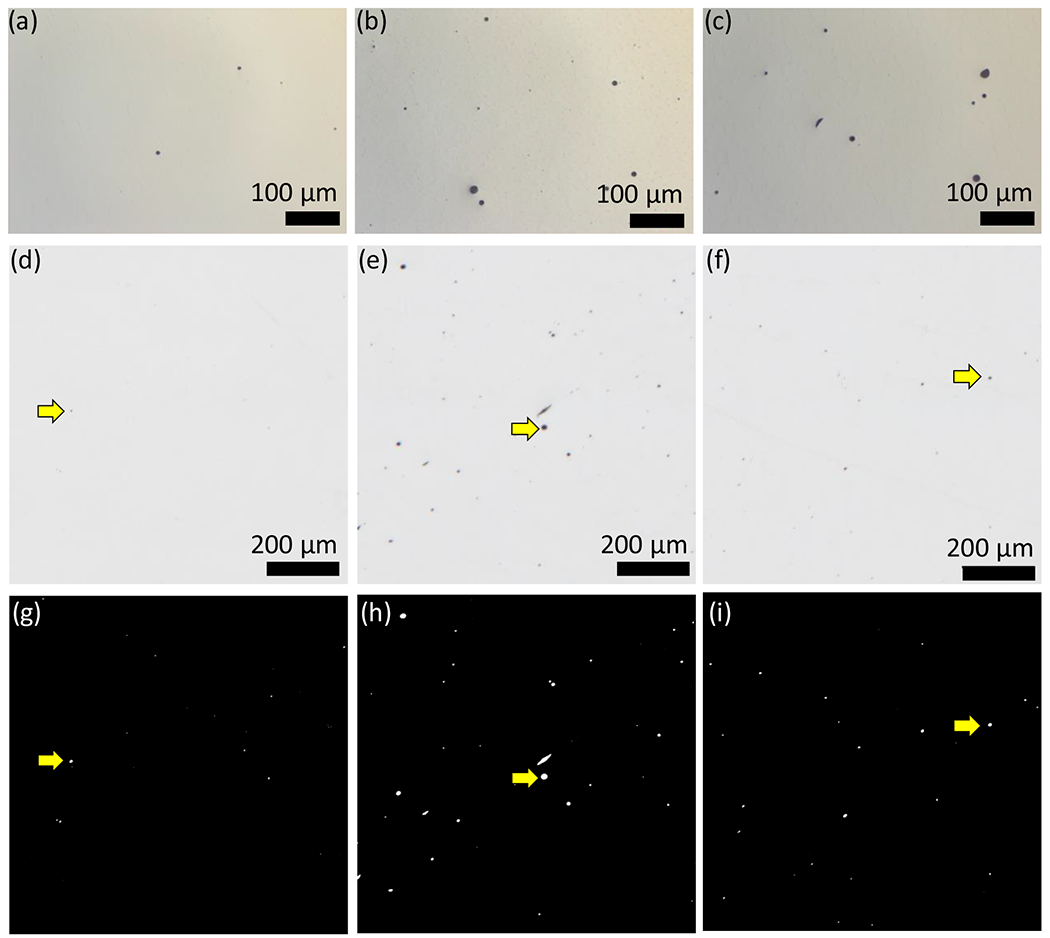
Exemplar optical images for polished cross-sections. Columns left to right correspond to Fine, Medium, and Coarse, respectively. Images (a-c) are from the Z-plane showing primarily spherical pores. Images (d-f) are a sample of the images used for optical porosity measurements (from X-plane, see Section 2.3) with their corresponding segmented images (g-i) with white regions identified as pores. The scale bar for segmented images is the same as (d-f).
Fig. 11.
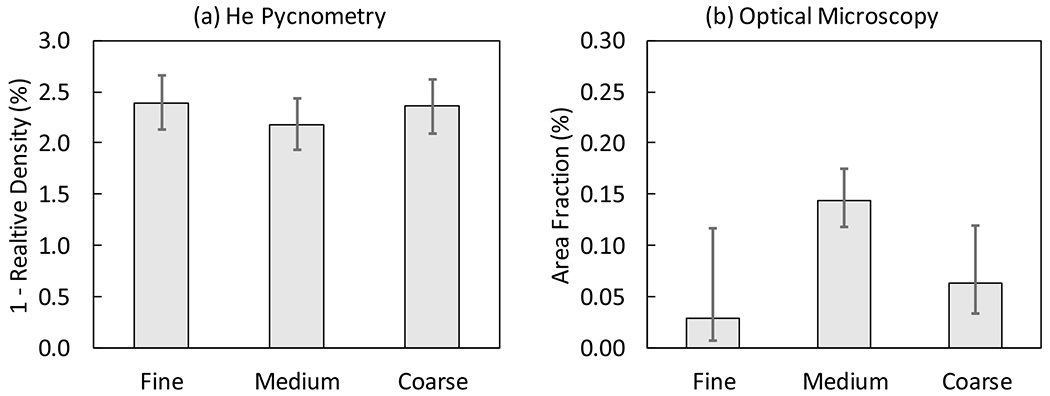
Average porosity measurements from (a) He pycnometry and (b) optical microscopy. Notice that there is an order of magnitude difference between the two measurement types. Confidence interval estimates are for p = 95 % and n = 3. A theoretical density of 7.8 g cm−3 was assumed.
EBSD inverse pole figure maps showing the grain morphology and crystal planes aligned with the sample Z-direction (build direction) are given in Fig. 12. For each of these maps, the corresponding texture inverse pole figures showing the relative intensity of grains with specific crystal planes along the Z-direction is also given in Fig. 12. All three specimens show characteristic features of as-built LPBF microstructure under typical processing conditions with elongated grains along the build direction, a pattern of large and small grains in the build plane, and a preferred crystallographic texture of (100) crystal planes along the build direction for cubic materials [29, 34, 41, 42]. The EBSD data from Fig. 12 show strong evidence of fine grains at grain boundaries. In the grain size analysis, only grains that contained 9 or more pixels were counted and plotted. A close-up of Y-plane maps from Figure 12 is shown in Figure 13 where the opposite, only grains < 9 pixels, is plotted. These grains contain indexed points with a mean angular deviation less than 1 degree, a goodness of fit term between the simulated and experimental Kikuchi band pattern, which indicates the orientation data is not simply noise. These small grains are primarily at grain boundaries. If this was an artifact of the electron beam interaction volume hitting a grain boundary (diffracting patterns from two crystals), it would result in high mean angular deviation values and/or non-indexed points. One sample was scanned with a step size of 200 nm, also shown in Figure 13, which confirmed that these are grains. The sub micrometer grains on grain boundaries reliably index as BCC like the rest of the material. These were observed in all three specimens throughout the material in clusters. Similar clusters of fine BCC/BCT grains were also observed in literature [42, 47].
Fig. 12.
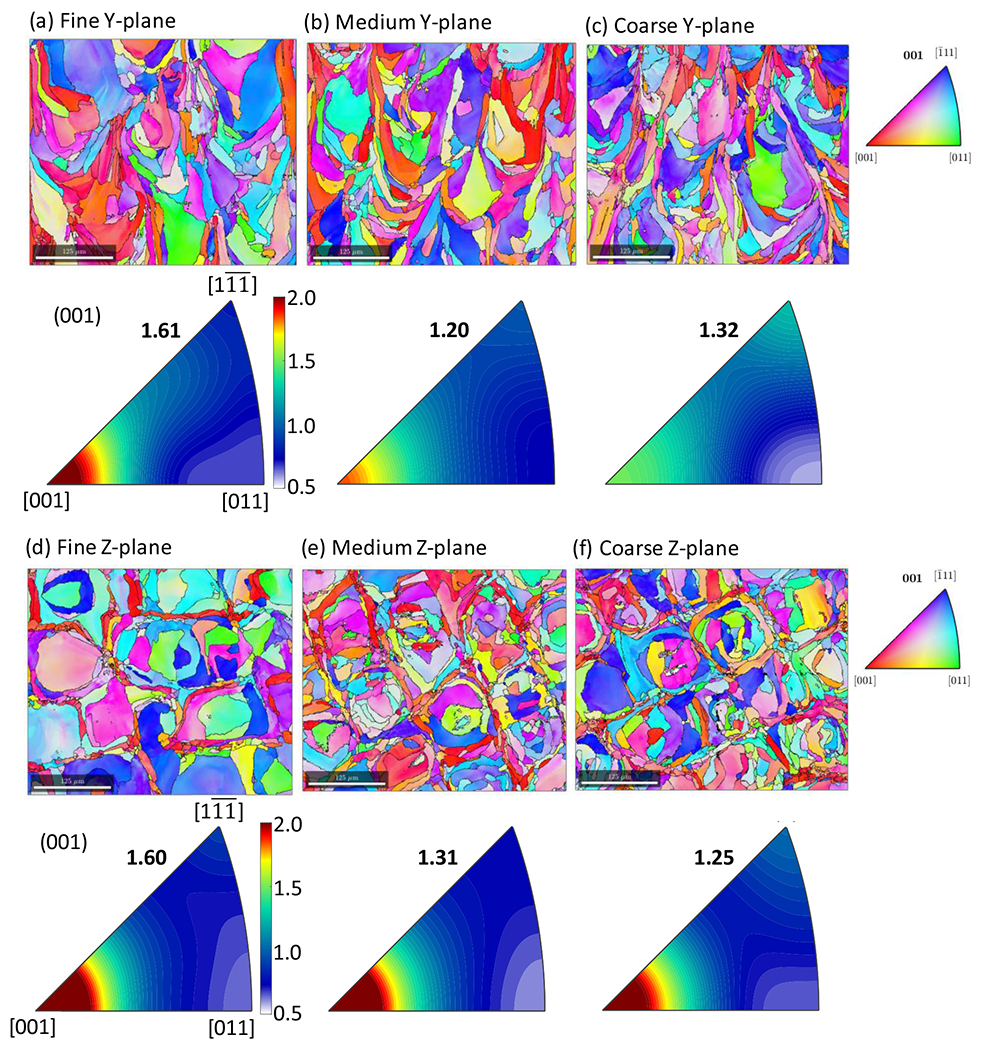
EBSD inverse pole figure (IFP) maps and corresponding texture for (a) Fine Y-plane, (b) Medium Y-plane, (c) Coarse Y-plane, (d) Fine Z-plane, (e) Medium Z-plane, and (f) Coarse Z-plane. Grain colors for all maps and texture analysis is based on the crystal plane normal that aligns with the build direction (Z-plane). Scale bars are 125 μm. Corresponding texture IPFs have units of multiples of a uniform distribution (m.u.d.). The texture index is listed for each case, which has a coefficient of variation of 7 % based on four scans on the Medium Y sample. Step size was 700 nm.
Fig. 13.
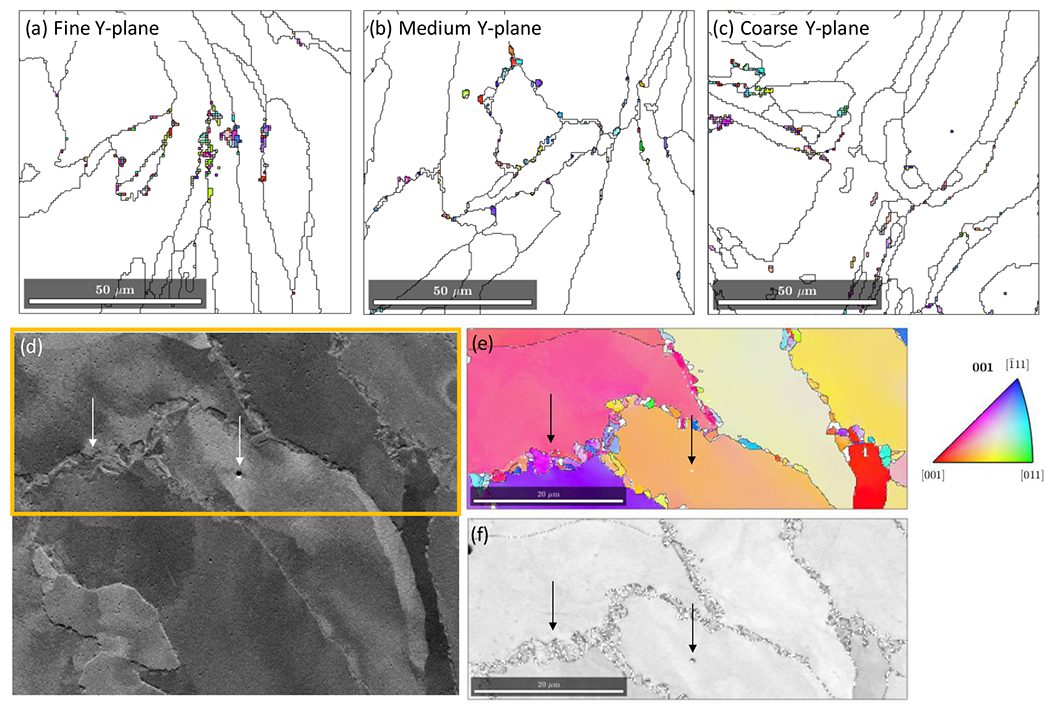
(a-c) EBSD IPF-grain maps for indexed grains < 9 points from 700 nm step size scans for fine, medium, an coarse samples, respectively, showing fine grains at grain boundaries. (d-f) higher resolution EBSD scan with a step size of 200 nm confirming sub micrometer grains along some grain boundaries. (d) forward scatter detector image, (e) IPF map, and (f) image quality map, Arrows are added for reference; the arrow on the right-hand side points to a pore. Images are on the same scale; scale bars are 20 μm. All cross-sections are the Y-plane, and the IPF colors correspond to crystal planes aligned with the Z-plane.
Figure 14 compares the area-weighted mean grain size and 95th percentile grain size based on the equivalent circular area radius (simply referred to as radius) for the measurement results shown in Fig. 12. Note that the 95th percentile grain size of the cumulative size distribution is not based on an area-weighted distribution. Additional quantitative values from the EBSD data are listed in a table provided in the Appendix A. The Fine powder specimen has some differences from the Medium and Coarse specimens: Fine Z has a higher area-weighted average grain size and 95th % grain size from the cumulative distribution than Medium Z and Coarse Z. The texture index is also greater for Fine (1.6) compared to Medium and Coarse (1.2 to 1.3). It is possible that more re-melting in the Fine powder specimen due to insufficient spreading in local regions is increasing the grain size and texture. The re-melting process during AM leads to crystal growth from previously deposited material [29]. The difference in Fine is subtle, and there is no measurable difference between Medium and Coarse.
Fig. 14.
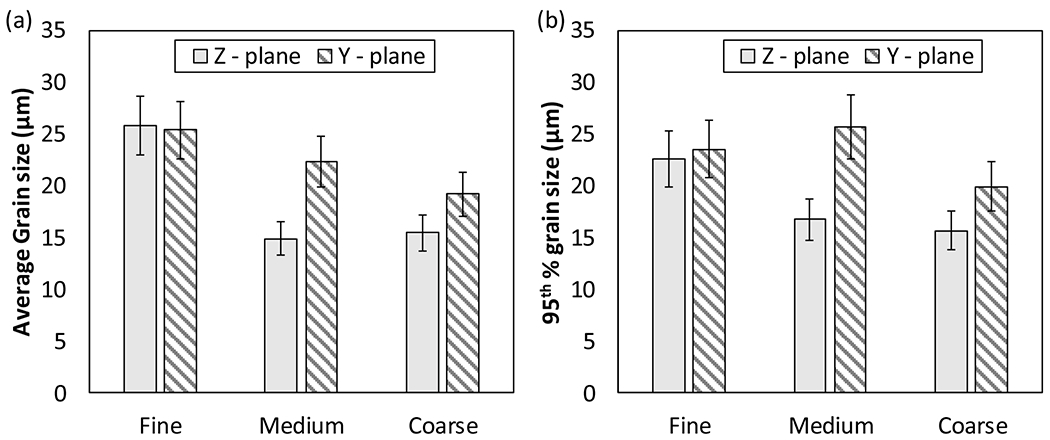
(a) area weighted average grain size (equivalent circular radius) for parts produced from each powder. Error bars are ± 11 % based on the coefficient of variation from four scans on the Medium Y sample. (b) 95th percentile of the cumulative grain size distribution. Error bars are ± 12 % based on the coefficient of variation from four scans on the Medium Y sample.
Lastly, X-ray diffraction (XRD) line profile scans for phase identification are presented in Fig. 15. Again, it is difficult to identify BCC-Fe from BCT-martensite using EBSD and XRD. The XRD characterization is mainly presented to show that there is no evidence of austenite (FCC-Fe). It is not possible to conclude the material is fully martensite; however, no austenite was observed through XRD and EBSD measurements on well-polished samples.
Fig. 15.
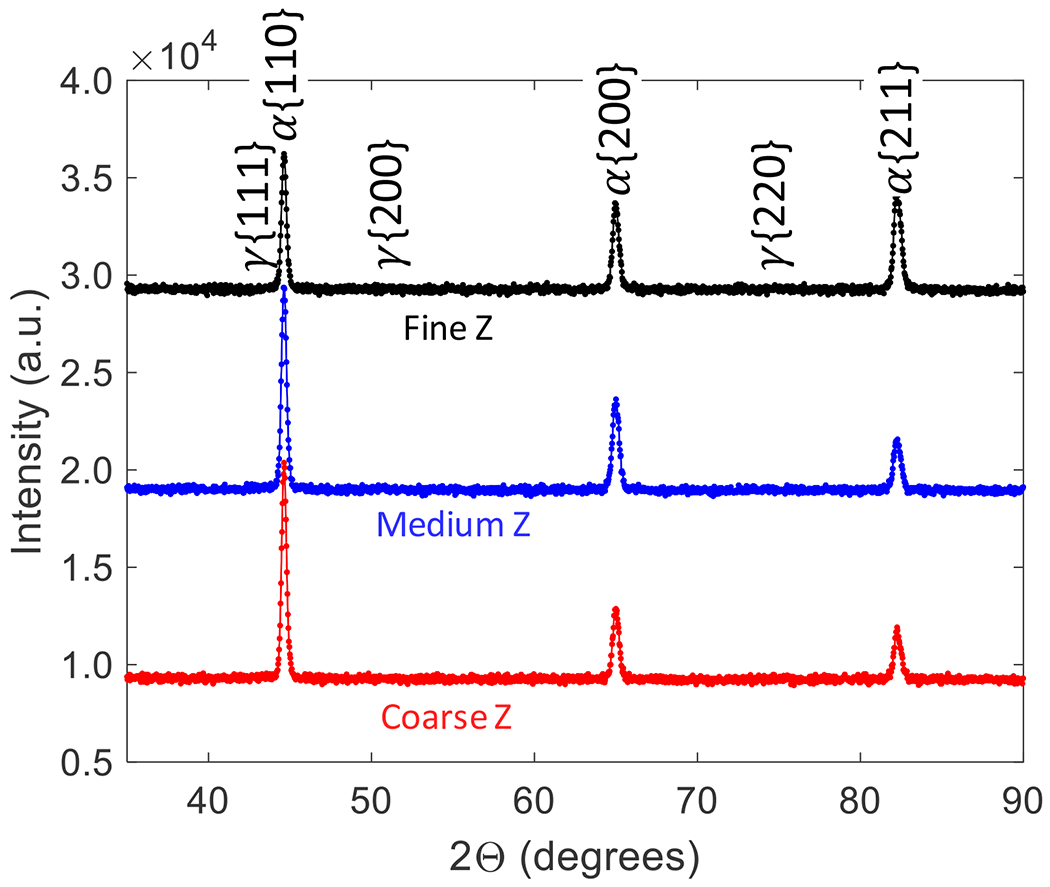
X-ray diffraction (XRD) line profiles showing peaks for a BCC/BCT phase (α) and the absence of peaks for a FCC austenite phase (γ).
3.2.2. Mechanical properties
Rockwell hardness and uniaxial tensile tests were performed to determine if there were differences in mechanical properties between parts produced from the three customized batches of powder. Rockwell hardness, HRA and HRC, is presented in Fig. 16. The Medium specimen shows higher hardness for both HRA and HRC measurements. The difference is more significant for HRC (lower force) measurements. The Fine and Coarse specimens have the same hardness despite the largest difference in PSD and powder performance. The specimen in Position 8, closest to the gas flow nozzle, always has the lowest average hardness, although it is not significantly lower than all the other positions.
Fig. 16.
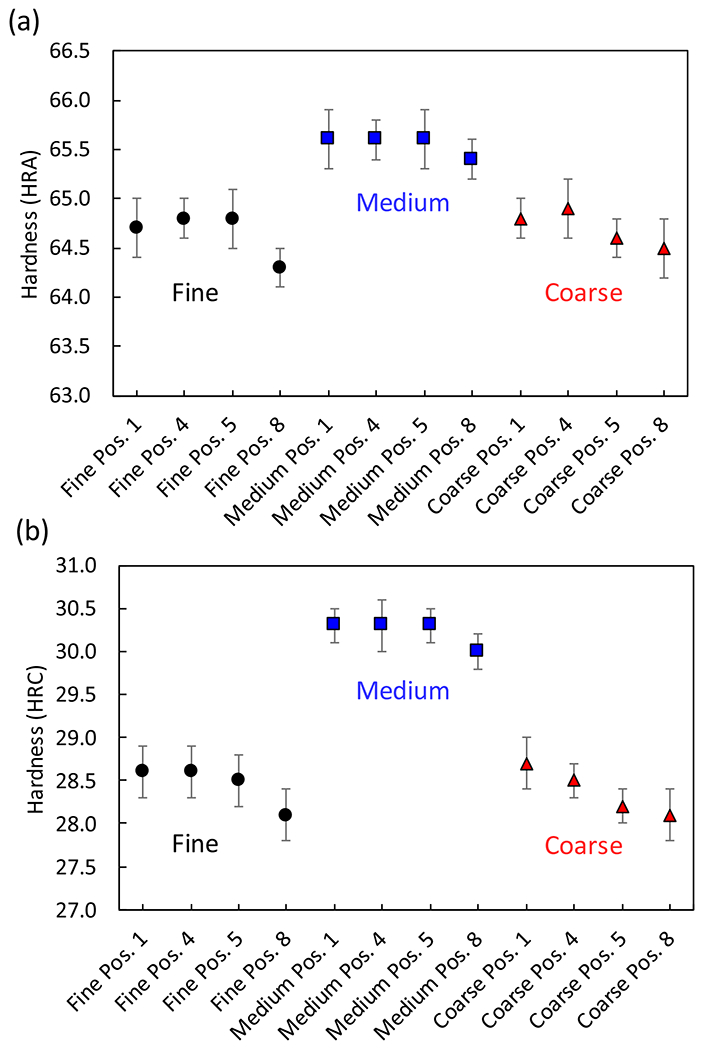
Rockwell hardness measurements (a) HRA and (b) HRC hardness scales. Data points are the average ± standard deviation for n=12. Refer to Fig. 5 for position (Pos.) numbers.
Engineering stress-strain curves are shown in Fig. 17. Eight specimens loaded along the X-direction were tested for each customized batch of powder. First, the specimens from the Medium powder result in marginally higher strength and flow stress. The Fine and Coarse powders again show the same response despite significant differences in powder performance. Second, there is a group of three tests with lower strength and flow stress for each powder. This group comes from position 8 on the build plate. It is believed that this is caused by different gas flow in this region of the build chamber compared to rest of the build chamber. Poor gas flow influences the vapor plume, which can alter the melt pool size and shape or energy density. It is not clear how this directly lowers the tensile properties because position 8 witness blocks did not have a higher porosity. The average tensile properties per powder, which includes the group of lower properties within each powder type, are shown in Fig. 18. A comparison to wrought and LPBF 17-4 is given in Appendix B. The material in this study is similar to the OEM as-built properties and wrought H1150 condition. Again, the average yield strength is marginally higher for the Medium powder, and the ultimate tensile strength (UTS) is significantly higher for the Medium powder. The Fine and Coarse powders have nearly identical properties except for elongation after failure where the Coarse powder has a marginally higher elongation after failure. The hardness and tensile results are in good agreement with each other.
Fig. 17.
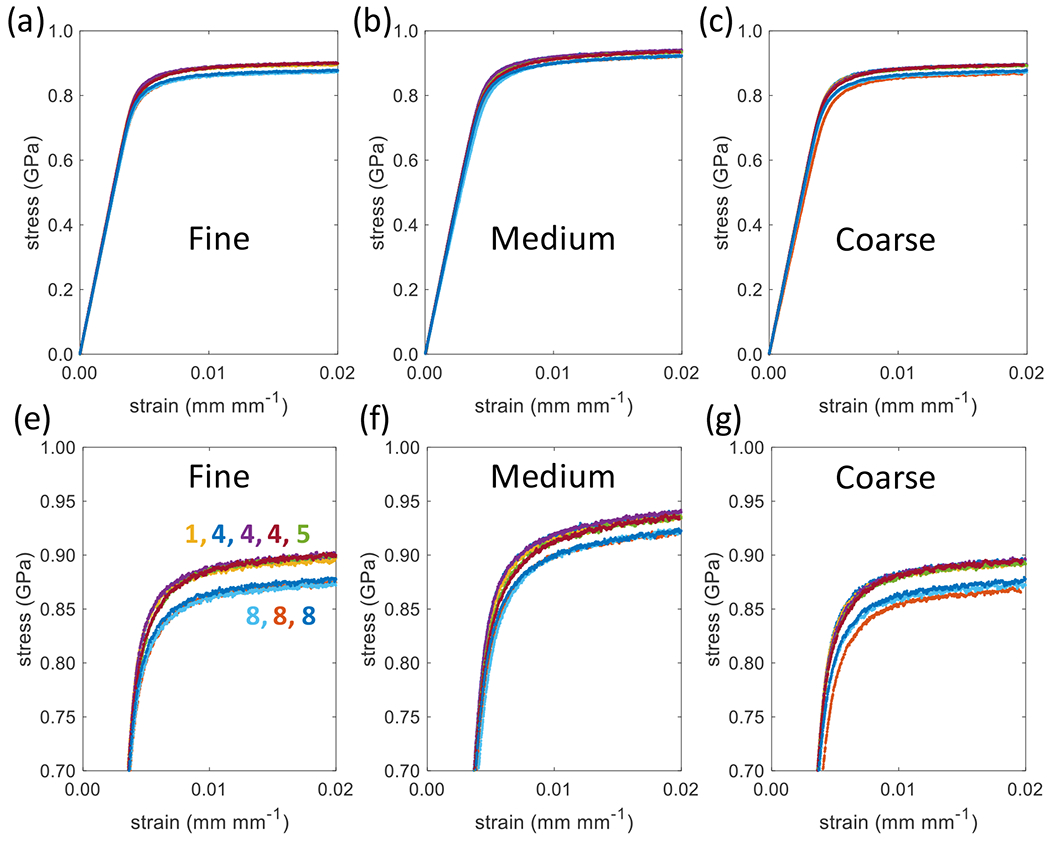
Tensile engineering stress-strain curves for (a) Fine, (b) Medium, and (c) Coarse powders with re-scaled vertical axis to better show differences within powder type on the yield and flow stress after yield (e-g). Eight curves per powder type are plotted and three tests per powder type shower lower stresses, which all come from position 8. The numbers and their colors correspond to the build plate position and curve color, respectively.
Fig. 18.
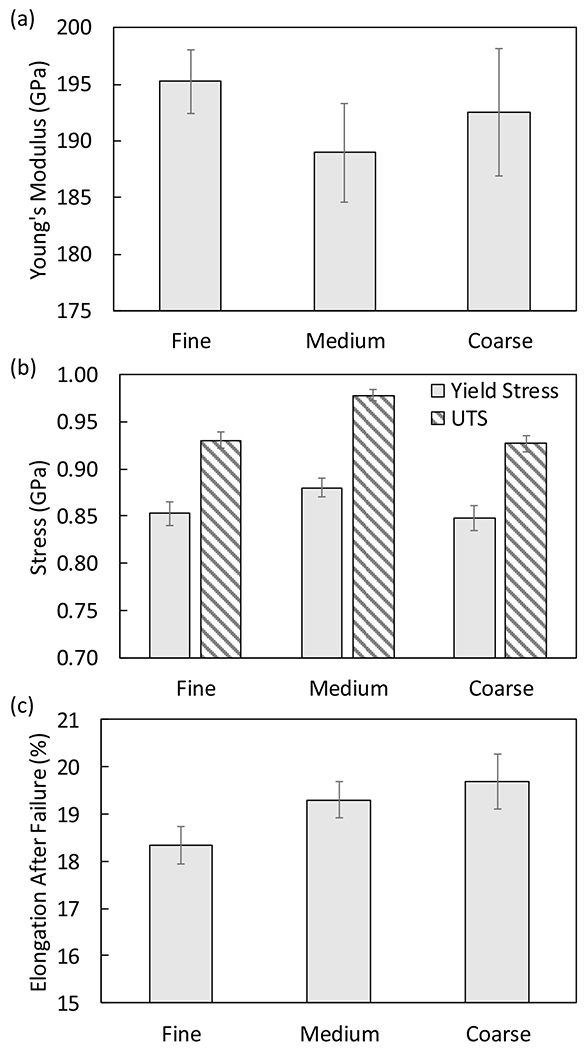
Average mechanical properties: (a) Young’s modulus, (b) yield stress and ultimate tensile strength, and (c) elongation after failure. Error bars are ± one standard deviation from eight measurements per powder type.
4. Discussion
The focus of this study was the effect of a shift in the powder particle size cumulative distribution on the powder performance and part performance. It is evident that small changes in the powder particle size distribution effect the powder performance. Ranking of the powders based on each powder performance measurement are summarized in Table 4. In this regard, we observed the same things reported in literature: poor flow and spreading for size distributions with a population of many fine particles (i.e., d10 < 10 μm). The Coarse powder had the best overall powder performance, which again agrees with trends in literature. The physical reason for this behavior has much to do with the relationship between particle size and cohesive and adhesive forces [15, 71–73]. As the particle size decreases, van-der-Waals forces can approach and surpass gravimetric forces due to the increase in surface energy [5, 71–73]. Furthermore, potential for water adsorption increases which can further increase cohesion between particles [3, 73]. It is not clear if there is a link between powder and part performance in this study. The Medium powder had the best overall part performance as summarized in Table 4. The Fine and Coarse powders had nearly identical mechanical properties except for elongation after failure which was marginally higher for the Coarse powder. These results are not readily explainable by the powder performance.
Table 4.
Qualitative summary of powder and part performance
| Fine (F) | Medium (M) | Coarse (C) | Summary | ||
|---|---|---|---|---|---|
| Powder | Hausner Ratio | Highest | C > (M = F) | ||
| Hall Flow | Did not flow | Highest | C > M, F = ∞, | ||
| Spreading | Raking, poor | Ok | Ok | ||
| Rheometer Flow | Lowest | ||||
| Structure | Part Density | F = M = C | |||
| Grain Size | Marginally larger | (M = C) ≤ F | |||
| Texture | Marginally higher | (M = C) ≤ F | |||
| Property | Hardness | Highest | M > (F = C) | ||
| Yield Stress | Marginally Higher | M > (F = C) | |||
| UTS | Highest | M > (F = C) | |||
| Elongation | Marginally lowest | (M = C) > F |
There are a few possible explanations for why the Medium powder shows better mechanical properties. First, it could simply be build-to-build variability which is not captured by only one build per powder. Here we use the coefficient of variation for yield and UTS on a similar powder/material (nitrogen atomized 17-4) and similar machine (EOS M270) to estimate the build-to-build variation [37]. Luecke and Slotwinksi report a coefficient of variation of 2.7 % and 1.8 % for yield stress and UTS, respectively, based on specimens from three builds [37]. The Medium powder yield and UTS are approximately 3 % and 5 % higher than the Fine and Coarse powders. It seems unlikely that build-to-build variation is the cause of the higher mechanical properties, particularly the higher UTS. Second, despite efforts to isolate the effect of particle size, the PSD spans and chemistries are different, and the Medium powder is slightly less spherical. The spans of the custom powders are similar to the OEM powders such that the Medium powder PSD is not exceptionally narrow, nor are those of the Fine and Coarse exceptionally wide. While there is some evidence to suggest a narrower span increases mechanical properties [3, 25], it doesn’t seem likely to explain the higher mechanical properties in the Medium powder. The less spherical morphology of the Medium powder is also not likely beneficial for mechanical properties since most evidence suggests more spherical particles would be beneficial for flowability and mechanical properties [8, 9, 26]. Lastly, the differences in chemistry in the starting powder need to be discussed.
Setting aside the process, there should be a microstructure-property relationship to explain the higher mechanical properties in the Medium powder. However, the microstructure characterization in this study does not provide an explanation for the higher mechanical properties in the Medium powder. The characterization rules out porosity and large differences in grain size, crystallographic texture, and phases. However, 17-4 is a precipitation hardened alloy, and characterization of the size and density of precipitates was not performed. Even though no aging heat treatment was applied, it is likely the stress-relief and slow furnace cool lead to some precipitation hardening which is mainly in the form of Cu rich precipitates [34, 74]. It is possible there are precipitation hardening differences between the three powders due to difference in chemistry (e.g., higher Cu content in the Medium powder). As mentioned previously, there are small differences in the Cr/Ni equivalent ratio. While this ratio has been used in literature to explain high amounts of retained austenite (not relevant in these specimens), there is also a transition from coarse to fine grain BCC/BCT martensite with a decreasing Cr/Ni equivalent ratio [42, 43, 47]. This suggests that the Medium powder with the lowest Cr/Ni equivalent ratio may have a higher fraction of fine grain martensite which would increase the mechanical properties. Qualitatively this was not observed but shouldn’t be ruled out. The reason for higher mechanical properties in the Medium powder is not precisely known; however, it is not related to powder performance.
5. Conclusions
Three batches of 17-4 powders with customized PSDs were characterized using several powder performance measurements, inserted into an established LPBF process for OEM powders with a fixed set of process parameters, followed by microstructure and mechanical property measurements. The customized batches of powders had moderate shifts in particle size with non-intersecting cumulative size distributions in order to better isolate the effect of particle size on powder and part performance. The conclusions are:
The given process parameters are robust against changes in PSD when it comes to hardness and tensile properties. A range of powder performance is acceptable for producing good static mechanical properties in the stress-relieved condition: 28 HRC to 30 HRC, 850 MPa to 880 MPa, 930 MPa to 980 MPa, 18 % to 20 % for hardness, yield stress, UTS, and elongation after failure, respectively.
Powder particle size is strongly correlated with flowability and spreadability. Fine particles have low apparent densities and poor flowability due to increased adhesion and cohesion which leads to raking and uneven coverage during spreading. Despite the poor performance of the Fine powder compared to the Coarse powder, the density, hardness, and strength were indistinguishable.
Investigating the effects of different attributes of the PSD on performance requires tighter control over morphology, PSD shape, and chemistry in order to isolate individual variables. Efforts to produce a variety of PSDs from a single powder batch or lot would be highly valuable for studying the effects of size and the distribution shape.
Lastly, a reduction in tensile yield stress and UTS was observed for parts near the gas flow nozzle for all three powder types. This was beyond the scope of this study, but it should be investigated further.
Highlights:
Moderate changes in the size lead to significant changes in powder performance
Static mechanical properties are robust against moderate changes in particle size
Better control of powder is required to precisely know the effects of particle size
Acknowledgements
We would like to thank Dr. Bill Luecke for helpful discussions and assistance with tensile testing. We are also grateful for Dr. Stephanie Watson for helpful discussions about He pycnometer measurements. The XRD measurements were performed at the Center for Nanoscale Technology user facility at NIST. EBSD measurements were performed in the Materials Measurement Lab Microscopy Facility at NIST.
Appendix A
Table A1.
EBSD quantitative results. Radius is determined from the equivalent circular area. The 5th, 50th, and 95th percentiles come from the empirical cumulative distribution function. The coefficient of variation (CV) was determined from four scans on the Medium Y sample. The number of points updated or cleaned up during data processing was less than or equal to 2%. Entries in bold text are significantly different than their group based on the CV.
| Z - plane | Y - plane | ||||||
|---|---|---|---|---|---|---|---|
| Fine | Medium | Coarse | Fine | Medium | Coarse | CV | |
| Area weighted avg. radius (μm) | 25.8 | 14.9 | 15.4 | 25.4 | 22.3 | 19.2 | 11 % |
| Radius 5 % (μm) | 1.5 | 1.4 | 1.4 | 1.5 | 1.5 | 1.5 | 3 % |
| Radius 50 % (μm) | 3.7 | 4.1 | 3.6 | 5.9 | 6.4 | 4.8 | 5 % |
| Radius 95 % (μm) | 22.5 | 16.7 | 15.6 | 23.5 | 25.7 | 19.9 | 12 % |
| Aspect ratio 5 % (μm/μm) | 1.4 | 1.3 | 1.4 | 1.6 | 1.5 | 1.6 | 6 % |
| Aspect ratio 50 % (μm/μm) | 3.3 | 3.5 | 3.3 | 5.5 | 5.3 | 5.2 | 6 % |
| Aspect ratio 95 % (μm/μm) | 18.5 | 15.9 | 14.8 | 67.5 | 35.1 | 35.7 | 17 % |
| Texture index | 1.60 | 1.31 | 1.25 | 1.61 | 1.20 | 1.32 | 7 % |
| Entropy of ODF | −0.25 | −0.13 | −0.11 | −0.26 | −0.09 | −0.15 | 38 % |
| Number of grains | 505 | 801 | 986 | 352 | 365 | 525 | n/a |
| Avg. points per grain | 627 | 379 | 326 | 894 | 879 | 581 | n/a |
| Non-indexed (%) | 1 | 2 | 1 | 1 | 3 | 1 | n/a |
| Cleaned up (%) | 1 | 2 | 1 | 1 | 1 | 1 | n/a |
Appendix B
Table B1.
Tensile properties of wrought bar from MMPDS-01 design handbook [75] and OEM LPBF 17-4 stainless steel produced using OEM1 powder from the OEM material data sheet [76]. Elongation measured in this study is elongation after failure.
| Property | Wrought H900 | Wrought H1150 | OEM As-built | OEM H900 | Fine Stress-relieved | Medium Stress-relieved | Coarse Stress-relieved |
|---|---|---|---|---|---|---|---|
| Yield Stress (MPa) | 1172 | 690 | 861 ± 76 | 1235 ± 10 | 853 ± 12 | 880 ± 10 | 848 ± 13 |
| Ultimate Tensile Stress (MPa) | 1310 | 862 | 886 ± 70 | 1336 ± 5 | 930 ± 9 | 978 ± 5 | 927 ± 8 |
| Elongation (%) | 10.0 | 16.0 | 19.9 ± 1.2 | 14.0 ± 0.8 | 18.3 ± 0.4 | 19.3 ± 0.4 | 19.7 ± 0.6 |
Footnotes
Certain commercial equipment, instruments, or materials are identified in this paper in order to specify the experimental procedure adequately. Such identification is not intended to imply recommendation or endorsement by NIST, nor is it intended to imply that the materials or equipment identified are necessarily the best available for the purpose.
References
- [1].Slotwinski JA, Garboczi EJ, Metrology needs for metal additive manufacturing powders, Jom 67(3) (2015) 538–543. [Google Scholar]
- [2].America Makes and ANSI Additive Manufacturing Standardization Collaborative, Standardization Roadmap for Additive Manufacturing. Version 2.0, 2018.
- [3].Vock S, Klöden B, Kirchner A, Weißgärber T, Kieback B, Powders for powder bed fusion: a review, Progress in Additive Manufacturing (2019) 1–15. [Google Scholar]
- [4].Sutton AT, Kriewall CS, Leu MC, Newkirk JW, Powders for additive manufacturing processes: Characterization techniques and effects on part properties, Solid Freeform Fabrication 1 (2016) 1004–1030. [Google Scholar]
- [5].Tan JH, Wong WLE, Dalgarno KW, An overview of powder granulometry on feedstock and part performance in the selective laser melting process, Additive Manufacturing 18 (2017) 228–255. [Google Scholar]
- [6].Anderson IE, White EMH, Dehoff R, Feedstock powder processing research needs for additive manufacturing development, Current Opinion in Solid State and Materials Science 22(1) (2018) 8–15. [Google Scholar]
- [7].Dowling L, Kennedy J, O’Shaughnessy S, Trimble D, A review of critical repeatability and reproducibility issues in powder bed fusion, Materials & Design 186 (2020) 108346. [Google Scholar]
- [8].Engeli R, Etter T, Hövel S, Wegener K, Processability of different IN738LC powder batches by selective laser melting, Journal of Materials Processing Technology 229 (2016) 484–491. [Google Scholar]
- [9].Baitimerov R, Lykov P, Zherebtsov D, Radionova L, Shultc A, Prashanth KG, Influence of powder characteristics on processability of AlSi12 alloy fabricated by selective laser melting, Materials 11(5) (2018) 742. [DOI] [PMC free article] [PubMed] [Google Scholar]
- [10].Slotwinski JA, Garboczi EJ, Stutzman PE, Ferraris CF, Watson SS, Peltz M.A.J.J.o.r.o.t.N.I.o.S., Technology, Characterization of metal powders used for additive manufacturing, 119 (2014) 460. [DOI] [PMC free article] [PubMed] [Google Scholar]
- [11].Spierings AB, Voegtlin M, Bauer T, Wegener K.J.P.i.A.M., Powder flowability characterisation methodology for powder-bed-based metal additive manufacturing, 1(1-2) (2016) 9–20. [Google Scholar]
- [12].Strondl A, Lyckfeldt O, Brodin H, Ackelid U, Characterization and control of powder properties for additive manufacturing, Jom 67(3) (2015) 549–554. [Google Scholar]
- [13].Snow Z, Martukanitz R, Joshi S, On the development of powder spreadability metrics and feedstock requirements for powder bed fusion additive manufacturing, Additive Manufacturing 28 (2019) 78–86. [Google Scholar]
- [14].Escano LI, Parab ND, Xiong L, Guo Q, Zhao C, Fezzaa K, Everhart W, Sun T, Chen L, Revealing particle-scale powder spreading dynamics in powder-bed-based additive manufacturing process by high-speed x-ray imaging, Scientific Reports 8(1) (2018) 15079. [DOI] [PMC free article] [PubMed] [Google Scholar]
- [15].Chen H, Wei Q, Zhang Y, Chen F, Shi Y, Yan W, Powder-spreading mechanisms in powder-bed-based additive manufacturing: Experiments and computational modeling, Acta Materialia 179 (2019) 158–171. [Google Scholar]
- [16].Wang L, Li EL, Shen H, Zou RP, Yu AB, Zhou ZY, Adhesion effects on spreading of metal powders in selective laser melting, Powder Technology 363 (2020) 602–610. [Google Scholar]
- [17].Pleass C, Jothi S, Influence of powder characteristics and additive manufacturing process parameters on the microstructure and mechanical behaviour of Inconel 625 fabricated by Selective Laser Melting, Additive Manufacturing 24 (2018) 419–431. [Google Scholar]
- [18].Gu H, Gong H, Dilip J.j.s., Pal D, Hicks A, Doak H, Stucker B, Effects of Powder Variation on the Microstructure and Tensile Strength of Ti6Al4V Parts Fabricated by Selective Laser Melting, 2014. [Google Scholar]
- [19].Spierings AB, Schneider M, Eggenberger RJRPJ, Comparison of density measurement techniques for additive manufactured metallic parts, 17(5) (2011) 380–386. [Google Scholar]
- [20].Sudbrack CK, Lerch BA, Smith TM, Locci IE, Ellis DL, Thompson AC, Richards B, Impact of powder variability on the microstructure and mechanical behavior of selective laser melted alloy 718, Proceedings of the 9th International Symposium on Superalloy 718 & Derivatives: Energy, Aerospace, and Industrial Applications, Springer, 2018, pp. 89–113. [Google Scholar]
- [21].Irrinki H, Jangam JSD, Pasebani S, Badwe S, Stitzel J, Kate K, Gulsoy O, Atre SV, Effects of particle characteristics on the microstructure and mechanical properties of 17-4 PH stainless steel fabricated by laser-powder bed fusion, Powder Technology 331 (2018) 192–203. [Google Scholar]
- [22].Kamath C, El-Dasher B, Gallegos GF, King WE, Sisto A, Density of additively-manufactured, 316L SS parts using laser powder-bed fusion at powers up to 400 W, The International Journal of Advanced Manufacturing Technology 74(1-4) (2014) 65–78. [Google Scholar]
- [23].Vasquez E, Giroux P-F, Lomello F, Nussbaum M, Maskrot H, Schuster F, Castany P, Effect of powder characteristics on production of oxide dispersion strengthened Fe14Cr steel by laser powder bed fusion, Powder Technology 360 (2020) 998–1005. [Google Scholar]
- [24].Simchi A, The role of particle size on the laser sintering of iron powder, Metallurgical and Materials Transactions B 35(5) (2004) 937–948. [Google Scholar]
- [25].Liu B, Wildman R, Tuck C, Ashcroft I, Hague R, Investigation the effect of particle size distribution on processing parameters optimisation in selective laser melting process, Additive manufacturing research group, Loughborough University (2011) 227–238. [Google Scholar]
- [26].Brika SE, Letenneur M, Dion CA, Brailovski V, Influence of particle morphology and size distribution on the powder flowability and laser powder bed fusion manufacturability of Ti-6A1-4V alloy, Additive Manufacturing 31 (2020) 100929. [Google Scholar]
- [27].Scipioni Bertoli U, Guss G, Wu S, Matthews MJ, Schoenung JM, In-situ characterization of laser-powder interaction and cooling rates through high-speed imaging of powder bed fusion additive manufacturing, Materials & Design 135 (2017) 385–396. [Google Scholar]
- [28].Bajaj P, Hariharan A, Kini A, Kürnsteiner P, Raabe D, Jägle EA, Steels in additive manufacturing: A review of their microstructure and properties, Materials Science and Engineering: A 772 (2020) 138633. [Google Scholar]
- [29].DebRoy T, Wei HL, Zuback JS, Mukherjee T, Elmer JW, Milewski JO, Beese AM, Wilson-Heid A, De A, Zhang W, Additive manufacturing of metallic components – Process, structure and properties, Progress in Materials Science 92 (2018) 112–224. [Google Scholar]
- [30].Zitelli C, Folgarait P, Di Schino A, Laser powder bed fusion of stainless steel grades: a review, Metals 9(7) (2019) 731. [Google Scholar]
- [31].Zai L, Zhang C, Wang Y, Guo W, Wellmann D, Tong X, Tian Y, Laser Powder Bed Fusion of Precipitation-Hardened Martensitic Stainless Steels: A Review, Metals 10(2) (2020) 255. [Google Scholar]
- [32].Clausen B, Brown DW, Carpenter JS, Clarke K, Clarke A, Vogel S, Bernardin J, Spernjak D, Thompson JJMS, A E, Deformation behavior of additively manufactured GP1 stainless steel, 696 (2017) 331–340. [Google Scholar]
- [33].Phan TQ, Kim FH, Pagan DC, Micromechanical response quantification using high-energy X-rays during phase transformations in additively manufactured 17-4 stainless steel, Materials Science and Engineering: A 759 (2019) 565–573. [Google Scholar]
- [34].Murr LE, Martinez E, Hernandez J, Collins S, Amato KN, Gaytan SM, Shindo P.W.J.J.o.M.R., Technology, Microstructures and properties of 17-4 PH stainless steel fabricated by selective laser melting, 1(3) (2012) 167–177. [Google Scholar]
- [35].Lass EA, Stoudt MR, Williams MEJM, A MT, Additively Manufactured Nitrogen-Atomized 17-4 PH Stainless Steel with Mechanical Properties Comparable to Wrought, 50(4) (2019) 1619–1624. [Google Scholar]
- [36].Meredith SD, Zuback JS, Keist JS, Palmer TA, Impact of composition on the heat treatment response of additively manufactured 17–4 PH grade stainless steel, Materials Science and Engineering: A 738 (2018) 44–56. [Google Scholar]
- [37].Luecke WE, Slotwinski JA, Mechanical properties of austenitic stainless steel made by additive manufacturing, Journal of research of the National Institute of Standards and Technology 119(2014)398. [DOI] [PMC free article] [PubMed] [Google Scholar]
- [38].Cheruvathur S, Lass EA, Campbell CE, Additive manufacturing of 17-4 PH stainless steel: post-processing heat treatment to achieve uniform reproducible microstructure, Jom 68(3) (2016) 930–942. [Google Scholar]
- [39].Pasebani S, Ghayoor M, Badwe S, Irrinki H, Atre SV, Effects of atomizing media and post processing on mechanical properties of 17-4 PH stainless steel manufactured via selective laser melting, Additive Manufacturing 22 (2018) 127–137. [Google Scholar]
- [40].Jacob G, Jacob G, Prediction of Solidification Phases in Cr-Ni Stainless Steel Alloys Manufactured by Laser Based Powder Bed Fusion Process, US Department of Commerce, National Institute of Standards and Technology; 2018. [Google Scholar]
- [41].Alnajjar M, Christien F, Wolski K, Bosch C, Evidence of austenite by-passing in a stainless steel obtained from laser melting additive manufacturing, Additive Manufacturing 25 (2019) 187–195. [Google Scholar]
- [42].Vunnam S, Saboo A, Sudbrack C, Starr TL, Effect of powder chemical composition on the as-built microstructure of 17-4 PH stainless steel processed by selective laser melting, Additive Manufacturing 30 (2019) 100876. [Google Scholar]
- [43].Auguste P, Mauduit A, Fouquet L, Pillot S, Study on 17-4 PH stainless steel produced by selective laser melting, UPB Sci. Bull. Ser. B-chem. Mater. Sci 80 (2018) 197–210. [Google Scholar]
- [44].Wright SI, Nowell MM, EBSD image quality mapping, Microscopy and microanalysis 12(1) (2006) 72–84. [DOI] [PubMed] [Google Scholar]
- [45].Kang J-Y, Do HK, Baik S-I, Ahn T-H, Kim Y-W, Han HN, Oh KH, Lee H-C, Han SH, Phase analysis of steels by grain-averaged EBSD functions, ISIJ international 51(1) (2011) 130–136. [Google Scholar]
- [46].Morsdorf L, Tasan CC, Ponge D, Raabe D, 3D structural and atomic-scale analysis of lath martensite: effect of the transformation sequence, Acta Materialia 95 (2015) 366–377. [Google Scholar]
- [47].Sun Y, Hebert RJ, Aindow M, Effect of heat treatments on microstructural evolution of additively manufactured and wrought 17-4PH stainless steel, Materials & Design 156 (2018) 429–440. [Google Scholar]
- [48].Whiting JG, Tondare VN, Scott JHJ, Phan TQ, Donmez MAJCA, Uncertainty of particle size measurements using dynamic image analysis, 68(1) (2019) 531–534. [Google Scholar]
- [49].Hu Z, Zhu H, Zhang H, Zeng X, Experimental investigation on selective laser melting of 17-4PH stainless steel, Optics & Laser Technology 87 (2017) 17–25. [Google Scholar]
- [50].Irrinki H, Nath SD, Alhofors M, Stitzel J, Gulsoy O, Atre S.V.J.J.o.t.A.C.S., Microstructures, properties, and applications of laser sintered 17-4PH stainless steel, 102(9) (2019) 5679–5690. [Google Scholar]
- [51].Lyassami M, Shahriari D, Ben Fredj E, Morin J-B, Jahazi M, Numerical simulation of water quenching of large size steel forgings: Effects of macrosegregation and grain size on phase distribution, Journal of Manufacturing and Materials Processing 2(2) (2018) 34. [Google Scholar]
- [52].Standard Specification for Hot-Rolled and Cold-Finished Age-Hardening Stainless Steel Bars and Shapes.
- [53].ASTM International, B527-15: Standard Test Method for Tap Density of Metal Powders and Compounds, (2015).
- [54].Standard Test Methods for Flow Rate of Metal Powders Using the Hall Flowmeter Funnel.
- [55].Vlachos N, Chang IT, Investigation of flow properties of metal powders from narrow particle size distribution to polydisperse mixtures through an improved Hall-flowmeter, Powder technology 205(1-3) (2011) 71–80. [Google Scholar]
- [56].Mindt H, Megahed M, Lavery N, Holmes M, Brown S, Powder bed layer characteristics: the overseen first-order process input, Metall and Mat Trans A 47(8) (2016) 3811–3822. [Google Scholar]
- [57].Mahmoodkhani Y, Ali U, Shahabad SI, Kasinathan AR, Esmaeilizadeh R, Keshavarzkermani A, Marzbanrad E, Toyserkani E, On the measurement of effective powder layer thickness in laser powder-bed fusion additive manufacturing of metals, Progress in Additive Manufacturing 4(2) (2019) 109–116. [Google Scholar]
- [58].Wischeropp TM, Emmelmann C, Brandt M, Pateras A, Measurement of actual powder layer height and packing density in a single layer in selective laser melting, Additive Manufacturing 28 (2019) 176–183. [Google Scholar]
- [59].Kok Y, Tan XP, Wang P, Nai MLS, Loh NH, Liu E, Tor SB, Anisotropy and heterogeneity of microstructure and mechanical properties in metal additive manufacturing: A critical review, Materials & Design 139 (2018) 565–586. [Google Scholar]
- [60].ASTM International, Standard Test Methods for Tension Testing of Metallic Materials, E9-09, West Conshohocken, PA, 2013. [Google Scholar]
- [61].ASTM International, ASTM E18-19, Standard Test Methods for Rockwell Hardness of Metallic Materials, West Conshohocken, PA, 2019. [Google Scholar]
- [62].Bachmann F, Hielscher R, Schaeben H, Texture analysis with MTEX–free and open source software toolbox, Solid State Phenomena, Trans Tech Publ, 2010, pp. 63–68. [Google Scholar]
- [63].Mainprice D, Bachmann F, Hielscher R, Schaeben HJGS, London, Special Publications, Descriptive tools for the analysis of texture projects with large datasets using MTEX: strength, symmetry and components, 409(1) (2015) 251–271. [Google Scholar]
- [64].Hielscher R, Schaeben H.J.J.o.A.C., A novel pole figure inversion method: specification of the MTEX algorithm, 41(6) (2008) 1024–1037. [Google Scholar]
- [65].Hielscher R, Schaeben H, Chateigner D.J.J.o.A.C., On the entropy to texture index relationship in quantitative texture analysis, 40(2) (2007) 371–375. [Google Scholar]
- [66].Schindelin J, Arganda-Carreras I, Frise E, Kaynig V, Longair M, Pietzsch T, Preibisch S, Rueden C, Saalfeld S, Schmid B, Fiji: an open-source platform for biological-image analysis, Nature methods 9(7) (2012) 676–682. [DOI] [PMC free article] [PubMed] [Google Scholar]
- [67].Schade CT, Murphy TF, Walton C, Development of atomized powders for additive manufacturing, Powder Metallurgy Word Congress, Accessed on 2nd July, 2014.
- [68].Lefebvre L, Whiting J, Nijikovsky B, Brika S, Fayazfar H, Lyckfeldt O, Assessing the Robustness of Powder Rheology and Permeability Measurements, Additive Manufacturing (2020)101203. [Google Scholar]
- [69].Madian A, Leturia M, Ablitzer C, Matheron P, Bernard-Granger G, Saleh K, Impact of fine particles on the rheological properties of uranium dioxide powders, Nuclear Engineering and Technology (2020). [Google Scholar]
- [70].de Terris T, Andreau O, Peyre P, Adamski F, Koutiri I, Gorny C, Dupuy CJAM, Optimization and comparison of porosity rate measurement methods of Selective Laser Melted metallic parts, (2019). [Google Scholar]
- [71].Meier C, Weissbach R, Weinberg J, Wall WA, John Hart A, Modeling and characterization of cohesion in fine metal powders with a focus on additive manufacturing process simulations, Powder Technology 343 (2019) 855–866. [Google Scholar]
- [72].Meier C, Weissbach R, Weinberg J, Wall WA, Hart AJ, Critical influences of particle size and adhesion on the powder layer uniformity in metal additive manufacturing, Journal of Materials Processing Technology 266 (2019) 484–501. [Google Scholar]
- [73].Muñiz-Lerma JA, Nommeots-Nomm A, Waters KE, Brochu M, A Comprehensive Approach to Powder Feedstock Characterization for Powder Bed Fusion Additive Manufacturing: A Case Study on AlSi7Mg, Materials 11(12) (2018) 2386. [DOI] [PMC free article] [PubMed] [Google Scholar]
- [74].Murayama M, Hono K, Katayama Y, Microstructural evolution in a 17-4 PH stainless steel after aging at 400 °C, Metall and Mat Trans A 30(2) (1999) 345–353. [Google Scholar]
- [75].DOT/FAA/AR-MMPDS-01, Metallic Materials Properties Development and Standardization (MMPDS), Federal Aviation Administration; Washington, DC, 2003. [Google Scholar]
- [76].EOS GmbH Electro Optical Systems, Industry Line EOS StainlessSteel 17-4PH. https://www.eos.info/03_system-related-assets/material-related-contents/metal-materials-and-examples/metal-material-datasheet/werkzeugstahl_ms1_cx/material_datasheet_industryline_17-4ph_en_screen.pdf. (Accessed 12/10/2020.


