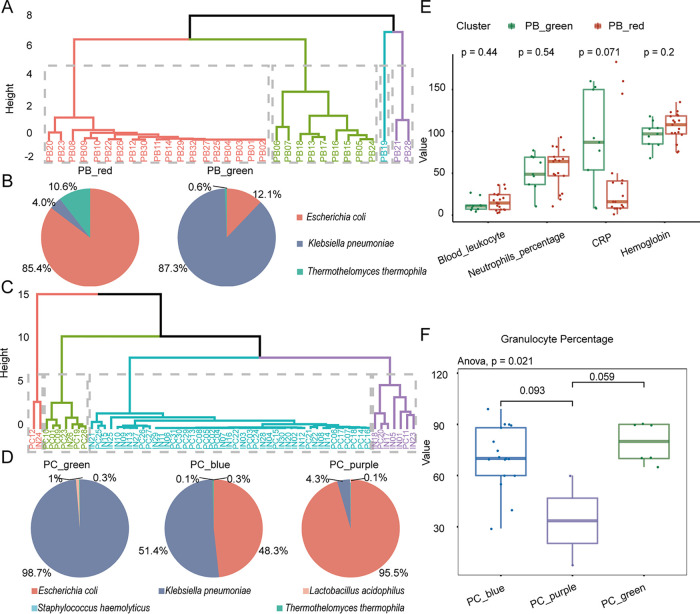
FIG 4.
The candidate microbiota can reflect the inflammatory status and infection degree. (A) Four subsets (PB_red, PB_green, PB_blue, and PB_purple) clustered by the k-means method based on candidate microbiota in patient blood. (B) Pie chart showing the dynamic distribution pattern of candidate microbiota for each subgroup in panel A. (C) Four subsets (PC_red, PC_green, PC_blue, and PC_purple) clustered by the k-means method based on candidate microbiota in patient CSF. (D) Pie chart showing the dynamic distribution pattern of the target microbiome. (E) PB_green, with a predominance of Klebsiella pneumoniae, had higher CRP in blood than PB_red. (F) The proportion of granulocytes was significantly different in PC_blue, PC_green, and PC_purple (P = 0.021, annova.test), and patients with a predominance of Klebsiella pneumoniae (PC_green and PC_blue, panel D, left and middle) had a higher proportion of granulocytes in their CSF than those (PC_purple, panel D, right) with a predominance of Escherichia coli. Note that the Wilcoxon test was used for comparison between the two groups.

